
Abstract
Long noncoding RNAs (lncRNAs) have been discovered to play a key role in adipogenesis, while the role of lncRNA human leukocyte antigen complex group 11 (HCG11) in adipocyte differentiation has not been studied clearly. We used human adipose-derived mesenchymal stem cells (hAdMSCs) to establish a model of cell differentiation in vitro and found that expression of lncRNA HCG11 was decreased during adipogenesis through real-time quantitative polymerase chain reaction analysis. Then, hAdMSCs were transfected with pcDNA-HCG11 or HCG11-shRNA (sh-HCG11); the adipogenic marker proteins were detected by Western blot, and the activity of lipogenesis enzymes was detected by spectrophotometry. The expression of CCAAT-enhancer-binding protein α, fatty acid-binding protein, peroxisome proliferator-activated receptor gamma 2 and the levels of acetyl coenzyme A carboxylase and fatty acid synthase FAS were significantly downregulated in hAdMSCs at different stages transfected with pcDNA-HCG11, while knockdown of lncRNA HCG11 promoted adipocyte differentiation. Bioinformatic analysis indicated that miR-204-5p was a potential target gene of HCG11, which was confirmed by luciferase reporter gene analysis and RNA pull-down analysis. In addition, miR-204-5p directly targeting the 3′-untranslated region of SIRT1 was also predicted by StarBase and verified by luciferase reporter gene analysis. Enforced expression of miR-204-5p negatively regulated the SIRT1 protein level. Furthermore, SIRT1 overexpression significantly inhibited adipogenic marker protein, levels of lipogenesis enzymes, and the proliferation of hAdMSCs. When pcDNA-HCG11 and miR-204-5p mimic were co-transfected into hAdMSCs, we found that the miR-204-5p mimic reversed the suppressor effect of pcDNA-HCG11. Taken together, we found that HCG11 negatively regulated cell proliferation and adipogenesis by the miR-204-5p/SIRT1 axis. Our findings might provide a new target for the study of adipogenesis in hAdMSCs and obesity.
Introduction
Obesity was a chronic inflammatory state, accompanied by elevated levels of plasma inflammatory factors, such as tumor necrosis factor (TNF), interleukin-6 (IL-6), and C-reactive protein 1 . Obesity was caused by excessive hypertrophy and increased number of fat cells 2 . Adipogenesis was a process in which fibroblast-like preadipocytes differentiate into mature, lipid filled, and insulin-sensitive adipocytes. Adipose tissue cell differentiation went through two stages. The first stage was the directional transformation of mesenchymal cells into adipocytes, and the second stage was the differentiation of preadipocytes into mature adipocytes 3 . Induced by insulin, glucocorticoids, and intracellular cyclic adenosine monophosphate, preadipocytes had four processes: the contact inhibition phase, the mitotic clone expansion phase, the middle differentiation phase, and the end differentiation phase.
With the continuous improvement of people’s living standards, the occurrence of obesity and related metabolic diseases has become one of the important factors that endanger human health 4,5 . Studies have shown that excessive accumulation of triglyceride content in fat cells may cause obesity, which increased the risk of many diseases such as insulin resistance 6,7 , type 2 diabetes 8 , cardiovascular disease 9 , and hypertension 10 . The formation and maturation of adipocytes required the sequential expression of a large number of genes at different developmental stages, and a variety of biological processes were involved. At the same time, adipose tissue secreted a large number of adipokines through autocrine, paracrine, and endocrine methods to affect a series of biological activities of the entire body 11,12 .
Adipose tissue is a dynamic organ and its expansion is controlled by the process of adipogenesis. With high-throughput sequencing technology, recent studies have shown that long noncoding RNAs (lncRNAs) were involved in adipogenesis, such as Blnc1 13 and lncBATE10 14 , and vital in regulating adipose development. Furthermore, based on the location of lncRNAs in protein-coding genes, lncRNAs could be classified into subclasses, including sense, antisense, bidirectional, intronic, and intergenic 15 . LncRNAs were involved in various cellular processes, such as proliferation 16 , apoptosis 17 , differentiation, and inflammation 18 .
In recent years, more and more studies have found that lncRNAs can regulate the adipocyte differentiation 18,19 . For example, lncRNA steroid receptor RNA activator affected adipogenesis by binding to the promoter region of peroxisome proliferator-activated receptor gamma (PPARγ) and promoting its transcription 20 . Gene expression profiling analysis on undifferentiated preadipocytes and mature adipocytes was used to further study the function of lncRNAs. After comparison, the researchers obtained 175 lncRNAs that changed during differentiation, and some of these lncRNAs were highly expressed in adipose tissue. These 20 lncRNAs, which played an important role in the differentiation process, were obtained according to their upregulation levels and the application of siRNA technology. They were called lncRNAs regulated in adipogenesis (lncRAPs) 21 . These studies provided evidences for the key role of lncRNAs in adipocyte differentiation. LncRNA human leukocyte antigen complex group 11 (HCG11) has been demonstrated to participate in the regulation of progression and prognosis in glioma 22 . In addition, downregulation of lncRNA HCG11 in prostate cancer was associated with poor prognosis 23 , and HCG11 regulated its target protein insulin-like growth factor 2 mRNA-binding protein 1 (IGF2BP1). These suggested that HCG11 was involved in embryo development and cell differentiation. However, the detailed function and regulatory mechanism of HCG11 in cell progression of obesity have not been fully illustrated.
In our preliminary study, we induced human adipose-derived mesenchymal stem cells (hAdMSCs) to differentiate into mature adipocytes and detected the relevant differentiation of proteins and enzymes at different stages of differentiation. The results showed that the expression of lncRNA HCG11 gradually decreased in cell differentiation. We have constructed hAdMSCs that overexpress or knockdown lncRNA HCG11 to induce differentiation. Experimental data showed that overexpression of lncRNA HCG11 inhibited adipocyte differentiation, and knockdown of lncRNA HCG11 promoted adipocyte differentiation. These data also showed that lncRNA HCG11 was a negative regulator of adipocyte differentiation. Then, we further studied the molecular mechanism of lncRNA HCG11 negatively regulating adipocyte differentiation in hAdMSCs.
Materials and Methods
Cell Culture and Differentiation of hAdMSCs
Human embryonic kidney 293T (HEK-293T) cells (Shanghai, China) and hAdMSCs (Procell, Wuhan, Hubei, China) were resuspended in Dulbecco’s modified Eagle medium (Thermo Fisher Scientific, Waltham, MA, USA) mixture supplemented with 10% fetal bovine serum (FBS, GIBCO, Carlsbad, CA, USA), 100 U/ml penicillin, and 100 μg/ml streptomycin (Thermo Fisher Scientific) in a humidified incubator containing 5% carbon dioxide (CO2) at 37 °C. hAdMSCs at passage five were grown for 2 days, followed by differentiation into adipocyte. For adipogenic differentiation, hAdMSCs were induced using the StemPro Adipogenesis differentiation kit media. The differentiation medium was subsequently changed every 3 days. After several days, Oil Red O staining was performed to detect the adipogenic differentiation of hAdMSCs.
Oil Red O Staining
The cellular lipid content was assessed by Oil Red O staining (Sigma, St. Louis, MO, USA). On day 12, cells were washed and then fixed in 4% formalin for 1 h, stained with Oil Red O working solution, and incubated for another 1 h at room temperature. After being washed twice with phosphate-buffered saline (PBS), the cells were photographed by a light microscope (Olympus, Tokyo, Japan).
Cell Transfection
To overexpress HCG11, HCG11 genomic fragment was cloned by polymerase chain reaction (PCR) and then inserted into the pcDNA3.1 vector. Cells were plated in six-well plates, at about 70% confluence, and then transfected transiently with miR-204-3p mimic, miR-204-5p inhibitor, or their negative control (NC) following the manufacturer’s instructions. pGPU6/GFP/Neo vector (Gene Pharma, Shanghai, China) was used to construct a vector with short hairpin RNA (shRNA) against HCG11 and the nontargeting sequences (scrambled shRNA). After transfection, the cells were cultured in a serum-free medium for 6 h. Then, the complete medium containing FBS was replaced to continue the culture.
RNA Extraction and Real-Time Quantitative PCR (RT-qPCR) Analysis
Total RNA of hAdMSCs was extracted in accordance with the instruction of Trizol reagent (Thermo Fisher Scientific). The reverse transcription of mRNA was performed using the high-capacity complementary DNA (cDNA) Reverse Transcription Kit (Thermo Fisher Scientific). The mRNA level was quantified by RT-qPCR using SYBR Premix Ex Taq (TaKaRa Biotech, Dalian, Liaoning, China), and
Cell Proliferation Assay
Cell counting kit-8 (CCK-8, Dojindo, Kumamoto, Japan) method was used to measure cell proliferation. First, cells were grown at 2 × 10³ cells in 96-well plates, and then the cell proliferation efficiency was measured at 24, 48, 72, and 96 h. CCK-8 (8 μl) and FBS-free medium (100 μl) were added into 96-well plates; cells were incubated in a humidified incubator containing 5% CO2 at 37 °C for 4 h, and the absorbances were read at 450 nm.
Luciferase Reporter Gene Assay
Target gene analysis was performed using the online database of StarBase biological prediction website (http://starbase.sysu.edu.cn/). The full length of the 3′-untranslated region (3′-UTR) of SIRTI or HCG11 was amplified, and then the PCR product was cloned into the polyclonal loci downstream of the pmir-GLO luciferase gene (Promega, Madison, WI, USA). The plasmids were co-transfected into HEK-293T cells (Shanghai, China), and the luciferase activity was measured using a Synergy 2 Multi-detection Microplate Reader (BioTek Instruments, Inc., USA). The experiment was independently repeated three times. Data were normalized for transfection efficiency by dividing firefly luciferase activity from Renilla luciferase activity.
Western Blot Analysis
The hAdMSCs were washed twice with PBS and lysed using radioimmunoprecipitation assay lysis buffer (CW Biotech, Beijing, China). Protein concentration was measured by bicinchoninic acid kit (KeyGEN, Nanjing, Jiangsu, China) and adjusted to 3 μg/µl prior to conducting Western blot. Boiled proteins (10 μl) per well with 5× loading buffer (Beyotime Biotechnology, Shanghai, China) were separated in 12% sodium dodecyl sulfate-polyacrylamide gel electrophoresis at 70 V for 20 min and 100 V for 100 min. Samples were then transferred to polyvinylidene difluoride membranes (Millipore, Bedford, MA, USA) at 350 mA for 105 min. Then, the membranes were blocked with 5% nonfat milk for 2 h and incubated with primary antibodies. The following antibodies were, respectively, used to incubate with the membranes at 4 °C overnight: rabbit fatty acid-binding protein (FABP4) antibody (1:600 dilution, ab92501, Abcam, Cambridge, UK), rabbit peroxisome proliferator-activated receptor gamma (PPARγ) antibody (1:500 dilution, ab45036, Abcam), rabbit adiponectin (AdipoQ) antibody (1:400 dilution, ab3455, Abcam), rabbit CCAAT-enhancer-binding protein α (C/EBPα) antibody (1:500 dilution, ab40764, Abcam), rabbit lipoprotein lipase (LPL) antibody (1:300 dilution, ab247525, Abcam), rabbit interleukin-6 (IL-6) antibody (1:400 dilution, ab6672, Abcam), rabbit tumor necrosis factor-α (TNF-α) antibody (1:400 dilution, ab6671, Abcam), and rabbit SIRT1 antibody (1:500 dilution, ab189494, Abcam). GAPDH was set as the endogenous control. After washing three times with Tris-buffered saline with Tween 20, the secondary antibody (goat antirabbit immunoglobulin G, ab205718, Abcam) was, respectively, used to incubate with the membrane for 1 h at room temperature. The enhanced chemiluminescence system was used to show the banding of proteins, and the optical density of the protein bands was quantified using Image J software (National Institutes of Health, Bethesda, MD, USA). The experiment was performed three times to obtain a mean value. The relative expression level of the target gene was displayed as the fold change versus the control group.
RNA Pull-Down Assay
HEK-293T cells were transfected with biotinylated miRNA (200 nM) for 24 h. The cells were gently washed twice with PBS and lysed by using ice-cold RNA pull-down lysis buffer on ice for 10 min. The lysate obtained in the previous step was centrifuged, and the supernatant was aliquoted into 50 µl for subsequent input research. Streptavidin magnetic beads (Thermo Scientific Fisher Scientific) were added to the remaining lysate and incubated at room temperature. Then RNase-free bovine serum albumin (Sigma) and yeast tRNA (Sigma) were added. The mixture was incubated at 4 °C for 3 h. In order to obtain a pure sample, the beads were washed with ice-cold lysis buffer and low-salt buffer for three times and finally washed with high-salt buffer. At last, TRIzol (Sigma) was used to purify the bound RNAs, and RT-qPCR was used to analyze the expression of HCG11.
Levels of Lipogenesis Enzymes were Detected by Spectrophotometry
The cells were collected at different time points and then added the extract to ultrasonically break. After centrifuged at 4 °C, the supernatant was taken for detection. Then, the protein concentration of the supernatant was detected by the BCA protein content determination kit. The acetyl coenzyme A carboxylase (ACC) detection kit (BC0410) and fatty acid synthase (FAS) activity detection kit (BC0550) were purchased from Solarbio. After preheating the spectrophotometer, adjusted the zero with distilled water. The samples and the reaction reagents were added as referred to in the test kit. The absorbance value was measured and recorded at the wavelength of 660 nm to calculate the ACC activity and at 340 nm to calculate the FAS activity. The amount of 1 μmol of inorganic phosphorus produced/mg of tissue protein/h is an ACC activity unit and oxidized 1 μmol NADPH/mg of protein/min at 37 °C is 1 U FAS.
Statistical Analysis
Data analysis was performed with SPSS version 22.0 software. Each measurement was obtained from at least triple experiments and expressed as the mean ± SEM. Statistical significance difference was set at P < 0.05 using one-way variation analysis followed by Student’s t-test.
Results
Establishment of hAdMSCs Induced Differentiation Model In Vitro
After hAdMSCs were cultured to 100%, the cells were continued to culture and then drew from the growth cycle and maintained in contact-inhibited state for 2 days. The steps described in the experimental methods were followed to induce differentiation and establish a model of hAdMSC differentiation in vitro. The cells on day 12 of differentiation were collected for Oil red O staining, and lipid droplets were observed under a light microscope to identify the degree of adipocyte differentiation. The cells on days 0, 3, 6, 9, and 12 of the differentiation processes were collected. Compared with preadipocytes, differentiation of hAdMSCs showed lipid droplets in the cytoplasm on day 12, and the adipocyte differentiation rate was close to 80%. Moreover, the expression of adipogenic marker proteins was detected by Western blot (Fig. 1A). With the induction and differentiation of adipocytes, the expression of the transcription factor C/EBPα (Fig. 1B) increased sharply on the third day of the test, while the transcription factor PPARγ2 (Fig. 1C) continued to increase. Expression of AdipoQ (Fig. 1D) was also first increased and then decreased, while the expression of FABP4 (Fig. 1E) and LPL (Fig. 1F) continued to increase. Then the levels of lipogenesis enzymes were detected by spectrophotometry, and the activity of ACC and FAS was increased (Fig. 1G, H). These results proved that adipocyte differentiation was induced successfully. The expression of HCG11 in hAdMSCs was significantly decreased (Fig. 1I) in different test days and gradually decreased with the increase of test days. These results demonstrated that the downregulation of HCG11 might associate with adipocyte differentiation in hAdMSCs.

Identification of a model that induced hAdMSCs to adipocytes differentiation. (A) Expression of adipogenic marker proteins in different stages (D0, D3, D6, D9, and D12) was detected by Western blot, and GAPDH was used as a loading control in each sample. Expression of (B) C/EBPα, (C) PPARγ2, (D) AdipoQ, (E) FABP4, and (F) LPL were quantified using Image J software. The levels of lipogenesis enzymes, such as (G) ACC and (H) FAS were detected by spectrophotometry. (I) Expression of HCG11 in different stages (D0, D3, D6, D9, and D12) was detected by RT-qPCR. Statistical significance was determined using an independent sample t-test. Values were expressed as mean ± SEM, n = 3. **P < 0.01 and ***P < 0.001 versus D0. ACC: acetyl coenzyme A carboxylase; AdipoQ: adiponectin; C/EBPα: CCAAT-enhancer-binding protein α; FABP4: fatty acid-binding protein 4; FAS: fatty acid synthase; GAPDH: glyceraldehyde-3-phosphate dehydrogenase; hAdMSCs: human adipose-derived mesenchymal stem cells; HCG11: human leukocyte antigen complex group 11; LPL: lipoprotein lipase; PPARγ: peroxisome proliferator-activated receptor gamma; RT-qPCR: real-time quantitative polymerase chain reaction.
HCG11 Overexpression Inhibited Adipocyte Differentiation in hAdMSCs
To investigate the function of HCG11 in adipocyte differentiation, HCG11 was overexpressed in hAdMSCs. The cells transfected with pcDNA-HCG11 (3 μg/mL) were collected for Oil red O staining on day 12 of differentiation, and lipid droplets were observed under a light microscope to identify the degree of adipocyte differentiation. HCG11 overexpression was achieved by transfecting the pcDNA-HCG11 into hAdMSCs, and its transfection efficiency was detected by RT-qPCR (Fig. 2A). Then, the expression of adipogenic marker proteins was detected by Western blot (Fig. 2B). With the induction and differentiation of adipocytes, the expression of transcription factors C/EBPα (Fig. 2C), PPARγ2 (Fig. 2D), AdipoQ (Fig. 2E), FABP4 (Fig. 2F), and LPL (Fig. 2G) was decreased in hAdMSCs transfected with pcDNA-HCG11. The levels of lipogenesis enzymes were detected by spectrophotometry; the activity of ACC and FAS was decreased in hAdMSCs transfected with pcDNA-HCG11 (Fig. 2H, I), which proved that HCG11 overexpression inhibited adipocyte differentiation in hAdMSCs.

Differentiation of adipocytes overexpressing lncRNA HCG11. (A) Expression of HCG11 in different stages (D0, D6, and D12) of hAdMSCs transfected with pcDNA-HCG11 was detected by RT-qPCR. (B) Expression of adipogenic marker protein was detected by Western blot, and GAPDH was used as a loading control in each sample. The expression of (C) C/EBPα, (D) PPARγ2, (E) AdipoQ, (F) FABP4, and (G) LPL in different stages (D0, D6, and D12) of hAdMSCs transfected with pcDNA-HCG11 and control was quantified using Image J software. The levels of lipogenesis enzymes such as (H) ACC and (I) FAS were detected by spectrophotometry. Statistical significance was determined using an independent sample t-test. Values were expressed as mean ± SEM, n = 3. *P < 0.05 and **P < 0.01 versus control; # P < 0.05 and ## P < 0.01 versus vector. ACC: acetyl coenzyme A carboxylase; AdipoQ: adiponectin; C/EBPα: CCAAT-enhancer-binding protein α; FABP4: fatty acid-binding protein 4; FAS: fatty acid synthase; GAPDH: glyceraldehyde-3-phosphate dehydrogenase; hAdMSCs: human adipose-derived mesenchymal stem cells; HCG11: human leukocyte antigen complex group 11; LPL: lipoprotein lipase; PPARγ: peroxisome proliferator-activated receptor gamma; RT-qPCR: real-time quantitative polymerase chain reaction.
Downregulation of HCG11 Promoted Adipocyte Differentiation in hAdMSCs
To further determine the potential role of HCG11 in adipocyte differentiation, we transfected short hairpin RNA (shRNA) against HCG11 (5 μg/mL) into hAdMSCs. The cells were collected for Oil red O staining on day 12 of differentiation, and lipid droplets were observed under a light microscope to identify the degree of adipocyte differentiation. The cells were collected on days 0, 6, and 12 of the differentiation processes to detect the expression of HCG11 (Fig. 3A) and adipogenic marker proteins (Fig. 3B). The result was as expected; expression of HCG11 was downregulated in hAdMSCs transfected with shRNA against HCG11 (Fig. 3A). The expression of transcription factors C/EBPα (Fig. 3C), PPARγ2 (Fig. 3D), AdipoQ (Fig. 3E), FABP4 (Fig. 3F), and LPL (Fig. 3G) was increased in hAdMSCs transfected with shRNA against HCG11 compared with control or transfected with the empty vector. The levels of lipogenesis enzymes were detected by spectrophotometry; the activity of ACC and FAS was increased in hAdMSCs transfected with shRNA against HCG11 (Fig. 3 H, I). It was revealed that knockdown of HCG11 effectively promoted the differentiation of adipocytes and accelerated the rate of adipocyte differentiation in hAdMSCs.
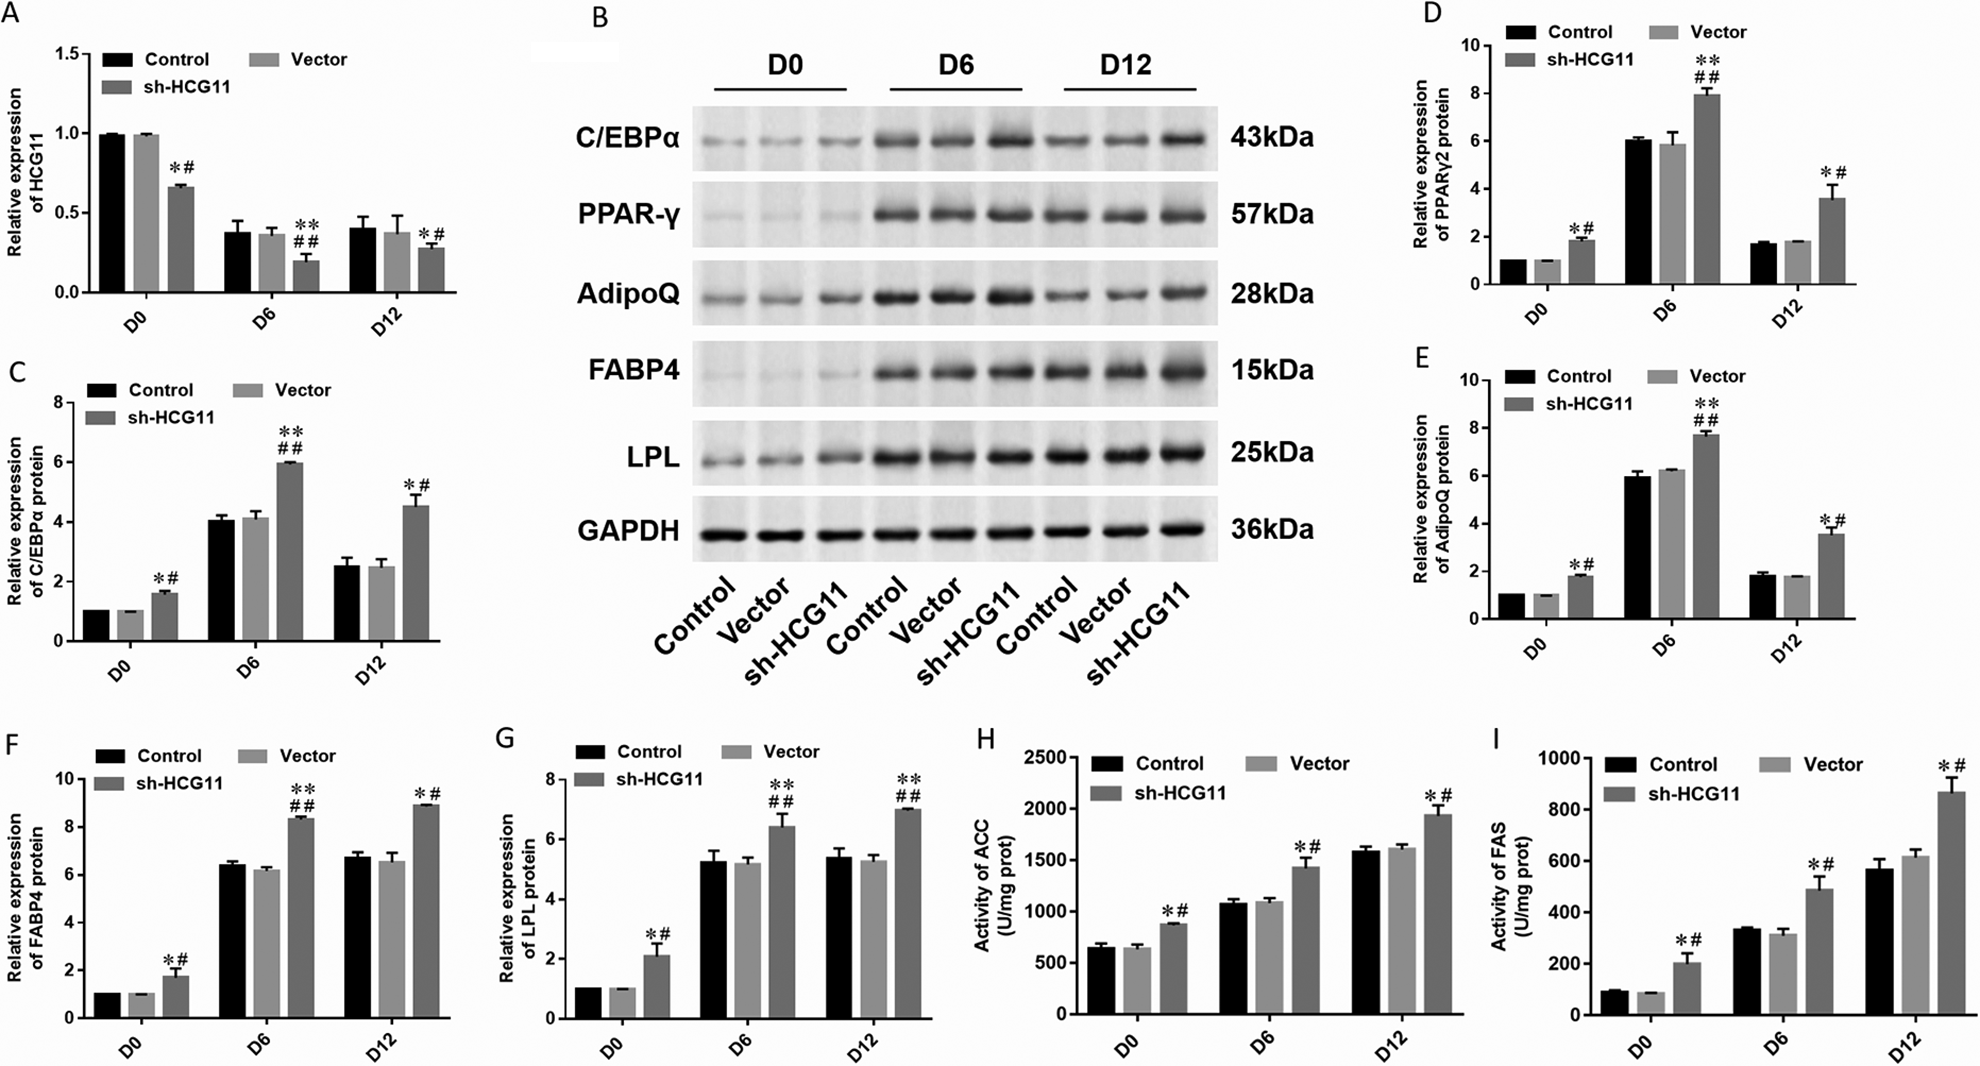
Differentiation of adipocytes interfering with sh-HCG11. (A) Expression of HCG11 in different stages (D0, D6, and D12) hAdMSCs transfected with sh-HCG11 was detected by RT-qPCR. (B) Expression of adipogenic marker protein such as (C) C/EBPα, (D) PPARγ2, (E) AdipoQ, (F) FABP4, and (G) LPL was detected by Western blot and quantified using Image J software. The levels of lipogenesis enzymes such as (H) ACC and (I) FAS were detected by spectrophotometry. Statistical significance was determined using an independent sample t-test. Values were expressed as mean ± SEM, n = 3. *P < 0.05 and **P < 0.01 versus control; # P < 0.05 and ## P < 0.01 versus vector. ACC: acetyl coenzyme A carboxylase; AdipoQ: adiponectin; C/EBPα: CCAAT-enhancer-binding protein α; FABP4: fatty acid-binding protein 4; FAS: fatty acid synthase; hAdMSCs: human adipose-derived mesenchymal stem cells; HCG11: human leukocyte antigen complex group 11; LPL: lipoprotein lipase; PPARγ: peroxisome proliferator-activated receptor gamma; RT-qPCR: real-time quantitative polymerase chain reaction.
MiR-204-5p was a Target of HCG11 in hAdMSCs
As is known to all, one of the most typical regulatory mechanisms of lncRNAs is served as ceRNAs or molecular sponges for miRNAs to negatively regulate the expression and activities of miRNAs. Bioinformatic analysis with online database of StarBase (http://starbase.sysu.edu.cn/) showed HCG11 directly bound to miR-204-5p (Fig. 4A). To validate the binding of HCG11 and miR-204-5p, we performed the luciferase reporter gene assay in HEK-293T cells. The results indicated that HCG11 was directly bound to miR-204-5p (Fig. 4B). HEK-293T cells were transfected with biotinylated miR-204-5p or its mutant form; then, the biotin-based pull-down assay was performed to detect HCG11 expression by RT-qPCR, and the results were normalized to biotinylated mimic control (Fig. 4C). Moreover, we detected the expression of miR-204-5p under different processing conditions by RT-qPCR analysis. It was found that miR-204-5p was significantly downregulated when HCG11 was overexpressed, and miR-204-5p was upregulated when cells were transfected with shRNA against HCG11 (Fig. 4D). These results demonstrated that HCG11 negatively modulated the expression of miR-204-5p and might serve as a molecular sponge.

HCG11 directly targeted to miR-204-5p. (A) Online database StarBase showed the binding sites of HCG11 and miR-204-5p. (B) The luciferase reporter gene assay was performed in HEK-293T cells to validate the binding of HCG11 and miR-204-5p. Firefly and Renilla luciferase activities were determined. (C) HEK-293T cells were transfected with biotinylated miR-204-5p (Bio-204-5p-wt) or its mutant form (Bio-204-5p-mut), and then a biotin-based pull-down assay was performed to detect HCG11 expression and normalized to a biotinylated mimic control (Bio-NC). (D) Expression of miR-204-5p in hAdMSCs transfected with pcDNA-HCG11 or sh-HCG11 was detected by RT-qPCR. Statistical significance was determined using an independent sample t-test. Values were expressed as mean ± SEM, n = 3. **P < 0.01 and ***P < 0.001 versus control; # P < 0.05 versus scramble. hAdMSCs: human adipose-derived mesenchymal stem cells; HCG11: human leukocyte antigen complex group 11; HEK-293T: human embryonic kidney 293T; RT-qPCR: real-time quantitative polymerase chain reaction.
MiR-204-5p Promoted Cell Proliferation and Inflammatory Factor Production in hAdMSCs
To study the effect of miR-204-5p on the biological function of adipocyte differentiation in hAdMSCs, we transfected miR-204-5p mimic, inhibitor, and corresponding NC oligonucleotides into hAdMSCs, respectively. First, we tested the expression of miR-204-5p after transfected with different oligonucleotides and found that the expression of miR-204-5p was significantly upregulated when hAdMSCs were transfected with miR-204-5p mimic, and miR-204-5p was downregulated when cells were transfected with miR-204-5p inhibitor (Fig. 5A). Then, the expression of adipogenic marker proteins was detected by Western blot (Fig. 5B). The results showed that the expression of different adipogenic marker proteins was significantly upregulated in hAdMSCs transfected with miR-204-5p mimic. While the expression of different adipogenic marker proteins was significantly downregulated in hAdMSCs transfected with miR-204-5p inhibitor (Fig. 5C–5G). Next, we examined the expression of important inflammatory factors such as IL-6 and TNF-α. The expression of IL-6 and TNF-α was also significantly upregulated in hAdMSCs transfected with miR-204-5p mimic, while the expression of IL-6 and TNF-α was significantly downregulated in hAdMSCs transfected with miR-204-5p inhibitor (Fig. 5 H, I). The levels of lipogenesis enzymes were detected by spectrophotometry; the activity of ACC and FAS was increased in hAdMSCs transfected with miR-204-5p mimic and downregulated in hAdMSCs transfected with miR-204-5p inhibitor (Fig. 5 J, K). Moreover, we examined the effect of miR-204-5p on the proliferation of hAdMSCs. The CCK-8 assay detected that upregulation of miR-204-5p significantly promoted cell growth in hAdMSCs, while the downregulation of miR-204-5p decreased cell proliferation (Fig. 5 L). These results indicated that miR-204-5p promoted cell proliferation and inflammatory factor production in hAdMSCs.
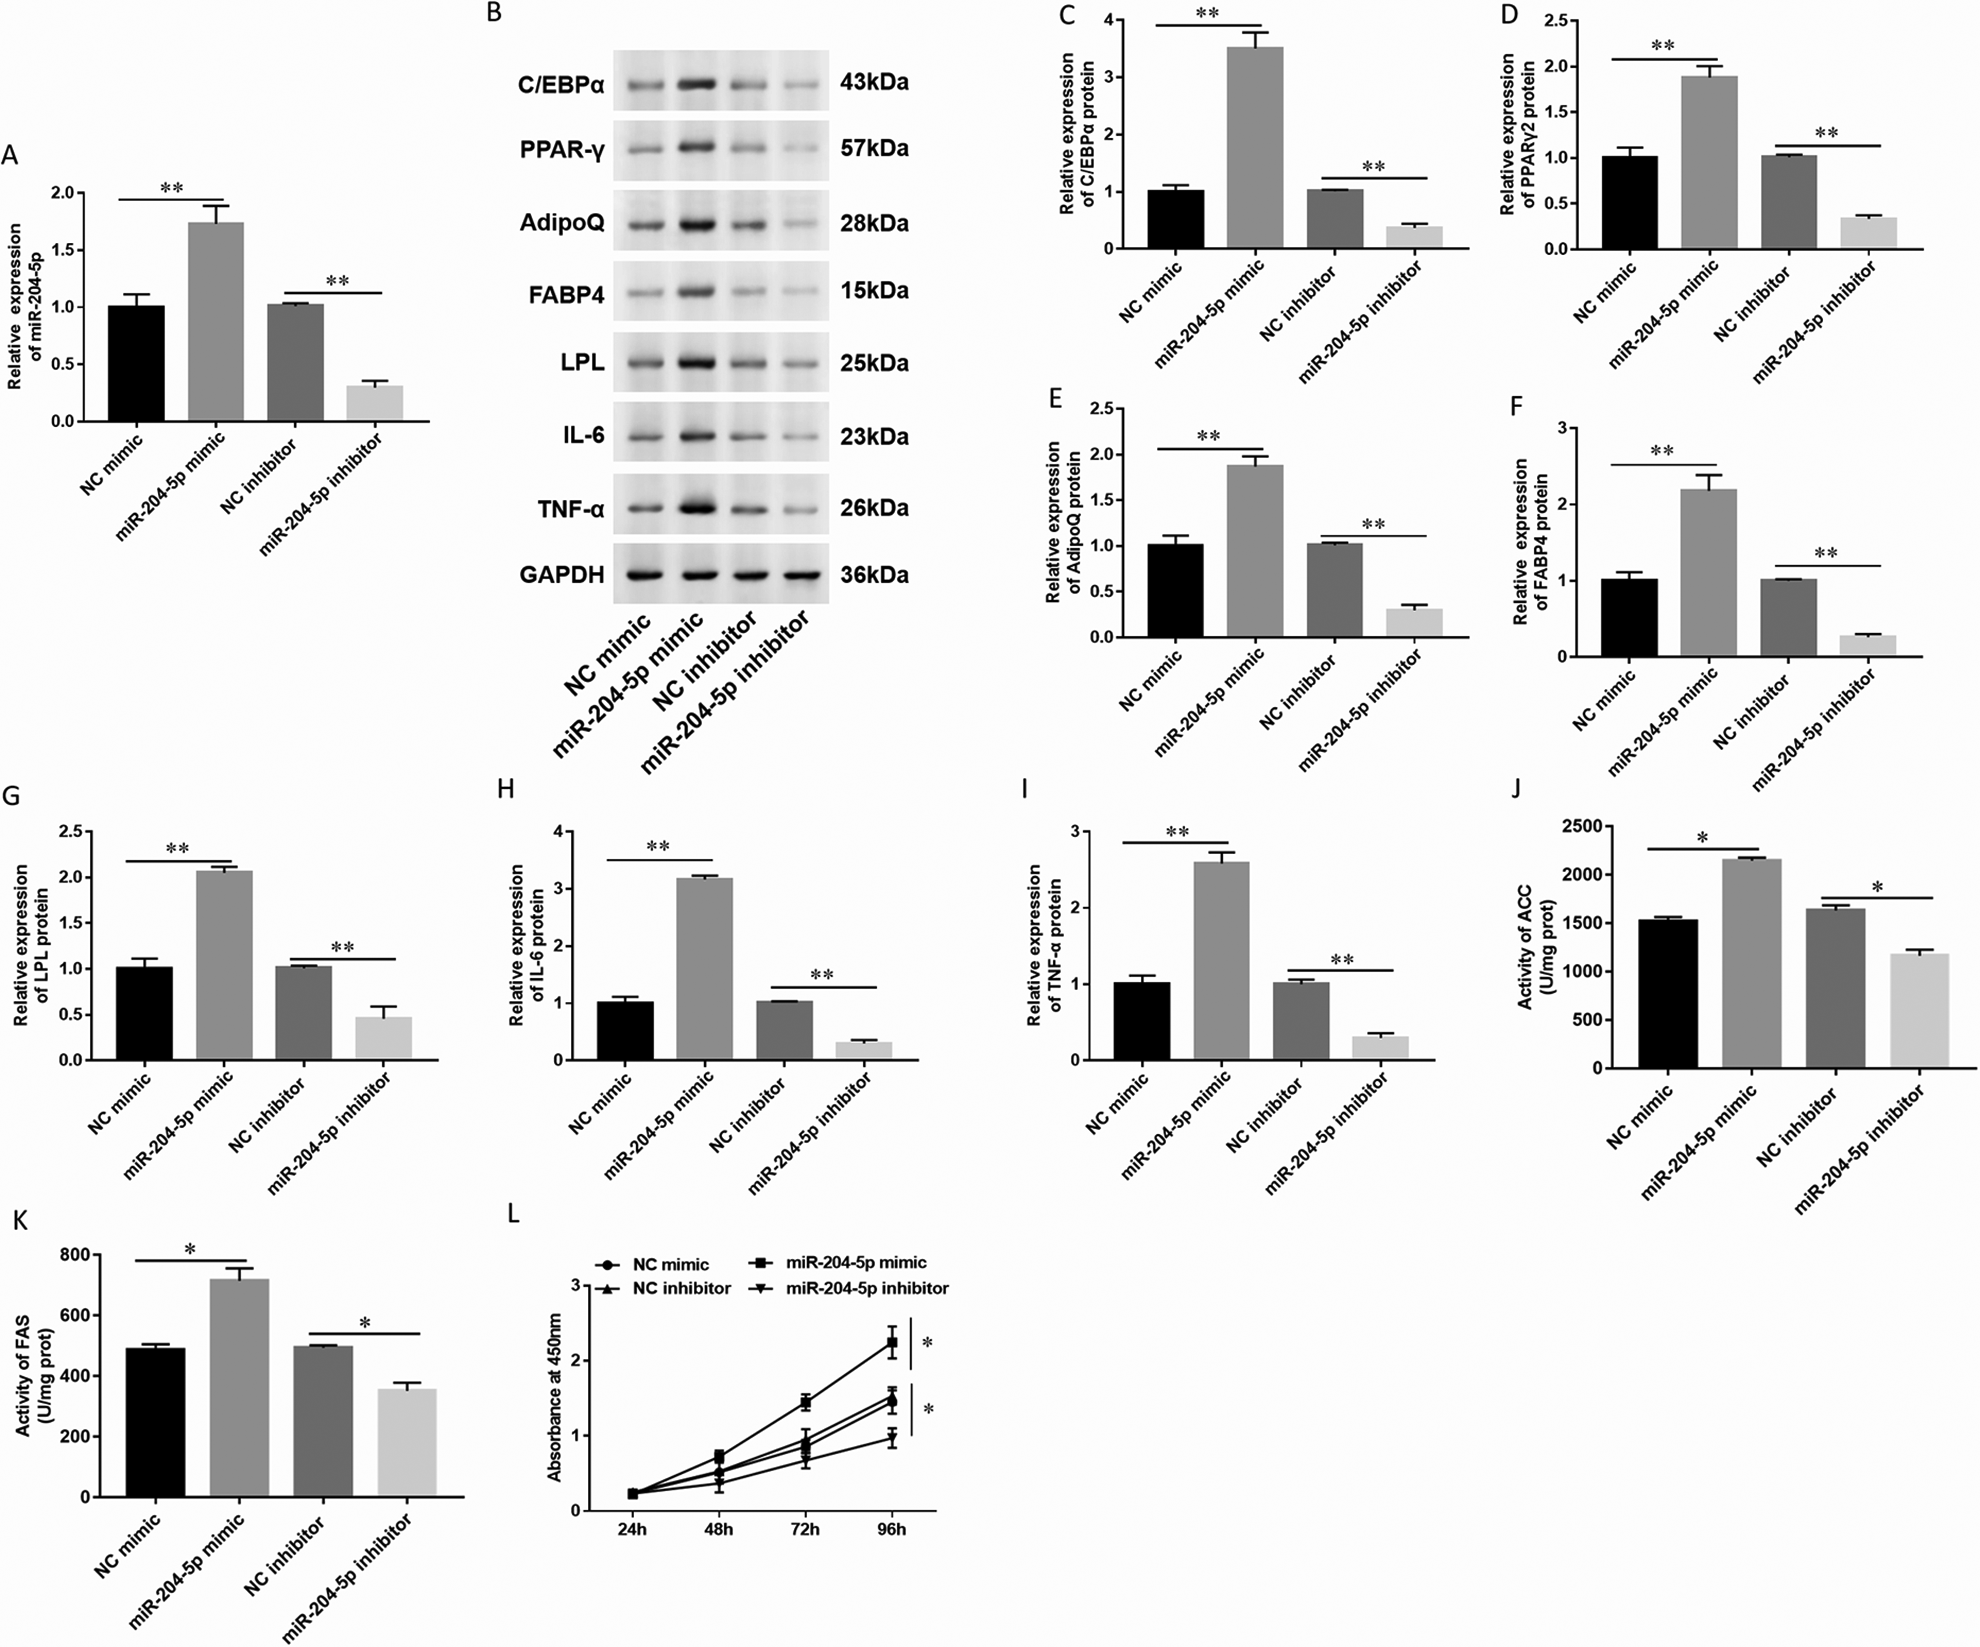
Overexpression of miR-204-5p promoted cell proliferation and adipocytes differentiation in hAdMSCs. The hAdMSCs were transfected with NC mimic (20 nM), miR-204-5p mimic (20 nM), NC inhibitor (20 nM), and miR-204-5p inhibitor (20 nM) for 48 h. (A) Expression of miR-204-5p was detected by RT-qPCR. (B) The expression of adipogenic marker protein and inflammatory factor was detected by Western blot. Expression of (C) C/EBPα, (D) PPARγ2, (E) AdipoQ, (F) FABP4, (G) LPL, (H) IL-6, and (I) TNF-α was quantified using Image J software. The levels of lipogenesis enzymes such as ACC (J) and FAS (K) were detected by spectrophotometry. (L) Cell proliferation ability was tested by CCK-8. Statistical significance was determined using an independent sample t-test. Values were expressed as mean ± SEM, n = 3. *P < 0.05 and **P < 0.01 versus control. ACC: acetyl coenzyme A carboxylase; AdipoQ: adiponectin; C/EBPα: CCAAT-enhancer-binding protein α; CCK: cell counting kit; FABP4: fatty acid-binding protein 4; FAS: fatty acid synthase; hAdMSCs: human adipose-derived mesenchymal stem cells; IL-6: interleukin-6; LPL: lipoprotein lipase; NC: normal control; PPARγ: peroxisome proliferator-activated receptor gamma; TNF-α: tumor necrosis factor-alpha.
MiR-204-5p Targeted the 3′-UTR of SIRT1 in hAdMSCs
To investigate the mechanisms of miR-204-5p in hAdMSCs, we used the online database of StarBase (http://starbase.sysu.edu.cn/) to perform bioinformatic analysis. It showed that miR-204-5p directly targeted to SIRT1 3′-UTR (Fig. 6A). The luciferase reporter gene assay was used to validate whether miR-204-5p bound to SIRT1 3′-UTR. As the results showed, miR-204-5p was directly bound to SIRT1 3′-UTR (Fig. 6B). Then, we detected the expression of SIRT1 in hAdMSCs by Western blot analysis. The results showed that SIRT1 expression was significantly decreased in hAdMSCs transfected with miR-204-5p mimic and upregulated in hAdMSCs transfected with miR-204-5p inhibitor (Fig. 6C). Then, we transfected resveratrol (Res), which was one of the famous agonists of SIRT1 in hAdMSCs. The expression of adipogenic marker proteins was detected by Western blot (Fig. 6D). We found that the expression of C/EBPα (Fig. 6E), PPARγ2 (Fig. 6F), AdipoQ (Fig. 6G), FABP4 (Fig. 6 H), and LPL (Fig. 6I) was downregulated in hAdMSCs treated with agonists of SIRT1 (Res). The levels of lipogenesis enzymes were detected by spectrophotometry; the activity of ACC and FAS was decreased in hAdMSCs transfected with miR-204-5p mimic and downregulated in hAdMSCs treated with Res (Fig. 6L, M). It showed that Res might effectively reduce the secretion of fat-related cells, thereby reducing the differentiation of fat cells. When SIRT1 is overexpressed, the expression of adipogenesis-related proteins and the levels of lipogenesis enzymes were decreased and affected fat differentiation. Moreover, overexpression of SIRT1 also attenuated the effect of miR-204-5p mimic on adipocyte differentiation. Next, we tested the expression of IL-6 and TNF-α. After transfected with Res, the expression of IL-6 (Fig. 6 J) and TNF-α (Fig. 6 K) was decreased, but the expression was significantly increased when transfected with miR-204-5p mimic. The overexpression of SIRT1 also attenuated the effect of miR-204-5p mimic on the expression of IL-6 (Fig. 6J) or TNF-α (Fig. 6K). The CCK-8 assay found that the upregulation of miR-204-5p significantly promoted cell growth in hAdMSCs while transfected with Res decreased the cell proliferation (Fig. 6N). It demonstrated that overexpression of SIRT1 or transfected with Res significantly inhibited the cell proliferation and inflammatory factor production in hAdMSCs.

MiR-204-5p directly targeted SIRT1. (A) Online database StarBase showed the sequence alignment between miR-204-5p and SIRT1. (B) The luciferase reporter gene assay was performed in HEK-293T cells to validate the binding of miR-204-5p and SIRT1. Firefly and Renilla luciferase activities were determined. (C) Expression of SIRT1 in hAdMSCs transfected with miR-204-5p mimic, inhibitor, and their control was detected by Western blotting. (D) The expression of adipogenic marker protein and inflammatory factor was detected by Western blot. Expression of (E) C/EBPα, (F) PPARγ2, (G) AdipoQ, (H) FABP4, (I) LPL, (J) IL-6, and (K) TNF-α in hAdMSCs transfected with miR-204-5p mimic, Res, and pcDNA-SIRT1. The levels of lipogenesis enzymes such as ACC (L) and FAS (M) were detected by spectrophotometry. (N) Cell proliferation ability was tested by CCK-8. Statistical significance was determined using an independent sample t-test. Values were expressed as mean ± SEM, n = 3. *P < 0.05 and **P < 0.01 versus control. ACC: acetyl coenzyme A carboxylase; AdipoQ: adiponectin; C/EBPα: CCAAT-enhancer-binding protein α; CCK: cell counting kit; FABP4: fatty acid-binding protein 4; FAS: fatty acid synthase; hAdMSCs: human adipose-derived mesenchymal stem cells; IL-6: interleukin-6; LPL: lipoprotein lipase; PPARγ: peroxisome proliferator-activated receptor gamma; TNF-α: tumor necrosis factor alpha.
Overexpression of miR-204-5p Reversed the Effect of HCG11 on Inhibiting Cell Proliferation in hAdMSCs
In order to further validate the correlation between HCG11 and miR-204-5p, we co-transfected pcDNA-HCG11 and miR-204-5p mimic into hAdMSCs. As shown in Fig. 7, pcDNA-HCG11 decreased the expression of adipogenic marker proteins and the levels of lipogenesis enzymes, while the miR-204-5p mimic significantly attenuated the effect of pcDNA-HCG11 on the expression of adipogenic marker proteins and the levels of lipogenesis enzymes (Fig. 7A–F, I, J). Next, we investigated the expression of inflammatory factor IL-6 and TNF-α under the same treatment with pcDNA-HCG11 and miR-204-5p mimic. pcDNA-HCG11 also decreased the expression of IL-6 and TNF-α, while the miR-204-5p mimic significantly attenuated the effect of pcDNA-HCG11 (Fig. 7G, H). The miR-204-5p mimic significantly reduced the inhibitory effect of pcDNA-HCG11 on cell proliferation (Fig. 7K). Collectively, these results suggested that overexpression of HCG11 inhibited cell proliferation, adipogenic differentiation, and production of inflammatory factors in hAdMSCs by targeting miR-204-5p.

Overexpression of miR-204-5p reversed the effect of HCG11 on hAdMSCs. (A) The expression of adipogenic marker protein and inflammatory factor was detected by Western blot. Expression of (B) C/EBPα, (C) PPARγ2, (D) AdipoQ, (E) FABP4, (F) LPL, (G) IL-6, and (H) TNF-α in hAdMSCs transfected with miR-204-5p mimic, pcDNA-HCG11, and their control was quantified using Image J software. The levels of lipogenesis enzymes such as (I) ACC and (J) FAS were detected by spectrophotometry. (K) Cell proliferation ability was tested by CCK-8. Statistical significance was determined using an independent sample t-test. Values were expressed as mean ± SEM, n = 3. *P < 0.05 and **P < 0.01 versus control. ACC: acetyl coenzyme A carboxylase; AdipoQ: adiponectin; C/EBPα: CCAAT-enhancer-binding protein α; CCK: cell counting kit; FABP4: fatty acid-binding protein 4; FAS: fatty acid synthase; hAdMSCs: human adipose-derived mesenchymal stem cells; HCG11: human leukocyte antigen complex group 11; IL-6: interleukin-6; LPL: lipoprotein lipase; PPARγ: peroxisome proliferator-activated receptor gamma; TNF-α: tumor necrosis factor alpha.
Discussion
Adipogenesis is a tightly ordered, multistage process that requires the continuous activation of multiple transcription factors, including the C/EBP family and PPAR 24 . During adipogenesis, the expression of lipogenic enzymes, such as fatty acid synthase (FASN), hydroxymethylglutaryl-CoA reductase (HMGR), ACC, sterol regulatory element binding protein (SREBP)-1c, and stearoyl-CoA desaturase-1 (SCD-1) was upregulated 25 . Our studies suggested that HCG11 downregulated C/EBP, PPARγ2 expression, and the activity of ACC and FAS during adipogenesis. Many studies have shown that several lncRNAs fulfill their roles by sponging miRNAs and competitively inhibiting their biological functions 18 . Our studies focused on the involvement of HCG11 in hAdMSCs and its possible molecular mechanism in adiposis. HCG11 is a member of a long noncoding family, and it played an important role in tumor suppression, such as hepatocellular carcinoma 26 and gastric cancer 27 . The regulation of IGF2BP1 by HCG11 can inhibit the apoptosis of liver cancer cells through mitogen-activated protein kinase signal transduction. Moreover, HCG11 promoted the proliferation and migration of gastric cancer by contracting miR-1276/CTNNB1 and activating the Wnt signaling pathway. However, in our study, HCG11 was less expressed in hAdMSCs, and HCG11 effectively inhibited adipocyte differentiation and cell growth. The function of HCG11 was partially attributed to its ability as a molecular sponge of miR-204-5p.
As other studies have shown, the expression of miR-204-5p was downregulated in response to exogenous proinflammatory stimulus TNF-α in HK-2 cells while that of IL-6 receptor α (IL-6R) was upregulated 28 . We found that miR-204-5p promoted the adipocyte differentiation, cell proliferation, and inflammatory factor production in hAdMSCs. To further understand the mechanism of miR-204-5p in hAdMSCs, we used bioinformatic tools to predict the downstream targets of miR-204-5p. As expected, luciferase reporter gene assay showed the miR-204-5p targeted to the 3′-UTR of SIRT1. Studies have shown that SIRT1 knockout led to adipose tissue dysplasia in C57BL/6J mice, which may be related to the impaired angiogenesis in adipose tissue and the inhibition of adipocyte differentiation and maturation 29 . The marker genes C/EBPα and PPARγ in adipogenic differentiation controlled downstream genes and finally made cells that have the characteristics of mature adipocytes and differentiate into adipocytes 30 . Knockout of SIRT1 promoted adipogenic differentiation of 3T3-L1 preadipocytes 31 . Researches have shown that activation of SIRT1 led to the deacetylation of Re1A/p65, thereby leading to transcriptional repression of various inflammation-related genes 32 . Our results showed that overexpression of SIRT1 could reverse the effect of miR-204-5p mimic on adipocyte differentiation, cell proliferation, and inflammatory factor production in hAdMSCs.
Clearly, the balance between proinflammatory and anti-inflammatory signals was critical to disease progression. Many adipocyte-derived factors played a key role in maintaining inflammatory homeostasis. Related studies have described important cytokines associated with local proinflammatory reactions in adipocytes, leading to increased ectopic lipid accumulation and insulin resistance 33 , while anti-inflammatory adipokines such as adiponectin strongly oppose inflammation, hyperglycemia, or lipotoxicity damage 34 . Our studies showed that HCG11 regulated SIRT1 by targeting miR-204-5p to reduce the secretion of inflammatory factors IL-6 and TNF-α. Moreover, inflammation is related to the pathogenesis of insulin resistance and can predict the development of type 2 diabetes 35 . This meant that HCG11 can partially inhibit the inflammatory response caused by obesity, thereby reducing the risk of other related diseases.
In conclusion, we demonstrated that HCG11 plays an important role in inflammation, cell proliferation, and adipose tissue cell differentiation. Inhibition of miR-204-5p eventually alleviates inflammation and adipose tissue cell differentiation by upregulating the expression of SIRT1. Therefore, the HCG11/miR-204-5p/SIRT1 axis plays a crucial role in hAdMSCs of the adiposis, and HCG11 also was a negative regulator of adipocyte differentiation.
Footnotes
Ethical Approval
Ethical Approval is not applicable for this article.
Statement of Human and Animal Rights
This article does not contain any studies with human or animal subjects.
Statement of Informed Consent
Written informed consent was obtained from the patients for their anonymized information to be published in this article.
Declaration of Conflicting Interests
The author(s) declared no potential conflicts of interest with respect to the research, authorship, and/or publication of this article.
Funding
The author(s) disclosed receipt of the following financial support for the research, authorship, and/or publication of this article: the study was funded by the Key Project of Henan Education Committee in China (No. 16A320068), the Natural Science Foundation of Henan Province in China (No. 172102310151), the Natural Science Foundation of Henan Province in China (No. 182102310082) and the Projects of Henan Science and Technology Development in China (No. 162300410116).