
Abstract
Transplantation of neural stem/progenitor cells (NS/PCs) promotes functional recovery after spinal cord injury (SCI); however, few studies have examined the optimal site of NS/PC transplantation in the spinal cord. The purpose of this study was to determine the optimal transplantation site of NS/PCs for the treatment of SCI. Wild-type mice were generated with contusive SCI at the T10 level, and NS/PCs were derived from fetal transgenic mice. These NS/PCs ubiquitously expressed ffLuc-cp156 protein (Venus and luciferase fusion protein) and so could be detected by in vivo bioluminescence imaging 9 days postinjury. NS/PCs (low: 250,000 cells per mouse; high: 1 million cells per mouse) were grafted into the spinal cord at the lesion epicenter (E) or at rostral and caudal (RC) sites. Phosphate-buffered saline was injected into E as a control. Motor functional recovery was better in each of the transplantation groups (E-Low, E-High, RC-Low, and RC-High) than in the control group. The photon counts of the grafted NS/PCs were similar in each of the four transplantation groups, suggesting that the survival of NS/PCs was fairly uniform when more than a certain threshold number of cells were transplanted. Quantitative RT-PCR analyses demonstrated that brain-derived neurotropic factor expression was higher in the RC segment than in the E segment, and this may underlie why NS/PCs more readily differentiated into neurons than into astrocytes in the RC group. The location of the transplantation site did not affect the area of spared fibers, angiogenesis, or the expression of any other mediators. These findings indicated that the microenvironments of the E and RC sites are able to support NS/PCs transplanted during the subacute phase of SCI similarly. Optimally, a certain threshold number of NS/PCs should be grafted into the E segment to avoid damaging sites adjacent to the lesion during the injection procedure.
Keywords
Introduction
The central nervous system including the spinal cord was thought to be difficult to regenerate after injury. However, many reports show that transplantation of neural stem/progenitor cells (NS/PCs) promotes functional recovery in animal models of spinal cord injury (SCI) (1,2,7,10,19,22,23,28,31–34,48,49). These NS/PCs were derived from various origins such as hair follicle stem cells, fetal ganglionic eminence, embryonic stem cells, and induced pluripotent stem cells of rodent and human; moreover, various host animals were used such as rodents and nonhuman primates. These studies contributed to the clinical application of NS/PCs, and transplantation of these cells into injured spinal cords is being clinically developed. Stem Cells, Inc. is currently performing clinical trials in which human fetal NS/PCs are transplanted into the injured spinal cord during the chronic phase according to the preclinical studies using rodent early chronic models (43).
We previously reported that intralesional transplantation of NS/PCs is more effective than intrathecal and intravenous (IV) injections to treat SCI in mice (46). Only a small amount of grafted cells survive at the injury site following intrathecal injection. Grafted cells are mainly trapped in the lungs and kidneys following IV injection, and few cells are engrafted at the injury site. Therefore, we concluded that intralesional application is the most effective method for the transplantation of NS/PCs and that intrathecal and IV injections do not deliver cells to the lesion site reliably.
NS/PCs were transplanted into various sites of the injured spinal cord in previous studies including the lesion epicenter (26,28,33,47), one segment rostral or caudal to the lesion (8,25), rostral and caudal sites (9,14), and two bilateral rostral and caudal regions (16,20). For clinical trials of NS/PCs, it is critical to determine the optimal transplantation site of these cells in the injured spinal cord; however, few studies have addressed this issue. The purpose of this study is to investigate the optimal transplantation site of NS/PCs to treat SCI in adult mice.
Materials and Methods
Culture of NS/PCs and Differentiation Assay
NS/PCs were cultured and expanded as described previously (41). We previously developed CAG: (C) the cytomegalovirus (CMV) early enhancer element, (A) the promoter, the first exon and the first intron of chicken β-actin gene, firefly luciferase, and circularly permuted Venus with yellow-emitting variant of Aequorea green fluorescent protein (GFP) (CAG-ffLuc-cp156) mice, which are transgenic mice that ubiquitously express a fusion protein of firefly luciferase and circularly permuted Venus (13). This mouse was generated by crossbreeding the reporter mouse CAG-neoloxP/loxP-ffLuc-cp156 (Fig. 1A) with the GAG-Cre recombinase (CAG-Cre) mouse (a gift from Dr. Okabe, Osaka University, Osaka, Japan). In brief, the ganglionic eminences of these transgenic mice were dissociated using a fire-polished glass pipette (Corning, Corning, NY, USA) on embryonic day 14.5. The dissociated cells were collected by centrifugation and resuspended in culture medium, which consisted of Dulbecco's modified Eagle medium/F12 (Sigma-Aldrich, St. Louis, MO, USA) supplemented with a previously described hormone mixture (41) with the addition of human recombinant fibroblast growth factor-2 (FGF-2) and epithelial growth factor (EGF; both Peprotech, Rocky Hill, NJ, USA; 20 ng/ml each). Neurospheres were allowed to form. The neurospheres were cultured without serum and growth factors for 5 days to allow differentiation. Then, the cells were fixed in 0.1 M phosphatebuffered saline (PBS) (Nacalai Tesque, Inc., Kyoto, Japan) containing 4% paraformaldehyde (PFA; Nacalai Tesque, Inc.) for immunocytochemistry with the following primary antibodies: anti-β-III tubulin (clone Tuj-1; mouse IgG, 1:1,000, Sigma-Aldrich), anti-glial fibrillary acid protein (GFAP; rat IgG, 1:1,000, Invitrogen, Carlsbad, CA, USA), and anti-2′, 3′-cyclic nucleotide 3′-phosphodiesterase (CNPase; mouse IgG1, 1:1,000, Sigma-Aldrich). Nuclei were stained with Hoechst 33258 (10 μg/ml; Sigma-Aldrich). In vitro images were obtained using a fluorescence microscope (Axiophot 2; Carl Zeiss, Munich, Germany).

In vitro imaging and differentiation of neural stem/progenitor cells (NS/PCs). (A) The ffLuc-cp156 reporter transgene. (B) Phase contrast and fluorescence images of the Venus-positive neurospheres derived from fetal ganglionic eminence at embryonic day 14.5. (C) There is a positive linear relationship between cell number and photon count in bioluminescence imaging (BLI). After passage 3, neurospheres had differentiated into β-III tubulin (clone Tuj-1)-positive neurons (D), glial fibrillary acid protein (GFAP)-positive astrocytes (E), and 2′, 3′-cyclic nucleotide 3′-phosphodiesterase (CNPase)-positive oligodendrocytes (F). (G) Quantitative analysis of the differentiated neural stem/progenitor cells (NS/PC) phenotypes. n = 3. Scale bars: 100 μm in (B and C), 50 μm in (D–F). CAG: (C) the cytomegalovirus (CMV) early enhancer element, (A) the promoter, the first exon and the first intron of chicken β-actin gene, (G) the splice acceptor of the rabbit β-globin gene; Neo(polyA): neomycin resistance gene polyA polymerase; ffLuc-cp156: firefly luciferase and circularly permuted Venus with yellow-emitting variant of Aequorea GFP.
SCI Model
Adult female C57BL/6 mice (8–9 weeks old, 18–22 g, n = 27; Clea Japan, Inc., Tokyo, Japan) were anesthetized by intraperitoneal (IP) injection of ketamine (100 mg/kg body weight; Sankyo Lifetech Co., Ltd., Tokyo, Japan) and xylazine (10 mg/kg body weight; Bayer, Leverkusen, Germany). The dorsal surface of the dura mater was exposed after laminectomy at the 10th thoracic spinal vertebra (T10). SCI was induced as described previously (44), using a commercially available SCI device (IH Impactor, Precision Systems and Instrumentation, Lexington, K Y, USA). This device creates a reliable contusion injury by rapidly applying a force-defined impact (60 kdyn) with a stainless steel-tipped impactor. All experiments were performed with institutional approval in accordance with the Guidelines for the Care and Use of Laboratory Animals of Keio University School of Medicine [No 16–098–37, No 09091-(9)] and the US National Institutes of Health guidelines for the care and use of laboratory animals.
Transplantation of NS/PCs
NS/PCs were transplanted into the lesion epicenter (E group, n = 8) or regions 1 mm rostral and caudal of the rim of the lesion (RC group, n = 8) at 9 days postinjury. Each of these two transplantation groups was subdivided into two groups depending on the number of cells grafted; the “Low” group (approximately 2.5 × 10⁵ cells) and the “High” group (approximately 1.0 × 10⁶ cells). Thus, there were four groups in total: E-High, E-Low, RC-High, and RC-Low (n = 4 per group). NS/PCs were diluted with 3 μl of PBS in both the Low and High groups and were grafted with a glass micropipette at a rate of 1 μl/min using a Hamilton syringe (25 μl; Reno, NV, USA) and a stereotaxic microinjector (KDS 310; Muromachikikai Co., Ltd., Tokyo, Japan). PBS (3 μl) was injected into the lesion epicenter of the vehicle control mice (PBS group, n = 8).
Bioluminescence Imaging
A Xenogen-IVIS spectrum CCD optical macroscopic imaging system (Summit Pharmaceuticals International Corporation, Tokyo, Japan) was used for in vitro and in vivo bioluminescence imaging (BLI) as previously reported (22,35,46,49). In brief, the signal intensities of various numbers of NS/PCs were assessed in vitro (approximate range, 1 × 10²–1 × 10⁶ cells). The integration time was fixed at 1 min for each image.
In vivo imaging was performed 5 min after IP injection of D-luciferin (0.3 mg/g body weight; Promega, Madison, WI, USA) with the field of view set at 13.2 cm height, as the photon count was most stable during this period. The intensity peaked 10–30 min after IP injection of D-luciferin. The integration time was fixed at 1 min for each image. All images were analyzed with Living Image software (Caliper Life-Sciences, Hopkinton, MA, USA), and the optical signal intensity was expressed as the photon count, which has the units photons/s/cm2/steradian. Each result was displayed as a pseudocolored photon count image superimposed on a grayscale anatomic image. To quantify the photon count, a region of interest (ROI) was defined in the area in which cells were transplanted, and all values at the same ROI were examined.
Behavioral Analysis
The motor function of each mouse was evaluated weekly using the Basso mouse scale (BMS) up to 49 days postinjury (3). This assessment was performed by two investigators who were blinded to the treatment of the experimental mice.
Histological Analyses
Injured animals were deeply anesthetized and transcardially perfused with PBS containing 4% PFA at 49 days posttransplantation. The spinal cords were removed, postfixed overnight in PBS containing 4% PFA, soaked overnight in 10% sucrose (Nacalai Tesque, Inc.), soaked in 30% sucrose, embedded in optimal cutting temperature compound (Sakura Seiki Co., Ltd., Tokyo, Japan), frozen, and sectioned in the sagittal plane at a thickness of 16 μm using a cryostat (CM3050; Leica Microsystems, Wetzlar, Germany). The spinal cord sections were immunohistochemically stained and evaluated by quantitative analysis. For immunohistochemistry, tissue sections were stained with the following primary antibodies: anti-GFP (rabbit IgG, 1:500; Frontier Institute Co., Ltd., Hokkaido, Japan); anti-embryonic lethal, abnormal vision, drosophila (ELAV)-like neuron-specific RNA binding proteins 2–4 [Hu(B, C and D but not R); human IgG, 1:1,000, a gift from Dr. Robert Darnell, The Rockefeller University, New York, NY, USA]; anti-GFAP (rat IgG, 1:500, Invitrogen); anti-adenomatous polyposis coli antigen (APC; mouse IgG, 1:500; Calbiochem, San Diego, CA, USA); antineurofilament 200 kDa (NF-H; mouse IgG1, 1:200; Chemicon, Millipore, Billerica, MA, USA); and antiplatelet endothelial cell adhesion molecule-1 (PECAM-1; rat IgG, 1:200; BD Bioscience Pharmingen, San Diego, CA, USA). For differentiation efficiencies of grafted cells, the samples were incubated with secondary antibodies conjugated with Alexa488, Alexa555 (Invitrogen) appropriate for host species at 1:1,000 dilution for 2 h at room temperature after incubation with primary antibodies at 4°C overnight. Nuclei were stained with Hoechst 33258 (10 μg/ml; Sigma-Aldrich). For immunohistochemistry with anti-GFP, -NF-H, and -PECAM-1 antibodies, the sections were exposed to 0.3% H2O2 (Nacalai Tesque, Inc.) for 30 min at room temperature to inactivate endogenous peroxidases and were then treated with a biotinylated secondary antibody (Jackson Immunoresearch Laboratory, Inc., West Grove, PA, USA). Signals were enhanced with the VECTASTAIN® ABC kit (Vector Laboratories, Inc., Burlingame, CA, USA) and visualized by reaction with diaminobenzidine (DAB) (Vector Laboratories, Burlington, ON, Canada) (NF-H: 45 s and PECAM-1: 4 min) in accordance with the manufacturer's instructions. All images were obtained with a fluorescence microscope (BZ 9000; Keyence Co., Osaka, Japan) or a confocal laser scanning microscope (LSM 700; Carl Zeiss).
RNA Isolation and RT-PCR
To compare differential mRNA expression in the transplantation site of the E and RC segments, a 4.5-mm segment of the injured spinal cord was removed from wild-type mice 9 days postinjury and divided into the E segment and the adjacent rostral and caudal segments, each 1.5 mm wide. mRNA expression of growth factors, inflammatory cytokines, markers of inflammatory cells, and bone morphogenetic proteins (BMPs) was analyzed in each of these three segments. This revealed the profile of the spinal cord prior to NS/PC transplantation (n = 3). mRNA levels were analyzed by quantitative RT-PCR (qRT-PCR) arrays using TaqMan® Array Fast (Applied Biosystems, Foster City, CA, USA) in accordance with the manufacturer's instructions. Dissected spinal cords were rapidly frozen and placed in TRIzol® (Invitrogen). Subsequent RNA isolation was performed according to the manufacturer's instructions. Total RNA was treated with TURBO™ DNase (Ambion, Austin, TX, USA) and then reverse transcribed with oligo (dT) primers and SuperScript III® reverse transcriptase (Invitrogen). Quantitative mRNA expression of trophic factor-related genes was simultaneously analyzed (n = 3). The amount of mRNA was normalized against the amount of 18s ribosomal RNA. The following manufactured primers (Applied Biosystems; http://www.appliedbiosystems.com) against mouse DNA sequences were used: brain-derived neurotrophic factor (Bdnf)-Mm01334044_ml, ciliary neurotrophic factor-zinc finger protein 91-U05342 readthrough (Cntf Zfp91 U05342)-Mm00446373_m1, nerve growth factor (Ngf)-Mm00443039_m1, glial cell line-derived neurotrophic factor (Gdnf)-Mm00599849_m1, hepatocyte growth factor (Hgf)-Mm01135183_m1, Fgf2-Mm01285715_m1, vascular endothelial growth factor a (Vegfa)-Mm01281449_m1, Vegfb-Mm00442102_m1, interleukin-1β (Il1b)-Mm01336189_m1, Il10-Mm01288 386_m1, Il16-Mm00516039_m1, interferon γ (Ifng)-Mm0 1168133_m1, transforming growth factor β 1 (Tgfb1)-Mm01178819_m1, Tgfb2-Mm03024009_m1, chemokine C-C motif ligand 2 (Ccl2)-Mm99999056_m1, cluster of differentiation 68 (Cd68)-Mm03047343_m1, matrix metalloproteinase 9 (Mmp9)-Mm00600164_g1, bone morphogenetic protein 2 (Bmp2)-Mm01962382_s1, Bmp4-Mm00432087_m1, and 18s ribosomal RNA-Hs99 999901_s1. After normalization against the level of 18s ribosomal RNA, the amount of mRNA in the RC segment was determined by calculating the mean of the levels in the rostral segment and the caudal segment, and this was compared to the level of mRNA in the E segment.
Quantitative Analyses
Quantitative analyses of the histological findings (immunostaining for NF-H and PECAM-1) were performed using a BZ-9000 microscope and Dynamic Cell Count BZ-HIC software (Keyence Co.). The threshold values were the same for all analyses. To quantify NFH-positive fibers and PECAM-1-positive vessels, 0.75-mm-wide segments of the epicenter and the region 1 mm rostral and caudal of the epicenter were imaged in the midsagittal sections of mice in the E, RC, and PBS groups (n = 3 per group) (16). To quantify the proportion of grafted cells with each phenotype in vivo, five regions were captured in the sagittal sections at 200× magnification using an LSM 700 confocal laser scanning microscope. The number of cells that were both GFP- and phenotypic marker-positive were counted in each section (n = 3 per group).
Statistical Analysis
All data are reported as the mean ± SEM. An unpaired two-tailed Student's t test was used to evaluate differences between the E and RC groups in the in vivo differentiation assays. One-way ANOVA followed by Tukey's test for multiple comparisons was used for the analyses of BMS scores, NF-H-positive areas, and PECAM-1-positive areas. A paired two-tailed Student's t test was used to evaluate the differences in mRNA levels between the E and RC segments. Values of p lt; 0.05 were considered statistically significant.
Results
In Vitro Imaging and Differentiation Assay of NS/PCs
NS/PCs derived from CAG-ffLuc-cp156 mice were used in this study to identify and quantitatively monitor the survival of the grafted cells (13). NS/PCs derived from these transgenic mouse embryos express ffLuc-cp156, which is a fusion protein of a variant of the fluorescent protein Venus and luciferase; therefore, these NS/PCs are fluorescent and bioluminescent (Fig. 1B). Transgenic NS/PCs expressed ffLuc-cp156 more uniformly than NS/PCs transfected with ffLuc-cp156 using a lentivirus, and there was a strong linear relationship between cell number and photon count (Fig. 1C). The in vitro differentiation assay revealed that NS/PCs derived from the transgenic mice differentiated into β-III tubulin (clone Tuj-1)-positive neurons (12.2 ± 1.5%), GFAP-positive astrocytes (55.0 ± 2.0%), and CNPase-positive oligodendrocytes (9.8 ± 1.0%) (Fig. 1D–G).
Survival of NS/PCs Grafted Into the Injured Spinal Cord
To monitor the survival of grafted NS/PCs, photon counts were measured 0, 7, 21, and 35 days posttransplantation. Representative bioluminescence images of mice in the E and RC groups are shown in Figure 2A and B, respectively, at 7 and 35 days posttransplantation. Quantitative analysis revealed that the photon counts of the grafted cells sharply decreased by 7 days posttransplantation and then plateaued at approximately 5 × 10⁶ photons/s/cm2/steradian in both groups. Mice in the RC-High and E-High groups received more NS/PCs than mice in the RC-Low and E-Low groups. As expected, the initial photon counts were higher in the former groups than in the latter groups. Despite this initial difference, the photon count was similar in the E-Low and E-High groups (Fig. 2D) and in the RC-Low and RC-High groups (Fig. 2E) by 21 days posttransplantation and remained similar throughout the rest of the time course. There were no significant differences in the photon counts among the all groups at 35 days posttransplantation (Fig. 2D, E).

BLI analysis. NS/PCs were transplanted into the lesion epicenter (E group) or regions 1 mm rostral and caudal of the rim of the lesion (RC group) at 9 days postinjury. Representative bioluminescence images of mice in the E group (A) and the RC group (B) at 7 and 35 days posttransplantation (Dpt). (C) Quantitative analysis of the bioluminescence images revealed that there was no significant difference in the photon counts between the E and RC groups. The E and RC groups were subdivided into “High” and “Low” groups according to the number of NS/PCs transplanted. The mean photon counts of the E-High and E-Low groups (D), and the RC-High and RC-Low groups (E) were similar at 35 Dpt.
Distribution and Differentiation of the Grafted NS/PCs in the Injured Spinal Cord
Anti-GFP immunohistochemistry with DAB staining, which detects the ffLuc-cp156 protein, was performed to investigate the survival and distribution of the grafted NS/PCs within the injured spinal cord. Representative staining of samples from the E and RC groups showed that the grafted cells were located outside the lesion epicenter, and there was no apparent difference in the distribution of the grafted cells between these groups (Fig. 3A, B).
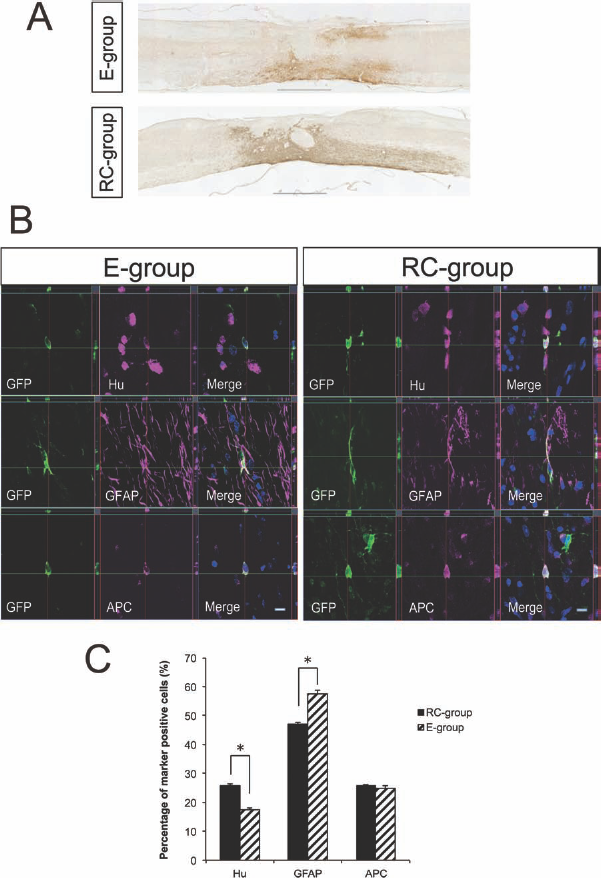
Distribution and differentiation of grafted NS/PCs. (A) Anti-green fluorescent protein (GFP) diaminobenzidine (DAB) staining of sagittal sections of the spinal cord at 42 days posttransplantation. Grafted NS/PCs were outside the lesion epicenter in both the E and RC groups. (B) Immunohistochemical analysis showed the grafted NS/PCs had differentiated into embryonic lethal, abnormal vision, drosophila (ELAV)-like neuron-specific RNA-binding protein (Hu)-positive neurons, glial fibrillary acidic protein (GFAP)-positive astrocytes, and adenomatous polyposis coli antigen (APC)-positive oligodendrocytes in both the E and RC groups. (C) Quantitative analysis revealed that there were significant differences (*p lt; 0.05) in the percentage of neurons and astrocytes between the E and RC groups. n = 3. Scale bars: 1,000 μm in (A), 10 μm in (B).
Immunohistochemical analysis revealed that the grafted NS/PCs differentiated into Hu-positive neurons, GFAP-positive astrocytes, and APC-positive oligodendrocytes in both the E and RC groups (Fig. 3C, D). Quantitative analysis demonstrated that the percentage of neurons (Hu positive) was significantly higher in the RC group than in the E group (p lt; 0.05) and that the percentage of astrocytes (GFAP positive) was significantly lower (p lt; 0.05) in the RC group than in the E group. There was no significant difference in the percentage of oligodendrocytes (APC positive) between the two groups (Fig. 3E).
Motor Functional Recovery
We evaluated the locomotor function of the hindlimbs using the BMS. The contusive SCI initially caused complete paralysis, followed by gradual recovery that plateaued at a BMS score of around 2 in the PBS group. The BMS score was significantly higher (p lt; 0.05), indicative of better motor functional recovery, in the E and RC groups than in the PBS group from 21 days postinjury until the end of the time course (Fig. 4A). Furthermore, the BMS score was significantly higher in the E-High, E-Low, RC-High, and RC-Low groups than in the PBS group at 49 days postinjury (Fig. 4B). The BMS scores did not significantly differ between the E and RC groups (Fig. 4A) or among the E-High, E-Low, RC-High, and RC-Low groups (Fig. 4B).

Motor functional recovery. The locomotor function of the hindlimbs was assessed by the Basso mouse scale (BMS). (A) Motor functional recovery was significantly better (*p lt; 0.05, **p lt; 0.01, RC vs. PBS; †p lt; 0.05, ††p lt; 0.01, E vs. PBS) in the E and RC groups than in the phosphate-buffered saline (PBS) group. There was no significant difference between the E and RC groups. (B) The E and RC groups were subdivided into “High” and “Low” groups according to the number of NS/PCs transplanted. There was no significant difference in BMS scores among these four groups. BMS scores were significantly higher in each of these four groups than in the PBS group at 49 day postinjury.
Evaluation of Spared Fibers and Angiogenesis
To evaluate the effects of NS/PC transplantation on spared neuronal fibers after SCI, immunohistochemical analysis of NF-H was performed at 42 days posttransplantation. NF-H-positive areas were quantified in rostral, epicenter, and caudal regions (Fig. 5A–C). The NF-H-positive areas in each of these regions were significantly larger in the E and RC groups (p lt; 0.05) than in the PBS group, whereas there was no significant difference between the E and RC groups (Fig. 5D).

Evaluation of NF-H staining. (A–C) Anti-neurofilament 200 kDa (NF-H) DAB staining of sagittal sections of the spinal cord on 42 days posttransplantation. NF-H-positive areas were quantified in the rostral, epicenter, and caudal regions. (D) NF-H-positive areas in each of these regions were significantly larger (*p lt; 0.05) in the E and RC groups than in the PBS group, whereas there was no significant difference between the E and RC groups. Scale bars: 1,000 μm.
To access the effects of NS/PC transplantation on angiogenesis after SCI, anti-PECAM-1 DAB staining was performed at 42 days posttransplantation (Fig. 6A–C). The PECAM-1-positive areas in the rostral, epicenter, and caudal regions were significantly larger (p lt; 0.05) in the E and RC groups than in the PBS group, whereas there was no difference between the E and RC groups (Fig. 6D).

Evaluation of PECAM-1 staining. (A–C) Anti-platelet endothelial cell adhesion molecule-1 (PECAM-1) DAB staining of sagittal sections of spinal cord on the 42 days posttransplantation. PECAM-1-positive areas were quantified in the rostral, epicenter, and caudal regions. (D) The PECAM-1-positive areas in each of these regions were significantly larger (*p lt; 0.05) in the E and RC groups than in the PBS group, whereas there was no significant difference between the E and RC groups. Scale bars: 1,000 μm.
mRNA Expression in the E and RC Segments
To compare the microenvironments of the E and RC segments for NS/PC transplantation, the mRNA expression of growth factors, inflammatory cytokines, markers of inflammatory cells, and BMPs was examined by qRT-PCR (Fig. 7). Brain-derived neurotrophic factor (BDNF) mRNA expression was significantly higher (p lt; 0.05) in the RC region than in the E region. However, the expression levels of none of the other mRNAs examined significantly differed between the E and RC segments.

qRT-PCR analysis of growth factors, inflammatory cytokines, markers of inflammatory cells, and BMPs. The E and RC segments of mice with contusive spinal cord injury were sampled at 9 days postinjury. mRNA expression was assessed by qRT-PCR. Brain-derived neurotrophic factor (Bdnf) expression was significantly higher (*p lt; 0.05) in the RC segment than in the E segment. The expression levels of the other growth factors, inflammatory cytokines, markers of inflammatory cells, and bone morphogenetic proteins (BMPs) did not significantly differ between the E and RC segments. Cntf, ciliary neurotrophic factor-zinc finger protein 91-U05342 readthrough; Ngf, nerve growth factor; Gdnf, glial cell line-derived neurotrophic factor; Hgf, hepatocyte growth factor Fgf2, fibroblast growth factor 2; Vegfa, vascular endothelial growth factor a; Il1b, interleukin-1β; Ifng, interferon γ; Tgfb1, transforming growth factor β 1; Ccl2, chemokine C-C motif ligand 2; CD68, cluster of differentiation 68; Mmp9, matrix metalloproteinase 9.
Discussion
ffLuc-CP156 Transgenic Mouse
When investigating cell transplantation into the injured spinal cord, many researchers including ourselves, have used cells directly transfected with luciferase (35) and/or GFP (20,36) to trace and detect the grafted cells. Abematsu et al. reported the transplantation of NS/PCs derived from a transgenic mouse ubiquitously expressing GFP and luciferase into SCI model. They found the survival of these transplanted cells drastically diminished after the ablation and also characterized the temporal changes of the survival of the transplanted cells without the ablation using the BLI system. (1). In this study, we used NS/PCs derived from a transgenic mouse that expressed a novel reporter gene, ffLuc-CP156 (13). These transgenic NS/ PCs expressed ffLuc-cp156 more uniformly than NS/PCs directly infected with lentivirus expressing ffLuc-cp156. Consequently, a strong linear relationship between photon count and cell number was detected by in vivo BLI, and the number of surviving grafted cells could be accurately quantified. The luciferin–luciferase reaction requires ATP and only occurs in living cells; therefore, the number of surviving grafted cells can be quantified more accurately by measuring the photon count than by using histological methods. In addition, NS/PCs derived from the ganglionic eminence of this transgenic mouse at embryonic day 14.5 differentiate into three neural lineages, and the differentiation efficiency did not significantly differ between the transgenic NC/PCs and wild-type NS/PCs (35).
Photon Counts of the Transplanted Cells
Previously, measurement of the photon count by in vivo BLI estimated that 10–20% of grafted cells survive when 500,000 mouse NS/PCs are transplanted into the lesion epicenter (35,46). In the current study, 500,000 grafted cells was equivalent to a photon count of approximately 60 × 106 photons/s/cm2/steradian at the time of transplantation, and the mean final photon count was 5 × 10⁶ photons/s/cm2/steradian at 35 days posttransplantation. Therefore, approximately 8% of grafted cells survived when 500,000 cells were initially transplanted. There is no significant difference between this survival rate and those previously reported.
Interestingly, the final photon count at 35 days posttransplantation was similar regardless of the initial photon count. Furthermore, there was no difference in photon counts between the E and RC groups. This suggests that the number of NS/PCs that survive is independent of the original number of cells that are transplanted as long as a certain threshold number of NS/PCs are initially delivered into the injured spinal cord. This is probably because the survival of grafted cells was affected by the microenvironment of the injured spinal cord as well as the size of available physical spaces for grafted cells within the injured spinal cord.
Survival and Distribution of Grafted NS/PCs
Many researchers have transplanted various neural cells into the lesion epicenter of injured spinal cords or into sites rostral and/or caudal of the epicenter. Schwann cells and olfactory ensheathing cells, which might contribute to remyelination of demyelinated axons after SCI, have tended to be grafted into the rostral and/ or caudal regions rather than into the lesion epicenter (18,24,37,42). On the other hand, NS/PCs are more suitable for transplantation into the lesion epicenter than into rostral and/or caudal regions (12,26,45,47,48). These grafted cells are thought to contribute to motor functional recovery by secreting trophic factors, regenerating axons, constructing remodeled neural circuits, remyelinating neurons, and promoting angiogenesis (4,5,21,27,29,51). These potential mechanisms are more applicable in the lesion epicenter than in the adjacent injured spinal cord areas.
A few reports have examined sagittal sections following transplantation of NS/PCs into the lesion epicenter or into rostral and caudal sites during the subacute phase of contusive SCI. In all cases, the grafted cells migrate away from the lesion epicenter (16,20,35,49). This indicates that cell migration is unaffected by the transplantation site. Parr et al. investigated the effects of NS/PC transplantation at different sites and at various days post-transplantation on SCI (36). The survival of grafted NS/PCs cells was significantly higher when cells were transplanted into an area 1 mm rostral and caudal to the injury site than when they were transplanted into the lesion site. However, this difference was only detected 7 days posttransplantation and was not detected 14 or 28 days posttransplantation. The grafted cells were found in the less damaged tissue, and cell survival was associated with the microenvironment in the injured spinal cord, such as the extent of the inflammatory response and the levels of secreted factors. However, this report did not address why the level of cell survival rate in the two transplantation procedures only differed at 7 days posttransplantation. In addition, Piltti et al. compared transplantation sites between epicenter and intact parenchyma (38), in which contusion injuries were induced at the T9 level in the athymic nude rats, and they transplanted human NS/PCs into the lesion epicenter (E) or two bilateral rostral (T7/8) and caudal (T10/11) sites (R/C) 9 days after injury. In their report, cell survival was higher in the R/C group compared to the E group, though the transplantation site did not affect grafted cell migration normalized by distance from the injection site. In our present study, on the other hand, there was no significant difference in cell survival regardless of whether NS/PCs were grafted into the E or RC segments during the subacute phase of SCI. This difference can be interpreted by that of the transplantation site in the R/C group between the two studies. While Piltti et al. (38) transplanted cells at distant sites from the epicenter in their R/C group, we transplanted cells in the RC region adjacent to the epicenter. Thus, microenvironments in the E region and the adjacent RC regions might have supported the survival of transplanted NS/PCs similarly in our present study. This idea is supported by qRT-PCR analyses, which showed that the expression levels of inflammatory cytokines, markers of inflammatory cells, and many growth factors apart from BDNF did not significantly differ between the E and RC segments. The upregulation of BDNF mRNA expression in RC segment after SCI was supposed to originate in reactive astrocytes around the lesion epicenter, which are known to exhibit higher BDNF expression (11,15). On the other hand, in the report by Piltti et al., microenvironments in the E region and the transplanted sites in the R/C group, which is distal from E, are likely to be different from each other. Furthermore, it is well known that the microenvironment within the injured spinal cord changes from the subacute phase to the chronic phase (32). Thus, it is important to determine the survival of the NS/PCs transplanted in E and RC regions at the chronic phase of SCI in the future.
Differentiation Efficiencies of Transplanted NS/PCs
The grafted NS/PCs differentiated into neurons, astrocytes, and oligodendrocytes in the E and RC groups. There were differences in the differentiation efficiencies of NS/PCs into neurons and astrocytes, but not into oligodendrocytes, between these two groups. Okada et al. reported that the differentiation of NS/PCs grafted into the lesion site into astroglia is more prominent when they are transplanted during the acute phase of SCI than during the subacute phase (35). This is because the levels of CNTF (6,39) and BMP (40,52) mRNAs increase dramatically during the acute phase of SCI (30) and induce NS/PCs to differentiate into astrocytes. Therefore, we predicted that the expression of these mediators and cytokines would be higher in the lesion epicenter than in adjacent sites during the subacute phase. However, qRT-PCR analyses did not detect any significant differences between the E and RC segments in the expression of many mediators that are reported to influence the differentiation of grafted NS/PCs, including CNTF, BMPs, and HGF. However, the expression of BDNF, which stimulates NS/PCs to differentiate into neurons (17,53), was higher in the RC segment than in the E segment. This may underlie, at least in part, why the proportion of neurons was higher in the RC group than in the E group.
Efficacy of Grafted NS/PCs
Previous studies demonstrated that transplantation of NS/PCs promotes the regrowth of NF-H-positive fibers after SCI (5,27,51). Consistently, the cross-sectional areas of NF-H-positive fibers were significantly larger in the E and RC groups than in the PBS group. Furthermore, the PECAM-1-positive areas were significantly larger in the E and RC groups than in the PBS group. Angiogenesis after SCI improves endogenous repair and supports axonal outgrowth (4,21). The sizes of the NF-H-positive fiber areas and the PECAM-1-positive areas were not affected by the site of NS/PC transplantation.
Eventually, motor functional recovery was significantly improved in both the E and RC groups compared to the PBS group. There was no significant difference in recovery from SCI between the E and RC groups, although the differentiation efficiency of the grafted cells did differ between the two groups. Consistently, Watanabe et al. reported that transplantation of NS/PCs derived from the forebrain or from the spinal cord into an injured spinal cord promotes motor functional recovery after SCI equally, although the differentiation efficiencies of these NS/PCs differ in vivo (50). These results indicate that the differentiation efficiency of grafted NS/ PCs varies depending on the site at which they are transplanted; however, this does not influence motor functional recovery.
The differentiation efficiency of NS/PCs into three neural lineages was the only attribute examined that significantly differed between the E and RC groups. These findings and the qRT-PCR results suggest that there is no marked difference in the abilities of the microenvironments of the lesion epicenter and the adjacent areas to support NS/ PCs that are transplanted 9 days postinjury. Therefore, we conclude that it is optimal to graft a certain threshold number of NS/PCs into the epicenter lesion during the subacute phase of SCI and thereby avoid causing further iatrogenic injury to the intact RC regions of the spinal cord.
Footnotes
Acknowledgments
We appreciate the help of Dr. S. Shibata, Dr. A. Iwanami, Dr. Y. Takahashi, Dr. M. Shinozaki, Dr. T. Konomi, Dr. R. Zhang, Dr. G. Itakura, Dr. S. Tashiro, Dr. S. Kawabata, Dr. Y. Nishiyama, and Dr. K. Hori, members of the spinal cord research team at the Department of Physiology, Orthopaedic Surgery and Rehabilitation Medicine, Keio University School of Medicine. We also thank Ms. T. Harada, Ms. S. Miyao, Ms. M. Mizutani, and Ms. H. Shimada for their assistance with the experiments and animal care. This work was supported by grants from the Japan Science and Technology–California Institute for Regenerative Medicine (JST-CIRM) collaborative program; Grants-in-Aid for Scientific Research from the Japan Society for the Promotion of Science (SPS) and the Ministry of Education, Culture, Sports, Science, and Technology of Japan (MEXT); the Project for Realization of Regenerative Medicine; Support for Core Institutes for iPS Cell Research from the MEXT; Keio Gijuku Academic Development Funds; by a Grant-in-Aid for the Global COE program from MEXT to Keio University; and by a Grant-in-Aid for Scientific Research on Innovative Areas (Comprehensive Brain Science Network) from the MEXT. H.O. is a scientific consultant for San Bio, Inc., Eisai Co., Ltd., and Daiichi Sankyo Co., Ltd. Other authors declare they have no competing financial interests.