
Abstract
Determination of the dynamics of specific cell populations in vivo is essential for the development of cell-based therapies. For cell tracking by magnetic resonance imaging (MRI), cells need to internalize, or be surface labeled with a MRI contrast agent, such as superparamagnetic iron oxide nanoparticles (SPIOs): SPIOs give rise to signal loss by gradient-echo and T2-weighted MRI techniques. In this study, cancer cells were chemically tagged with biotin and then magnetically labeled with anti-biotin SPIOs. No significant detrimental effects on cell viability or death were observed following cell biotinylation. SPIO-labeled cells exhibited signal loss compared to non-SPIO-labeled cells by MRI in vitro. Consistent with the in vitro MRI data, signal attenuation was observed in vivo from SPIO-labeled cells injected into the muscle of the hind legs, or implanted subcutaneously into the flanks of mice, correlating with iron detection by histochemical and X-ray fluorescence (XRF) methods. To further validate this approach, human mesenchymal stem cells (hMSCs) were also employed. Chemical biotinylation and SPIO labeling of hMSCs were confirmed by fluorescence microscopy and flow cytometry. The procedure did not affect proliferation and multipotentiality, or lead to increased cell death. The SPIO-labeled hMSCs were shown to exhibit MRI signal reduction in vitro and was detectable in an in vivo model. In this study, we demonstrate a rapid, robust, and generic methodology that may be a useful and practical adjuvant to existing methods of cell labeling for in vivo monitoring by MRI. Further, we have shown the first application of XRF to provide iron maps to validate MRI data in SPIO-labeled cell tracking studies.
Keywords
Introduction
The monitoring of specific cell populations is essential for understanding their role in health and disease, and also for the development of cell-based therapies (11, 28, 36, 42). Until relatively recently, tracking particular cell populations in vivo has not been possible, such information being derived only from ex vivo histology. Magnetic resonance imaging (MRI) is a commonly employed noninvasive imaging modality and cells have been labeled with a variety of contrast agents to enable tracking in vivo [reviewed in (6, 22)]. Contrast agents include those based on superparamagnetic iron oxide nanoparticles (SPIOs), which predominantly enhance T2 relaxation and range from micron size to nanometer size. Labeling of cells for MRI monitoring usually involves internalization of contrast agents, with or without assistance from, for example, polycationic compounds or translocating peptides (20, 33). Alternatively, cells have been tracked in vivo by surface labeling of cells using cell-specific antibodies that are also conjugated to contrast agents (1).
Chemical biotinylation of cells involve reaction of the N-hydroxysuccinimide (NHS) ester group of biotinylation reagents to the ∊-amine of lysine residues or the N-terminus of polypeptides, exposed on the cell surface. This reaction occurs at pH 7–9 with the release of NHS. Chemical biotinylation has provided a convenient method for labeling and detecting cell surface receptors and adhesion molecules (12, 15, 40). Utilizing the well-known strong interaction of biotin and biotinylated moieties to the proteins, avidin and streptavidin (41), any biotinylated molecule can be visualized by these proteins, when these proteins are coupled to other moieties that may be fluorescent, radioactive, and/or have enzymatic activity. Biotinylation of red blood cells (RBCs) has been used to monitor RBC survival times that may be decreased in certain pathologies (e.g. sickle cell anemia). By chemical biotinylation and reinfusion of the biotinylated RBCs, blood may be sampled and biotinylated RBCs labeled with streptavidin-fluorescein isothiocyanate (FITC) can be counted by flow cytometry (8). Thus, chemical biotinylation of cells appears to be a relatively rapid and nondestructive method of “tagging” cells. Such biotinylated cells can interact noncovalently and specifically with streptavidin or avidin or antibodies to biotin, which, in turn, are amendable to conjugation with imaging probes.
In this study, we propose the use of surface chemical biotinylation to enable generic cell tagging by anti-biotin, streptavidin, or avidin moieties conjugated to SPIOs (or other contrast agents) for in vivo cellular imaging by MRI. We have specifically chosen to use anti-biotin SPIOs as they are commercially available (e.g., for magnetic separation of biological molecules) (16), and can be manufactured according to Good Manufacturing Practices (GMP) and can therefore be translatable to the clinical setting. We initially tested this method in a human cancer cell line. Subsequently, we demonstrate successful labeling and MRI detection of clinical-grade human mesenchymal stem cells (hMSCs), similar to those used in ongoing clinical trials. We suggest that this method can be a useful adjuvant to existing methods of labeling cells in vivo for imaging studies.
Also in this study, we demonstrate for the first time the application of X-ray fluorescence (XRF) methods to map iron distribution ex vivo. In a semiquantitative and sensitive manner the iron content at the cellular level in SPIO-labeled cells was correlated with MRI data.
Materials and Methods
Experiment 1: Chemical Biotinylation and Labeling of Human Cancer Cell Line
Cell Culture and Chemical Biotinylation of Cells
IGROV1 cells (human ovarian epithelial cancer cell line) were cultured in Dulbecco's modified Eagle's medium (DMEM, Sigma-Aldrich Co. Ltd., Poole, UK) supplemented with 10% heat-inactivated fetal calf serum (FCS, Invitrogen, Paisley, UK) at 37°C at 5% CO2. At ~60% confluency, cells were washed with phosphate-buffered saline (PBS, 10 ml) and detached from the tissue culture flask with trypsin-EDTA (2 ml, Sigma-Aldrich Co. Ltd.). After two washings with 2 ml of PBS, cells were resuspended in PBS (pH 8) and incubated with either NHS-PEO4-biotin (Pierce Biotechnology, Rockford, IL, USA; 10 mg/ml sterile ultrapure water) at a concentration of 0.85 μmol per 2.5 × 10⁷ cells, or sterile ultrapure water. (NHS-PEO4-biotin is a biotinylation agent in which the NHS group is separated from the biotin moiety by a hydrophilic polyethylene oxide space arm to impart water solubility on the molecule.) After incubation (30 min, ambient temperature), the cells were washed twice with 2 ml of PBS to remove unreacted NHS-PEO4-biotin and counted. Their viability was assessed by the trypan blue exclusion assay (see below). Aliquots were also taken for confirmation of cell surface biotinylation and measurement of percentage cell death (see below). The experiment was repeated to determine persistence of cell biotinylation, cell viability, and degree of cell death at various times after biotinylation. Biotinylation was confirmed by flow cytometry and fluorescence microscopy (see below). For the latter, cells were first fixed with 2% paraformaldehyde in PBS (1 ml, 30 min, 4°C). Samples of biotinylated cells were labeled with anti-biotin SPIOs (see below) for MRI visualization in vitro (n = 3) and in vivo (n = 3).
Chemical biotinylation was also performed with a lipophilic biotinylation agent, biotin-X-NHS (the X is a 6-aminocaproic acid spacer arm, Calbiochem, San Diego, CA, USA). Biotin-X-NHS was dissolved in dimethyl sulfoxide (DMSO, 10 mg/ml, Sigma-Aldrich Chemical Co. Ltd.). Cells (2.5 × 1073.87 ml) were incubated with 0.85 μmol biotin-X-NHS at a final DMSO concentration of 0.1%. Three cell suspensions were biotinylated and another three (controls) were given DMSO only. This was repeated for a longitudinal study (n = 3) to determine persistence of cell biotinylation and comparison with the NHS-PEO4-biotin (water soluble) reagent.
Confirmation and Persistence of Cell Surface Biotinylation
To confirm chemical biotinylation of the cell surface, paraformaldehyde-fixed nonbiotinylated and biotinylated cells (0.5 × 10⁶ in 100 μl PBS) were incubated with anti-biotin FITC (10 μl, Miltenyi Biotech Ltd., Bisley, UK) at 4°C for 5 min. An aliquot of the cell suspensions was dropped onto a microscope slide, covered with a coverslip for microscopy on an upright wide-field fluorescence microscope (Leica, Milton Keynes, UK).
To determine persistence of cell surface biotinylation, biotinylated cells (0.5 × 10⁶ cells in 100 μl PBS) were incubated with either anti-biotin FITC (10 μl) or anti-H2K FITC (10 μl, Miltenyi Biotec) at 4°C for 5 min; the latter incubation was a negative control. (H2K is a mouse antigen and known to be absent on IGROV1 cells and, hence, the use of anti-H2K SPIOs to control for nonspecific binding.) Following incubation, cells were washed twice with 2 ml of PBS prior to resuspension in PBS for flow cytometry.
Cell Viability Assessment by Trypan Blue Exclusion Assay
Cell suspensions (20 μl) were diluted with appropriate volumes of 4% trypan blue solution (Sigma-Aldrich Co. Ltd.) and placed on a hemocytometer. By light microscopy, numbers of viable and nonviable cells (stained blue) were recorded for the calculation of percentage viability.
Cell Proliferation and Death Measurement
Cell proliferation over the initial 24 h after biotinylation was assessed for both biotinylated and mock biotinylated cells (n = 6 per group). Cells were plated at 5 × 10⁵ and then counted 24 h after biotinylation.
Cell death was measured using an annexin V-FITC apoptosis kit according to the manufacturer's instructions (Sigma-Aldrich Co. Ltd.). Control and biotinylated cell pellets (0.5 × 10⁶ cells) were suspended in binding buffer (0.5 ml) and annexin V-FITC (5 μl) and propidium iodide (PI, in 10 μl PBS) were added 10 min prior to flow cytometry. Annexin V and PI staining were detected in the FL1 and FL4 channels, respectively; appropriate quadrants were set. Apoptotic cells were stained with annexin V whereas necrotic and late apoptotic cells were stained by both annexin V and PI. Percentages of both cell populations were summed to give an estimate percentages of dead (both apoptotic and necrotic) cells.
Flow Cytometry Analysis
Flow cytometry was performed on a FACS-Scan (Becton Dickinson, CA, USA). Acquisition parameters were optimized for detection of the FITC fluorophore (excitation at 488 nm with an argon laser and detection above 505 nm). CellQuest software (Becton Dickson) was used to analyze the percentage of dead cells.
Labeling of Biotinylated Cells with SPIOs for MRI
Cells biotinylated with NHS-PEO4-biotin (2 × 10⁶ cells in 80 μl PBS) were incubated with either anti-biotin SPIOs (20 μl, Miltenyi Biotech Ltd.) or anti-H2K SPIOs (20 μl, Miltenyi Biotech Ltd.) at 4°C for 15 min; the latter incubation was a negative control. Following incubation, cells were washed twice with 2 ml of PBS prior to resuspension in 1 ml PBS and counted. For MRI, cell suspensions were spun down and the cell pellets (~106 cells) resuspended in 50 μl of 1% agarose prepared in PBS, and deposited in 200 μl tubes. Following solidification of the cell agarose pellets, the tubes were filled with PBS to attenuate susceptibility artifacts appearing in the MRI image. (The SPIOs used in this study were ~50 nm in size and consisted of irregular dextran aggregates with trapped ferrit crystals of ~10 nm.)
MRI Studies
In Vitro MRI
Tubes of agarose-embedded cell pellets were placed in a water-containing sample holder, prior to placement into a quadrature volume coil (40 mm inner diameter, Magnetic Resonance Laboratories, Oxford, UK). (A water-containing holder was used to enhance the contrast between the agarose cell pellets and background.) T2 measurements of the cell pellets were performed on a 4.7 T Varian Inova MR scanner (Varian Inc., CA, USA) using a spin-echo sequence with various TE values = 6–300 ms; TR = 3000 ms; field of view (FOV) = 100 × 100 mm; matrixsize = 256 × 128; 1 acquisition and 1 slice (of 6 mm thickness). Signal intensities (SI) of regions of interest (ROI) of the cell pellets were measured at the various TE values using ImageJ (National Institute of Health, Bethesda, MD, USA) and fitted according to the equation: SI = M0exp(TE/T2) to obtain T2 values using Prism (Graphpad Software Inc., San Diego, CA, USA).
In Vivo MRI
The study was performed in accordance with the Animals (Scientific Procedures) Act 1986 (UK). Female nude balb/c mice were obtained (n = 3, 12 weeks old, Harlan, Bicester, UK). Anesthesia was induced and maintained by inhalation of an isoflurane/oxygen mix. Mice were given an injection of NHS-PEO4-biotin biotinylated cells labeled with anti-biotin SPIO (1–2 × 10⁶ cells in 20 μl PBS) in one hind leg whereas the contralateral leg received an equivalent injection of biotinylated cells but not labeled with SPIOs (previously mock incubated with anti-H2K SPIO). Mice were then placed in a quadrature volume coil (25 mm inner diameter, Magnetic Resonance Laboratories) for MRI on a 9.4 T Varian Inova MR scanner. Fast-low-angle-shot (FLASH) MRI was performed with the following parameters: TR = 50 ms; TE = 1.8 ms; flip angle = 20°; FOV = 30 × 30 mm; matrix size = 256 × 128; 6 averages and 10 contiguous slices of 2 mm thickness. Following MRI, animals were sacrificed and the hind leg muscle dissected and fixed in 10% neutral buffered formalin for histological analysis.
Histological Analysis
Following formalin fixation, muscles were embedded in paraffin wax and sectioned at 5 μm. The samples were stained with Prussian blue according to the manufacturer's instructions (Sigma Aldrich Chemical Co. Ltd.), washed, and then counterstained with nuclear fast red (Sigma Aldrich Chemical Co. Ltd.).
Statistical Analysis
All values are quoted as mean ± SEM (unless otherwise stated) and tested for significance (p < 0.05) using the Student t-test.
Experiment 2: Serial Monitoring of SPIO-Labeled Chemically Biotinylated Cells in a Subcutaneous Implant Model
Subcutaneous Implantation of SPIO-Labeled Cells
IGROV1 cells were cultured and chemically biotinylated with NHS-PEO4-biotin as detailed in Experiment 1. Half the biotinylated cell population were incubated with anti-biotin SPIOs and half with anti-H2K SPIOs (mock labeling to control for nonspecific binding of SPIO-conjugated antibodies) as described above. Following washing of both cell populations, the cells were resuspended in PBS. SPIO-labeled biotinylated cells (2.5 × 10⁷, 170 μl) were implanted subcutaneously into the flank of nude Balb/c mice (n = 4, 12 weeks old, Harlan), and equivalent number of biotinylated (non-SPIO labeled) cells, into the contralateral flank.
In Vivo MRI
The flanks of the mice were scanned after implantation and at days 1, 2, and 3 after implantation similar to that described in Experiment 1 except T2-weighted MRI was performed. The following parameters were employed: TR = 1300 ms; TE = 14 ms; FOV = 30 × 30 mm; matrix size = 256 × 128; 2 averages and 5–7 contiguous slices of 2 mm thickness. SI of the cell implants in the MR images were measured and differences between the implanted SPIO-labeled and nonlabeled SPIO cells were tested for significance using the Student t -test. Following MRI, the cell implants were carefully dissected together with the underlying muscle and the covering skin, and fixed in 10% neutral buffered formalin for iron detection by histological Prussian blue staining (as detailed above) and/or XRF (see below).
XRF Iron Analysis of Cell Implants
A representative formalin-fixed SPIO-labeled and corresponding non-SPIO-labeled cell implant were embedded separately in paraffin wax and sections of 5 μm obtained and placed on XRF film (4 μm thick, Ultralene®, Spex Sample-Prep, NJ, USA). A ROI for each cell implant was selected for XRF by low-power optical microscopy, each region encompassing the implanted cells and some of the underlying muscle and overlying skin tissues. XRF was performed on the Fluo X-ray fluorescence micro-probe beamline at the ANKA synchrotron radiation facility (Karlsruhe, Germany). The beam energy was tuned to 10 eV and focused to 30 × 30 μm and the ROIs scanned in a raster fashion. Samples were mounted at a 45° angle with respect to the incoming X-ray beam in the plane of the orbiting electrons to minimize the scatter contribution to the detected signal. The data at each scan point are collected such that each point receives the same amount of incident radiation, and are in the form of a spectrum showing the characteristic radiation from elements in the sample. The spectra are then fitted and peak areas quantified using AXIL (a program that fits the element Kα and Kβ peaks under consideration, taking into account of line overlaps and subtracts the background) to quantify the iron content: 2D maps of iron distribution were constructed using IDL 7.0 (ITT Virtual Information Software).
Experiment 3: Chemical Biotinylation and SPIO Labeling of hMSCs, and Visualization by MRI
hMSCs Culture, Confirmation of Chemical Biotinylation, and SPIO Labeling
Highly characterized hMSCs were obtained (Cambrex, NJ, USA) and their cell surface marker profile confirmed by FACS analysis as CD90+/CD105+/CD45-/CD34-. Osteogenic and adipogenic differentiation was confirmed on passage 8 cells. hMSCs were cultured in low-glucose DMEM (Gibco, Paisley, UK), supplemented with 10% FCS, and 1% penicillin-streptomycin-fungizone. hMSCs were chemically biotinylated with NHS-PEO4-biotin and cell biotinylation confirmed by flow cytometry and fluorescence microscopy following staining with anti-biotin FITC (as detailed in Experiment 1).
To confirm SPIO labeling of hMSCs, antidextran FITC (Stemcell Technologies, Grenoble, France) was employed to stain for SPIOs as SPIOs consists of an iron crystal coated with dextran. Biotinylated cells were exposed to anti-biotin-SPIOs or anti-H2K SPIOs (mock labeling) as detailed in Experiment 1 and underwent staining with antidextran-FITC according to the manufacturer's instructions (1:200 dilution) and counterstaining with DAPI for visualization by fluorescence microscopy. SPIO labeling was also confirmed by in vitro MRI (as performed in Experiment 1).
Effect of Surface Chemical Biotinylation on hMSC Viability and Differentiation
Viability of SPIO-labeled biotinylated cells and non-SPIO (nonbiotinylated) labeled hMSCs was assessed by trypan blue exclusion as detailed in Experiment 2. Following viability assessment, hMSCs were plated and cultured as before, prior to induction of differentiation to osteocytes or adipocytes.
hMSC proliferation was assessed by plating 2 × 10⁵ SPIO-labeled cells or mock biotinylated cells at low density. Cells were cultured for 28 days, washed, and removed with 0.05% trypsin-EDTA and counted.
To evaluate treatment on hMSC differentiation, hMSCs were differentiated for 14 days in adipogenic or osteogenic media. Adipogenic media consisted of DMEM, supplemented with 10% FCS and hydrocortisone, isobutylmethylxanthine, and indomethacin. Osteogenic media was composed of DMEM, supplemented with dexamethasone, ascorbate-phosphate, and β-glycer-olphosphate. The presence of adipocytes and osteocytes was confirmed by staining of lipid by Oil red O and calcium by Alizarin red.
MRI Studies
In Vitro Studies
Biotinylated (two groups, SPIO labeled and non-SPIO labeled; n = 3 per group) hMSC pellets (106) were suspended in 1% agarose and in vitro MRI performed (as described previously in Experiment 1), and pellet T2 values measured.
In Vivo Studies
In vivo MRI studies were preformed as previously described in Experiment 1 except hMSCs were implanted into the flanks of C57BL/6 mice (n = 2, Harlan) and T2-weighted MRI performed. Parameters for MRI were: TR = 1000 ms; TE = 20 ms; FOV = 40 × 40 mm; matrix size = 256 × 128; 1 scan and 20 contiguous slices of 2 mm thickness. MRI was performed following implantation and at days 1 and 2 postimplantation.
Results
Experiment 1: Chemical Biotinylation and Labeling of a Human Cancer Cell Line
Confirmation and Persistence of Biotinylation
The aqueous chemical biotinylation of cells by NHS-PEO4-biotin was confirmed by fluorescence microscopy following anti-biotin FITC labeling (Fig. 1A and B). By flow cytometry, biotinylation was observed to persist at high levels (>99%) during days 0–3 after biotinylation but decreased to <1% by day 6 postbiotinylation (Table 1). Biotinylation of cells was also achieved by biotin-X-NHS (a lipophilic biotinylation agent) and was found to be comparable to biotinylation with NHS-PEO4-Biotin (Table 1).

Fluorescence microscopy images of (A) biotinylated and (B) nonbiotinylated IGROV cells stained with anti-biotin FITC; (C) T2-weighted MRI image (TE/TR = 50/3000 ms) of biotinylated cell pellets incubated with anti-biotin SPIOs (SPIO labeled) or anti-H2K SPIOs (negative control) obtained at 4.7 T, showing signal attenuation of the biotinylated cells labeled with SPIOs.
Percentage of IGROV1 Cells Biotinylated With NHS-PEO4-Biotin and Biotin-X-NHS at Various Times After Biotinylation (Cells Biotinylated on Day 0)
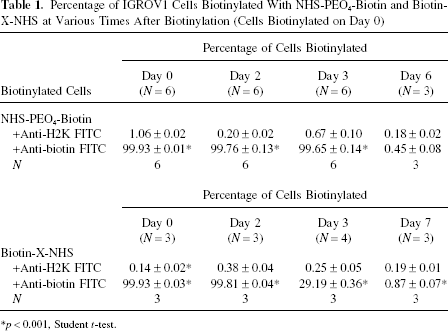
p < 0.001, Student t-test.
Effect of Biotinylation on Proliferation, Cell Viability, and Death
The proliferation of IGROV1 cells was unaffected by biotinylation. Over the initial 24 h after biotinylation, the biotinylated cells multiplied by 9.2 ± 1.0 times compared to 10.0 ± 0.7 for the mock biotinylated cells.
Biotinylation of cells with the NHS-PEO4-biotin reagent did not significantly affect cell viability as assessed by trypan blue exclusion (Table 2). On day 0–3 after biotinylation, similar percentages of dead cells were observed between the biotinylated and nonbiotinylated cell populations. At day 7, a small but significant (p < 0.05) increase in dead cells was observed in the former population (Table 2).
Effect of Biotinylation With NHS-PEO4-Biotin on IGROV1 Cell Viability (as Assessed by Trypan Blue Exclusion) and Cell Death (Annexin V and Propidium-Positive Cells) (Cells Were Biotinylated on Day 0)
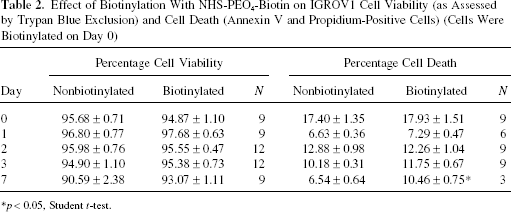
p < 0.05, Student t-test.
MRI Studies
The T2 values of agarose pellets containing biotinylated cells (with NHS-PEO4-biotin) incubated with anti-biotin SPIOs (8.67 ± 0.38 ms) were shown to be significantly shorter (p < 0.001) than those incubated with anti-H2K SPIOs (75.24 ± 1.75 ms), indicating specific labeling of the biotinylated cells by anti-biotin SPIOs. This is consistent with the signal loss observed for the biotinylated cells labeled with anti-biotin SPIOs by T2-weighted MRI (TE/TR, echo time/repetition time of 50/3000 ms) compared to non-SPIO-labeled cells (Fig. 1C). Furthermore, SPIO-labeled biotinylated cells injected intramuscularly in the hind legs of Balb/c nude mice exhibited signal attenuation by FLASH MRI compared to the non-SPIO-labeled biotinylated cells injected into the contralateral leg (Fig. 2A).

(A) Two consecutive transverse 9.4 T FLASH MRI images of a Balb/c nude mouse showing signal loss from intramuscularly injected biotinylated IGROV1 cells labeled with anti-biotin SPIOs in one hind leg (i) compared to biotinylated cells exposed to anti-H2K SPIOs (negative control) in the contralateral leg (ii). (The femur is outlined in blue on the images.) Photomicrographs showing positive Prussian blue staining of the hind leg muscles of a Balb/c nude mouse following intramuscular injection of biotinylated cells previously incubated with (B) anti-biotin SPIOs (SPIO labeled) compared to (C) cells incubated with anti-H2K SPIOs (negative control).
Histochemical Analysis
Positive Prussian blue staining of SPIO-labeled cells (Fig. 2B) confirms the presence of SPIO associated with biotinylated cells and consistent with the signal loss observed in the MRI image of these cells compared to non-SPIO-labeled cells.
Experiment 2: Serial Monitoring of SPIO-Labeled Chemically Biotinylated Cells in a Subcutaneous Implant Model
Signal reduction by T2-weighted MRI was observed from the implanted SPIO-labeled biotinylated cells compared to the implanted non-SPIO-labeled biotinylated cells (Fig. 3A). The SI was significantly decreased immediately after, and at day 1,2, and 3 after implantation (Fig. 3B). The decreased SI of the SPIO-labeled biotinylated cells is consistent with the presence of SPIOs and confirmed by Prussian blue histological staining (data not shown) and by semiquantitative XRF mapping of iron (Fig. 4). The cell implant consisting of SPIO-labeled biotinylated cells had a mean iron level of 68.9 ± 30.3 (mean ± SD, arbitrary units) compared to 23.9 ± 23.4, in the non-SPIO biotinylated cells. The XRF maps also provides quantitative iron distribution of the cell implants, showing iron is elevated throughout the SPIO-labeled cell implant compared to the non-SPIO-labeled cell implant. This suggests that the cell population of the former implant is SPIO-labeled. The few clusters of relatively high iron content observed in the non-SPIO-labeled cell implant may arise from non-specific SPIO labeling.

(A) Transverse MRI image showing signal loss from SPIO-labeled biotinylated IGROV1 cells compared to non-SPIO-labeled cells 3 days after subcutaneous implantation in the flanks of a nude Balb/c mouse and (B) graph illustrating the greater signal attenuation of the SPIO-labeled compared to non-SPIO-labeled cells for up to 3 days postimplantation. **p < 0.01 and ***p < 0.001, respectively.

Photographs of the wax-embedded sections of SPIO-labeled (A) and non-SPIO-labeled IGROV1 subcutaneous cell implants (C) at day 3 postimplantation mounted on XRF slides and their corresponding XRF iron maps (B and D, respectively). The SPIO-labeled cell implant displays higher levels of iron throughout the implant (B) compared to the non-SPIO-labeled implant (D). The intensity scales are in arbitrary units.
Experiment 3: Chemical Biotinylation and SPIO Labeling of hMSCs
Confirmation of Chemical Biotinylation and SPIO Labeling of hMSCs
Cell surface biotinylation of hMSCs was confirmed by staining with anti-biotin FITC and fluorescence detection by both microscopy and flow cytometry (Fig. 5A and B). Subsequent labeling of hMSCs by anti-biotin SPIOs was indicated by staining with anti-dextran-FITC and fluorescence microscopy (Fig. 5C and D).

Confirmation of chemical biotinylation of hMSCs by (A) fluorescence microscopy and (B) flow cytometry, following staining with anti-biotin-FITC; (C) confirmation of SPIO labeling of biotinylated cells exposed to anti-biotin SPIOs with (D) negative control cells exposed to anti-H2K SPIOs, by fluorescence microscopy following anti-dextran-FITC staining and counterstained with DAPI. (E) Differentiation of hMSCs into adipocytes (Oil red O staining) and osteocytes (Alizarin red staining) were unaffected by chemical biotinylation and SPIO labeling. (F) MRI image showing SPIO-labeled hMSCs had lower signal intensity than non-SPIO-labeled hMSCs by T2-weighted MRI (TE/TR = 50/3000 ms) and (G) T2-weighted MRI (TE/TR = 20/1000 ms) of SPIO-labeled and non-SPIO-labeled hMSCs, 2 days after implantation in the flanks of a C57BL/6 mouse.
Effect of Chemical Biotinylation and SPIO Labeling on Viability, Proliferation, and Differentiation of hMSCs
Biotinylated hMSCs, labeled with anti-biotin SPIOs, had similar viabilities to sham biotinylated hMSCs also exposed to anti-biotin SPIOs, as assessed by trypan blue (95.7 ± 2.7% vs. 95.7 ± 2.2%, n = 6, respectively). Similar rates of cell proliferation were observed between those labeled (6.2 ± 0.6-fold increase, n = 3) and unlabeled cell (6.6 ± 0.6-fold increase, n = 3) populations over a 4-week period. SPIO-labeled hMSCs displayed preserved osteogenic and adipogenic differentiation (Fig. 5E).
MRI Studies
The SPIO-labeled hMSCs agarose pellets (0.05 ± 0.04 ms) had significantly reduced T2 values (p < 0.05) compared to non-SPIO-labeled (0.20 ± 0.02 ms) hMSC agarose pellets (Fig. 5F), suggesting that indeed the former cell population was SPIO labeled. This is consistent with the greater signal loss of the flank-implanted SPIO-labeled implanted hMSCs compared to the non-SPIO-labeled hMSCs in the MRI image by T2-weighted MRI at day 2 postimplantation (Fig. 5G).
Discussion
This study illustrates for the first time the use of chemically biotinylated cells and their subsequent ex vivo labeling with anti-biotin conjugated to SPIOs, for tracking by MRI in vivo. Further, the study demonstrates the original application of spatial iron mapping by XRF to determine the degree and extent of iron in a SPIO-labeled cell population, for correlation with MRI data.
While chemical biotinylation of cells has been used to detect selected cells by flow cytometry and surface protein expression, this methodology has not been previously used to label cells for in vivo tracking. A number of methods have been previously proposed for labeling cells for MRI, including the use of SPIOs with or without transfection agents (13, 14), although such techniques may alter aspects of stem cell behavior. Relatively more recently, magnetoelectroporation was proposed as a method of labeling stem cells for MRI (37), negating the need to incubate cells for long periods with contrast agents for labeling, although potentially, electroporation may adversely affect cell viability (7). The methodology we propose in the present study is both rapid and applicable to all cell types, and shown by us and others (17, 21, 26, 29) to have nondetrimental effects on cell viability or cell death. Further, cell functions such as proliferative activity (17, 29), cell adhesion (21), and morphology (26) has been demonstrated to be unaffected by cell surface biotinylation. Thus, the introduction of such a small molecule as biotin on the cell surface appears to have minimal impact on the cell and such surface labeling by SPIOs may alleviate any possible detrimental effects arising from internalization of the MRI contrast agent.
MRI has been used to image SPIO-conjugated antibodies or antibody fragments in diagnostics (2, 5, 9, 19, 27, 32, 35, 38, 39), imaging of transgene expression (31), and cell tracking (6, 22). Exploiting the biotin-streptavidinavidin interactions, cells have been labeled for MRI by binding of streptavidin or avidin conjugated to SPIOs or gadolinium chelates to endogenous surface antigens (e.g., the Her-2/neu and tissue factor receptors) (2, 3, 23). Such studies have involved the use of biotinylated antibodies raised to specific antigens on the cell surface; in our study, we have enabled labeling of cells by the nondetrimental chemical introduction of a biotin tag on the surface of the cell.
Biotinylation of cellular proteins of mammalian cells has previously been achieved metabolically (25). Tannous et al. (34) utilized similar molecular biological techniques to express biotin on the cell surface for MRI visualization with streptavidin SPIOs. This metabolic method is heavily reliant on the ability to transfer DNA encoding the nonbiotinylated protein, biotinylation of the expressed protein, and then its subsequent transport to the plasma membrane. Construction of the gene transfer vector is time consuming, requiring molecular biological expertise, and also actual gene transfer can often be fraught with problems, thus limiting access of the metabolic biotinylation strategy. Further, metabolic biotinylation is usually inefficient, particularly in mammalian cells, and biotin ligase needs to be coexpressed to biotinylate secreted proteins (10, 24). Conversely, chemical biotinylation is a one-step chemical reaction that can robustly label any cell of interest rapidly (<1 h), requiring minimal materials and equipment.
Both aqueous and nonaqueous biotinyation agents, employed in this study, showed similar abilities to chemically biotinylate cancer cells (>95% of the cell population). Almost all cells remained biotinylated for 3 days, irrespective of the biotinylation agent used, although Hoffman-Fezer et al. (18) suggest the possibility of prolonged cell biotinylation by the use of a nonaqueous biotinylation agent. However, Singh et al. (29) showed the persistence of surface biotinylation to be dependent on the cellular proliferation rate such that at day 20 only 36% of an actively dividing splenocyte population remained biotinylated compared to 53% of the non-dividing splenocyte population. Thus, the lack of sustained biotinylation of the IGROV1 cells is not surprising due to their rapid 20 h doubling rate (4).
In this study, we have also shown the ability to label different cell types, including a therapeutically relevant cell type (hMSCs) for in vivo monitoring by MRI. Chemical biotinylation and subsequent labeling with anti-biotin SPIOs appear to have little or no effect on viability, proliferation or multipotentiality of hMSCs.
Chemical biotinylation of cells and their labeling with anti-biotin, streptavidin, or avidin SPIOs for MRI is therefore mainly applicable for tracking nonproliferating cells or relatively short-term tracking of proliferating cells (e.g., addressing where the cells have been implanted or have reached their target). However, this method provides a practical, robust, and generic method for labeling of a range of cell types for MRI visualization. Furthermore, the components used in this method (i.e., anti-biotin SPIOs) can be manufactured to GMP standards and thus can be used clinically.
Determining the relationship between cellular levels of SPIO labeling and MRI-detectable changes has become an important aspect of validating the true value of emerging cell-labeling techniques. In the present study, we have demonstrated, for the first time, the use of spatial iron mapping by a relatively new synchrotron imaging technology, rapid-scanning XRF, to determine the degree and extent of iron in a SPIO-labeled cell population. For XRF, samples are bombarded with high-energy photons, which if they are of sufficient energy, will free inner shell electrons from the atom, resulting in a core hole. As outer shell electrons fill this hole, a photon equivalent to the energy difference between the shells is released. The energy release is element specific, allowing specific mapping of elements throughout the sample. Thus, XRF data allow confirmation of whether the signal reduction observed by FLASH and T2-weighted MRI, and decreases in T2 values, are related to increased iron content (due to the presence of SPIOs) rather than changes in tissue structure or water content.
In this study, XRF independently confirmed that the signal loss (by FLASH and T2-weighted MRI) and decreased T2 values measured from SPIO-labeled cells arise from the presence of increased iron (SPIOs) rather than changes in tissue structure or water content. Histochemical and immunofluorescent staining with Prussian blue and anti-dextran FITC, respectively, both also employed in this study, are commonly used in cell labeling studies with SPIOs to confirm SPIO labeling and distribution. However, staining for dextran may be inaccurate due to possible metabolism of the dextran coating. Histochemical staining may also be inaccurate due to nonspecific staining and nonlinear responses to varying iron concentrations. Furthermore, the staining may be reduced by formalin fixation as observed in studies to detect the presence of iron in amyloid plaques (30). Indeed, conventional Prussian blue staining is known to be relatively insensitive and attempts to enhance staining have been developed for SPIO studies (30). Quantitative assessment of iron content has also been done on bulk tissues by biochemical measurements, atomic absorption spectrometry, or inductively coupled plasma spectrometry to determine SPIO accumulation in cell tracking studies. However, disagreements between such data and histochemical data may be observed because the former averages adjacent areas of high and low iron, rendering the source of signal loss in the MR difficult to resolve readily. By employment of XRF, we have validated our novel methodology to label different cell types with SPIOs for tracking in vivo by MRI.
Conclusion
In conclusion, chemical biotinylation of the cell surface protein moieties is a readily achievable, robust, rapid, nondetrimental, and clinically applicable method of labeling a range of cells for monitoring by MRI in vivo.
Footnotes
Acknowledgments
We would like to thank Ian McNeish for his gift of IGROV1 cells and David Miranda Luna for inspiration. We would like to thank the Wellcome Trust for funding the Biological Imaging Centre, Imperial College London and the Medical Research Council (UK) for funding, and the Guarantors of Brain for supporting D.H. The XRF work was supported by the European Community—Research infrastructure action under the FP6-programmes: “Structuring the European Research Area.”