
Abstract
In the current study cell labeling was performed with water-soluble gadolinium (Gd)-DTPA containing liposomes, to allow for cell tracking by MRI. Liposomes were used to assure a highly concentrated intracellular build up of Gd, aiming to overcome the relatively low MRI sensitivity of Gd (compared to T2 contrast agents). Liposomes were positively charged (cationic) to facilitate uptake by binding to anionic charges in the cell membrane of bone marrow-derived mesenchymal stem cells (MSCs). We determined the cellular Gd load by variations in labeling time (1, 4, and 24 h) and liposome concentration (125, 250, 500, 1000 μM lipid), closely monitoring effects on cell viability, proliferation rate, and differentiation ability. Labeling was both time and dose dependent. Labeling for 4 h was most efficient regarding the combination of processing time and final cellular Gd uptake. Labeling for 4 h with low-dose concentration (125 μM lipid, corresponding to 52 ± 3 μM Gd) yielded an intracellular load of 30 ± 2.5 pg Gd cell–1, without any effects on cell viability, proliferation, and cell differentiation. Gd liposomes, colabeled with fluorescent dyes, exhibited a prolonged cellular retention, with an endosomal distribution pattern. In vitro assay over 20 days demonstrated a drop in the average Gd load per cell, as a result of mitosis. However, there was no significant change in the sum of the Gd load in all daughter cells at endpoint (20 days), indicating an excellent cellular retention of Gd. MSCs labeled with Gd liposomes were imaged with MRI at both 1.5T and 3.0T, resulting in excellent visualization both in vitro and in vivo. Prolonged in vivo imaging of 500,000 Gd-labeled cells was possible for at least 2 weeks (3.0T). In conclusion, Gd-loaded cationic liposomes (125 μM lipid) are an excellent candidate to label cells, without detrimental effects on cell viability, proliferation, and differentiation, and can be visualized by MRI.
Keywords
Introduction
In vivo cell tracking is a growing field of research because it is considered to be a crucial technology for the development and implementation of cell therapy. Cell therapy in itself holds great promise for a variety of diseases and disorders such as cancer, cardiovascular disease, neurodegenerative diseases, and musculoskeletal disorders by providing unique opportunities for tissue regeneration and targeted therapy or drug delivery (13,14,18,48). In both pre-clinical and clinical studies, therapeutic benefit of cell therapy for all these aspects has been demonstrated (7,8,17,33,40,62). However, the success has been limited and variable, and the processes by which stem cell therapy results in therapeutic benefit are also poorly understood. Therefore, the ability to track the fate of transplanted cells in vivo has been the focus of increasing numbers of research efforts.
Currently, magnetic resonance imaging (MRI) is considered the modality of choice for in vivo cell tracking in patients and large animals due to its high spatial resolution. In order to visualize cells by MRI, incorporation of MRI contrast agents (CAs) by the cells of interest is required. Two main classes of CAs are being used for this purpose: paramagnetic substances (T1 shortening CAs) like gadolinium (Gd) chelates (20,37) and superparamagnetic particles (T2 shortening CAs), which are mainly iron oxide based (12,26,34,43). Generally, the latter allow for more sensitive imaging, easier incorporation into the cell, and harbor less intrinsic toxicity (16). This has led to a vast amount of studies using a variety of iron oxide particles and labeling procedures (6,11,21,35,37,46,49,51,52,58,60,61). These studies showed that for virtually every cell type, sufficient iron oxide can be incorporated in the cell allowing for sensitive detection, even at single cell level, without apparent toxic effects (6,37).
However, the use of T2 CAs in cell tracking carries several disadvantages regarding image interpretation. Firstly, T2 CAs cause a signal loss that may be confused with (patho)physiological conditions such as hemorrhage, blood flow, or air pockets (25,42,56) or with areas containing an endogenous high iron content, such as the liver, the spleen, or tumors like melanomas. Secondly, due to susceptibility artifacts, the size of a cell cluster will be heavily overestimated on MRI. This will severely hamper interpretation of surrounding anatomical structures in a cell graft. Thirdly, iron oxide particles are susceptible to reuptake by macrophages in vivo (39,41), which is especially relevant during direct cell implantation, because of the concurrent high cell death rates. Finally, T2 CAs are best visualized by T2-weighted sequences, which have an inherently lower signal-to-noise ratio than T1-weighted images.
More recently, Gd chelates have been receiving increasing interest as an intracellular imaging probe (1,4,15,28,53). One of the main advantages of Gd chelates over T2 CAs is their predominant positive contrast effect due to T1 shortening. Furthermore, as a result of its low molecular weight, the Gd chelate can escape macrophage reuptake after cellular release due to, for example, cell death. This is a highly important advantage in the in vivo setting as it contributes to a high specificity of the MRI signal, aiding the assessment of overall cell viability after cell transplantion.
In this report the use of the clinically approved Gd diethylenetriaminepentaacetic acid (Gd-DTPA) in cell labeling was studied. As Gd has an inherently relatively low MR sensitivity, cationic liposomes were used to concentrate the Gd, allowing a high intracellular build up (57). The rationale behind making them cationic was to improve uptake by binding to anionic charges in the cell membrane. Liposomes have already widely been used for both diagnostic (16,28,35) and therapeutic purposes (2,30,47) or combinations thereof (29) and are a well-known vehicle in DNA transfection studies (24,27,32). The most exciting feature is their versatility. Both the constituents in the aqueous core and surface properties can be modulated, allowing a combination of a diagnostic tracer with a therapeutic one (“theragnostics”). In order to facilitate a successful clinical translation of Gd liposomes as a MRI tracer in cell tracking, efforts have to be made to assess the effects on cell behavior and viability and to overcome sensitivity issues by improving labeling efficiencies. These issues have been hardly addressed so far. In this study these issues were addressed using bone marrow-derived mesenchymal stem cells.
Materials and Methods
Liposome Preparation
Gd-DTPA was incorporated in cationic liposomes using the lipid-film hydration technique. A 100 μmol mixture of 1,2-dipalmitoyl-sn-glycero-3-phosphocholine (DPPC; Lipoid GmbH, Ludwigshafen, Germany), cholesterol (Sigma-Aldrich, St. Louis, MO, USA), 1,2-dioleoyl-3-trimethylammonium-propane (chloride salt) (DOTAP; Avanti Polar lipids, Alabaster, AL, USA) in the molar ratio 47:33:20 was dissolved in chloroform/methanol 2:1 (v/v) and evaporated in vacuo using a rotary evaporator (Büchi Rotavapor R-210, Büchi Labortechnik, Flawil, Switzerland).
The lipid film was subsequently hydrated in either 4-(2-hydroxyethyl)-1-piperazineethanesulfonic acid (HEPES) buffered saline (20 mM HEPES, 135 mM NaCl, pH adjusted to 7.4) or Gd-DTPA (Magnevist; Bayer Schering Pharma AG, Berlin, Germany) to create control liposomes and paramagnetic liposomes, respectively.
Liposome solutions were extruded at 45°C through a high-pressure Lipex thermoline extruder (Northern Lipids Inc, Vancouver, Canada) by sequential passing through Nuclepore polycarbonate membrane filters (Whatman, Newton, MA, USA) with pore diameters of 200, 100, and 50 nm. Five extrusion steps were applied per filter type. The resulting solution was ultracentrifuged twice (Beckman Coulter, Fullerton, CA, USA) at 300,000 times; g (4°C). Supernatant was discarded. The resulting liposome pellet was typically resuspended in 2 ml HEPES.
Characterization of Liposomes
The average diameter and size distribution of the liposomes in the final formulation were determined by dynamic light scattering (DLS) using a Zetasizer Nano (Malvern Instruments, Worcestershire, UK). The mean resultant size of different batches of Gd-DTPA liposomes as determined by DLS was 111–123 nm with a polydispersity index (PDI) of 0.04–0.09, whereas HEPES control liposomes were slightly larger with sizes 114–129 nm (PDI 0.06–0.12). The zeta potential was 43 ± 7.0 mV.
Relative Gd content was determined by Inductively Coupled Plasma-Optical Emission Spectroscopy (ICP-OES) and was 66 ± 4 μg Gd/μmol total lipid. Liposomal phosphate content was assessed by spectrophotometric analysis according to Rouser et al. (44).
Cell Culture and Cell Labeling
Rat mesenchymal stem cells (MSCs; Millipore, Billerica, MA, USA) of passage 3 or 4 were used for all experiments at 70% subconfluency. MSCs were cultured in a humidified CO2 incubator (Heraeus, Hanau, Germany) at 37°C and 5% CO2 in Dulbecco's modified Eagle medium (Invitrogen, Carlsbad, CA, USA) supplemented with 2% fetal bovine serum (FBS; Lonza, Basel, Switzerland), 2% penicillin/streptomycin (Invitrogen), 2% L-glutamine (Invitrogen), 1% MEM essential vitamin mixture (Lonza), 1% nonessential amino acids (NEAA; Sigma-Aldrich), and 0.5% glutamax (Invitrogen). Unless stated otherwise, cells were grown in 75-cm2 flat-bottom flasks (Corning, NY, USA). (As determined by the spectrophotometric analysis lipid concentration in each liposome batch was known). Cell labeling was performed on basis of lipid concentration. Lipid concentration in various experiments was 125, 250, 500, or 1000 μM, corresponding to 52 ± 3, 104 ± 6, 209 ± 13, and 420 ± 25 μM Gd, respectively. Control cells were incubated with HEPES-containing liposomes. Labeling was performed for 4 h, unless otherwise stated. Cells were detached using accutase (Millipore) and underwent three washing steps in prewarmed phosphate-buffered saline (PBS). Following harvesting, cells were centrifuged at 300 × g for 5 min to acquire a cell pellet.
Uptake Efficiency and Gd Content Measurement
To assess the uptake efficiency as a function of labeling time (i.e., 1, 4, 24 h) and lipid dosage (i.e., 0, 125, 250, 500, and 1000 μM total lipid) 4 × 10s MSCs were seeded in 25-cm2 flasks and labeled with Gd liposomes at the indicated doses for the indicated times, resulting in 15 groups. The entire experiment was performed in triplicate.
Following incubation, cells were washed, harvested, and centrifuged. Supernatant was then carefully aspirated and the obtained cell pellet was suspended in PBS allowing cells to be counted in a hemocytometer. After a second centrifugation step the cell pellet was suspended in 4 ml. Triton X-100 2% (Sigma-Aldrich). This solution was heated up at 55°C in a thermoshaker and mixed for 30 min at 6 × g to induce cellular and liposomal lysis. Three aliquots of 20 μl Gd liposomes were treated with Triton and vortexed as well. Both the total amount of internalized Gd and liposomal Gd were then measured using inductively coupled plasma-optical emission spectroscopy (ICP-OES; Optima 4300DV, Perkin Elmer, Norwalk, CT) operating at a wavelength of 342 nm. Cellular uptake efficiency was calculated as
where Gdpellet is defined as the total amount of Gd in the harvested cell pellet and Gdliposomal the amount of Gd in liposomes added to the culture medium. Counting the cells in the harvested pellet (Ncells), the mean cellular Gd concentration was derived from

In Vitro Toxicity Assay
Unless stated otherwise, all assays were performed with separate groups undergoing labeling with increasing dosages of Gd-DTPA liposomes (i.e., 0, 125, 250, 500, and 1000 μM lipid). All experiments were performed in triplicate.
Putative dose-dependent cytotoxicity of Gd liposomes was studied with MTT assays in a 96-well plate. Additional experiments were included to study a possible specific cytotoxic effect of the Gd-DTPA component, comparing effects on cells labeled with either Gd liposomes or with control liposomes containing HEPES buffer only. The MTT assay is based on the reduction of yellow MTT [3-(4,5-dimethylthiazol-2-yl)-2,5-diphenyl tetrazolium bromide] to purple formazan by living cells (38). In both experiments MSCs from the same batch were cultured (1.0 × 10⁴ MSCs/well) overnight in 100 μl culture medium in quintuplets, followed by 4-h labeling at 70% subconfluency. At end of labeling, cells were washed three times with PBS with care in order not to destruct the monolayer. Twenty-four hours after start of labeling MTT substrate (5 μg/μl) was filtered through a 0.2-μm filter membrane followed by addition of 50 μl to each well. Plates were then incubated for 3 h at 37°C, followed by centrifugation. Medium was carefully aspirated and 100 μl dimethyl sulfoxide (DMSO) was added to each well to lyse the cells and dissolve the insoluble formazan product. Absorbance was recorded after 30 min at 490 nm using a 96 well-plate reader (Victor2, Perkin Elmer, Norwalk, CT, USA). For internal validation of the MTT assay, the correlation between cell amount and absorbance was assessed by inclusion of a serial dilution of unlabeled cells, ranging from 4.0 × 10² to 2.5 × 10⁴ cells per well.
Proliferation and Gd Retention Assay
Long-term effects on proliferation were studied on cells that had been labeled for 4 h with the previous mentioned dosages of Gd-DTPA liposomes. MSCs were counted in a hemocytometer on days 4, 7, 11, 15, and 20. Nonviable MSCs were included in the cell count as well, to avoid any bias from possible differences in cell death rates. At each time point culturing was consistently continued with 7.5 × 10⁵ MSCs only, maintaining a practical workflow. Simultaneously, MSCs were collected and spun down at 300 m/s2 for 5 min in triplicate. Total harvested Gd load of these samples was measured by ICP-OES in order to assess possible extracellular leakage of Gd.
Differentiation Assay
Effects of labeling with Gd-DTPA liposomes on the multilineage capacity of MSCs was determined. For this purpose 6 times; 104 MSCs were seeded per well in 24-well plates and allowed to form a confluent monolayer. Adipogenesis was stimulated for 20 days using both adipogenesis induction and maintenance medium (Millipore, Billerica, MA, USA) in three cycles, whereas osteogenesis was promoted for 13 days with osteogenesis induction medium (Millipore, Billerica, MA, USA). Finally, Oil Red O and Alizarin Red staining were performed in separate plates to detect adipocytes and osteocytes, respectively.
Confocal Laser Scanning Microscopy
To study the integrity of liposomes following endocytosis, 0.1 mol% of rhodamine-PE (Avanti Polar lipids) was added during liposome preparation, serving as a fluorescent bilayer marker. The water-soluble, membrane-impermeable dye calcein (Sigma-Aldrich) was added to the hydration solution at a concentration of 12 μM, at which concentration its fluorescence is maximal (3). MSCs were labeled for 4 h, washed three times with PBS, and imaged for 62 h using a LSM 510 META confocal microscope (Zeiss, Oberkochen, Germany) in a closed humidified chamber at 37°C and 5% CO2. Hoechst 33258 was used as a nuclear stain. Detailed examination was done using a 40× oil-immersion objective lens (NA 1.3). Scans were made in multitrack mode with a 405 nm diode laser for Hoechst 33258 excitation (420–480 nm BP filter), a 488 nm Argon laser for calcein (505–530 nm BP filter), and a 543 nm helium-neon laser for rhodamine (560–615 nm BP filter). MetaFluor software (Molecular Devices, Downingtown, PA, USA) was used for instrument control and image acquisition. Images were analyzed using Zeiss LSM Image Browser 4.2.0. Considering the broad bandwidths and asymmetrical spectral profiles of both calcein and rhodamine, band pass filters were set rationally to prevent cross-talk of fluorescence signal from both fluorophores. Nevertheless, additional control experiments were performed to confirm the absence of cross-talk, using single fluorophore-labeled liposomes containing either calcein or rhodamine. All experiments were recorded with the same laser settings.
MR Imaging
Data acquisition was performed on a 1.5T (in vitro only) and on a 3.0T (in vitro and in vivo) clinical MRI scanner (Signa Excite; GE Medical Systems, Milwaukee IL, USA) using unmodified gradients and custom made surface coils with an inner diameter of 2 cm.
To study the MRI behavior of Gd liposome-labeled MSCs in vitro, a stock solution of 1.84 times; 105 labeled MSCs in 0.3% liquid agar (BD, Sparks, MD, USA) was prepared. Care was taken to acquire a homogeneous suspension without formation of air bubbles. By serial dilution eight concentrations in the range of 1.84 times; 105–1.45 times; 103 cells μl–1 agar were prepared and filled out in a 384-well plate. Surrounding wells were filled with water to prevent air-induced susceptibility artifacts. To produce T1-weighted images, the plates were imaged using a 2D spin-echo sequence with echo time (TE) = 10 ms and repetition time (TR) = 500 ms, a resolution of 40 times; 40 μm2 [field of view (FOV) 2 × 2 cm, matrix 512 times; 512), one acquisition, and a slice thickness of 1.4 mm. The plates were scanned at room temperature (20°C).
For in vivo imaging a suspension of 0.5 times; 106 MSCs in 20 μl PBS was injected subcutaneously or intramuscularly in the hind limb of Wistar rats (Harlan, Horst, the Netherlands). As a control, nonviable cells were injected as well. Cells were killed by repeated freeze–thawing (in liquid nitrogen). Viability was then checked by trypane blue assay.
For scanning, rats were anesthetized by IP injection of sufentanil and medethomidine both at 300 μg/kg body weight. Animals were scanned repeatedly over a 2-week period at days 0, 5, and 14. A 3D spoiled gradient recalled (SPGR) sequence (with fat suppression) was applied, with TE = 3.0 ms, TR = 30 ms and α = 30°, at a resolution of 125 times; 125 μm2, and a slice thickness of 400 μm. This resulted in an acquisition time of 20 min.
Animals were housed under standard conditions of light and accommodation, and were fed a standard laboratory diet ad libitum. All experiments with animals were performed with prior approval of the institutional animal care committee. After the 14-day follow-up period animals were euthanized.
Histology
For histological purposes, cells were labeled with liposomes containing rhodamine-phycoerythrin (PE) (Avanti Polar lipids) and in some instances also with the nuclear dye Hoechst (Sigma-Aldrich). Hoechst was thus used to label cells with prior to intramuscular injection, not as a counterstain. Animals were sacrificed at day 1 or 5 after injection. Muscular tissue at the injection site was then carefully dissected out, cryopreserved in OCT Tissue-TEK (Sakura Europe, Alphen aan den Rijn, the Netherlands), and cryosectioned at 10-μm slices.
Statistical Analysis
All values are presented as mean ± SD from triplicates and expressed in relation to unlabeled cells. Statistical significance between selected groups in both the viability and proliferation assay were determined with one-way ANOVA; for viability a Bonferroni post hoc test was applied for selected pairs (Graphpad InStat 3.06; Graphpad Software Inc., San Diego, CA, USA). The degree of significance is given when appropriate (*p < 0.05; **p < 0.01; ***p < 0.001).
Results
Cellular Gd Uptake
A concentration-dependent increase in intracellular Gd load was observed with increasing Gd liposome concentration in the incubation medium (Fig. 1A). This trend was less obvious at 1-h exposure time. Intracellular Gd load was highest (70 ± 4 pg Gd cell–1) by labeling with 1000 μM lipid (420 ± 25 μM Gd) for 4 h.

Cellular uptake of gadolinium (Gd). Mesenchymal stem cells (MSCs) were incubated for 1, 4, or 24 h with 125, 250, 500, or 1000 μM Gd liposomes. A dose-dependent increase in Gd uptake with increasing load of Gd in the incubation medium can be recognized. Note the significantly higher intracellular Gd load after 4 h compared to both 1 and 24 h (A). No major significant difference between 4 and 24 h was observed in total harvested Gd (B) as well as uptake efficiency (C). The experiment was performed in triplicate. Data are displayed as means ± SD.
According to equation (1), for each labeling period, maximal uptake efficiency was achieved using 125 μM total lipid (Fig. 1B). Uptake efficiency was not significantly improved by prolonged incubation (>4 h). This is most likely caused by intracellular Gd dilution due to cell division, outweighing the de novo uptake of abundant Gd by daughter cells. Washout of Gd is considered less likely, as there was no striking difference in total harvested Gd after 4- and 24-h incubation time (Fig. 1C). As a result, considering time efficiency, further experiments focusing on cell behavior were conducted using the 4-h labeling protocol.
In Vitro Toxicity and Proliferation Assays
MTT assays demonstrated a dose-dependent cytotoxic effect of labeling with both unloaded and Gd-loaded liposomes (Fig. 2A). As a validation of the technique, a double dilution series of unlabeled cells showed a nice linear relation with the measured absorbance (Fig. 2B). No significant effect on cell viability was observed at low-dose liposome incubation (125 μM lipid) for both liposome types (p > 0.05). However, higher concentrations (≥250 μM lipid) affected viability slightly negative (p < 0.001) in a dose-dependent manner. This trend was observed for both unloaded and Gd-loaded liposomes. No statistically significant difference was found in viability of cells labeled with identical concentrations of either of the two liposome types, throughout the entire examined concentration range (p > 0.05). As a result, it can be stated that the decreased viability may be attributed to the lipid components, most probably DOTAP, rather than to Gd.

Viability by MTT assay as a function of Gd and lipid concentration. Labeling time was 4 h. Note the dose-dependent negative effect on cell survival at high lipid concentration (normalization to unlabeled control cells) (A). For each specific lipid dose, no significant difference (p > 0.05) in viability was found between the two liposome types. Linear relation between absorbance and unlabeled cell amount (B). Data are displayed as means ± SD.
Proliferation and Gd Retention Assay
Assessment of proliferation was done by cell count over a period of 20 days (Fig. 3). As it was derived from the viability assay, variations in cell death exist for different liposome concentrations (Fig. 3A). Therefore, both viable and nonviable MSCs were counted to exclude an influence on proliferation caused by differences in viability. Hence, it may be assumed that the growth rates reflect merely cellular mitosis. None of the investigated doses exhibited a significant reduction in proliferation rate (p > 0.05), compared to control unlabeled cells.

Proliferation assay of MSCs. The proliferation rate of labeled cells did not differ significantly (p > 0.05) from unlabeled control cells (A). Total harvested Gd load at each passage step is shown in (B). With ongoing proliferation, cellular Gd load decreased accordingly (C). Data in (A) and (B) are displayed as means ± SD. Data in (C) was calculated by dividing data points in (B) by corresponding data points in (A) (total harvested Gd load/No. of cells).
At various time points samples were taken for assessment of the total cellular Gd load. Due to mitosis, average Gd load per cell diminished rapidly (Fig. 3C). Data in Figure 3C were calculated by dividing data points in Figure 3B by corresponding data points in Figure 3A (total harvested Gd load/No. of cells). No significant drop in the total Gd load occurred at 125 μM lipid (52 ± 3 μM Gd) and 250 μM lipid (104 ± 6 μM Gd) (Fig. 3B). However, a small but significant (p < 0.05) decrease was observed with 500 μM lipid (209 ± 13 μM Gd) in the incubation medium. The decrease with this lipid dose may be explained by a lower harvested Gd amount, due to the relatively higher cell death (Fig. 2A). Even though care was taken to collect both viable and nonviable MSCs, it is possible that a reasonable amount of Gd from disintegrated nonviable cells was collected inadequately during centrifugation.
Adipogenesis and Osteogenesis
An important issue in imaging of stem cell transplantation is the preservation of differentiation ability upon incorporation of a tracer. Adipogenic and osteogenic differentiation were induced with in vitro cell cultures. Oil Red O staining revealed that MSC labeled with all tested Gd liposome concentrations (125–1000 μM lipid) underwent adipogenic differentiation with efficiencies similar to unlabeled cells. Oil vacuoles could be detected in nearly all Gd liposome-labeled MSCs, being phenotypically indistinguishable from unlabeled MSCs. In addition, Alizarin Red staining showed a sustained osteogenic differentiation potential of Gd-labeled MSCs (Fig. 4).

Cell differentiation assay. In vitro differentiation of MSCs is not inhibited by Gd-DTPA liposome labeling (shown are images of the highest incubation dose of 1000 μM lipid). Differentiation into adipocytes (Oil Red O stain) was unimpaired for both control MSCs (A) and MSCs labeled with 1000 μM lipid (B). Differentiation into osteocytes was unimpaired as well for both control cells (C) and cells labeled with 1000 μM lipid (D). White arrows in (A) and (B) point to a lipid vacuole. MSCs labeled with doses <1000 μM lipid exhibited similar differentiation phenotypes (data not shown).
Confocal Laser Scanning Microscopy
After labeling with 125 μM lipid (52 ± 3 μM Gd) for 4 h, viable MSCs were imaged for 56 h. Liposomes showed an intracellular accumulation, which was perinuclear in distribution. During the entire time range no obvious nuclear uptake was perceived. Based on the punctuate appearance of both the liposomal membrane-associated rhodamine (red) and the core-encapsulated calcein (green), liposomes most likely resided in endosomes rather than having a diffuse cytosolic distribution (Fig. 5A). No extracellular leakage of fluorescence was recorded during the experiment. Although in a labeled state, MSCs were demonstrated to undergo mitotis with a roughly equal distribution of liposomes among daughter cells (Fig. 5B).

Confocal fluorescence. Time-resolved confocal laser scanning microscope (CLSM) images of MSCs labeled with Gd liposomes (4 h), containing rhodamine in the bilayer and intraliposomal calcein. Images are bright field, with overlay from confocal fluorescence. Elapsed time after cell labeling is indicated. Colocalization of rhodamine (red) and calcein (green) fluorescence indicates intact liposomes, whereas the dotted appearance indicates an endosomal distribution. Note the absence of extracellular fluorescence leakage. Mitosis was unimpaired, with a roughly even distribution of liposomes over daughter cells (B). Indicated time represents elapsed time after start of mitosis. Scale bar is shown in the images.
Absence of cross-talk was confirmed in experiments using control liposomes, containing either rhodamine-PE or calcein only (data not shown).
MR Imaging
In vitro concentrations of Gd liposome-labeled MSCs in the range of 1.84 times; 105 to 1.45 times; 103 cells μl–1 agar were imaged to assess the signal intensity as a function of labeled cell concentration. On T1-weighted spin-echo (SE) images, the least cell concentration that could be discerned visually from surrounding water was assessed at 2.9 times; 103 and 5.8 times; 103 cells μl–1 agar at 3.0T and 1.5T, respectively (Fig. 6A, B).

MR imaging. T1-weighted images of MSCs labeled with 125 μM Gd liposomes for 4 h. The same cells were scanned at both 1.5T (A) and 3.0T (B). Wells filled with cells are demarcated by the white box. Cell concentrations on the top row, from left to right: 1.84 × 10⁵, 9.28 × 10⁴, 4.64 × 10⁴, and 2.32 × 10⁴ MSCs μl–1 agar. Lower row, from left to right: 1.16 × 10⁴, 5.80 × 10³, 2.90 × 10³, and 1.45 × 10³ MSCs μl–1 agar. Longitudinal tracking of viable Gd liposome-labeled MSCs (white arrow) in the rat hind leg (3D T1W imaging) imaged at days (C) 1, (D) 5, (E) 7, and (F) 14 after transplantation. Scale bars: 10 mm (scale bars in A applies to B, and scale bar in C applies to D–F).
Strikingly, 1.84 times; 105 cells μl–1 agar gave rise to a signal loss at 1.5T. This was even more profound at 3.0T (Fig. 6B). This is probably due to a major T2 shortening in very concentrated samples (5,9).

MR imaging. Gradient echo (GRE) image (TR 8 ms, TE ms, α = 30°) of both viable and nonviable Gd-labeled MSCs injected in the lower back muscle, imaged 1 h after injection. Viable MSCs are visible as hypoenhancement with a hyperintense rim (large arrow), whereas nonviable MSCs exhibit a hyperenhancement (small arrow). Scale bar: 10 mm.
Interestingly, the in vivo injected cell cluster in the hind limb exhibited a dualistic behavior. Injected cells were initially perceived as signal loss, slowly gaining in intensity over days (Fig. 6C). Nonviable cells were injected in vivo as well, as a control. Viability was checked prior to injection, showing 98% of cells to be nonviable. Nonviable cells showed a remarkable hyperenhancement, immediately after injection (Fig. 7).
Histology
On cryosections, cells could be retrieved at least at day 1 and day 5 after transplantation. Red fluorescence from the rhodamine liposomes was visible in a perinuclear pattern at both day 1 (Fig. 8A) and was still perceived at day 5 (Fig. 8D).
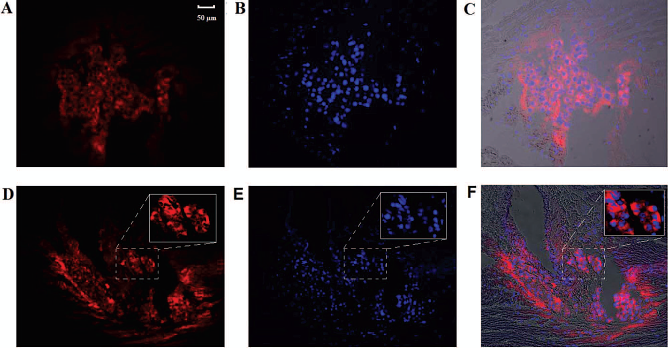
Histological detection of cells labeled with rhodamine containing liposomes. Intramuscular injected cells at day 1 (A–C) and day 5 (D–F) posttransplantation. Red fluorescence from the rhodamine liposomes is clearly visible (A, D). The blue nuclear dye Hoechst, which was added to the cells in culture prior to injection, shows the injected cells at both day 1 (B) and day 5 (E). Overlay images (C, F). The insets in frame (D), (E), and (F) show a 10× magnification of the area indicated by the dashed rectangle. Scale bar: 50 μm (applies to A–F).
Discussion
The achievement of a high intracellular load of CA is an important condition to localize or track cells in cellular imaging. This holds true especially for MRI, since its sensitivity is generally lower with respect to other imaging modalities such as single-photon emission computed tomography (SPECT) or bioluminescence (59). Gd-DTPA is a widely used MR contrast agent that is approved by the U.S. Food and Drug Administration. Being hydrophilic, Gd-DTPA is not taken up spontaneously by cells. This limitation was challenged in this study, by incorporation of Gd-DTPA in cationic liposomes allowing an efficient uptake by cells through binding to anionic charges in the cell membrane.
A dose-dependent decrease in cell viability was observed with Gd liposome doses increasing from 250 μM lipid, reaching a maximal decrease in viability of around 20% with 1000 μM lipid, the highest dose in this study. The decreased cell viability was also observed with empty, non Gd-containing liposomes, leading to the conclusion that the observed minor toxicity is caused by the cationic liposomes. With a different liposome formulation, in a recent study (28) no statistically significant reduction in labeled cell viability was reported for a lipid concentration up to 5 mM, using gadolinium diethylenetriaminepentaacetic acid-bis(stearylamide) (Gd-DTPA-BSA) liposomes. This difference is probably due to the lipid composition used in our formulations consisting of the cationic lipid DOTAP, whose role is to strongly enhance cellular interaction, but apparently also exerts some toxicity. Toxicity of Gd-DTPA can be excluded, as Gd liposomes did not cause any significant additional decrease in cell viability, compared to liposomes without Gd. Although DOTAP has been used extensively in DNA transfection studies, reports on damage to cellular physiology exist (19), lacking however a clear assessment of dose toxicity (50). Interestingly, our experiments demonstrated the existence of a dose-dependent toxicity using >125 μM lipid. The dose-dependent toxicity seems to be of minor relevance in cell labeling, considering the excellent Gd uptake at 125 μM lipid with an outstanding MR visualization. In addition, a long-term biological effect of the toxicity remains questionable, considering the absence of fluorescent Gd liposomes in the cell nucleus, reducing the chance of interference with the cell DNA and thus long-term genetic damage. Furthermore, both proliferation and differentiation ability were not impaired by Gd liposome labeling.
The apparent absence of Gd chelate toxicity is in line with earlier studies (4,15), in which gadolinium 1,4,7-tris(carboxymethyl)-10-(2′-hydroxypropyl)-1,4,7,10-tetraazacycl ododecane (Gd-HPDO3A) and Gd@C82full erenol were used. To a certain extent, this tones down the initial safety concerns on the hypothesized dechelation of Gd-DTPA upon incorporation in endosomes, thereby possibly resulting in potentially hazardous Gd3+ ions (10). Additionally, the putative manifestation of nephrogenic systemic fibrosis (NSF) following transplantation of Gd-labeled cells is considered an important drawback in future clinical studies. NSF, however, has been reported to occur merely in patients with an impaired kidney function (31). Consequently, this complication should be easily avoidable if these selected patient groups are excluded in future clinical studies.
The in vitro uptake of Gd liposomes was both time and dose dependent. Regarding dose dependency, some parallels can be drawn between present results and previous reports by different authors. For example, labeling with cationic liposomes for 2 h yielded an uptake of 12.5 pg Gd cell–1 (uptake efficiency 31%) (16), comparable to our findings. Another analogy concerns the cellular Gd uptake, which was linearly proportional to the concentration of Gd liposomes in the medium. A similar relation was described using Gd-HPDO3A (15) and gadofluorine M (22).
Of note, labeling for 4 h with 125 μM lipid (52 ± 3 μM Gd) yielded an intracellular load of 29 ± 2 pg cell–1, without any detrimental effects on cell viability, cell proliferation, and cell differentiation. This amount is considerably higher (2–97 times) than most intracellular Gd loads reported in other studies, as listed in Table 1. Even higher Gd loads (70 ± 4 pg cell–1) were achieved with 1000 μM lipid (420 ± 6 μM Gd), with some implications for cell viability however (–17 ± 1.5%). An uptake of such a magnitude may be attributed to the abundant uptake of cationic liposomal lipids (DOTAP) through binding to anionic charges in the cell membrane. The advantages of electrochemical interaction in cell labeling have been reported before (54 ±). Gd liposome labeled MSCs maintained the multilineage ability, shown by the differentiation into both adipocytes and osteocytes.
Reported Intracellular Gadolinium (Gd) Loads Following Labeling With Gd Compounds

Intracellular distribution is a fairly important issue to be aware of in MRI cell tracking, affecting the relaxivity of both T1 (53) and T2 (23) contrast agents. Live cell confocal fluorescence revealed an initial endosomal distribution of the liposomes. A similar distribution pattern was reported for Gd liposomes (28) and Gd-HPDO3A (53). By confocal fluorescence, no extracellular leakage or obvious extracellular membrane-attached liposomes were detected. This was further confirmed by ICP-OES measurements, revealing virtually no loss of Gd over at least 20 days with doses ≤250 μM lipid. This is of importance in cell tracking by MRI, considering the effect of compartmentalization on relaxivity. The use of Gd-liposomes will limit the occurrence of false-positive labeled cells, contributing to a more reliable quantification of transplanted cell fate. This is a clear advantage over iron oxide particles, being notorious for clustering on the extracellular membrane (55), causing some ambiguities in relaxivity. Longitudinal confocal microscopy further confirmed the results from the MTT and proliferation assay, demonstrating the preserved viability and mitosis of Gd-labeled cells over time.
As mentioned before, a major incentive for the use of intracellular Gd is the signal gain, as opposed to the signal loss rendered by iron oxide particles. Interestingly, Gd-labeled cells were able to cause a signal loss both in vitro and in vivo. A signal loss in vivo was also reported in a study using a Gd-based, bifunctional agent called GRID (gadolinium rhodamine dextran) (36). In that study, injection of GRID-labeled cells into the rat brain resulted in a hypointense tract surrounded by hyperintense rim. This phenomenon was explained as a difference in cell density in the two areas. The strong T2-shortening effect of highly concentrated T1 CAs has been reported previously (5,9). In our study this effect manifested in vitro at 1.84 times; 105 cells μl–1 and in vivo at 2.5 times; 104 cells (μl–1, a 10-fold difference. This difference implies that more factors are in play (e.g., differences in water diffusivity or the compartmentalization of Gd). The difference in signal behavior in vitro and in vivo is complex and in vitro results cannot be extrapolated directly to the in vivo situation. For example, in vitro the cellular Gd concentration decreased according to proliferation (Fig. 3C), a known limitation of external labeling. The proliferation ability of cells in vivo, however, will hardly be the same. It is also possible that after injection the density of a labeled cell cluster increases, concurrently increasing the Gd load per voxel, causing differences in signal behavior between in vitro or in vivo applications.
The increase over time in signal intensity in vivo has been reported before (45) and may be due to cell division leading to a net lower Gd concentration per cell or cell death with extracellular loss of Gd. The latter was confirmed by the injection of nonviable Gd-labeled cell controls (in which the membrane was ruptured), which caused a hyperenhancement (Fig. 7). Compartmentalization of Gd affects T1 contrast by hindering the accessibility to surrounding water (53). Cell death with membrane rupture therefore improves the diffusion of water to Gd, leading to an increased R1 relaxation rate, causing a bright signal on MRI. In future studies, additional quantification techniques like, for example, bioluminescence could be used to further relate the MRI signal in detail to underlying biological events such as viability and proliferation.
Gd liposomes can be considered a promising candidate to shift the emphasis in future cell labeling studies from T2 to T1 CAs. As the uptake of Gd liposomes does not rely on receptor-mediated uptake, Gd liposomes might prove a valuable labeling technique for multiple cell lines. They can overcome many of the disadvantages associated with T2 contrast agents. This might substantiate the use of Gd liposomes in MRI-guided medicine.
Conclusions
Labeling of mesenchymal stem cells with cationic Gd liposomes for 4 h resulted in high cellular Gd uptake. It represents an efficient labeling method, as prolonged incubation up to 24 h did not further improve Gd uptake. Labeling with low concentrations of Gd liposomes showed no effects on viability, proliferation rate, and differentiation, while resulting in sufficient cellular Gd uptake and MRI visualization both in vitro and in vivo. Gd liposomes were located intracellular in endosomes, with excellent retention of Gd for at least 20 days. No obvious leakage of the Gd label from the cells was noted. Gd-labeled cells were clearly visualized on a 3.0T clinical scanner. With the proposed labeling method, Gd liposomes prove to be an excellent candidate CA for MRI cell tracking.
Footnotes
Acknowledgments
The authors wish to thank Dr. Alex Nigg for technical support in confocal fluorescence experiments, both Ula Woroniecka and Bert Wolterbeek (Technical University Delft, Delft, The Netherlands) for their assistance with the ICP-OES measurements, and Ton Everaers for graphical support. This study was performed in part through support from ENCITE, funded by the European Community under the 7th Framework Programme. The authors declare no conflict of interest.