
Abstract
Iron oxide nanoparticles (INOPS) are a potential contrast agent for magnetic resonance (MR) tracking of transplanted endothelial cells. The objective of this study was to examine the effect of INOPS labeling on endothelial cells. The mixture of INOPS and poly-l-lysine (PLL) was used to label human endothelial cells. Labeling efficiency was examined by Prussian blue staining, transmission electron microscopy, and atomic absorption spectrometry. The effect of iron oxide concentration on cell viability and proliferation were determined. The correlation of reactive oxygen species (ROS) and apoptosis was also examined. In vitro MRI scanning was carried out using a 1.5T MR system. INOPS-PLL could be readily taken up by endothelial cells and subsequently induce MRI signal intensity changes. However, higher labeling concentration (>50 μg/ml) and longer incubation (48 h) can affect cell viability and proliferation. Mitochondrial damage, apoptosis, and autolysosmes were observed under high INOPS-PLL concentrations, which were correlated to ROS production. INOPS-PLL nanoparticles can be used to label transplanted endothelial cells. However, high concentration of INOPS can impair cell viability, possibly through ROS-mediated apoptosis and autophagy.
Introduction
Currently, the resolution of magnetic resonance imaging (MRI) can reach 25–50 μm, which enables the anatomical structure of soft tissue to be displayed on single cell level on MRI (11). The noninvasive and nonionizing radiation nature and long effective imagery time also allow MRI to be used for the dynamic tracking of cell migration. Therefore, MRI has a potential in in vivo tracking of transplanted cells in conjunction with a contrast agent (45,46,49).
A good MRI contrast agent must possess the following features: (i) low toxicity and good stabilization in order to prevent aggregation (22), (ii) highly sensitive, (iii) good solubility and similar osmotic pressure and viscosity to the plasma (19), and (iv) selectively accumulate in the target cell and tissue and stay for a long time. Iron oxide nanoparticles (INOPS) have a small diameter and good magnetic permeability. Strong local magnetic field can be generated from a low concentration of INOPS. Early studies suggest that INOPS can be used as a magnetic marker for many types of cells (15,16). Cells labeled with iron nanoparticles can be identified by MRI as T1WI and T2WI signal decrease, which indirectly reflects the distribution and migration of the transplanted cells. However, some negative charge unmodified iron nanoparticles with a larger diameter are hardly taken up by cells. In order to improve cellular uptake of INOPS, monoclonal antibody, dendrimer, peptide chain or cationic transfection reagent (e.g., poly-l-lysine, PLL) have been used to modify INOPS surface and enhance labeling efficiency (4,35,37,54). Because of the potential toxic effect of long-term use of dendrimers and peptides (27), PLL and protamine sulfate are better surface modifiers. INOPS can be wrapped with PLL through electrostatic effect and form stable INOPS-PLL complex, which are readily taken up by cells (25).
Numerous studies suggest that the transplantation of the endothelial cells has several clinical implications, including endothelial cell repair, angiogenesis of ischemic organs, and inhibiting the formation of intimal hyperplasia (5,23,29,50,53). On the other hand, the injury of the endothelial monolayer by the mechanical removal of the endothelium or inflammatory activation of the endothelial cells can be involved in the formation of atherosclerosis plaque (18). Therefore, it is important to develop a noninvasive method to monitor the survival, migration, and functional differentiation of endothelial cells after their transplantation. The combination of iron oxide magnetic nanoparticle labeling and MRI might offer an image modality for in vivo tracking of transplanted cells. In this study, we characterized the nanomagnetic labeling of human endothelial cells and investigated the biological effects of INOPS-PLL labeling on the endothelial cells.
Materials and Methods
Nanomagnetic Labeling Materials
Iron oxide nanoparticles (carboxydextran-coated Fe2O3, ϕ = 80–150 nm) were provided by the Medical Imaging Center of Southern Medical University (Guangzhou, China). They were prepared by a chemical coprecipitation process from FeCl3·6H2O, FeCl2·4H2O, and Dextran. Fe2O3 and PLL were obtained from Sigma (St. Louis, MO). INOPS were mixed with PLL in a ratio of 5, 10, 15, 25, 30, 50, 100, or 200 μg/ml: 0.75 μg/ml in DMEM medium (Life Technologies, Inc., USA) and INOPS-PLL mixtures (hereafter 5, 10, 15, 25, 30, 50, 100, or 200 μg/ml) were sterilized by filtering through 0.22-μm filters.
Cell Culture
Human endothelial cell line ECV-304 (provided by the Medicine Department of Jinan University, Guangzhou, China) were grown in DMEM medium supplemented with 10% fetal bovine serum (FBS), 50 units/ml penicillin, and 50 mg/l streptomycin under 5% CO2 in a humidified incubator. In all experiments, 70–85% confluent cultures were used.
Cell Labeling
Fresh ECV-304 cells resuspended in medium free of FBS (to avoid unspecific binding of the labeling materials to serum albumin) were transferred into six-well culture plates (Corning, Japan) at the density of 5 × 10⁵ cells per well and incubated for 24 h for attachment. After coincubating with 1.5 ml of INOPS-PLL mixture of different ratios for 24 or 48 h (64), cells were washed three times in PBS to remove excess INOPS-PLL and used for following experiments.
Evaluation of Labeling Efficiency
Prussian Blue Staining
After incubating with INOPS-PLL for 24 or 48 h, cells were fixed with 4% glutaraldehyde for 20 min and then incubated with 1:1 (vol/vol) mixture of 2% potassium ferrous cyanide (kalium ferrocyanatum II) and 6% HCl for 20 min. Cells were rinsed in PBS and counterstained with eosin for 3 min. Intracellular iron oxides were assessed under an optical microscope (100 × magnification) and the percentage of iron-positive cells (blue) were obtained by counting approximately 300 cells. For the 25 μg/ml group, labeled ECV-304 cells were cultivated for up to 10 passages. Cells of different generations were stained with Prussian blue to detect the iron residues.
Electron Microscopic Examination
Endothelial cells labeled with INOPS-PLL (25 μg/ml for 24 h) were pelleted and fixed in 3% glutaraldehyde for 2 h at 4°C, washed with PBS, and post-fixed in 0.5% OsO4 at room temperature for 2 h, then washed three times in PBS and dehydrated in a series of ethanol solutions. After being exposed to epoxy propane for 20 min for three times and subsequently soaked in epoxy propane (EP812, 3:1, 0.5 h; EP812, 1:1, 1 h; EP812, 1:3, 2.5 h; and pure EP812, overnight), specimen was placed in embedding molds at 40°C for 12 h and polymerized in a 60°C oven for 48 h. Semithin sectioning was carried out after quiescent for 1 week. The sections were examined under a JEM-1010 transmission electron microscope (JEOL, Japan).
Atomic Absorption Spectrometry
The iron concentration within iron-oxide-labeled cells was quantified by atomic absorption spectrometry (AAS) using a polarized Zeeman atomic absorption spectrometer (Hitachi, model Z-8200, Japan). Iron measurements were performed at the wavelength of 248.3 nm. The spectrometer was calibrated with six standards containing iron concentrations of 89.55–3,582 μM in 0.05 M HCl. For quality control, lyphochek controls (Bio-Rad Laboratories, Munich, Germany) were used.
Biological Effects of INOPS Labeling on Endothelial Cells
Cell Viability and Proliferation Tests
After incubating with 1.5 ml of INOPS-PLL mixtures in six-well plates for 24 or 48 h, cells were trypsinized and cell viability was examined by Trypan blue assay. In addition, ECV-304 cells (3 × 10³ cells/well) were grown in a 96-well plate for 24 h followed by incubating with 100 μl of INOPS-PLL mixtures for 24 or 48 h. The effect of INOPS-PLL on cell growth was examined using cell counting kit-8 (CCK-8, Dojindo Laboratories, Kumamoto, Japan) (65). The absorbance value at 450 nm (A450), inversely proportional to the ratio of dead cells, was determined by a plate reader (INFINITE M200, Tecan, Switzerland). All experiments were performed in quintuplicates on three separate occasions. The growth inhibition ratio was calculated as

where TreA450 was the absorbance value of treated cells and ConA450 was the absorbance value of control cells.
Detection of Apoptosis
ECV304 cells (5 × 10⁴), with or without INOPS-PLL labeling, were resuspended in 50 μl Annexin medium. After the addition of 5 μl Annexin V–fluorescein isothiocyanate (FITC), the cell suspension was kept in the dark for 10 min. Then, the cell suspension was kept in the dark for another 5 min after the addition of 10 μl propidium iodide (PI). The cells were resuspended in 300 μl of Annexin and, the percentages of dead cells and cells undergoing apoptosis were determined with a flow cytometer (FACSCantoTM, BD Co., Inc., Franklin Lakes, NJ). The Annexin+–PI- indicated cells undergoing early apoptosis while Annexin+–PI+ indicated cells undergoing late apoptosis or necrosis. The cell apoptosis/ cycle analysis was repeated three times (34,61).
Detection of Mitochondrial Transmembrane Potential
After incubating in six-well plate with different concentrations of INOPS-PLL for 24 or 48 h, cells were trypsinized, washed twice in PBS, filtered though a 74-μm filter, incubated with Rhodamine 123 (5 μM) for 30 min in the dark, and washed three times in PBS. The change of mitochondrial transmembrane potential (Δψm) was determined with the flow cytometer (60).
Detection of Autophagy
LysoTracker® Green DND-26 (Molecular Probes, Inc., Eugene, OR, USA) was used to detect the autophagic vacuoles (13). ECV-304 cells were incubated with INOPS (25, 50, 100, and 200 μg/ml) for 24 h. Labeled cells were washed three times in PBS and then incubated with prewarmed (37°C) medium containing LysoTracker® Green DND-26 for 30 min. Cells were examined under a laser scanning microscopy (LSM510/ ConfoCor2, Zeiss, Jena, Germany). Autophagic vacuoles appeared as intense green dots in the cytoplasm.
Detection of Reactive Oxygen Species (ROS) Production
Cells were incubated with a ROS fluorescent probe dichlorodihydrofluorescein diacetate (H2DCFDA, 10 μm) (Molecular Probes, Inc.) for 15 min in the dark (14), after incubating with 25, 100, or 200 μg/ ml INOPS-PLL in the presence or absence of a free radical scavenging agent N-acetyl cysteine (NAC, 5 mM). Dichlorodihydrofluorescein (DCF) fluorescence examination (the oxidation product H2DCFDA) was carried out using the laser scanning microscopy. The fluorescence emission intensities of selected cells were analyzed with Zeiss Rel3.2 image processing software (Zeiss, Jena, Germany). The effect of NAC on INOPS-induced apoptosis was also examined as described above.
In Vitro MRI of INOPS-PLL-Labeled Cells
MR imaging was performed using a 1.5T MRI (GE Sigma HD 1.5T MR) with a 12.7 cm knee coil. A total of 106 or 105 ECV-304 cells (in 1 ml) labeled with INOPS-PLL (25 μg/ml) were placed in a 1.5-ml ependoff tube and scanned with MRI using a gradient-echo T2* sequence (repetition time ms/echo time ms, 620/15.7; 35° flip angle), a fast spin echo T2 sequence (repetition time ms/echo time ms, 4,000/108; 16 echo train length), and a spin-echo T1 sequence (repetition time ms/echo time ms, 500/17.9) with the section thickness of 2 mm and field of view (FOV) of 13×13 cm. Images were obtained with a matrix size of 256 × 256. Region of interest (ROI) for signal intensity (SI) measurement was 14.6 mm2. Twelve ROI were randomly selected, and the signal intensity (SI) and signal to noise ratio (SNR) of ROI were measured. SNR were calculated as

where SI were the SI of the cells (ROI) in each tube. SDair background were the standard deviation of the SI of the ROI in air background.
The percentage change of SI (ΔSI) was calculated using the equation:

Statistical Analysis
Each experiment was repeated at least three times. Data were presented as the mean ± SD. Statistical analyses were carried out with SPSS12 (SPSS, Chicago) using the two-sample t test and one-way ANOVA analysis (Bonferroni correction). A value of p < 0.05 was considered as statistical significance.
Results
INOPS-PLL Labeling Efficiency
The cellular uptake of INOPS was confirmed by Prussian blue staining as the presence of blue areatus iron granules in the cytoplasm of labeled cells. In general, for the 24-h incubation group, the number of blue granules increased in an INOPS loading concentration-dependent manner. However, when INOPS loading concentration reached 50 μg/ml, although blue granules were seen in all cells, the number of cellular iron granules began to decrease (Fig. 1A). For the 48-h incubation group, although higher loading concentration (e.g., 100 or 200 μg/ml) generated better labeling effect, the overall uptake was far less than that in the 24-h group. More round cells were seen in the 48-h group (Fig. 1B). Calculated percentages of labeled cells are shown in Figure 1C.

(A) Prussian blue staining of ECV-304 cells labeled with iron oxide nanoparticles-poly-l-lysine complex (INOPS-PLL) for 24 h. INOPS-PLL concentration (a–h): 0, 5, 12.5, 25, 35, 50, 100, and 200 μg/ml. Original magnification: 100x. (B) Prussian blue staining of ECV-304 cells labeled with INOPS-PLL for 48 h. INOPS-PLL concentration (a–h): 0, 5, 12.5, 25, 35, 50, 100, and 200 μg/ml. Original magnification: x100%. (C) The percentage of ECV-304 cells labeled with INOPS-PLL after incubation for 24 and 48 h. INOPS-PLL loading concentration (a–h): 0, 5, 12.5, 25, 35, 50, 100, and 200 μg/ml.
Electron microscopic examination showed many inclusion bodies in the cytoplasm of labeled cells (Fig. 2). Tiny INOPS particles can be seen in the cytoplasm and vesicles without adhering to the cell membrane. There was no obvious changes in the size and morphology of organelles in cells treated with 25 μg/ml of INOPS-PLL for 24 h.

Transmitting electron microscope (TEM) images of ECV-304 cells. (A, B, C) Cells labeled with 25 μg/ml of INOPS-PLL for 24 h. (D, E, F) Controls. v, vesicle. Arrows denote metal oxide particles.
Atomic absorption spectrometry assay showed that, after incubating with different concentrations of INOPS-PLL for 24 h, the cellular iron content (Fe pg/cell) was obviously higher than that of the control groups. The cellular iron content increased, while the INOPS-PLL loading concentration increased up to 15 μg/ml and then reached to a stable level between 25 and 100 μg/ml. At 200 μg/ml, the cellular iron content began to decrease (Fig. 3).

Cellular iron content after labeling with INOPS-PLL for 24 h. INOPS-PLL loading concentration (a–h): 0, 5, 12.5, 25, 35, 50, 100, and 200 μg/ml.
When labeled ECV-304 cells were propagated to five passages, iron particles were still visible in some cells but disappeared after six passages (Fig. 4).

Prussian blue staining of ECV-304 cells of different passages after incubating with 25 μg/ml INOPS-PLL for 24 h. (A–D) 1, 5, 6, and 10 passage (100x).
Longer Incubation with INOPS-PLL Can Affect Cell Viability and Proliferation
Trypan blue and CCK-8 assays showed that the incubation of cells with high loading concentrations of INOPS-PLL (e.g., 200 μg/ml) for 24 h did not affect cell viability and cell growth. However, after incubating with higher loading concentrations of INOPS-PLL (e.g., 50, 100, 200 μg/ml) for 48-h cell, both viability and proliferation started to decline (Table 1 and Fig. 5).
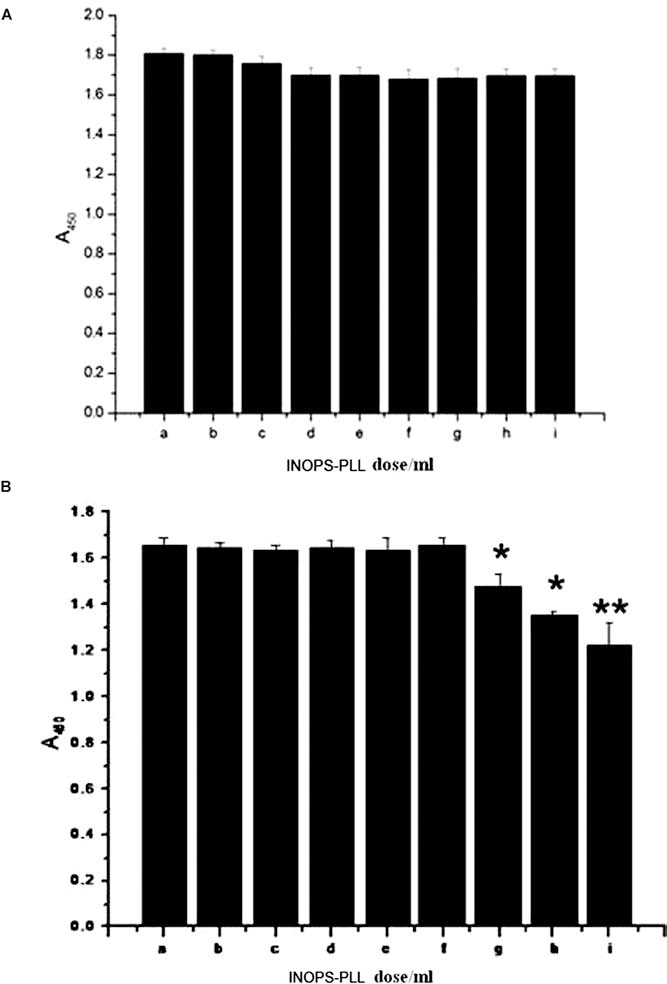
Effect of INOPS and PLL on cell viability: (A) 24 h incubation and (B) 48 h incubation. (a – i) Control (0.75 μg/ml PLL), 5, 12.5, 25, 35, 50, 100, and 200 μg/ml of INOPS-PLL. *p < 0.05 and **p < 0.01.
Trypan Blue Dye Uptake After Incubating With Different Concentrations of Iron Oxide Nanoparticles (INOPS) for 24 or 48 h

p < 0.05
p < 0.01.
Longer Incubation with INOPS-PLL Can Induce Apoptosis
The induction of apoptosis by INOPS-PLL was examined by Annexin–PI double staining, and results suggested that there was no significant difference between labeled and unlabeled cells in terms of the number of apoptotic cells detected after 24 h of incubation. However, the cells incubated with ≥50 μg/ml of INOPS-PLL for 48 h showed a higher ratio of apoptosis (Fig. 6).

AnnexinV–PI assay of ECV-304 cells after INOPS-PLL treating for 24 and 48 h. (A) Control, (B) 25 μg/ml, and (C) 200 μg/ml.
Longer Incubation with INOPS-PLL Can Decrease Mitochondrial Membrane Potential
Flow cytometer assay showed that the incubation of cells with INOPS-PLL for 24 h did not affect the mitochondrial membrane potential. However, after incubating with higher loading concentrations of INOPS-PLL (e.g., ≥50 μg/ml) for 48 h, the mitochondrial membrane potential started to decline as indicated by the lower fluorescence intensity in Figure 7.

Changes in mitochondrial membrane potential of ECV-304 cells after incubating with INOPS-PLL for 48 h. The left peak denotes the low membrane potential [Y, cell number; X, fluorescence intensity (a.u. logarithmic rise.)].
Autophagy May Occur at Higher INOPS-PLL Loading Concentrations
Autophage in INOPS-PLL-labeled cells were visualized by LysoTracker®. The counting of autophagic vacuoles in cells treated with 0, 25, 50, or 200 μg/ml for 24 h showed that the average number of autophagic vacuoles number per group was 20.5 ± 3.51, 24.2 ± 5.36, 52 ± 10.83, or 64.25 ± 9.46, respectively. Thus, higher INOPS-PLL loading concentration (e.g., >50 μg/ml) could trigger autophagy activity in ECV-304 cells (Fig. 8).

Examination of autophagy lysosomes after incubating with INOPS-PLL for 24 h: (A) control, (B) 25 μg/ml, (C) 100 μg/ml, and (D) 200 μg/ml. Scale bar: 10 μm. Dots represent autophagy lysosomes.
Higher INOPS-PLL Loading Concentrations Can Induce ROS Generation
Compared to the control groups, the increase of DCF fluorescence intensity (i.e., ROS production) was detected in the 100 and 200 μg/ml groups (Fig. 9). In the presence of NAC, INOPS labeling-induced DCF fluorescence was diminished (Fig. 10A, B), which suggested that ROS was involved in high INOPS labeling concentrations. Similarly, the cell apoptosis rate was also reduced by the addition of NAC (Fig. 10C).

Examination of reactive oxygen species (ROS) production. The time course images of ECV-304 cells. Scale bar: 10 μm. (A–C) 0, 25, and 200 μg/ml INOPS-PLL incubated. (D) The fluorescence intensity curve of dichlorodihydrofluorescein (DCF). Mean ± SD (n = 5).
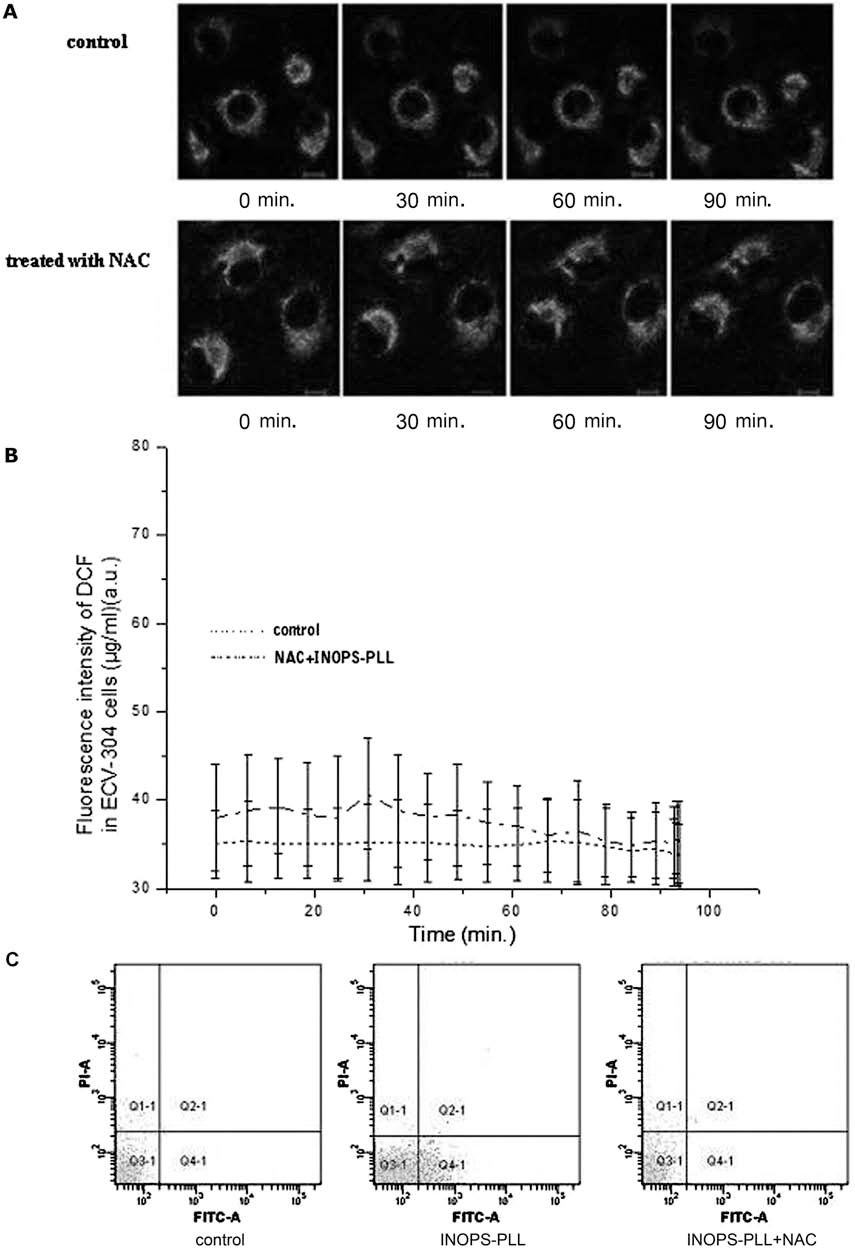
Effect of N-acetylcysteine (NAC) on ROS production. (A) The time course images of ECV-304 cells. Scale bar: 10 μm. (B) The fluorescence intensity curve of DCF. Mean ± SD (n = 5). (C) Flow cytometry of AnnexinV–PI of ECV-304 cells after SPIO-PLL treating for 48 h.
In Vitro MR Imaging of Endothelial Cells
The INOPS-labeled cells showed lower MRI signal compared to unlabeled control group (p < 0.01). Based on the MR images of 106 cells, DSI of T1WI, T2WI, and T2*WI was −54.2%, −54.4%, and −57.0%, respectively. The ΔSI of 105 cells was −29.6%, −41.1%, −13.5%, respectively. The intensity changes generated from 106 labeled cells were larger than that of 105 among different sequences (Table 2 and Fig. 11). The signal intensity (SI) and signal-to-noise ratio (SNR) of ROI are shown in Table 2 and Figure 11. Of T1WI, T2WI, and T2*WI, the ΔSI of T2*WI was the greatest and T2WI the smallest, which indicated that the T2* sequence was more sensitive to INOPS.

In vitro MR image of agar-gel-suspended ECV-304 cells labeled with 25 μg/ml of INOPS-PLL. Top: T1WI, middle: T2WI, and bottom: T2*WI. (A, B) 1 × 10⁶ and 1 × 10⁵ cells with vehicle only, (C) blank, 1% agarose, and (D and E) 1 × 10⁶ and 1 × 10⁵ cells labeled with INOPS-PLL.
The Intensity Changes on T2*- and T2-, T1-Weighted Images of ECV-304

Data are expressed as mean ± standard deviation. SI, signal intensity; SNR, signal-to-noise ratio.
Discussion
High-resolution MRI techniques can provide an ideal platform for tracking transplanted cells (1,2,10,12,40,44). INOPS particles are a sensitive labeling marker for this purpose since they can perturb the static magnetic field out to a distance many times its diameter and provide a strong change in MR signals, particularly on T2*-weighted images (39). The rapid development and potential clinical application of targeted nanomedicine demand iron-based biodegradable and biocompatible nanoparticles (51).
Anionic iron oxide particles can have a repulsive interaction with the proteins of the cell membrane because of the negative charge on the cell surface. In order to facilitate the cellular uptake of Fe2O3 nanoparticles, we applied positive charged PLL to wrap the magnetic nanoparticles through electrostatic interaction in this study. This method is relatively simply. Previous studies show that PLL has little influence on cell's biological activity (3,43).
Electron microscopic examinations show that INOPS-PLL nanoparticles can be taken up by the cells rather than adhering to the exterior of the cell membrane (see Fig. 2), and this is consistent with previous findings (9,17,26).
Our in vitro MRI results showed that for T2WI, T2*WI, and T1WI sequence, especially the T2*WI, the intensity changes at the high cell density (e.g., 106 cells/ml) were obviously larger than that of the low cell density (e.g., 105 cells/ml) (see Table 2 and Fig. 11). This indicates that a proportional relationship may exist between the number of labeled cells and signal intensity. Contrary to our finding, others reported that INOPS-PLL labeling did not alter the signal intensity of T1WI sequence (20). This may be due to the differences in contrast agent and concentration, cell type, and MR machine model.
It has been reported that MRI can be used to track magnetically labeled endothelial progenitor cells (36,59) and endothelial cell homing (55). Cellular uptake of iron oxide is a key step in those applications. Matuszewski et al. reported that iron oxide uptake could increase in a dose-dependent manner and the use of transfection medium could also significantly increase the iron uptake (38). Our study also supports their conclusion. The percentage of iron-labeled cells increased as the INOPS-PLL loading concentration increased up to 50 μg/ml. But contrary to previous reports (6,41,58), our results indicated that the increase of incubation time from 24 to 48 h did not increase the cellular uptake of INOPS. In fact, the percentage of iron-labeled cells after 48 h was significantly lower than that of 24 h (see Fig. 1C). Possible explanation is that, when intracellular Fe becomes saturated, they may start to be expelled out of cells. On the other hand, high INOPS concentration and long incubation can also affect cell's activity.
Although Prussian blue staining showed the presence of Fe in all cells after 24 h, AAS assay suggested that the final intracellular iron content reached its peak at the loading concentration of 4.2 pg/cell (see Fig. 6). This phenomenon is likely because some blue granules seen in Prussian blue staining merely adhered to the cell surface rather than entered into the cells. The maximal iron uptake of 4.2 pg/cell is considerably low compared to the values reported for other cell types (8). The TEM assay (Fig. 2A, D) shows that iron particles attached to the cell surfaces could be washed away. Therefore, AAS only measured the intracellular INOPS. It has been reported that the intracellular iron concentration could be affected by Fe formulation and culture medium (52).
Uptaking of INOPS may induce changes in physiological status of cells (56). Choosing INOPS-PLL loading concentration is an important step to optimize the quality of labeling and meanwhile to maintain cell proliferation and activity. Although it has been reported that INOPS can promote cell growth by regulating the endogenous peroxidase isoenzyme activity and cells can survive at the loading concentration as high as 1 mg Fe/ml (28), our results indicated that when INOPS concentration exceeded 50 μg/ml, cell survival, and proliferation capacity started to decline (see Table 1 and Fig. 7). Based on this and other literatures (31,57), 50 μg/ml is considered a safe concentration for labeling.
Garçonab et al. demonstrate that the exposure to high concentration of INOPS can result in lipid peroxidation and superoxide dismutase (SOD) inactivation, ultimately causing oxidative damages to DNA (21). We detected that the increase of ROS production and the decrease of mitochondrial membrane potential was induced by 100 and 200 μg/ml INOPS-PLL. Oxidative stress and mitochondrial damage eventually lead cells into apoptosis.
The permeability transition pore (PTP) is essential for maintaining mitochondrial function. PTP could be affected by high INOPS concentration and ROS (24,33,66). Impairment in PTP can cause mitochondrial membrane potential decrease and cyto C release and subsequently induce apoptosis (7,42,62,67). These changes played a key role in the INOPS-induced apoptosis in ECV-304 cells, which was likely mediated by ROS since the addition of ROS scavenger can protect cells from undergoing apoptosis.
It is known that mitochondrial stress-induced mitochondrial dysfunction can result in apoptosis and autophagy (63). Autophagy can lead to a form of non-apoptotic cell death known as “type 2 programmed cell death” (30,47,48). Researchers found that autophagy may be a cellular defense mechanism against oxidative stress toxicity exposure to AuNPs in human lung fibroblasts (32). In this study, autophagic vacuoles were detected at high INOPS concentrations (see Fig. 6). Cells with signs of both apoptosis and autophagy were observed in ECV-304 cells. For the first time, we identified that autophagy death process could take place at high INOPS loading concentrations.
In summary, this study demonstrated that (i) human ECV-304 endothelial cells can be effectively labeled with INOPS-PLL (50 μg/ml) and tracked by MRI; (ii) intracellular iron content in ECV-304 cells did not increase linearly with the increase of INOPS-PLL loading concentration; (iii) high INOPS concentration can induce apoptosis, which is likely caused by ROS production and mitochondrial damage; and (iv) autophagy can also take place at high INOPS concentration. Hence, the determination of optimal INOPS-PLL loading concentration is an important step in order to maintain the quality of cell labeling as well as cell activity.
Footnotes
Acknowledgments
This research is supported by the National Basic Research Program of China (2011CB910402; 2010CB732602 and the Program for Changjiang Scholars and Innovative Research Team in University (IRT0829). Iron oxide nanoparticles (carboxydextran-coated Fe2O3, ϕ = 80–150 nm) were provided by Professor Xu Yikai (Department of Medical Imaging Center, Nan Fang Hospital, Southern Medical University, No. 1838 Guangzhou Avenue North, Guangzhou, Guangdong, 510515, China.). The authors declare no conflicts of interest.