
Abstract
Hepatocyte transplantation is being evaluated as an alternative to liver transplantation. However, the fate of hepatocytes after transplantation is not well defined. The aims of the study were to improve hepatocyte labeling in vitro using superparamagnetic iron oxide nanoparticles (SPIOs) and to perform in vivo experiments on tracking labeled cells by magnetic resonance imaging (MRI). Human and rat hepatocytes were labeled in vitro for 16 h with clinically approved SPIOs (12.5 μg Fe/ml) and protamine sulfate (3 μg/ml) as a transfection agent. Increased cellular iron uptake was obtained, and cell viability and function were shown not to be affected by labeling. Labeled cells (2,000/μl) could be detected on T2-weighted images in vitro using a 7T MR scanner. In a rat model of acute liver failure (ALF), female recipients received intrasplenic transplantation of 2 × 10⁷ male rat hepatocytes 28–30 h after intraperitoneal injection of d-galactosamine (1.2 g/kg). There were four groups (n = 4 each): vehicle injection, injection of freshly isolated cells labeled with CM-DiI, injection of cultured cells labeled with CM-DiI, and injection of cultured cells labeled with both SPIOs and CM-DiI. Ex vivo T2*-weighted gradientecho images at 7T MRI were acquired at day 7 post-ALF induction. Six days after transplantation, SPIOs were detected in the rat liver as a decrease in the MRI signal intensity in the surviving animals. Histologically, most of the SPIOs were located in Kupffer cells, indicating clearance of labeled hepatocytes. Furthermore, labeled cells could not be detected in the liver by the fluorescent dye or by PCR for the Y-chromosome (Sry-2 gene). In conclusion, optimum conditions to label human hepatocytes with SPIOs were established and did not affect cell viability or metabolic function and were sufficient for in vitro MRI detection. However, the clearance of hepatocytes after transplantation limits the value of MRI for assessing long-term hepatocyte engraftment.
Keywords
Introduction
The use of cellular magnetic resonance imaging (MRI) is currently one of the most promising approaches to monitor the fate of transplanted cells noninvasively after cell therapy. MRI offers excellent anatomical detail combined with the possibility of serial imaging. A wide variety of contrast agents have been used successfully in in vitro experiments to label cells (6,7,47,49). To date, superpara-magnetic iron oxide particles have been the most commonly used class of contrast agents for cellular MRI due to their large magnetic moment, which provides the greatest change in signal intensity (SI) per unit of metal. As a result, iron oxide-labeled cells are detected by MRI as areas of low SI on T2- or T2*-weighted images (7). Various iron oxide particles have been used for cell labeling with hydrodynamic diameter sizes ranging from nanometers [ultrasmall superparamagnetic iron oxide nanoparticles (USPIOs) and superparamagnetic iron oxide nanoparticles (SPIOs)] (2,29,37) to micrometers [micrometer-sized iron oxide particles (MPIOs)] (42,49). Among these, Endorem®, a dextran-coated SPIO, is a FDA-approved iron oxide formulation and therefore has been the most widely used in biomedical research. Although it is generally accepted that SPIOs are clinically well tolerated, their biological effects on different types of cells after labeling are still a matter of debate in the literature. While studies have reported cell labeling using SPIOs as safe (3,17,24,33), others have shown that iron oxide particles can have an adverse effect on cell behavior and morphology, according to the type of cells (24,36,38,43).
Recently, preclinical studies have successfully detected labeled cells in vivo by MRI after hepatocyte transplantation (HT) (28,40,41,48). Most of the reports consist of transplantation of hepatocytes into animals with a normal liver. HT has attracted interest in the past few decades as a possible new therapy for inborn errors of metabolism and also acute liver failure (ALF) aiming to support liver function as a bridge to liver transplantation or until recovery of the native liver. Early preclinical studies demonstrated the potential of HT in improving survival of animals with ALF (30,51,55). However, clinical transplantation of hepatocytes into patients in ALF resulted in little improvement in patients' survival (53). Although there are isolated reports in the literature of full recovery of the liver function without liver transplantation after HT, it is difficult to draw any conclusions of its efficacy without adequately controlled clinical trials (23,46).
It is reasonable to expect that the liver injury in ALF would give a selective advantage to transplanted hepatocytes to engraft. If metabolic function is supported until recovery, the liver regeneration stimuli would also enhance proliferation of transplanted cells. Assessing the value of HT in ALF requires analysis of the fate of transplanted cells, and the use of noninvasive techniques to monitor their engraftment would be of great advantage.
In this study, we first investigated the possibility of labeling rat and human hepatocytes using a clinical SPIO combined with protamine sulfate (PS) to facilitate and increase contrast agent uptake and its effects on cell viability and function. SPIO-labeled rat hepatocytes were then transplanted into the spleens of rats with ALF induced by administration of d-galactosamine (GalN). The aim of this study was to determine whether hepatocytes labeled with SPIO–PS complexes for MRI would integrate into the recipient liver in acute liver injury.
Materials and Methods
Hepatocyte Isolation
Human.
Human hepatocytes were isolated from liver tissue obtained from 11 patients (six males and five females) undergoing liver resection due to primary or secondary liver tumors or from unused donor liver segments or lobes. Cell isolation was carried out using a modified two-step collagenase perfusion technique (32,54). All tissues were consented for research in accordance with the Research Ethics Committee of King's College Hospital, London, UK.
Rat.
Nine male Sprague Dawley rats (Harlan, Shardlow, Derbyshire, UK) with weights between 200 and 250 g were used as hepatocyte donors. Animals were housed under a 12-h light–dark cycle in a room maintained at 21°C ± 2°C and 55 ± 10% humidity. Food and water were available ad libitum. The animals were allowed to acclimatize to these conditions for at least 1 week prior to any procedure. All procedures were in accordance with the UK Animals (Scientific) Procedures Act of 1986 and the ethical review process of King's College London. Hepatocytes were isolated by collagenase perfusion of the liver in situ as previously described (35,59).
Isolated hepatocytes were purified by low-speed centrifugation at 50 × g for 5 min at 4°C at least twice and the cell pellet resuspended in phenol red-free Williams' E medium (WEM; Sigma-Aldrich, Gillingham, UK). Cell viability was determined using the trypan blue (Sigma) exclusion test.
Unless otherwise stated, all chemicals used were tissue culture grade and were obtained from Sigma-Aldrich.
Hepatocyte Culture
Isolated human hepatocytes were plated in collagen type I-coated tissue culture vessels at a density of 1.6 × 10⁵ viable cells/cm2. Isolated rat hepatocytes were plated in tissue culture vessels coated with 0.1% porcine gelatin A at a density of 105 viable cells/cm2. Cells were allowed to attach for a minimum of 16 h in a humidified incubator at 37°C in 95% O2/5% CO2. Standard hepatocyte culture medium consisted of WEM supplemented with 10 mM 2-[4-(2-hydroxyethyl)piperazin-1-yl]ethanesulfonic acid (HEPES; Lonza, Verviers, Belgium), 10% heat-inactivated fetal calf serum (FCS) (Invitrogen, Paisley, UK), 2 mM l-glutamine, 0.1 μM dexamethasone, 0.1 μM insulin, penicillin (50 IU/ml), and streptomycin (50 μg/ml).
For longer term human hepatocyte cultures, after overnight incubation in standard hepatocyte culture medium, cells were maintained in WEM supplemented with 0.2 mg/ml bovine serum albumin, 20 μg/ml linoleic acid, 2 μg/ml linolenic acid, 2.45 μg/ml cAMP, 0.1 μM dexamethasone, 0.01 IU/ml prolactin, 0.06 ng/ml ethanolamine, 1 μg/ml glucagon, 20 ng/ml hepatocyte growth factor, 50 ng/ml epidermal growth factor (both from Peprotech, Rocky Hill, NJ, USA), 9 ml/l insulin–transferrin– selenium-X supplement (100×), 2 mM l-glutamine, 10 mM HEPES, 3 μl/ml Fungizone® (all from Invitrogen), 50 IU/ml penicillin, and 50 μg/ml streptomycin (12). Medium was replaced every 48 h during the first week and every 72 h thereafter up to 14 days.
Labeling of Hepatocytes
SPIO Labeling of Hepatocytes.
Standard hepatocyte culture medium without FCS was used for labeling both human and rat hepatocytes. Prewarmed serum-free medium with or without 25 μg Fe/ml of SPIO nanoparticles (Endorem®; Guerbet, Roissy CdG, France) was added directly onto the cells, followed by the addition of 3 μg/ml of PS (CP Pharmaceuticals, Wrexham, UK). Tissue culture plates were gently swirled and incubated for 15 min at 37°C in a humidified incubator (95% O2/5% CO2). After 15 min, an equal amount of standard hepatocyte culture medium containing 10% FCS was added to the cell cultures, resulting in a final concentration of 12.5 μg Fe/ml. Cell monolayers were then incubated for 16 h at 37°C in a humidified incubator (95% O2/5% CO2). After labeling, human or rat hepatocytes were washed in phosphate-buffered saline (PBS; Invitrogen, Paisley, UK) and detached according to Funaki et al. (14) with some modifications. Hepatocyte cultures were incubated with PBS solution containing 1.86 g/L of ethylenediaminetetraacetic acid (EDTA) 2Na, 0.45 g/L of glucose, and 2.38 g/L of soybean trypsin inhibitor at pH 7.4 for 10 min at 37°C. Cells were then washed twice in PBS and incubated for a further 10 min with Hank's balanced salt solution (HBSS; Lonza) containing 0.05% w/v collagenase P (Roche, Mannheim, Germany) and 2 mM of calcium chloride. Detached cells were centrifuged at least twice for 3 min at 50 × g at 4°C, the viability determined, and cells resuspended in WEM.
Analysis of Labeling Efficiency
After incubation with the SPIO–PS complexes, cell monolayers were washed three times with PBS and cells detached. Labeling efficiency was determined by Prussian blue staining, and intracellular iron content was quantified as previously described (40,44).
Hepatocyte Labeling Using a Fluorescent Dye.
In order to facilitate identification of transplanted cells after transplantation, donor rat hepatocytes were colabeled with the fluorescent lipophilic dye chloromethylbenzamidodialkylcarbocyanine (CM-DiI; Molecular Probes, Eugene, OR, USA). CM-DiI has a peak excitation at 553 nm and emission at 570 nm. A 1-mg/ml stock solution was prepared in 100% dimethyl sulfoxide (Sigma-Aldrich) and further diluted in HBSS containing 1% FCS. A total of 5 × 10⁶ hepatocytes were centrifuged at 50 × g for 4 min at 4°C, and cell pellets were resuspended in 3 ml of solution containing 40 μg of CM-DiI/ml. Cells were incubated for 5 min at 37°C in a water bath plus 15 min on ice. After incubation, 7 ml of PBS was added to each cell suspension, and cells were washed three times by low-speed centrifugation. Cells were then counted and viability determined by the trypan blue exclusion technique.
CM-DiI labeling efficiency was determined by flow cytometry using a FACSCalibur system (BD Immunocytometry Systems, Oxford, UK) and fluorescence microscopy. Fluorescence intensity was registered on 10,000 cells in the FL2 channel (585 nm) and analyzed using CellQuest software (BD Biosciences, Oxford, UK). The results were expressed as a percentage of cells containing CM-DiI and as a percentage of the mean fluorescence intensity (MFI) of corresponding controls. Labeling was confirmed by microscopy of around 75,000 cells prepared on cytospin glass slides (Shandon Cytospin 4; Thermo Scientific Shandon, Loughborough, UK) and fixed with 10% neutral buffered formalin. Slides were mounted in Vectashield® medium containing 4′-6-diamidino-2-phenylindole (DAPI) nuclear counterstain (Vector Laboratories, Burlingame, CA, USA). Representative photomicrographs were acquired by a fluorescence microscope (DMR, Leica Microsystems, Heerbrugg, Germany) equipped with a Leica DFC300FX camera and Leica Application Suite version 3.3.0 software (Leica Microsystems).
Retention of the fluorescent label was determined by fluorescent microscopy after culturing CM-DiI-labeled cells for 5 days. The possibility of transfer of the label to nonlabeled cells was investigated in vitro by adding 1 × 10⁵ heat-killed CM-DiI-labeled cells onto nonlabeled rat hepatocyte cultures and incubating them for 24 h. At the end of the experiment, hepatocyte monolayers were washed three times with PBS to remove dead cells. Cells were counterstained with DAPI and coverslips (VWR International Ltd., Lutterworth, UK) mounted onto slides. Slides were visualized under a fluorescence microscope, and photographs were taken.
Effects of Labeling on Cell Viability and Function
Lactate Dehydrogenase (LDH) Leakage Assay.
LDH leakage into the culture medium was measured in hepatocyte cultures using the CytoTox 96® nonradioactive cytotoxicity assay (Promega, Southampton, UK) following the manufacturer's instructions. The mean concentration of LDH in the supernatant and in the cell lysate for each well was determined, and the LDH leakage in the supernatant was calculated as a percentage of the total.
Mitochondrial Dehydrogenase Activity.
Mitochondrial dehydrogenase activity of hepatocytes was assessed using the CellTiter 96® AQueous nonradioactive cell prolife ration assay [3-(4,5-dimethylthiazol-2-yl)-5-(3-carboxymethoxyphenyl)-2-(4-sulfophenyl)-2H-tetrazolium (MTS); Promega] according to the manufacturer's instructions. The absorbance of the formazan produced was measured at OD 490 nm using a Dynex MRX microplate reader (Dynex Technologies, Middlesex, UK). Results were expressed as percentage of controls.
Incorporation of [14C]Leucine Assay.
Incorporation of [14C]leucine was determined in cultured hepatocytes. Two hundred microliters of culture medium containing 0.1 μCi L-[U-14C]leucine (Amersham, Buckinghamshire, UK) was added per well, and plates were incubated for 24 h. Cells were then harvested onto glass fiber filters (PerkinElmer, Seer Green, UK) using a cell harvester (FilterMate™; Packard Bioscience, Pangbourne, UK). Filters were dried, and the radioactivity was determined as counts per minute (cpm) using a β-counter (MATRIX™ 9600 Direct β Counter; Packard Bioscience). Results were expressed as percentage of 14C incorporation of control cells.
Albumin and Urea Synthesis Assays.
For albumin and urea measurements, cell monolayers were washed with PBS after labeling and the medium replaced by serum-free longer term hepatocyte culture medium and incubated for a further 24 h before analysis at days 1, 4, 8, and 14 after labeling. Albumin production was determined in a sample of the supernatant using the human albumin enzyme-linked immunosorbent assay (ELISA) quantitation kit (Bethyl Laboratories, Montgomery, TX, USA) according to the manufacturer's recommendations, and 2 mM of ammonium chloride (NH4Cl) was added to the culture supernatant as a substrate for urea synthesis. The amount of urea produced was measured in the culture supernatants using the colorimetric QuantiChrom™ urea assay kit (BioAssay Systems, Hayward, CA, USA) according to the manufacturer's instructions. Results were expressed as micrograms of albumin or urea/mg of cell protein.
Animal Experiments
Acute Liver Failure Induction.
ALF was induced in female Sprague Dawley rats weighing between 200 and 250 g. Animals were housed under a 12-h light–dark cycle in a room maintained at 21°C ± 2°C of temperature and 55 ± 10% of humidity.
At the time of use, GalN (Sigma-Aldrich) was dissolved in dH2O to a final concentration of 240 mg/ml, and the solution was neutralized (pH 7.4) with 5 M NaOH. ALF was induced by a single intraperitoneal injection of GalN using a dose of 1.2 g/kg of body weight. All the injections were performed between 8:00 and 10:00 a.m. After injection, animals had ad libitum access to standard diet, and water was substituted by 5% dextrose to prevent hypoglycemia.
Intrasplenic Hepatocyte Transplantation.
Syngeneic male donor hepatocytes were transplanted intrasplenically into female rats 28–30 h after ALF induction by GalN. Animals were divided into four groups (n = 4 each): group 1 received vehicle injection of medium only (sham), group 2 received fresh CM-DiI only-labeled cells, group 3 received cultured CM-DiI-only labeled cells, and group 4 received cultured cells labeled with CM-DiI and SPIOs. Labeled and nonlabeled cell suspensions were washed twice in PBS by centrifugation at 50 × g for 3 min, counted, and resuspended in serum-free Roswell Park Memorial Institute (RPMI)-1640 medium (Invitrogen). Animals were anesthetized with isoflurane (Abbott Laboratories, Queenborough, UK) inhalation for the procedure. The lower pole of the spleen was isolated via a small midline laparotomy incision. Each animal studied received a total of 20 × 106 cells in 1 ml of RPMI-1640 medium or vehicle injection only into the spleen. Hemostasis was secured by ligation of the tip of the spleen. Cells were only transplanted when viability was greater than 70%.
Animal Follow-Up.
Assessment of the hepatic damage was performed on blood samples collected on days 1, 3, and 7 post-ALF induction. Prothrombin time (PT) was used as a test of synthetic function and was determined in whole blood using an automated coagulation monitor (CoaguChek® XS PT test; Roche Diagnostics, Mannheim, Germany). The coagulation time obtained was expressed in seconds with a maximum recorded value of >96 s. Ammonia levels were immediately determined in 20 μl of whole blood using a portable blood ammonia analyzer (PocketChem BA; Menarini Diagnostics, Wokingham, UK). Whole blood was applied on a dry chemistry reagent test strip for 3 min, and the reflected light was measured at a single wavelength. The test measuring range was 7–286 μmol/L. Hepatocyte damage was determined from aspartate aminotransferase (AST) and alanine aminotransferase (ALT) levels measured in plasma samples using a routine biochemical AutoAnalyzer (Advia 2400; Siemens Healthcare Diagnostics, Camberley, UK). Values were compared to those of normal nontreated control rats.
Forty-eight hours post-HT, animals were anesthetized by isofluorane inhalation, and a wedge biopsy was taken from the right lobe. Part of the tissue was snap-frozen in liquid nitrogen for molecular studies, and part was fixed in 4% paraformaldehyde (PFA). At day 7, recipient livers were fixed in situ by intracardial perfusion of 4% PFA. The livers were then harvested and kept in PFA until MR imaging.
PCR Detection of Transplanted Male Hepatocytes.
Genomic DNA was prepared from tissue homogenates of recipient rat livers harvested at day 3 and at sacrifice, using the DNeasy blood and tissue kit (Qiagen, Crawley, UK) according to the protocol recommended by the manufacturer. Donor male cells were detected in recipient female rats by the presence of the sex-determining region-2 on the Y-chromosome (Sry-2) assessed by PCR. The detection limit was 0.5%. For a 40-μl reaction template, 2 μl of genomic DNA was added to the PCR mix containing PCR buffer with MgCl2 (1.5 mM final concentration), 200 μM of dNTP mix, 0.8 μl of each primer, 2 IU of FastStart Taq DNA Polymerase, and sterile dH2O. Primer sequences used for the Sry-2 gene were forward (fwd) 5′-CATCGAAGGGTTAAAGTGCCA-3′ and reverse (rev) 5′-ATAGTGTGTAGGTTGTTG TCC-3′ (1) and amplified a product of 104 bp. The PCR conditions used were as follows: incubation at 95°C for 5 min; 35 cycles of denaturation at 95°C for 50 s, annealing at 60°C for 30 s, and extension at 72°C for 1 min and a final 10-min incubation step at 72°C in an automated thermal cycler (Multiblock Satellite PCR System, Thermo Electron Corp., Basingstoke, UK). Glyceraldehyde 3-phosphate dehydrogenase (GAPDH) was used as the control gene, and the primer sequences used were fwd 5′-TCCCTCAAGATTGTCAGCAA-3′ and rev 5′-AGATCCACAACGGATACATT-3′. PCR products were separated using a 2% agarose (Sigma-Aldrich) gel electrophoresis (Bio-Rad Laboratories Ltd., Hemel Hempstead, UK) and stained with ethidium bromide. Male and female rat DNAs were used in each assay as positive and negative controls, respectively.
Relaxivity Measurements and MRI
In Vitro.
MRI and relaxivity measurements were performed in vitro on nonlabeled hepatocytes (20,000 cells/μl) and on SPIO-labeled cells at different densities (20 to 20,000 cells/μl) to determine the detection threshold. Cells were resuspended in 6% porcine gelatin in deionized water and transferred to PCR tubes (Thermo-Tube; ABgene, Epsom, UK). The mixture was allowed to solidify rapidly at 4°C to prevent clumping of the cells. In order to stabilize the tubes and also to avoid artifacts from the surrounding air during the MRI scanning, the tubes were placed in a 4% agarose phantom. MRI experiments were performed on a 7T 30-cm-bore horizontal Varian magnetic resonance system using a custom-made quadrature coil driven by VNMRJ 2.2.b software (Varian, Inc., Crawley, UK). A multislice spin-echo imaging sequence was used to acquire T2-weighted images [TR = 2,000 ms, eight echo times = 10, 20, 30, 40, 50, 60, 70, 80 ms, two averages, field of view (FOV) = 50 × 50 mm, matrix size = 256 × 256, slice thickness = 2 mm).
Ex Vivo.
For the animal experiments, a T2-weighted spin-echo multislice (SEMS) imaging sequence was acquired (TR = 2,800 ms, eight echo times = 10, 20, 30, 40, 50, 60, 70, 80 ms, four averages, FOV = 30 × 30 mm, matrix 192 × 192, 50 slices at 0.6-mm thickness) with T2 maps being calculated using VNMRJ 2.2 to measure relaxation times. T2*-weighted images were acquired using a multislice gradient-echo sequence (TR = 500 ms, flip angle = 15°, six averages, FOV was 30 × 30 mm, matrix size 192 × 192, 0.6-mm-thick slices).
Tissue Analysis
Identification of Transplanted Hepatocytes.
CM-DiI-labeled transplanted cells were identified in the liver and spleen paraffin-embedded sections by fluorescence microscopy using a tetramethylrhodamine isothiocyanate filter (excitation 546 nm, emission > 590 nm). SPIO-labeled cells were detected on 5-μm paraffin-embedded sections using Prussian blue staining.
Kupffer Cells and Infiltrating Tissue Macrophages.
Resident and infiltrating tissue macrophages in the liver were detected by immunohistochemistry for the rat homologue of human cluster of differentiation 68 (CD68). Spleen samples harvested at the time of sacrifice were used as positive controls. Briefly, 5-μm sections of formalin-fixed, paraffin-embedded tissue were incubated for 10 min with 3% H2O2 to block endogenous peroxidase activity. After rinsing in dH2O, the sections were treated with blocking serum and then incubated with the avidin/biotin blocking kit (Vector Laboratories). Sections were incubated overnight with the primary mouse monoclonal antibody against rat CD68 (clone ED1) from AbD Serotec (Kidlington, UK) at a 1:200 dilution. The secondary antibody used was a biotinylated anti-mouse affinity purified antibody, rat adsorbed (Vector Laboratories). The Vectastain® avidin–biotin–peroxidase (ABC) complex from Vector Laboratories and 3,3′-diaminobenzidine (DAB) chromogen from KPL (Gaithersburg, MD, USA) were used as the detection system for the immunohistochemical staining according to the manufacturers' instructions. Hematoxylin (Surgipath Europe Ltd, Peterborough, UK) was used as counterstain. Digital photomicrographs were captured with 20× objective lenses using a Leica DMR microscope equipped with a Leica DFC300FX camera and Leica Application Suite version 3.3.0 software (Leica Microsystems). The 24-bit red, green, blue (RGB) images obtained were analyzed using the ImageJ software version 1.44i developed at the National Institutes of Health (Bethesda, MD, USA). The percentage of area of DAB-stained tissue of five separate consecutive fields was determined using a plugin for color deconvolution of the images (45). Results were expressed as mean area ± SEM.
Statistical Analysis
Results are presented as mean ± standard error of the mean (SEM) unless indicated otherwise. Comparisons between groups were performed with the unpaired student t test as appropriate. Differences between labeling protocols and nonlabeled (control) cells were tested using either one-way ANOVA with comparisons between groups performed by the Tukey–Kramer test or the general linear model with repeated measurements with the least significant difference (LSD) post hoc test as appropriate. The two-way ANOVA with the Bonferroni post hoc test was used to analyze differences among groups in the long-term experiments. Comparisons among the different animal groups were performed using the Mann–Whitney U test or the ANOVA with the Tukey–Kramer post hoc test as appropriate. Statistical analysis was performed using IBM SPSS Statistics software version 19.0 (IBM Corporation, Armonk, NY, USA). A value of p ≤ 0.05 was considered statistically significant.
Results
Isolated Cell Suspensions
A total of 11 human liver tissues (six unused donor liver segments or lobes and five liver resections) were used for analysis of labeling using SPIO–PS complexes. Mean ± SEM donor age was 49.0 ± 4.6 years. Mean cell viability after isolation was 76.2 ± 2.6% with a mean cell yield of 4 × 10⁶ ± 1.1 × 10⁶ viable cells/g of liver tissue. Mean plating efficiency after overnight culture was 53.2 ± 6.9%.
Rat hepatocytes were isolated from nine rats by in situ liver perfusion. Mean cell viability after isolation was 68.8% ± 2.5%. The mean cell yield was 14 × 106 ± 2.5 × 10⁶ viable cells/g of liver tissue, and plating efficiency was 83 ± 3.5%.
Analysis of Cellular Labeling
Qualitative analysis of cellular uptake of iron was performed on cytospin slide preparations of labeled cells stained with Prussian blue. Representative photomicrographs of human and rat hepatocytes labeled with 12.5 μg Fe/ml combined with PS are shown in Figure 1A. Labeling efficiency was greater than 80%. No stainable iron was detected in nonlabeled hepatocytes.

SPIO–PS complexes are efficiently taken up by hepatocytes. (A) Representative photomicrographs of human and rat hepatocytes labeled with or without superparamagnetic iron oxide nanoparticles (SPIOs) at a 12.5 μg Fe/ml concentration and 3 μg/ml protamine sulfate (PS) for 16 h. Cells were stained with Prussian blue to visualize the intracellular incorporation of iron (blue). Scale bars: 50 μm. (B) Intracellular iron concentration in human and rat hepatocytes after 16 h of labeling. Values were compared to those of corresponding controls labeled with SPIOs alone. Data are shown as mean ± SE. Significance: *p < 0.05; ***p < 0.001.
Intracellular iron concentration increased in both human and rat hepatocytes after incubation with 12.5 μg Fe/ml (3.14 ± 0.46 and 3.63 ± 0.69 pg Fe/cell) compared to corresponding controls (1.27 ± 0.26 and 1.44 ± 0.30 pg Fe/cell, respectively). The use of PS in the labeling process resulted in significantly greater incorporation of SPIOs as shown in Figure 1B. After incubation with 12.5 μg Fe/ml of SPIOs and 3 μg/ml of PS, the intracellular iron content increased up to 11.40 ± 1.09 and 8.57 ± 0.28 pg Fe/cell in human and rat hepatocytes, respectively.
Cellular Viability and Function of SPIO–PS-Labeled Hepatocytes
The viability of human and rat hepatocytes after labeling with SPIO–PS is demonstrated in Figure 2. There were no differences in LDH leakage into the supernatant of labeled human hepatocytes compared to controls. Rat hepatocytes labeled with PS showed an increase in LDH leakage compared to nonlabeled cells. However, the difference was only statistically significant for cells incubated with PS without SPIOs (Fig. 2A). There were no significant differences in the mitochondrial dehydrogenase activity and [14C]leucine incorporation of labeled human or rat hepatocytes at the concentrations studied when compared to corresponding nonlabeled controls (Fig. 2B and C). Human hepatocytes were maintained in culture for up to 14 days after labeling, and the production of albumin and urea was determined in the supernatant at different time points. No statistically significant differences were observed in longterm albumin production between labeled hepatocytes and nonlabeled controls as shown in Figure 2D. The production of urea decreased at day 14 in all groups studied. Nonlabeled human hepatocytes, including those incubated with PS alone, showed a greater decrease in urea production than labeled cells; however, these differences did not reach statistical significance (Fig. 2E).
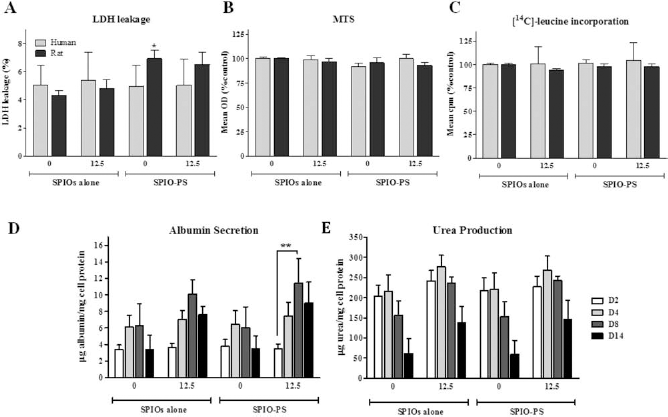
Short- and long-term effects of SPIO labeling on hepatocytes. (A) There was no increase in lactate dehydrogenase (LDH) leakage into the supernatant of SPIO-labeled cell cultures. (B) Mitochondrial activity in the 3-(4,5-dimethylthiazol-2-yl)-5-(3-carboxymethoxyphenyl)-2-(4-sulfophenyl)-2H-tetrazolium (MTS) assay and (C) incorporation of [14C]-leucine by SPIO–PS-labeled cells was comparable to control levels. For long-term studies, cells were incubated with or without SPIO nanoparticles for 16 h and maintained in culture for a further 14 days. In the concentration studied, labeling did not show any adverse effect on (D) albumin synthesis measured by enzyme-linked immunosorbent assay (ELISA) or (E) on urea production. However, there was a progressive decrease in urea production during the culture period in all groups studied. Values were compared to those of corresponding controls labeled with SPIO alone. Data are shown as mean ± SE. Significance: *p < 0.05; **p < 0.01.
In Vitro MRI and Detection Threshold
SPIO-labeled human hepatocytes had a greater effect in creating local field inhomogeneities and thus shortening of T2 relaxation time than the same number of nonlabeled cells, which resulted in signal attenuation on MR images (Fig. 3A). Labeling with SPIOs at a 12.5 μg Fe/ml concentration in the presence of PS resulted in a further decrease in T2 relaxation time. The MRI detection threshold was determined by imaging increasing numbers of labeled cells, ranging from 20 to 20,000 cells/μl. Figure 3B shows T2 relaxation times in hepatocytes labeled with SPIOs combined with PS. Concentrations of 2,000, 4,000, and 20,000 labeled cells induced a decrease of 50%, 68%, and 84%, respectively, on T2 relaxivity compared to nonlabeled cells (p < 0.001).

In vitro MRI of SPIO-labeled and nonlabeled human hepatocytes. (A) Magnetic resonance (MR) images of 20,000 cells/μl acquired on a 7T MRI system. (B) MRI detection threshold by relaxometry of increasing densities of SPIO–PS-labeled cells. Data are shown as mean ± SE. Significance: ***p < 0.001.
CM-DiI Labeling
Representative photomicrographs of rat hepatocytes labeled with or without 40 μM of CM-DiI for 5 min at 37°C are shown in Figure 4A. At this concentration, the labeling efficiency was 78.7% ± 7.9% as determined by flow cytometry. Corresponding dot plots and histograms are shown in Figure 4B. After 5 days in culture, CM-DiI-labeled cells still exhibited intense fluorescence. Minimal label transfer was observed after 24-h incubation of heat-killed CM-DiI-labeled cells with nonlabeled hepatocyte cultures (data not shown). Overall, hepatocyte viability after labeling with CM-DiI decreased by almost 20% compared with nonlabeled controls kept at 4°C. However, viability rates among CM-DiI-labeled cells and nonlabeled cells submitted to the same labeling procedure were similar. No statistically significant changes in mitochondrial dehydrogenase activity or in LDH leakage were observed after CM-DiI-labeling compared to controls (data not shown).

CM-DiI labeling of rat hepatocytes for transplantation. (A) Representative photomicrographs and (B) corresponding flow cytometric analysis of chloromethyl-benzamidodialkylcarbocyanine (CM-DiI)-labeled and nonlabeled cells. Scale bars: 50 μm.
Hepatocyte Transplantation
A total of four male rats were used as hepatocyte donors for transplantation. Mean viability of hepatocytes used for transplantation was >80%.
Acute Liver Failure Induction.
Intrasplenic transplantation of hepatocytes was performed 28 to 30 h after ALF induction with GalN. Immediately before transplantation of hepatocytes, blood tests were taken to determine the severity of the liver damage. A statistically significant increase in ammonia levels (median 89, range 31– 186 μmol/L), PT (50.9, range 16.9–96 s), and ALT (1,252, range 366–8,106 IU/L) was observed in these rats compared to normal controls (9, range 9–34 μmol/L; 11.7, range 10.8–12.7 s; 57.5, range 48–66 IU/L, respectively), as shown in Figure 5A.

Assessment of liver injury. Assessment of liver injury (A) 28 to 30 h after IP injection of d-galactosamine (GalN) compared to controls by blood ammonia levels, prothrombin time (PT), and plasma alanine aminotransferase (ALT) levels. Data are shown as mean ± SE. Significance: ***p < 0.001. (B) Biochemical parameters after acute liver failure (ALF) induction followed by hepatocyte transplantation. Liver function tests were monitored at days 1, 3, and 7 by blood ammonia, PT, aspartate aminotransferase (AST), and ALT levels. Data are shown as median and range. Significance: *p < 0.05; **p < 0.01; ***p < 0.001 compared to corresponding values at day 1.
Intrasplenic Hepatocyte Transplantation.
Intrasplenic hepatocyte transplantation of 20 × 106 hepatocytes (groups 2, 3, and 4) or injection of medium alone (group 1) was performed into female recipients with no immediate postoperative complications or mortality. One animal from each group died within 48 h of ALF induction. Plasma ALT levels at day 1 after GalN injection were significantly higher in animals that died (median 3,155, range 2,110–8,106 IU/L) than in the ones that survived (1,080, range 366–1,779 IU/L; p = 0.004). Two of the animals that died had PT > 96 s at day 1 after ALF induction, while the longest PT observed in the animals that survived was 84.5 s.
Follow-Up
Liver Function Tests.
An overall improvement in liver function was already observed in surviving animals at day 3 post-ALF induction as demonstrated in Figure 5B. Blood ammonia returned to normal levels by day 7. PT normalized after 3 days; therefore, no further measurements were performed. At day 1 after induction of liver failure, median PT in group 4 was significantly lower than in group 1, but ammonia, AST, and ALT levels were not significantly different. In all groups, AST and ALT levels gradually decreased, returning to normal levels at day 7. No differences between groups were observed with HT.
Histological Findings.
Liver histology at day 3 after GalN administration showed inflammatory cell infiltration, ballooning of hepatocytes, macrovesicular steatosis, and hepatocellular necrosis (data not shown). Figure 6A shows representative photomicrographs of macrophage immunostaining in the liver in the different groups. A statistically significant increase in the number of macrophages was observed in animals transplanted with hepatocytes (group 2, mean 8.0 ± SEM 0.7%; group 3, 9.8 ± 0.9%; group 4, 8.1 ± 0.8%) compared to sham-transplanted animals in group 1 (3.5 ± 0.3%; p < 0.05) as shown in Figure 6B.

Kupffer cells and infiltrating macrophages staining after ALF induction followed by hepatocyte transplantation. (A) Representative photomicrographs of cluster of differentiation 68 (CD68; ED1) immunoperoxidase staining of the liver at day 3 post-ALF induction in sham-transplanted animals or in animals transplanted with fresh CM-DiI–labeled cells, cultured CM-DiI–labeled cells, and cultured CM-DiI- and SPIO–PS-labeled cells. Scale bars: 50 μm. (B) Graph showing the percentage of CD68 staining among the different groups at days 3 and 7. Significance: *p < 0.05; **p < 0.01 compared to corresponding values in group 1 (sham).
Analysis of Engraftment by PCR for the Y Chromosome (Sry-2 Gene).
In the experiments with transplantation of fresh (group 2) and cultured (group 3) donor hepatocytes labeled with CM-DiI, the Sry-2 gene was detected by PCR amplification on DNA extracted from liver tissue obtained at day 3 and at the time of sacrifice, at day 7 (Fig. 7A). At no time point was male DNA detected in livers from animals from groups 1 or 4. After 7 days, however, donor cells were still identified in the spleen of animals transplanted with SPIO-PS and CM-DiI-labeled cells but not in the other groups (Fig. 7B).
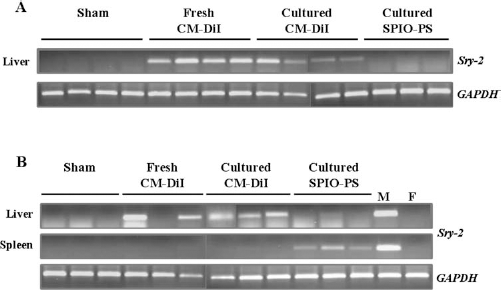
Detection of Sry-2 gene. Agarose gel electrophoresis of the sex-determining region Y 2 (Sry-2) gene PCR amplification products from DNA obtained from (A) liver biopsies at day 3 and from (B) liver and spleen at the time of sacrifice (day 7). Glyceraldehyde 3-phosphate dehydrogenase (GAPDH) was used as a control gene. Male (M) and female (F) rat DNAs were used as positive and negative controls, respectively.
MRI Detection.
Although no donor DNA was detected in the liver of animals transplanted with SPIO–PS and CM-DiI-labeled hepatocytes at any time point, 6 days after transplantation there was a clear decrease in MR signal intensity in the liver on T2*-weighted images compared to control. The signal intensity decrease was responsible for a granular pattern of the liver (Fig. 8A). In animals transplanted with vehicle injection only or with fresh or cultured CM-DiI-labeled hepatocytes, the MRI signal did not change (Fig. 8B).
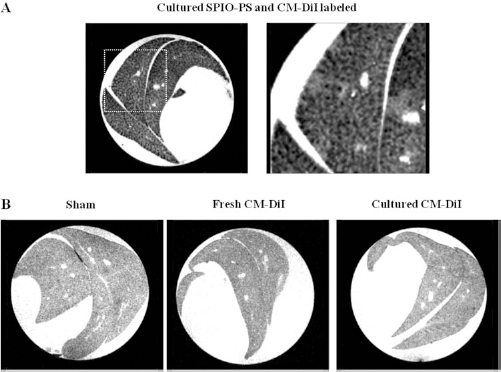
Ex vivo MRI of rat livers at 7 days after ALF induction. Ex vivo MRI of rat livers at 7 days after ALF induction treated with intrasplenic injection of (A) hepatocytes labeled in culture medium with CM-DiI and SPIO–PS complexes. The zoomed image clearly shows the effect of the SPIO in decreasing the MR signal intensity of the liver on T2*-weighted images. (B) No changes in the liver MR SI are observed after injection of medium alone, fresh, or cultured CM-DiI-labeled hepatocytes.
Histological Correlation.
CM-DiI-labeled cells were identified in the livers of all transplanted animals (groups 2, 3, and 4) at days 3 and 7; however, most of the dye was present in Kupffer cells instead of hepatocytes as shown in Figure 9B–D. The fluorescent dye was also observed in macrophages in the spleen of the rats transplanted with CM-DiI-labeled hepatocytes. Prussian blue staining for iron performed on liver sections of rats transplanted with SPIO–PS-labeled hepatocytes revealed the presence of iron in Kupffer cells and, to a lesser extent, endothelial cells. No stainable iron was observed in hepatocytes after 7 days in the sections analyzed (Fig. 9E and F).

Representative photomicrographs of rat liver sections demonstrating presence of labeled cells. Representative photomicrographs of rat liver sections at sacrifice showing (A) no CM-DiI-positive cells in sham-transplanted animals and the presence of CM-DiI-positive cells in animals transplanted with (B) fresh or (C) cultured CM-DiI-labeled cells, and (D) cultured cells labeled with CM-DiI and SPIO–PS. Slides were counterstained with 4′-6-diamidino-2-phenylindole (DAPI). Straight arrows indicate hepatocytes labeled with CM-DiI and curved arrows indicate Kupffer cells. (E) Prussian blue staining of the liver of animals transplanted with SPIO–PS-labeled hepatocytes at the time of sacrifice. (F) Higher power view of selected area demonstrating the presence of iron in endothelial and Kupffer cells. Scale bars: 50 μm.
Discussion
This study has demonstrated that the incorporation of SPIO into primary hepatocytes is greatly increased by the addition of PS, a naturally occurring low molecular weight (~4 kDa) polycationic peptide, commonly used in gene therapy protocols to deliver genetic material into cells. A variety of transfection agents (TAs) have been used in combination with contrast agents to label different types of cells (i.e., stem cells, cancer cell lines, macrophages) from various species with 100% of labeling efficiency described in some studies (4,13,29). Polycationic TAs, such as PS, form stable complexes with negatively charged SPIOs and bind via electrostatic interactions to proteoglycans on the cell membrane surface, which initiates a process of endocytosis and/or macropinocytosis of SPIO–TAs complexes (27,31,57) such that SPIOs can be detected intracellularly by electron microscopy in lysosomes. In the present study, cell labeling with SPIOs alone resulted in incorporation of the contrast agent; however, the cellular uptake was heterogeneous with a maximum of 50% of the cells labeled. Combination of SPIOs with PS resulted in a more efficient and uniform labeling in both human and rat hepatocytes.
Most of the studies so far have shown no adverse effects of SPIOs on cell viability and function (3,17,33). However, inhibition of proliferation and impairment of differentiation of mesenchymal stem cells into chondrogenic lineage was reported after SPIO labeling (5,8,24). In the present study, intracellular labeling of primary hepatocytes with SPIOs combined with PS caused no effects on hepatocyte viability and function except for a slight increase in LDH leakage by rat hepatocytes after labeling using PS even without incubation with SPIOs. Synthetic polycationic peptides have been shown to induce changes in cell membrane permeability allowing the release of molecules, such as LDH (11).
The use of PS as transfection agent required considerably lower concentrations of SPIOs for efficient labeling. Thus, hepatocyte labeling with 12.5 μg Fe/ml in the presence of PS resulted in an intracellular iron incorporation of 11 pg Fe/cell, which is in the same range as that obtained after incubation with 150 μg Fe/ml of SPIOs alone for the same period of time, as previously reported (40). Hepatocytes labeled with SPIOs combined with TA induced further decreases in T2 relaxation time compared to cells labeled with the same concentration of SPIOs alone. Similar results were reported by Suzuki et al. (56), after comparison of three transfection methods to label mouse embryonic stem cells: poly-l-lysine, PS, and electroporation. They showed that SPIO–PS-labeled cells induced the largest MRI decrease in SI, which was consistent with the highest intracellular iron uptake.
Hepatocyte transplantation was performed in rats with ALF to determine if labeled cells would integrate into the liver parenchyma in the setting of acute liver injury. Significant variability is observed in the response of animals to IP administration of GalN. Different factors, such as animal species, strain, sex, weight, and time of administration, have been reported to play a role in the severity of the response (58). In the current study, care was taken to conduct the experiments using the same batch of GalN, and injections were performed approximately at the same time of the day in the different groups. One quarter of the animals studied developed considerably severe liver dysfunction to the extent that they died of ALF.
Following an acute hepatic insult, there is a rapid and marked increase in the number of inflammatory cells within the liver. Karlmark et al. (22), using a murine model of acute CCl4 hepatotoxicity, demonstrated an increase in the number of infiltrating macrophages, which accounted for 10% to 12% of the total number of cells in the liver 24 to 48 h after the onset of liver injury. Similarly, in a paracetamol model of hepatotoxicity, it was found that the infiltrating macrophages were derived from circulating monocytes rather than from proliferation of the resident Kupffer cell population (18). Current evidence from experimental models and human observations suggests that Kupffer cells are activated early in the course of acute liver injury and release chemokines and proinflammatory cytokines. Kupffer cell activation by endotoxin has been reported to be an important early event in the mechanism of galactosamine hepatoxicity in the rat (52). Simultaneously, macrophages initiate a counteracting anti-inflammatory response, releasing interleukin (IL)-6 and IL-10, which moderates the degree of acute hepatic inflammation. Circulating monocytes are then recruited to the liver and are implicated in the resolution of inflammation and tissue repair processes (39,52).
After HT into a normal liver, most of the cells remain entrapped in the portal spaces and sinusoids where they are recognized as “non-self” by Kupffer cells and granulocytes and are cleared within 24 to 48 h (20,25). These findings were confirmed in the present study by immunohistochemical staining for CD68. Two days after HT, there was a significant increase in the number of macrophages in the livers of animals transplanted with hepatocytes during the acute liver injury phase compared to controls. The increased number of activated macrophages in the liver is likely to help clear part of the transplanted cells (18,39). On the other hand, the release of cytokines by Kupffer cells early in the progress of acute liver injury also induces an increase in vascular permeability and sinusoidal endothelium disruption, facilitating the engraftment of transplanted hepatocytes (16). Using dipeptidyl peptidase 4 (DPPIV)-deficient animals as recipients, Gupta et al. (15) showed an increase in the number of donor hepatocytes detected in the livers of GalN-treated animals compared to normal rats at day 14 after transplantation. In the present study, donor hepatocytes have been marked with the fluorescent CM-DiI to facilitate their detection in the recipient liver after transplantation. Engraftment of transplanted CM-DiI-labeled cells was observed 6 days after transplantation with most of the hepatocytes occurring singly. Culture of hepatocytes and their detachment before transplantation did not affect engraftment. Most of the dye, however, was distributed within Kupffer cells in both groups, probably as a result of clearance of transplanted cells. In addition, cells colabeled with SPIO–PS complexes and CM-DiI could not be identified by PCR or fluorescence analysis in the liver of transplanted animals at any time point studied. Interestingly, only DNA from donor hepatocytes from this group could be detected in the spleen at sacrifice. Nagata et al. (34) had previously shown engraftment of transplanted porcine hepatocytes in the spleen of cynomolgus monkeys 40 days after transplantation by asialoglycoprotein receptor-directed nuclear imaging. As donor DNA from fresh or cultured hepatocytes labeled with CM-DiI only was not detected in the recipient spleen, it is possible that the use of SPIO–PS complexes may either have impaired translocation of cells to the liver or have enhanced engraftment in the spleen. However, a significant increase in the number of macrophages in the livers of rats transplanted with SPIO–PS-labeled hepatocytes compared to controls suggests that part of the cells translocated to the liver. If some of the SPIO–PS complexes are not internalized and stay attached to the outer cell membrane, they are likely to interfere with surface interactions or may detach from the membrane and can be transferred to other cells.
In vitro studies confirmed that SPIO–PS-labeled hepatocytes could readily be detected by MRI. The MRI scanning of the livers harvested at day 7 post-ALF induction showed a decrease in signal intensity on T2*-weighted images in those animals transplanted with SPIO–PS-labeled cells. However, histological analysis showed that this iron was present in Kupffer and endothelial cells, not hepatocytes, and was mostly distributed in the periportal areas. Most of the experimental in vivo studies performed using MRI to track hepatocytes or progenitor cells report an initial decrease in the signal intensity on T2- or T2*-weighted images, which gradually returned to normal after 14 days (5,9,10,21,28,50). The disappearance of the MRI signal is probably due to hepatocyte death as part of the innate immune response to hepatocyte transplantation and subsequent uptake and degradation of the contrast agent by Kupffer cells in the liver. Jirak et al. (19) showed that injection of free iron oxide particles under the kidney capsule induced regions of signal loss that persisted for much longer than the same injection into the liver in the same animal, confirming the role of Kupffer cells in degrading these particles. Similar to the findings in the current study, Leconte et al. (26) described a decrease in T2* relaxation time 7 days after transplantation of hepatocytes labeled with fluorescent MPIOs into mice treated with cyclophosphamide to disrupt the sinusoidal endothelium. However, on histology, most of the iron was present in Kupffer cells and not hepatocytes.
In summary, the combination of clinically approved dextran-coated SPIOs with PS allowed efficient and uniform labeling of human and rat hepatocytes for MRI. The labeling technique is straightforward using a combination of two clinically approved agents, which should facilitate the translation of this method to the clinical setting of HT. The use of iron oxide nanoparticles for cell tracking may be useful to assess the biodistribution of the cells in the early phases after transplantation. However, the clearance of labeled cells by Kupffer and endothelial cells in the later phases after transplantation will limit the value of MRI as a tool to assess long-term engraftment of SPIO–PS-labeled hepatocytes, particularly in ALF.
Footnotes
Acknowledgments
This work was performed as part of the MRC Centre for Transplantation. The authors would like to thank the Liver Transplant and Hepatobiliary Surgery teams and the Liver Pathology Service at King's College Hospital for their cooperation in obtaining liver tissues and Dr. R. Sherwood from the Biochemistry Department at King's College Hospital for the serum biochemical analysis. J.P. was supported by an Alex Mowat PhD studentship. M.M. is supported by an EU FP VII grant dedicated to cellular MR imaging (201842—ENCITE). The authors declare no conflicts of interest.