
Abstract
BACKGROUND:
Regulatory T cells (Tregs) are central to determine immune response, thus targeting Tregs for immunotherapy is a promising strategy against tumor development and metastasis.
OBJECTIVES:
The objective of this study was to identify genes for targeting Tregs to improve the outcome of HCC.
METHODS:
We integrated expression data from different samples to remove batch effects and further applied embedding function in Scanpy to conduct sub-clustering of CD4
RESULTS:
We found that regulator of G protein signaling 1 (RGS1) expression was significantly elevated in Tregs compared to other CD4
CONCLUSIONS:
Our findings suggested that RGS1 may regulate Treg function possibly through CXCR4 signaling and RGS1 could be a potential target to improve responses for immunotherapy in HCC.
Introduction
Hepatocellular carcinoma (HCC), accounting for
Even though targeting the immune checkpoints for HCC treatment seems promising, only
Considering the evidence of Tregs’ infiltration in HCC microenvironment and the critical role of Tregs in suppressing the beneficial immune response in tumor microenvironment, studies on how to inhibit the suppressive function of infiltrated Tregs in tumor microenvironment became increasingly important. Recently, PTEN has been reported to affect Treg function through regulation of PI3K-AKT activity [13]. In non-small-cell lung cancer, IRF4 determines differentiation of effector Treg and immune suppressive function [14]. Moreover, enzymatic activity of HPGD, catabolized PGE
To investigate the candidate genes for targeting Tregs in HCC as well as the potential mechanisms, we first utilized two independent public scRNA-seq datasets to profile CD4
Materials and methods
Data preprocessing
Two independent raw count matrixes for single-cell RNA-seq data were retrieved from the NCBI Gene Expression Omnibus database (accession code: GSE156337 and GSE151530) [18, 19]. We applied the same quality-control filtering used in original study to reproduce similar results. The annotation of cells was directly retrieved from original results. Additionally, we conducted a re-clustering analysis to validate annotations for CD4
For two independent bulk RNA-seq data, the raw count files generated by HTSeq and clinical information for The Cancer Genome Atlas Liver Hepatocellular Carcinoma (TCGA-LIHC) cohort were obtained from GDC Data Portal (
Sub-clustering CD4
T cell
To investigate CD4
Differential gene expression analysis using scRNA-seq data
To compare gene expression signatures among different sub-clusters or groups, we first computed a ranking for the highly differential genes in each CD4
Validation of differential gene expression based on bulk RNA-seq
We applied the k-Means clustering to classify group based on expression matrix of selected genes from bulk RNA-seq data using scikit-learn module in python [24]. The difference of gene expression between groups from bulk RNA-seq was calculated by Wilcoxon rank-sum test in R project (
Weighted gene correlation network analysis (WGCNA)
To identify co-expression genes on HCC bulk RNA-seq data, we performed a gene expression network analysis with the WGCNA R package [25]. Top 10,000 genes with high variance among bulk RNA-seq samples were included into the further analyses for each dataset. The soft-thresholding power and co-expression adjacency were determined by recommended method from WGCNA. We then detected modules and calculated the correlation of genes for each module with default parameters.
Survival analysis for RGS1
To determine the optimal cut-point for the expression of RGS1, we applied surv_cutpoint function in survminer R package (
Multiplex immunofluorescence analysis
To label the expression spatial distribution and intensity of RGS1, CD4 and FOXP3 in HCC tumor tissues and adjacent tissues, the tissues were fixed with 4% paraformaldehyde within 0.5 h after being excised, and then dehydrated and embedded in paraffin using routine methods. The paraffin blocks of HCC tumor tissues or adjacent tissues were cutting into 4
Results
Landscape of CD4
T cells in HCC
To characterize the comprehensive spectrum of CD4
The profile of CD4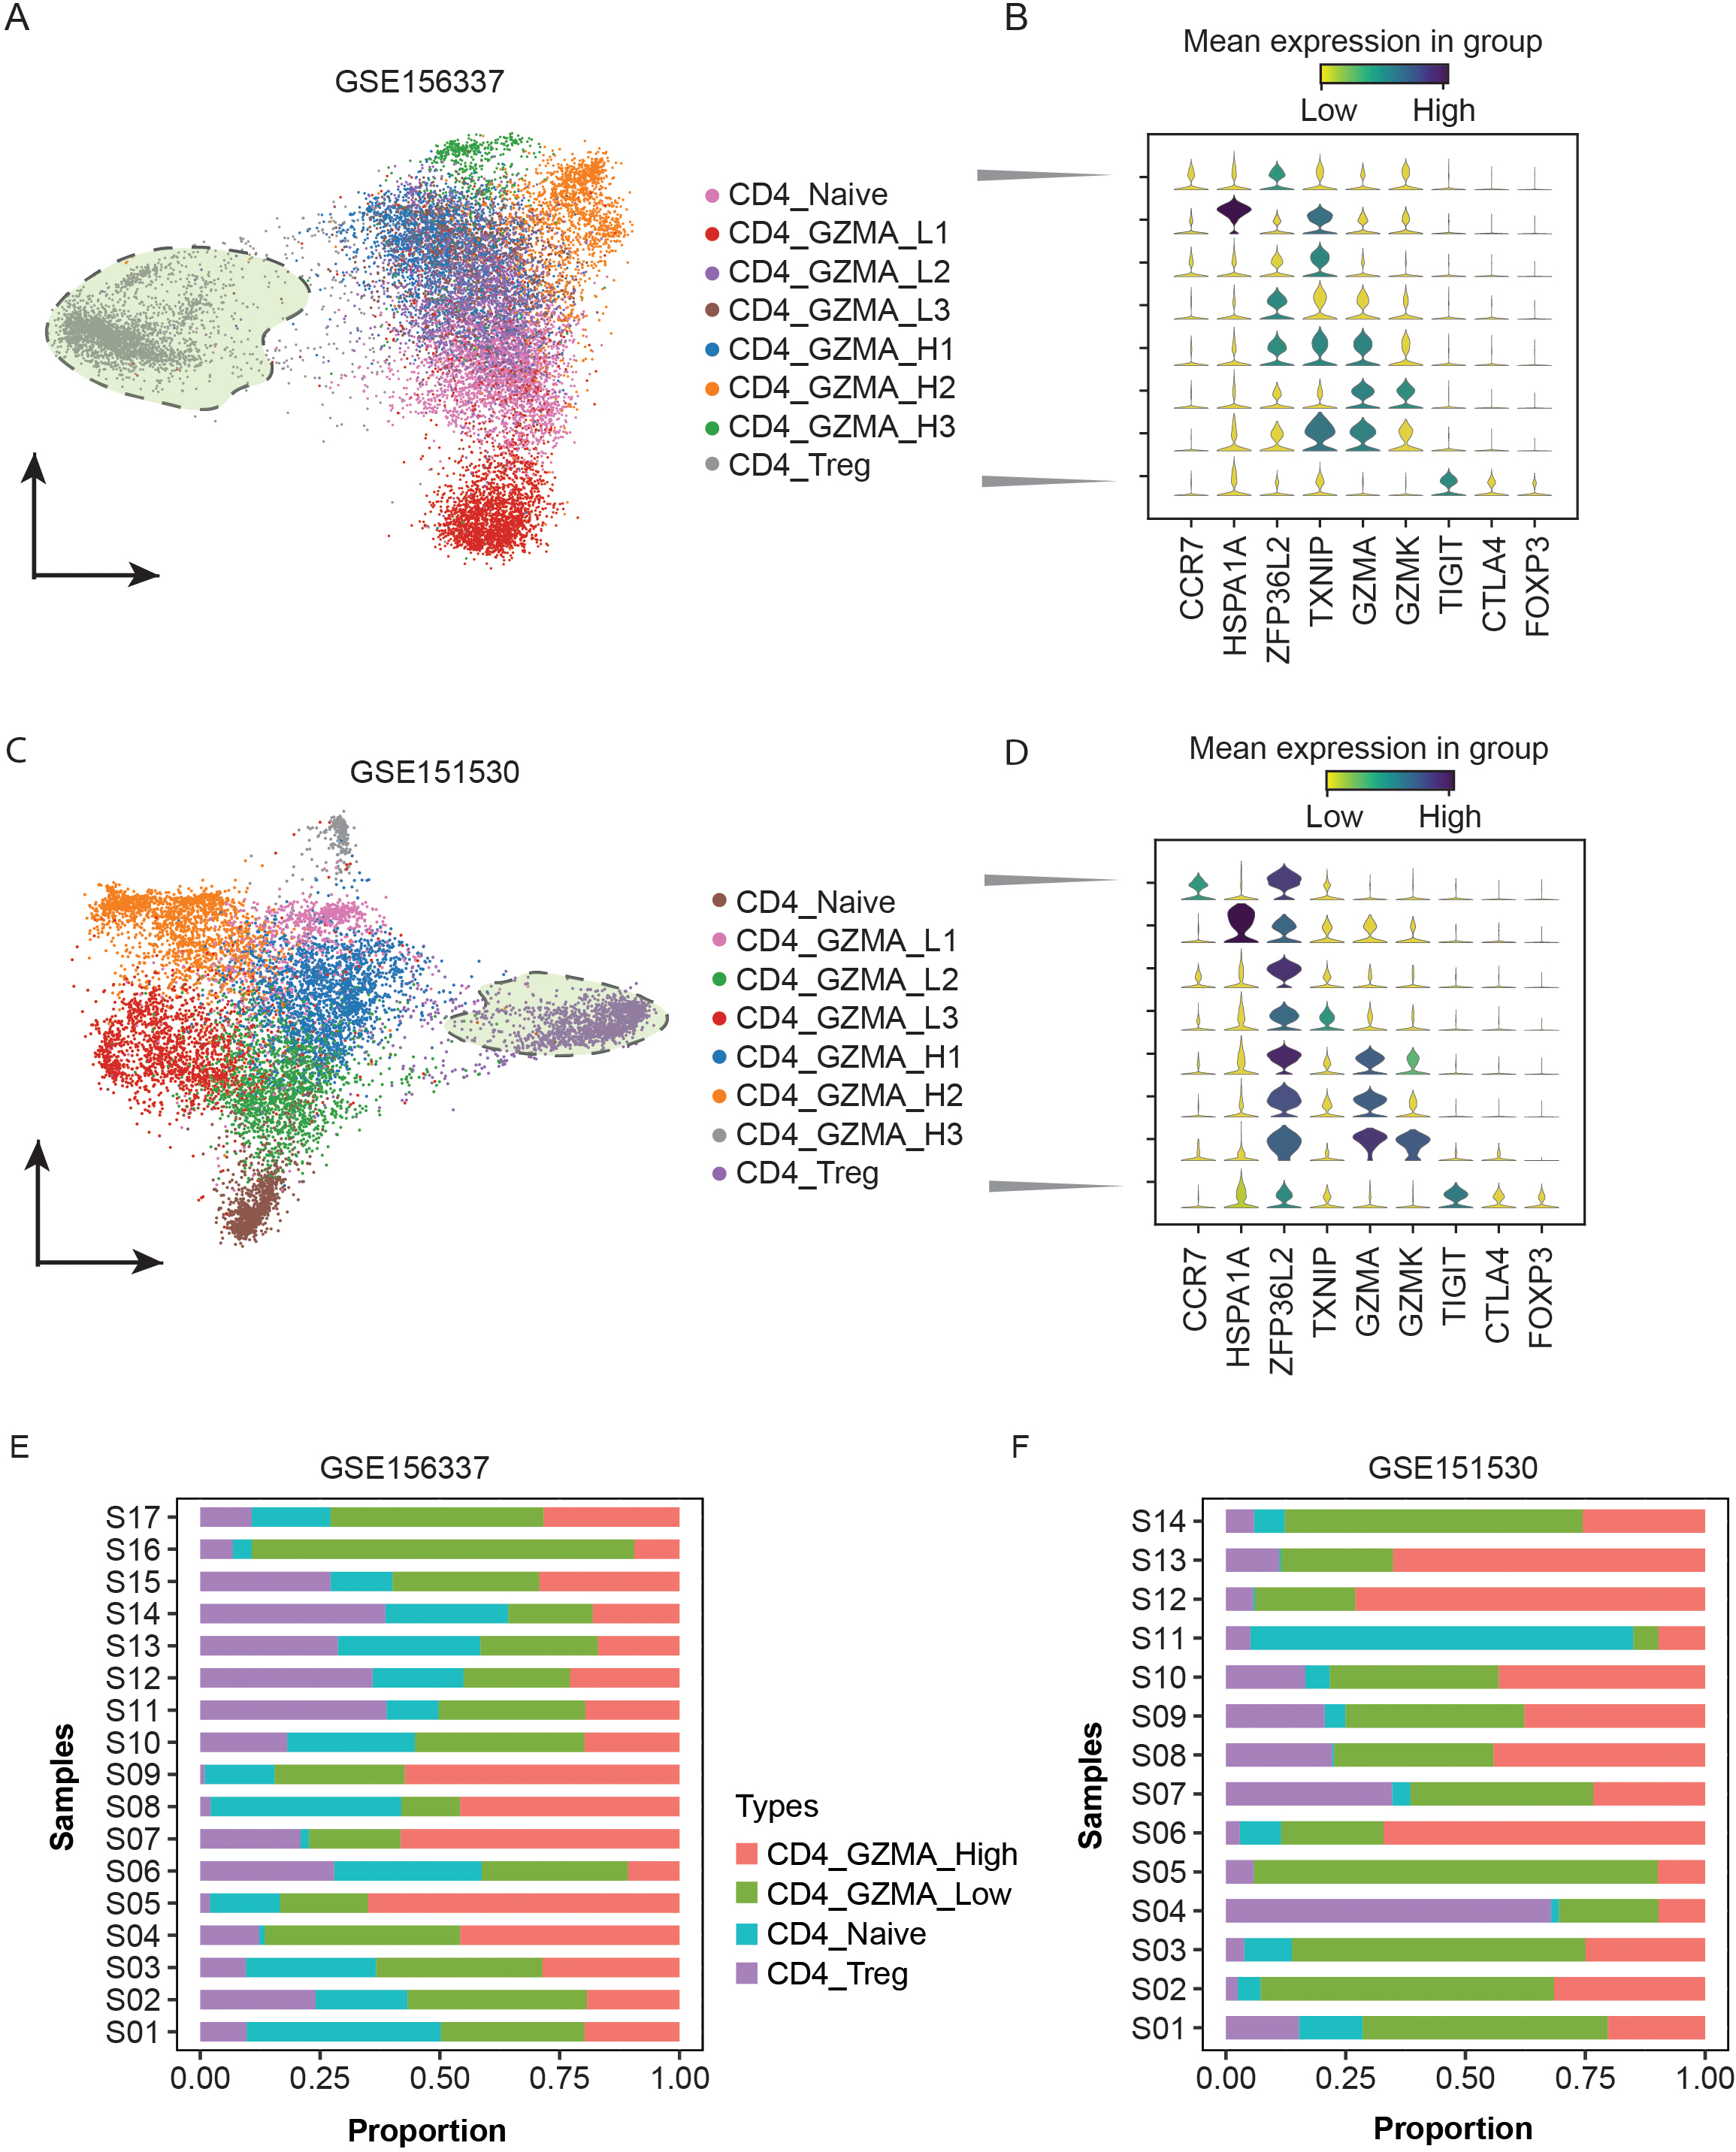
To annotate CD4
To validate the classification of CD4
As one subpopulation of functionally distinct CD4
RGS1 highly expressed in Tregs compared to other CD4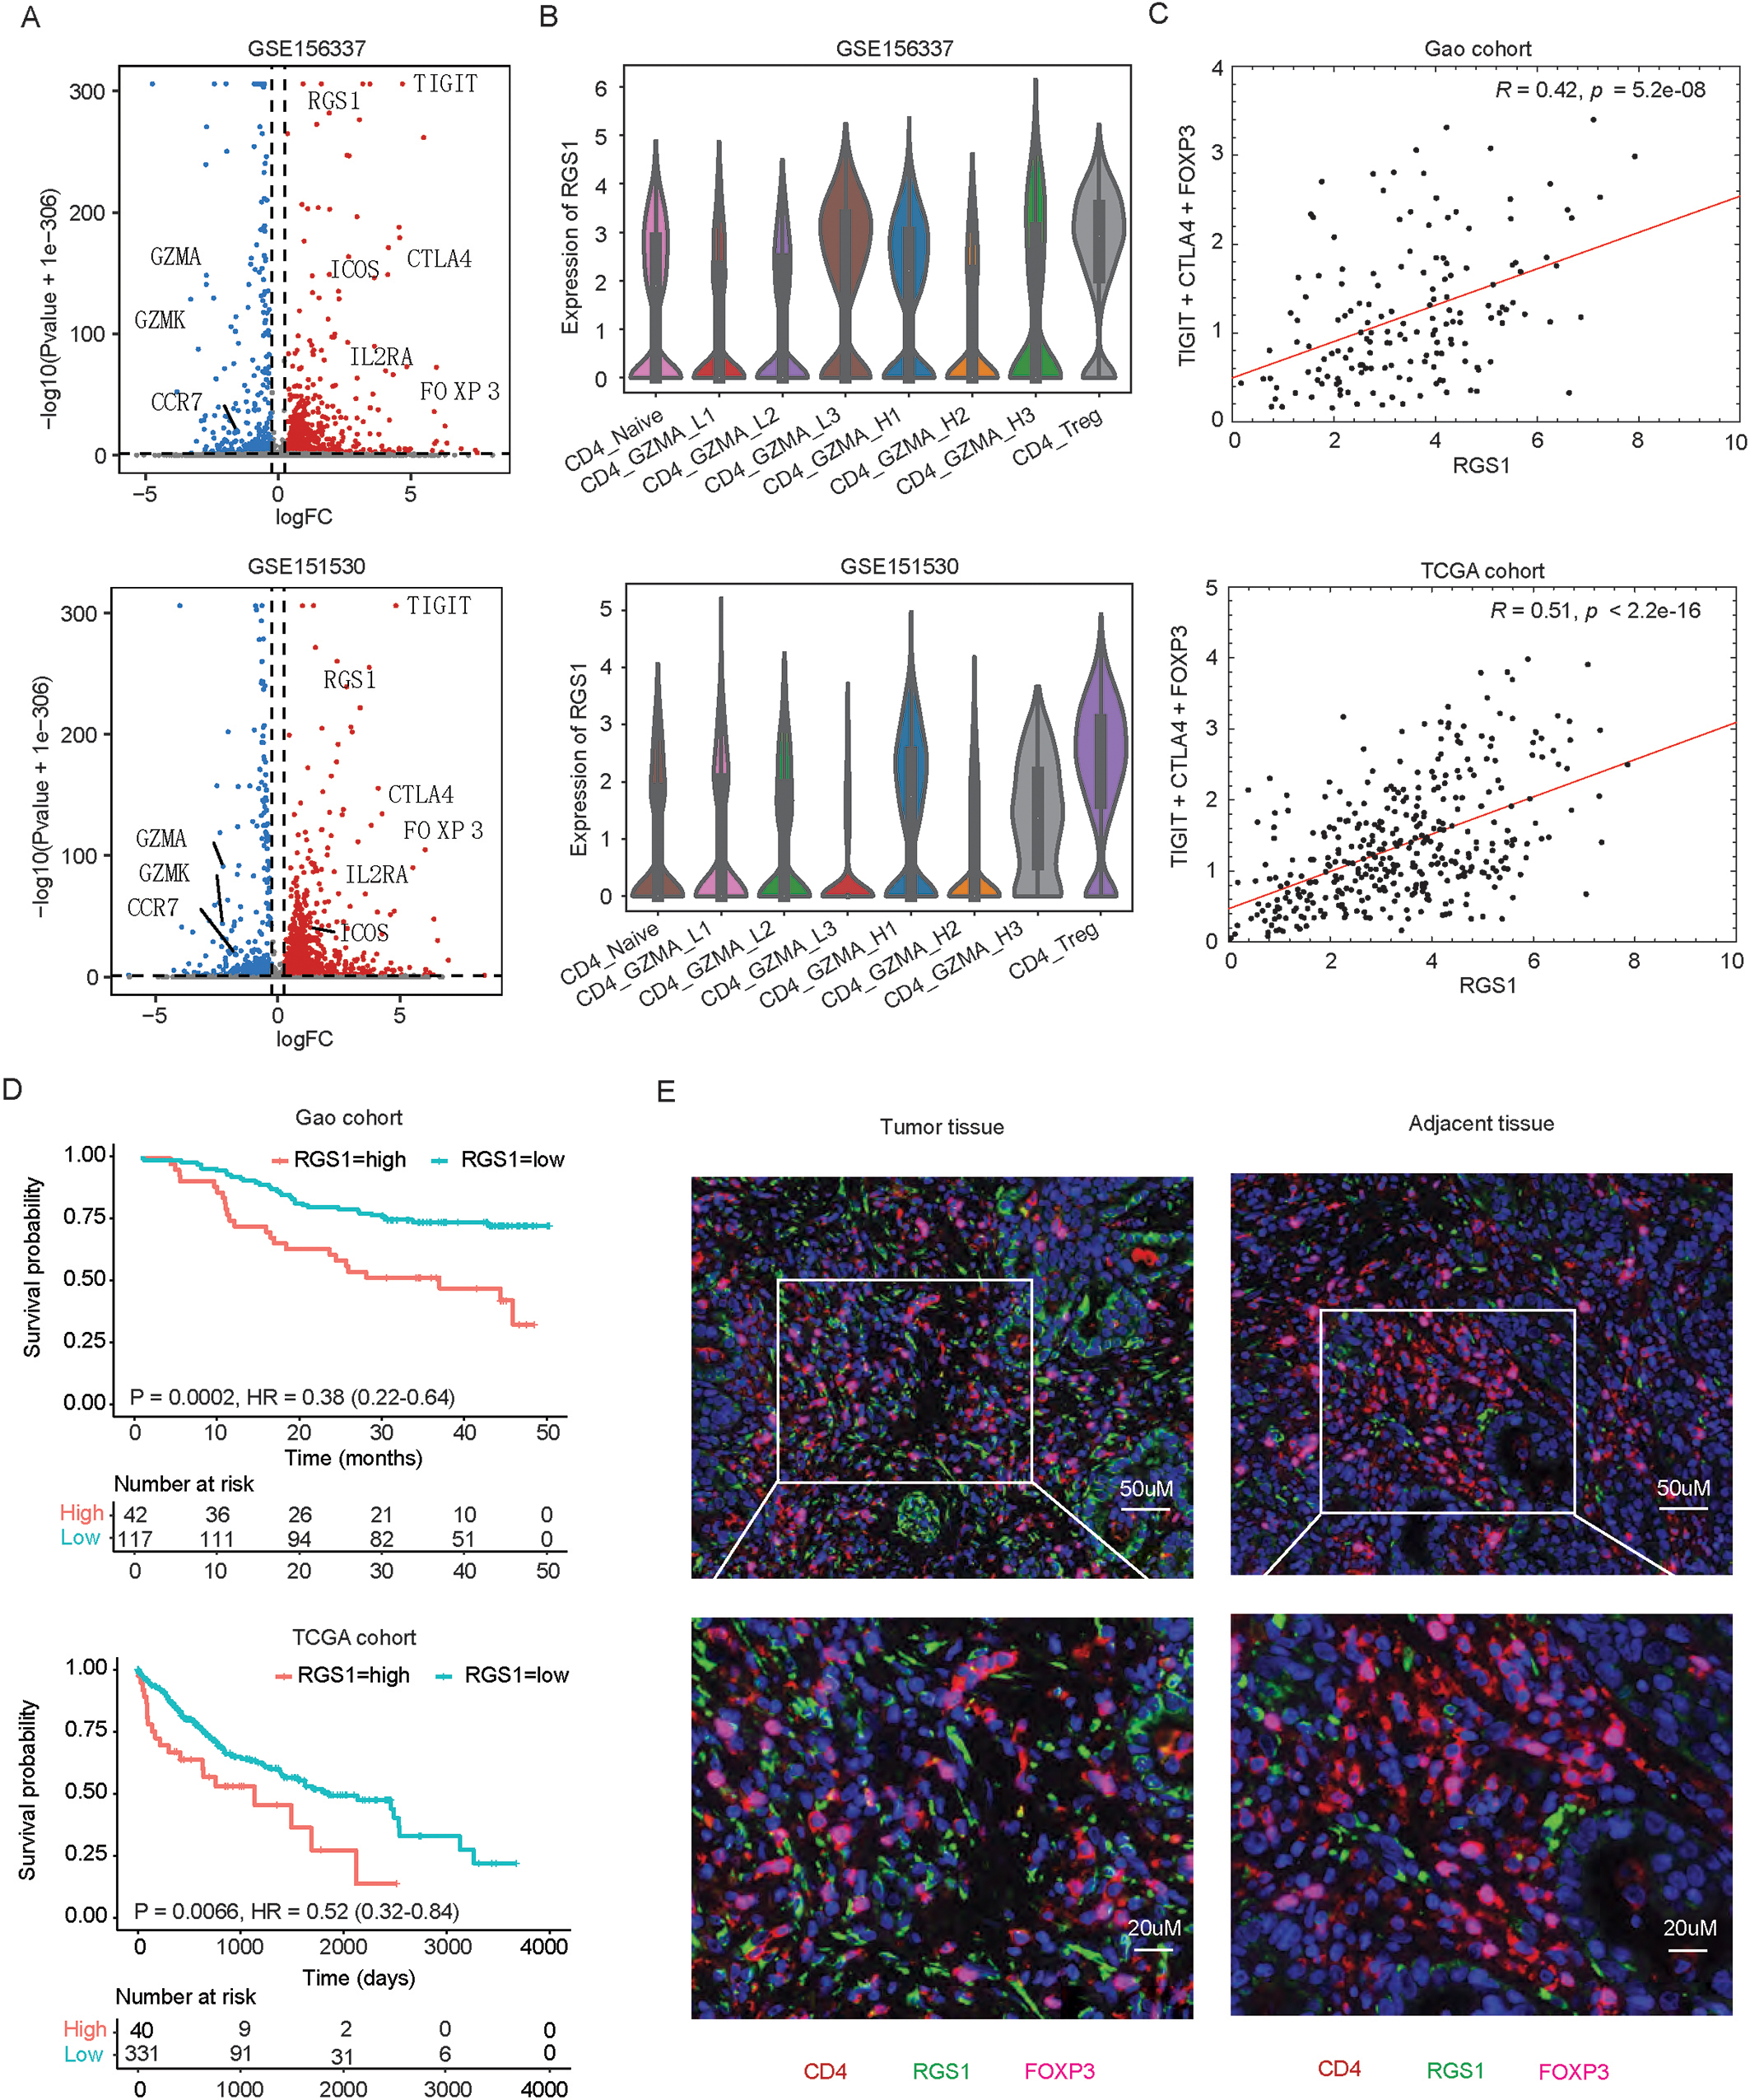
To investigate the correlation between RGS1 and Tregs marker genes, we then analyzed bulk RNA-seq data from two independent HCC cohorts. After normalization of gene expressions, we first calculated the mean expression of three Tregs marker genes (CTLA4, FOXP3, and TIGIT) and then conducted correlation analysis of gene expression between RGS1 and the mean of the three Tregs marker genes. Results showed that RGS1 expression is positively associated with Tregs marker genes expression in both Gao cohort (
Given the significant high expression of RGS1 in Tregs and the role of Tregs in facilitating oncogenesis, we next asked whether RGS1 expression predicts overall survival of HCC patients. Using the optimal cutpoint determined by survminer package, HCC patients in cohort were classified into low and high RGS1 expression groups. Survival analysis result indicated that high expression of RGS1 was significantly associated with poor outcome in both Gao cohort (
To investigate the role of RGS1 in Tregs, we classified Treg cells into RGS1 low and RGS1 high groups based on the 25
The expression of RGS1 significantly associated genes involved in Tregs function by CXCR4 signaling among scRNA-seq data. (A) Highly different expression genes between RGS1 high and low among Tregs in HCC (GSE156337). (B) Validation of DEGs in another dataset (GSE151530). (C) Stacked violin plot showing selectively expression of four genes involved in HCC Tregs function compared to other conventional CD4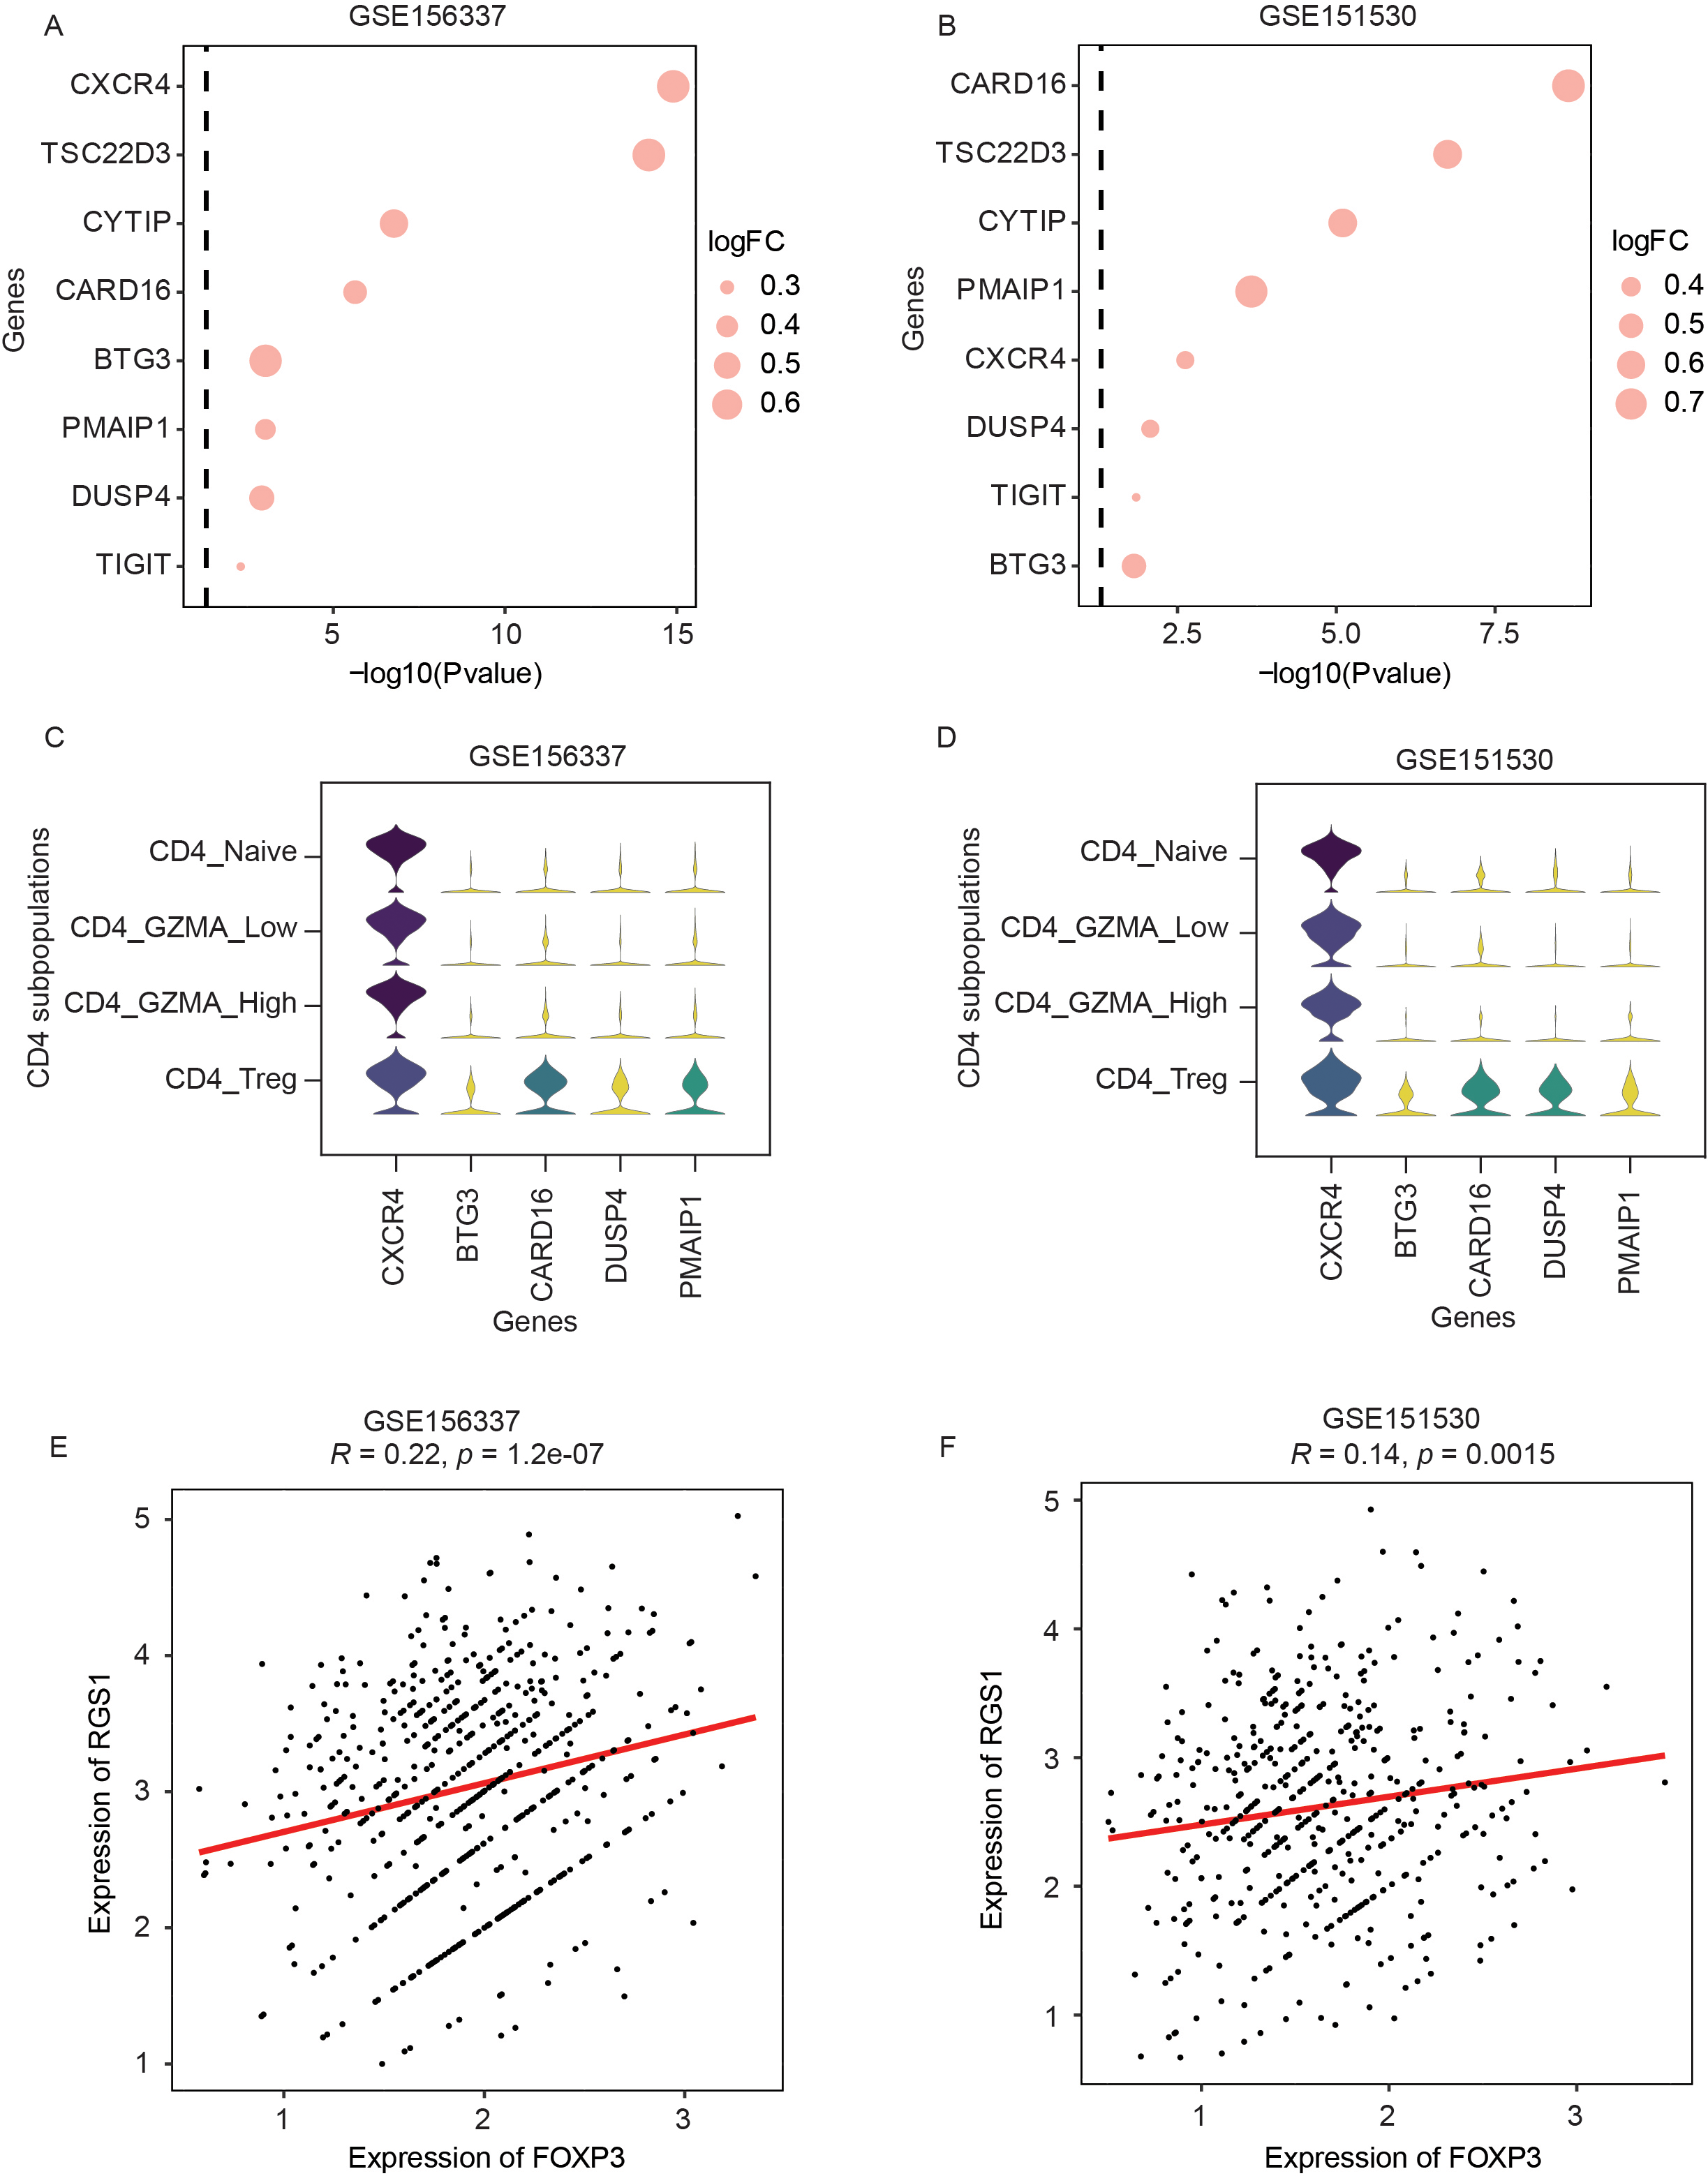
As chemokines play a critical role in maintenance of Tregs homeostasis, we asked whether chemokine-related genes are differently expressed between RGS1 low Tregs and RGS1 high Tregs. Notably, the expression of chemokine receptor gene (CXCR4) was significantly enriched in RGS1 high Tregs in both scRNA-seq datasets (Fig. 3A and B). Our analysis suggested that RGS1 and CXCR4 may cooperate to affect the function of Tregs in HCC TME.
To further assess the role of RGS1 in Tregs function, we identified candidate genes selectively expressed in Tregs rather than in other conventional CD4
Co-inhibitory receptor TIGIT is predominantly expressed on the surface of Tregs and is shown to play a vital role in the suppressive function of Tregs [31, 32]. Our differentially expressed genes (DEGs) analysis identified that TIGIT expression was significantly increased in Tregs with RGS1 high compared to RGS1 low (Fig. 3A and B), suggesting an important role of RGS1 in regulation of Tregs function. Interestingly, similar positive correlation was not found on FOXP3, another Treg marker gene. To figure out why, we investigated the expression of FOXP3 for each individual Tregs and found that the FOXP3 expression values in more than half of Tregs were zero due to high drop-out rate in the scRNA-seq data we used here. However, it should be noted that RGS1 expression was positively related to FOXP3 expression (GSE156337,
To validate the above analysis results found in scRNA-seq data, we conducted WGCNA using two bulk RNA-seq datasets. Although bulk RNA-seq data was mixed by diverse cell types and the proportion of Tregs in bulk RNA-seq was comparatively small, the results from bulk RNA-seq data were consistent with our analyses from scRNA-seq, revealing that the correlation network of RGS1 not only included Treg marker genes (CTLA4, IL2RA and TIGIT), but also part of key genes with CXCR4 signaling (CARD16, DUSP4, and PMAIP1) (Fig. 4A and B). The Pearson correlation analysis also suggested that RGS1 was highly related to CXCR4 and three genes involved in CXCR4 signaling (Fig. 4C and D).
Validation of association between RGS1 and Tregs signature genes by two independent bulk RNA-seq datasets. (A) Weighted gene co-expression network analysis (WGCNA) showing the association of RGS1 and Tregs signature genes in bulk RNA-seq data from Gao cohort. Red: top 100 genes associated with RGS1; yellow: top 200 associated genes; blue: top 500 associated genes; green: top 600 associated genes. (B) Consistent association found in TCGA cohort. (C) Significantly positive association between RGS1 and Tregs signature genes (CARD16, CXCR4, DUSP4 and PMAIP1) in Gao cohort. The correlation coefficients were measured by Pearson correlation. (D) Validation of positive association by TCGA cohort. (E) Heatmap showing diverse expression of genes used for k-means clustering. Three (low, middle, and high) groups are determined by k-means clustering method based on the expression of RGS1, CXCR4, CARD16, DUSP4 and PMAIP1. Boxplot showing significantly different expression of Tregs marker genes between RGS1 low and high group from Gao cohort. (F) Validation of significantly different expression of Tregs marker genes in TCGA cohort.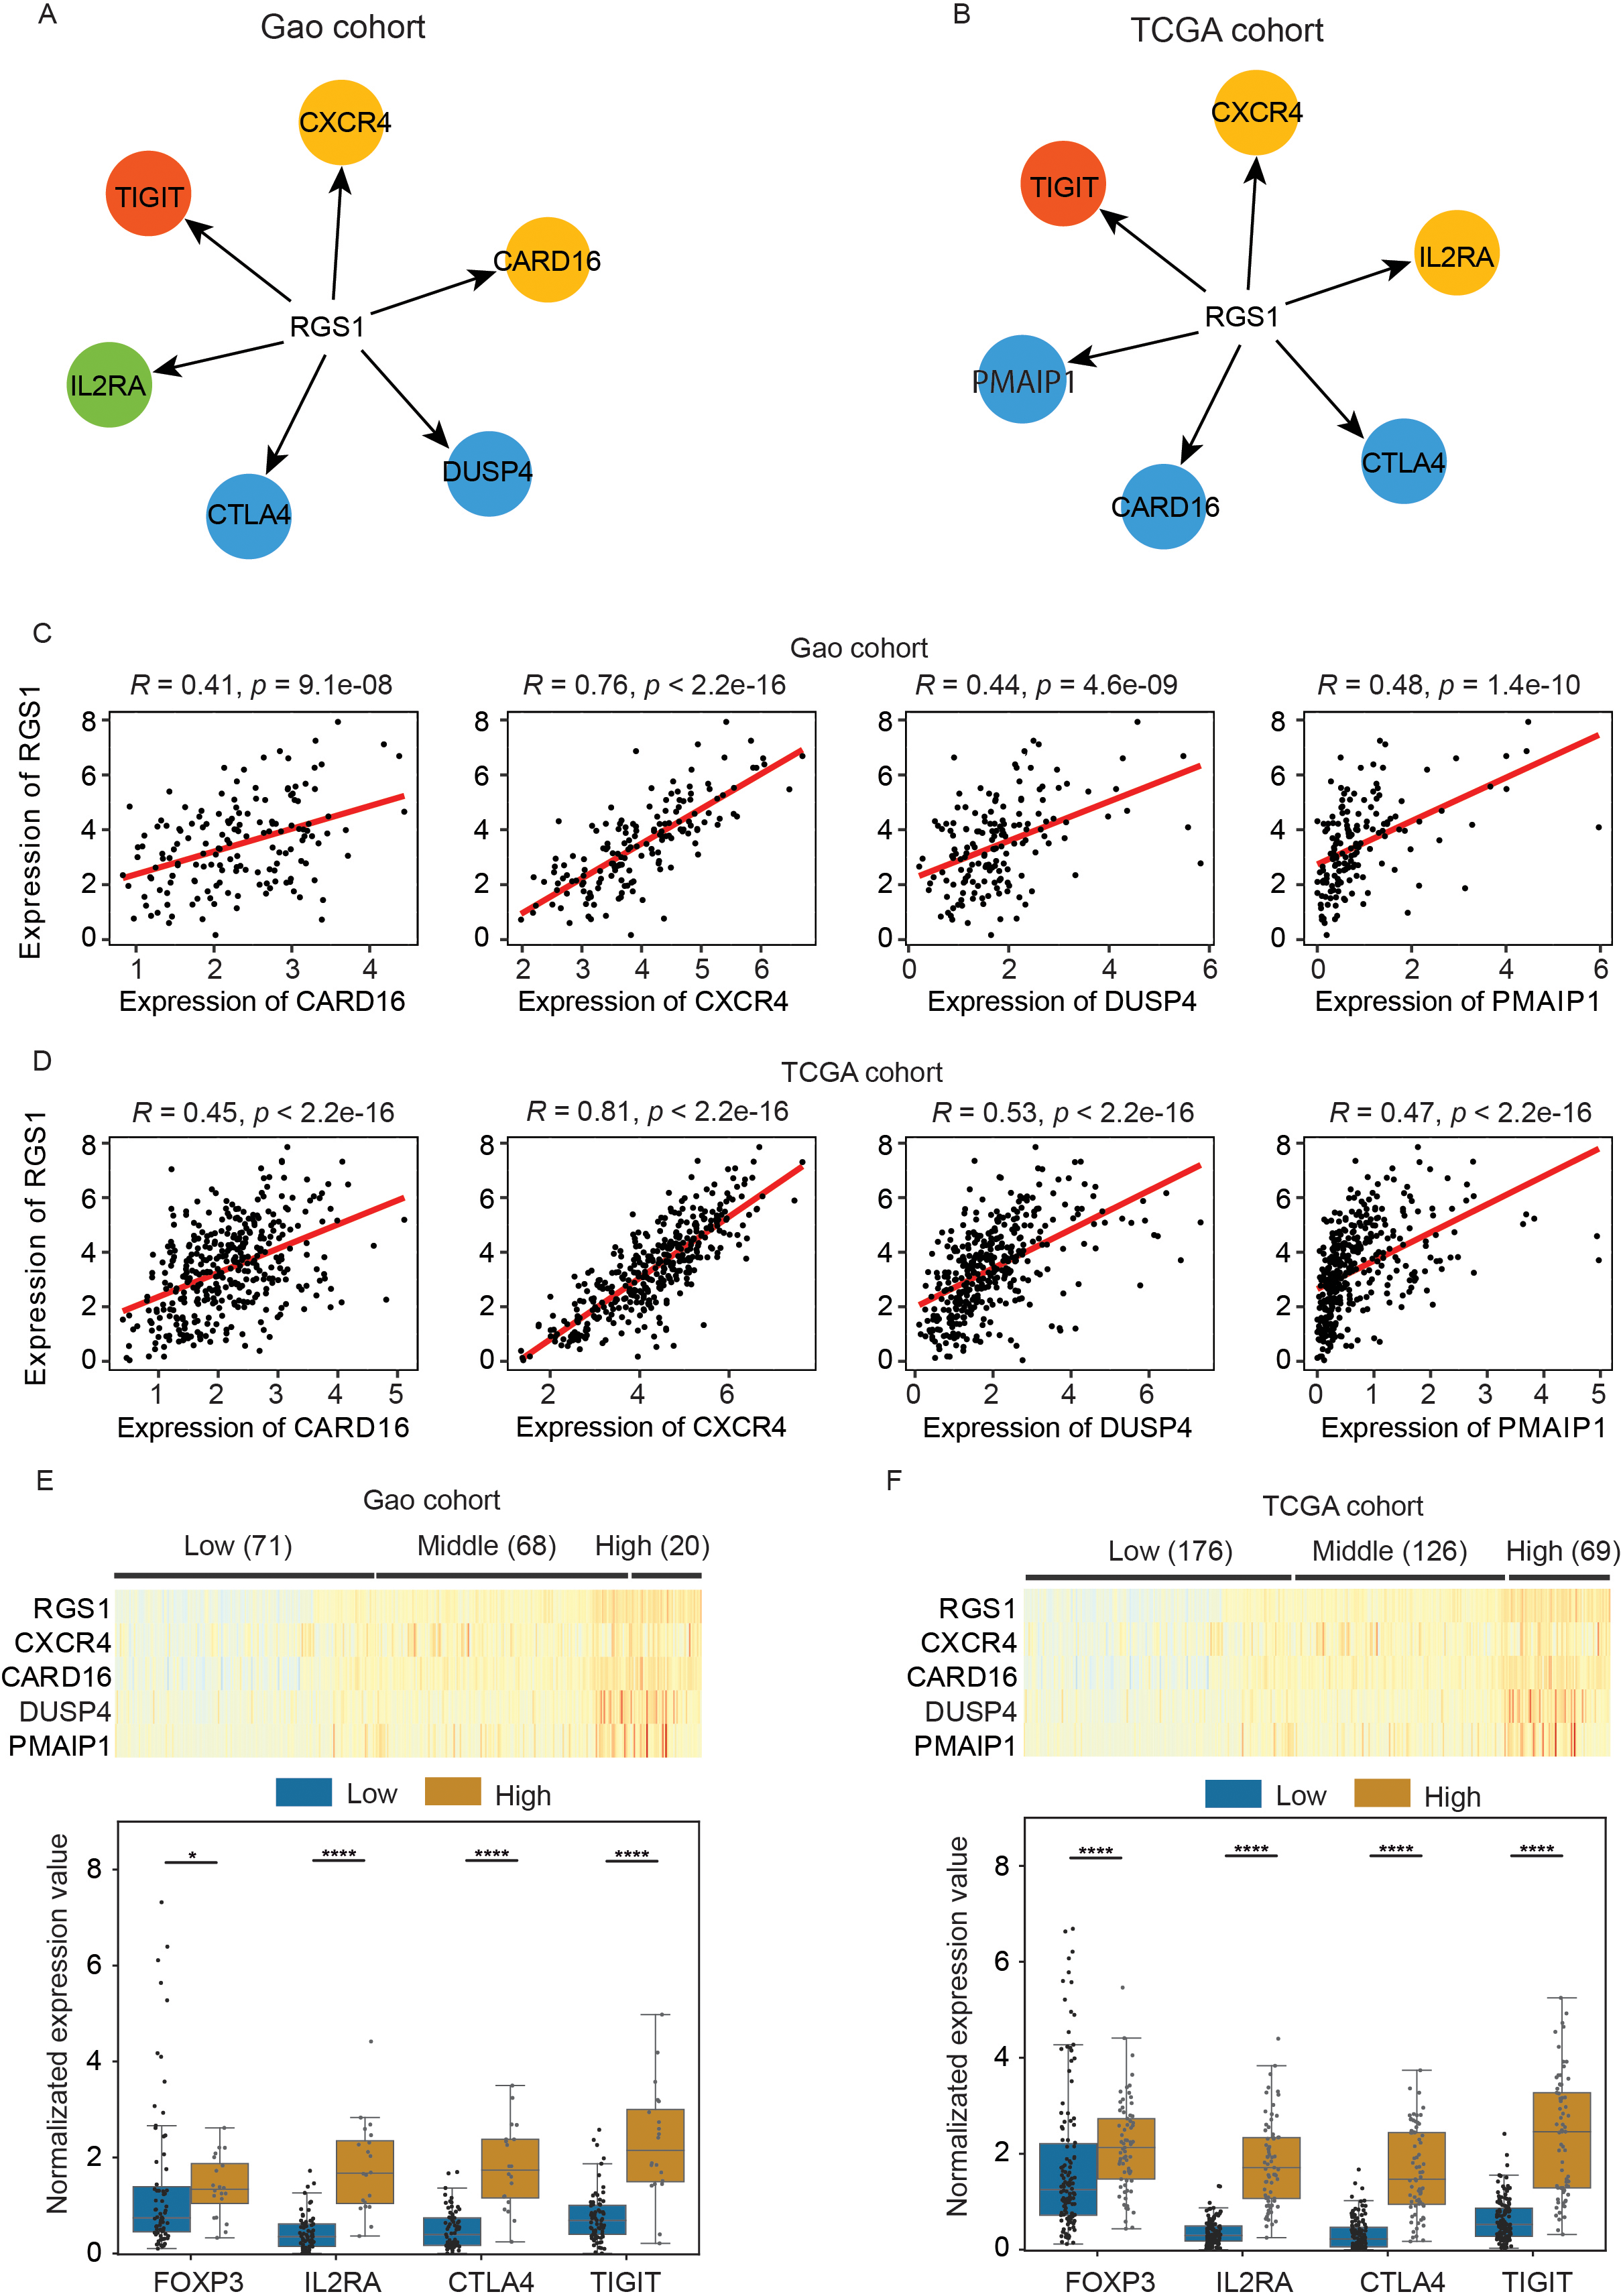
Given the high correlation between RGS1 and the genes related to CXCR4 signaling, we asked whether the expressions of Treg marker genes can be predicted by RGS1 and CXCR4 signaling genes. We first applied k-means clustering to classify HCC patients into three groups based on expression matrix of RGS1 and CXCR4 signaling genes. As shown in Fig. 4E and F, there were three distinct groups with significantly different expression of their genes. We further compared the expression of Treg marker genes (CTLA4, FOXP3, IL2RA, and TIGIT) in low and high groups defined by RGS1 and CXCR4 signaling genes. Our data suggested that these four Treg marker genes were all significantly increased in RGS1 high group compared to its low group (
To identify the key transcription factors downstream of RGS1, we conducted functional TF analysis between RGS1 high and RGS1 low cells in Tregs using DoRothEA. This approach predicts the activity of transcription factors by the expression of their targets. Here, we excluded the low confidence levels D and E to only maintain high quality regulons in DoRothEA for further analysis. The prediction results revealed that the TF activity of RBPJ (Fig. 5A and B) was significantly increased in Tregs with RGS1 high in both scRNA-seq datasets (mean change
The inference of activation of transcription factors for RGS1 low and high expressed groups. (A) RBPJ activity significantly elevated in RGS1 high expressed group compared to it low group in GSE156337. (B) Validation of elevated RBPJ activity with RGS1 high expression in another dataset (GSE151530). (C) Decreased YY1 activity in Tregs RGS1 high expressed group compared to it low group in GSE156337. (D) Validation of decreased activity of YY1 in another dataset (GSE151530). (E) Elevated RBPJ activity in group with high expression of RGS1 and five related genes in Gao cohort (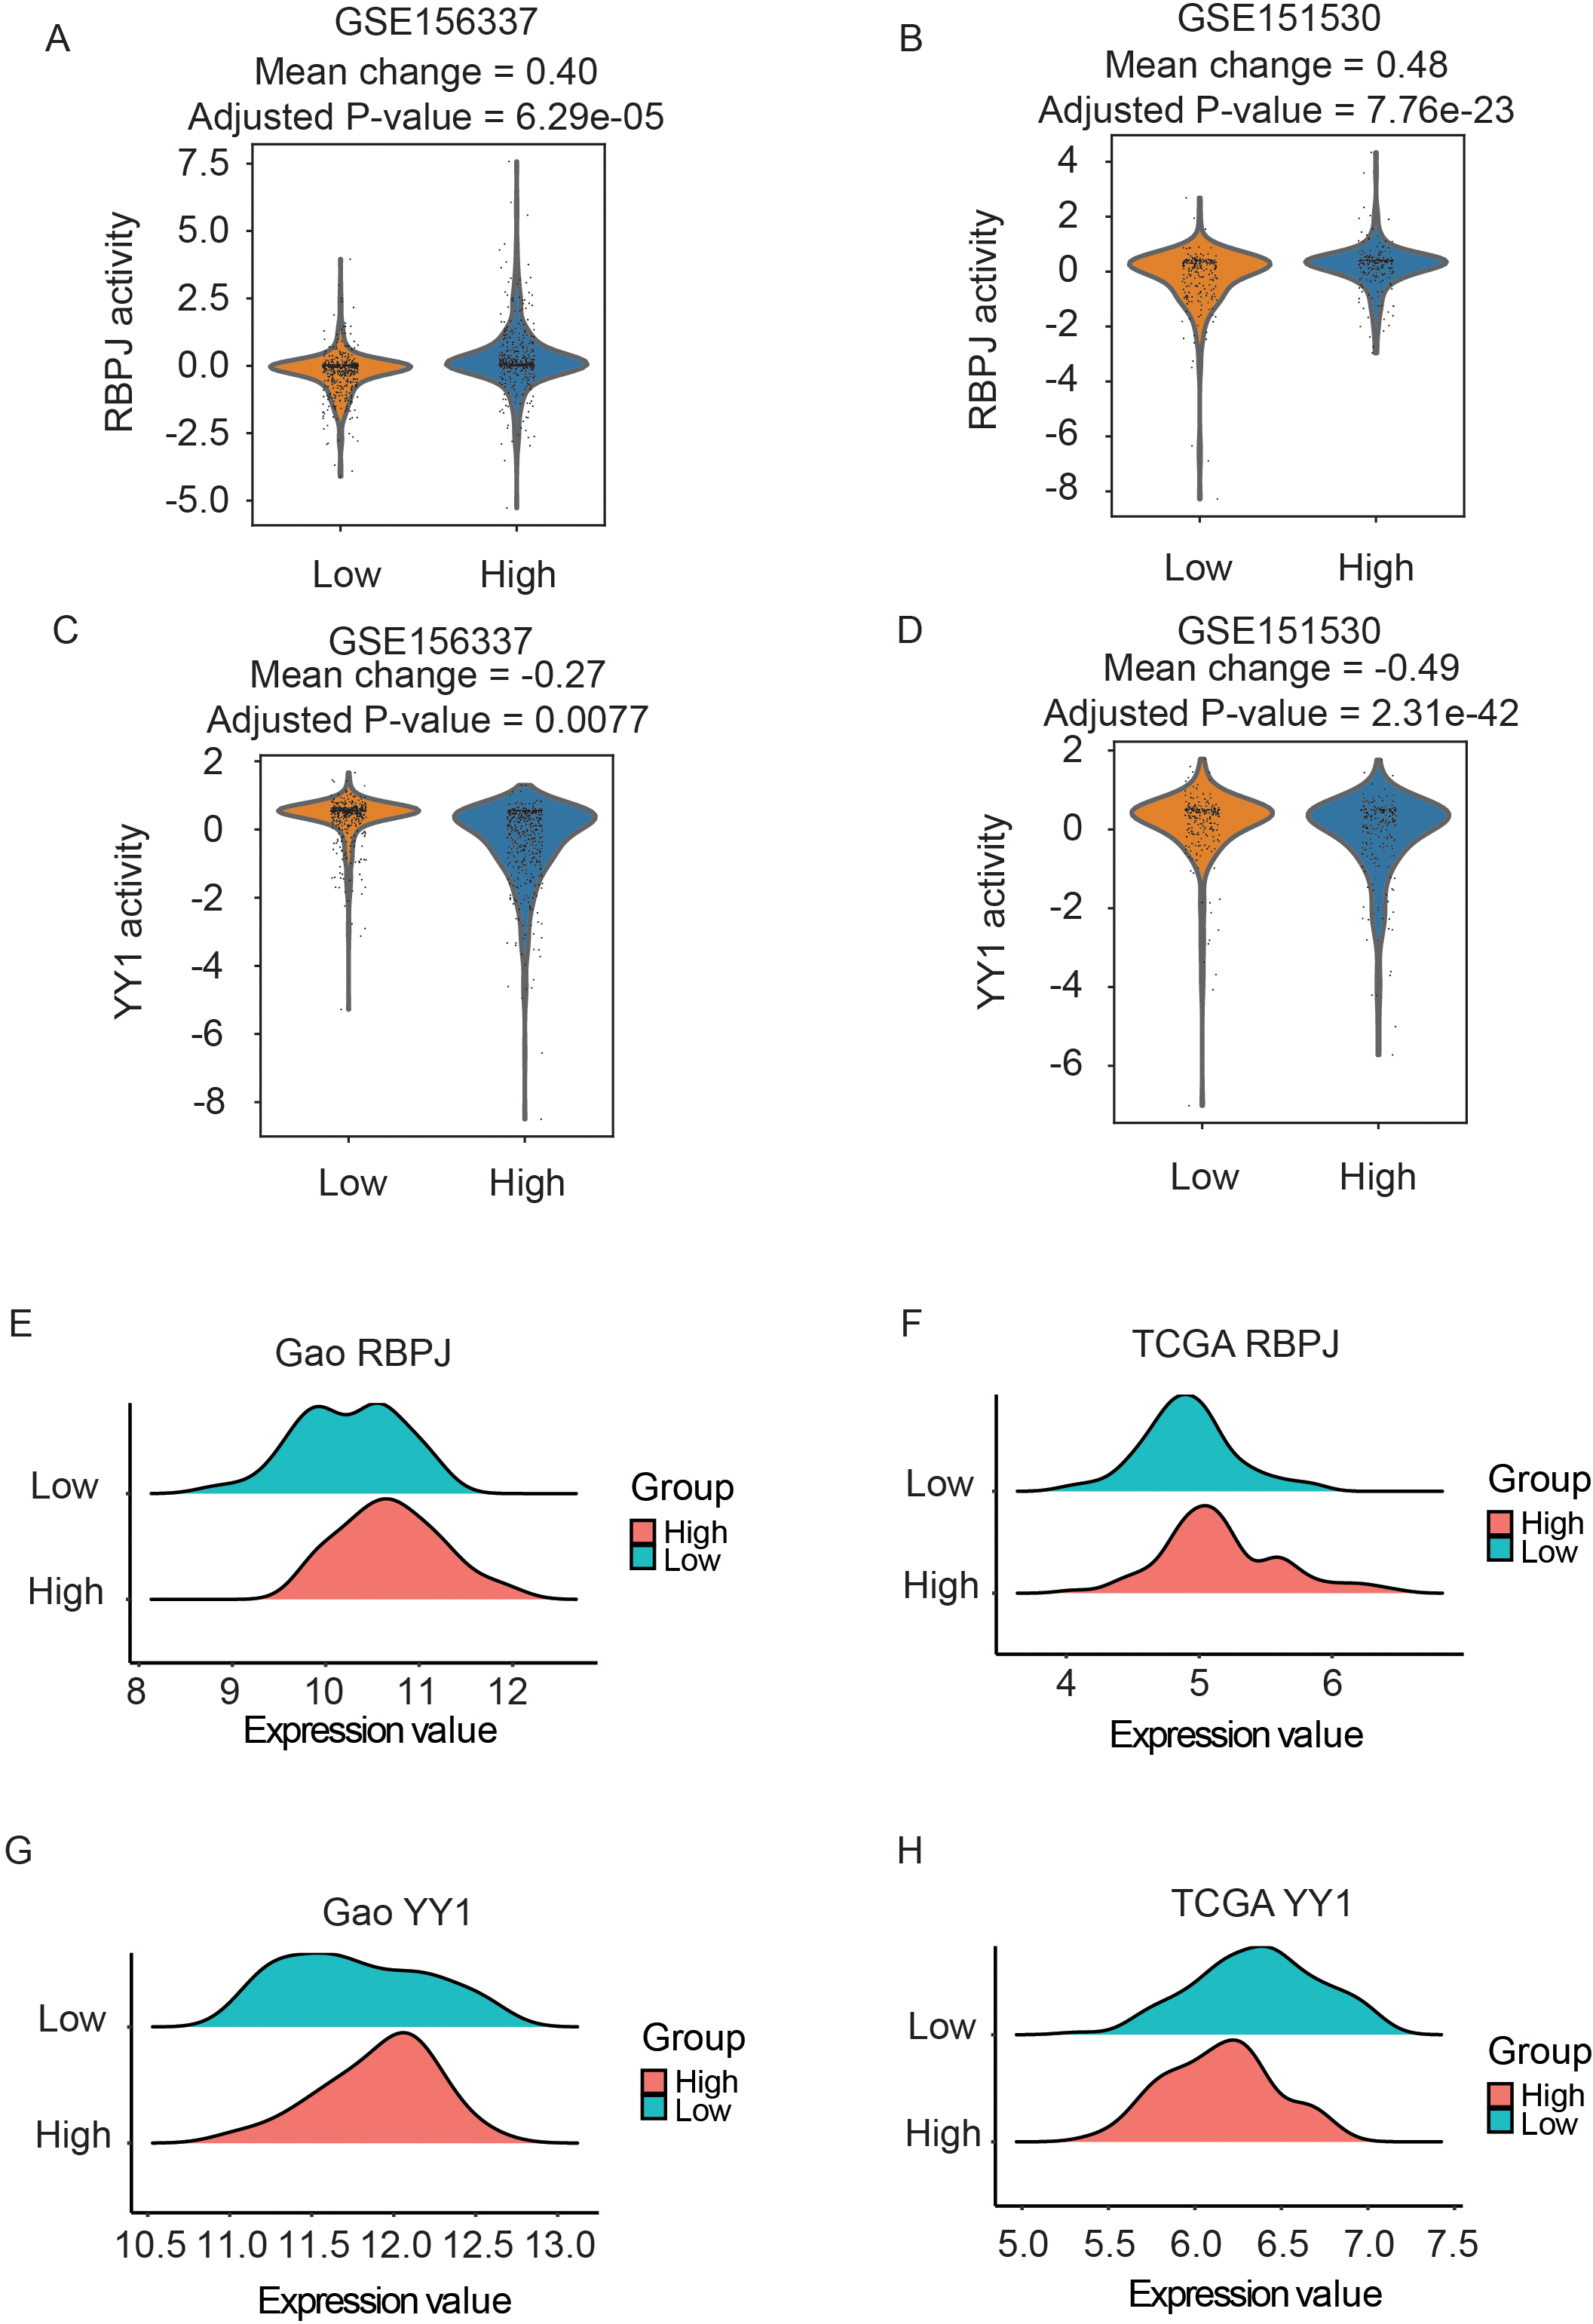
To validate the candidate TFs identified at single cell level, we directly compared the expression level of RBPJ and YY1 between low and high groups defined by RGS1 and its five related genes from bulk RNA-seq data with k-means clustering. We identified the significantly elevated RBPJ in HCC patients with high expression of RGS1 and its related genes in both cohorts (Fig. 5E and F;
Immunotherapy for HCC mainly including ICIs has revolutionized the treatment paradigm and improved overall survival of patients. However, one major challenge of immunotherapy is the low response rate, primarily caused by the accumulation of immunosuppressive subset of cells such as Tregs in tumor microenvironment [9, 35, 36]. These immune suppressive cells can hamper the antitumor response in TME and eventually lead to poor outcome of HCC patients. In this study, our comprehensive bioinformatic analyses suggested that high expression of RGS1 may determine the function of infiltrated Tregs in HCC through CXCR4 signaling and unveiled a new role of RGS1 in regulating Tregs in HCC.
Our study appears to expand the understanding the role of RGS1 in regulation of immune cells and provide a new way to improve the efficacy of targeting immunotherapy in cancers. In HCC, high expression of RGS1 was positively associated with bad outcomes, supported by previous studies in few cancers, such as gastric cancer [37] and multiple myeloma [38]. Moreover, emerging evidence suggested that RGS1 regulating inflammation and accumulation of immune cells was a potential target for immunotherapy [39]. Recent studies described a novel mechanism where the trafficking of antitumor T cells, such as CD8
Previous studies demonstrated that inhibition of CXCR4 affecting Treg function in multiple cancers, such as renal cancer and pancreatic cancer [42, 43]. More importantly, RGS1 is shown to bound to CXCR4 and determine homeostasis of CTLs and T follicular helper cells [44]. Consistently, our analysis suggested that RGS1 and CXCR4 may cooperate to affect the function of Tregs in HCC TME. Although we conducted a systematic bioinformatic analysis and revealed a potential role of RGS1 in regulating Tregs functions, it is should be mentioned that the detailed function of RGS1 in regulating Tregs and the mechanism behind it still need large experiment evidence to better guide clinical application of RGS1. In future, validation from functional experiments could help us to determine the role of CXCR4 signaling pathway in RGS1 regulating Treg function.
Metabolic reprogramming in Tregs is closely related to their suppressive function and targeting alternation of metabolic genes may provide a promising therapeutic strategy by Tregs for treatment of cancers. Interestingly, our study identifies that CARD16 and PMAIP1, two metabolism related genes, were significantly high expressed in Tregs with RGS1 high compared to RGS1 low in all HCC scRNA-seq and bulk RNA-seq data. CARD16 and PMAIP1 should be high confidently candidate genes for further experiment study to valid their clinical application. Due to these two metabolic genes related to Tregs function through metabolic changes, targeting them may largely improve efficiency of HCC treatment.
In addition, we identified potential upstream transcription factors of RGS1 in regulating Treg function in the TME of HCC. Based on RNA-seq data at single cell and bulk levels, two TFs (RBPJ and YY1) are inferred to be the candidate transcription factors upstream of RGS1 in regulating Treg function. Consistent with previously experimental studies [45, 46, 47], our study revealed RBPJ and YY1 both involved in the regulation of Tregs function, these two TFs are also candidate molecules to conduct validated study.
In conclusion, we characterized gene expression signature of CD4
Author contributions
Conception: CX Zhao.
Interpretation or analysis of data: LH Zou, KH Liu, YZ Shi, GW Li.
Preparation of the manuscript: KH Liu, LH Zou, CX Zhao.
Revision for important intellectual content: LH Zou, HY Li, CX Zhao.
Supervision: CX Zhao.
All authors contributed to the article and approved the submitted version.
Funding
This study was funded by the Key Project of Hunan Provincial Science and Technology Innovation (No. 2020SK1010).
Footnotes
Acknowledgments
We would like to thank the Dr. Linh T. Bui for critical reading of the manuscript and discussions about the project.
Conflict of interest
The authors declare that the research was conducted in the absence of any commercial or financial relationships that could be construed as a potential conflict of interest.