
Abstract
Introduction
Clear cell renal cell carcinoma (ccRCC) is the most prevalent histological subtype of renal carcinoma. To diagnose ccRCC and assess its prognosis more accurately, it is essential to screen novel prognostic biomarkers and construct prognostic signatures.
Methods
Immune infiltration analysis of the TCGA cohort was performed via single-sample gene set enrichment analysis (ssGSEA). The ccRCC cohort from the TCGA database was used to identify MDSC/Treg-related genes. Hub genes were selected from the common genes in the MDSC/Treg-related gene list via machine learning approaches. These hub genes were then employed to construct the risk signature through multivariate analysis.The prognostic performance, immune performance, and functional analysis of the signature were comprehensively assessed. Two independent GEO datasets were used to verify the major findings above. Potential drugs were screened to promote clinical transformation via the CellMiner platform. Finally, the expression levels of six markers were validated through RT–qPCR analysis of clinical tissue samples.
Results
Six MDSC/Treg-related DEGs were identified via machine learning approaches based on the Cancer Genome Atlas cohort. A novel signature (risk score = −0.5579*wdfy4-0.2198*il16 + 0.8014*fcgr1b + 0.3344*nod2 + 0.4111*relt + 0.1131*mki67) was subsequently constructed. More advanced clinical subgroups had higher scores. In addition, the signature was an independent prognostic indicator (HR = 2.0, 95% CI: 1.6-2.4, p value <0.0001), and the AUC values of the signature at 1, 2, and 3 years were 0.8, 0.74, and 0.76, respectively. The high-risk group presented greater MDSC/Treg infiltration and higher expression levels of PD1 (p < 0.0001)/PDL1 (p < 0.05) and HLA-related genes. Moreover, patients with a high risk score demonstrated a poorer response to anti-PD1/PDL1 therapy (NIVOLUMAB), along with worse progression-free survival (PFS, p = 0.0042). Moreover, two independent cohorts were used to validate the major conclusions. Twelve potential FDA-approved drugs were screened to promote clinical transformation. ill6 (p < 0.05), mki67 (p < 0.001), nod2 (p < 0.01), wdfy4 (p < 0.01), and relt (p < 0.01) were validated through RT–qPCR, with the exception of fcgr1b (p > 0.05).
Conclusion
A signature related to MDSC/Treg DEGs was constructed. This signature can differentiate between immune and clinical features, enabling the prediction of both clinical and immunotherapy prognoses. However, some PCR experiments did not fully validate the bioinformatics results.
Introduction
The latest statistics indicate that kidney cancer ranked as the 16th most common cancer and the 16th leading cause of cancer-related deaths worldwide in 2020. 1 Unfortunately, patients with advanced ccRCC lack effective treatment options, and the 5-year survival rate remains as low as 32%.2,3 Therefore, accurate diagnosis and prognosis assessment of ccRCC are crucial for improving patient outcomes. 4
“Immunotherapy for renal cell carcinoma (RCC) has been a recent research hotspot and has made significant progress. However, the effects of personalized treatment are influenced by various factors, posing challenges, such as the impact of ECOG on efficacy, 5 the perplexity of sex on the immune response, 6 and the optimization of first and second-line treatment options. 7 In recent years, advancements in molecular biology and genomics have led to the discovery of new prognostic markers, significantly improving the predictive accuracy of prognosis.8,9 Therefore, the use of these new molecular markers to construct prognostic signatures may be an effective approach for guiding the selection of immunotherapy strategies and assessing the prognosis of patients with ccRCC. Myeloid-derived suppressor cells (MDSCs) and regulatory T cells (Tregs) are key immune cell types within the tumor microenvironment (TME). MDSCs are a functional myeloid cell subset with immunosuppressive properties. 10 Tregs are crucial for preventing autoimmunity and can suppress tumor immunity. 11 In addition to their established immunosuppressive roles, MDSCs and Tregs have been increasingly recognized as mediators of resistance to checkpoint inhibitor therapies.12–14 Contemporary research has shown that quantitative assessment of MDSC and Treg infiltration coupled with functional characterization of suppressive activity could provide clinically relevant predictive value for the therapeutic response of ccRCC patients.12–14 Thus, their interactions with malignant cells promote a series of biological processes, including tumor proliferation, metastasis, angiogenesis, and immunotherapy resistance. 15 Therefore, MDSC/Treg-related genes may regulate cancer progression by affecting the immune infiltration of MDSCs and Tregs in the TME.
Since MDSCs and Tregs are crucial immunosuppressive cells in ccRCC, screening for their specifically associated immune-related genes may be more efficient than genome-wide screening. In this study, we utilized machine learning approaches to screen differentially expressed genes (DEGs) related to MDSCs/Tregs and constructed a signature that showed significant clinical and immune value.
Materials and Methods
The reporting of this study conforms to TRIPOD guidelines.
Patient Data Collection and Processing
The training cohort of the present study, which included 539 patients with ccRCC and 72 control individuals, was sourced from the TCGA database (https://portal.gdc.cancer.gov/). Two validation GEO datasets (GSE40435, including 101 patients and 101 control individuals, and GSE53757, including 72 patients and 72 control individuals) meeting the following criteria were obtained from the GEO database (https://www.ncbi.nlm.nih.gov/geo/): 1) tumor samples and control samples and 2) more than 100 samples. In addition, all datasets mentioned should include complete transcriptional profiles and clinical information. Only 516 ccRCC samples from the TCGA cohort were included for further analysis, as detailed in Table 1. In addition, an NIVOLUMAB (anti-PD1 agent) cohort including RNA profiles and comprehensive prognostic information was obtained from a clinical study 16 (https://www.nature.com/articles/s41591-020-0839-y#Sec26). This cohort was utilized to evaluate the response to immunotherapy.
Summary of the Datasets Used in This Study.

Immune Infiltration Analysis of the TCGA Cohort and Identification of MDSC/Treg-Related Genes
The single-sample gene set enrichment analysis (ssGSEA) method is a novel bioinformatics algorithm, and its basic computational approach is similar to that of GSEA. 17 It is utilized to assess the infiltration of immune cell subtypes via RNA samples from individual subjects. 17 Compared with other methods, this approach results in less noise and unknown mixture content, and is more closely associated with specific cell types. 18 Immune infiltration analysis of the TCGA cohort was conducted via the single-sample gene set enrichment analysis (ssGSEA) method implemented through the “GSVA” R package. 19 The gene sets of 28 immune cells were obtained from TISIDB 20 (http://cis.hku.hk/TISIDB/data/download/CellReports.txt, Table S1). A p value <0.001 was considered differential infiltration. The results were viualized via the “ggplot2” R package. 21
K-M analysis, which describes the survival distribution between the high infiltration and low infiltration groups of MDSC/Treg immune cells, was conducted via the TIMER database 22 (RRID:SCR_018737). After clarifying that the relative abundances of MDSCs and Tregs differ between ccRCC and normal tissues and that their differential infiltration can affect the survival status of patients with ccRCC, further analysis was performed. MDSC/Treg-related genes were screened through correlation analysis performed via the “psych” R package via the “Spearman” method. Genes with a |correlation coefficient| > 0.5 and p < 0.0001 were considered MDSC/Treg-related genes.
Identification of Differentially Expressed Genes (DEGs)
DEGs between ccRCC and normal tissues were identified via the “limma” R package, with cutoff values of adjusted p-values <0.0001 and |log2-fold change (FC)| ≥ 2. The results were visualized via the “ggplot2” R package. 21
Hub Gene Identification via Machine Learning Approaches
The genes common to the MDSC/Treg-related gene list and the DEG list were identified as candidate hub genes. These hub genes were selected from the aforementioned gene lists via machine learning approaches, specifically LASSO Cox regreession 23 and random forest regression was performed via the “glmnet” R package 24 with 10-fold cross-validation, whereas random forest was executed via the “randomForestSRC” R package (ntree = 1000, nsplit = 1, mtry = NULL, tree.err = T). The intersection of LASSO and random forest analyses was performed, followed by univariate and multivariate Cox regression via the “forestplot” R package. Ultimately, only genes demonstrating independent prognostic ability in the multivariate Cox regression were designated hub genes.
Construction of the Risk Signature
Hub genes were utilized to construct the risk signature through multivariate analysis. The risk score was calculated via the following formula: risk score = ∑(gene expression × multivariate Cox coefficient). Additionally, the expression levels of the hub genes in ccRCC and normal tissues were calculated and visualized via the “ggplot2” R package. K–M curves for the hub genes were generated via the “survminer” and “survival” R packages.
The Clinical Performance of the Risk Signature
Univariate and multivariate Cox regression analyses were used to evaluate the prognostic performance of the signature alongside clinical traits, including T stage, M stage, lymph node status, and grade. The “pROC” and “timeROC” R packages were employed to perform receiver operating characteristic (ROC) analysis and calculate the area under the ROC curve (AUC) value. The samples were divided into high-risk and low-risk groups based on the median risk score. K–M curves for the high- and low-risk groups in each clinical subgroup were generated via the “survival” and “survminer” R packages. Additionally, the risk scores for each clinical subgroup were calculated and visually presented.
Functional Analysis of the Signature
The “limma” R package 25 was used to perform DEG analysis between the high-risk and low-risk groups.Genes with an adjusted p value < 0.0001 and |logFC| > 1 were identified as differentially expressed genes. Protein–protein interaction (PPI) analysis was conducted via the GeneMANIA 26 (RRID:SCR_005709) database. KEGG and GO enrichment analyses were performed via the “clusterProfiler” 27 R package, pathway annotations were obtained via the “org.Hs.egdb” R package, and the results were visualized via the “ggplot2” R package. Pathways with a p value < 0.01 and a q-value < 0.05 were considered to be differentially enriched.
Immune Landscape and Immunotherapy Efficacy in the High-Risk and low-Risk Groups
The immune landscape of the high-risk and low-risk groups was determined via the “GSVA” 19R package. The results were visualized through heatmaps and violin plots. Correlation analysis of immune cells was conducted via the “corrplot” R package. The expression of immune checkpoints and HLA-related genes in both groups was visualized via the “ggplot2” R package. K–M survival analysis for the high-risk and low-risk groups of NIVOLUMAB cohort was performed via the “survminer” and “survival” R packages.
Validation of the Clinical and Immunotherapy Performance
Two GEO datasets were used to validate the clinical and immunotherapy predictive performance of the signature. The validation included six aspects: 1) risk score comparison between the ccRCC group and the normal group; 2) risk score comparison between stages I-II and III-IV; 3) stromal score, immune score, and ESTIMATE score comparisons between the high-risk and low-risk groups; 4) immune infiltration comparisons between the high-risk and low-risk groups; 5) expression of immune checkpoints in the high-risk group versus the low-risk group; and 6) expression of HLA-related genes in the high-risk versus low-risk groups was analyzed via the same methods described previously.
Drug Response Analysis of the six hub Genes
CellMiner (NCI-60) data, which include a comprehensive description of cancer cell lines and the efficacy of FDA-approved drugs, were downloaded from the CellMiner platform (https://discover.nci.nih.gov/cellminer/loadDownload.do). The correlations between the six hub genes and drug response were calculated via the “Pearson” method. Two drugs with the lowest p values were emphasized in our study.
Samples for Experimental Validation
A total of 11 pairs of ccRCC and adjacent tissues (2023.10-2024.05, radical nephrectomy for RCC.) from Lishui City People's Hospital were consecutively selected for experimental validation of the six markers.
RT-qPCR
Twenty milligrams of tissue was collected, and total RNA was extracted from the tissue via an RNA extraction kit (China). The A260/A280 ratio was ensured to be approximately 2.0. RT–qPCR was performed via the qRT–PCR kit(Shanghai, China). The primers used were as follows: wdfy4: forward: GAGCCCCATTGAGCGTCAG; reverse: GCTGGTCAGACACGTCTTCA;
il16: forward: GCCGAAGACCCTTGGGTTAG; reverse: GCTGGCATTGGGCTGTAGA;
fcgr1b: forward: TGGGTCAGCGTGTTCCAAG; reverse: CACCTGTATTCACCACTGTCATT;
nod2: forward: TGGTTCAGCCTCTCACGATGA; reverse: CAGGACACTCTCGAAGCCTT;
relt: forward: GTTCCATGTCAACCATGTTCCT; reverse: AGGCAGAAGACAGGGACGAT;
mki67: forward: ACGCCTGGTTACTATCAAAAGG ; reverse: CAGACCCATTTACTTGTGTTGGA;
actin: forward: CATGTACGTTGCTATCCAGGC; reverse: CTCCTTAATGTCACGCACGAT. The expression levels of the markers were calculated via the 2−ΔCt method.
Statistical Analysis
All bioinformatic analyses were conducted via R software. Immune infiltration analysis was performed via the “GSVA” R package via the ssGSEA method. DEG analysis was carried out via the “limma” package. Multivariate Cox regression analysis was conducted with the “forestplot” R package. ROC analysis was performed via the “pROC” and “timeROC” R packages to evaluate predictive accuracy. KEGG and GO enrichment analyses were executed via the “clusterProfiler” package. The correlations between the six hub genes and drug response were computed via Pearson`s correlation coefficient. Additionally, a t test was applied to assess differences in RNA expression levels.
Results
The workflow of this study is shown in Figure 1.
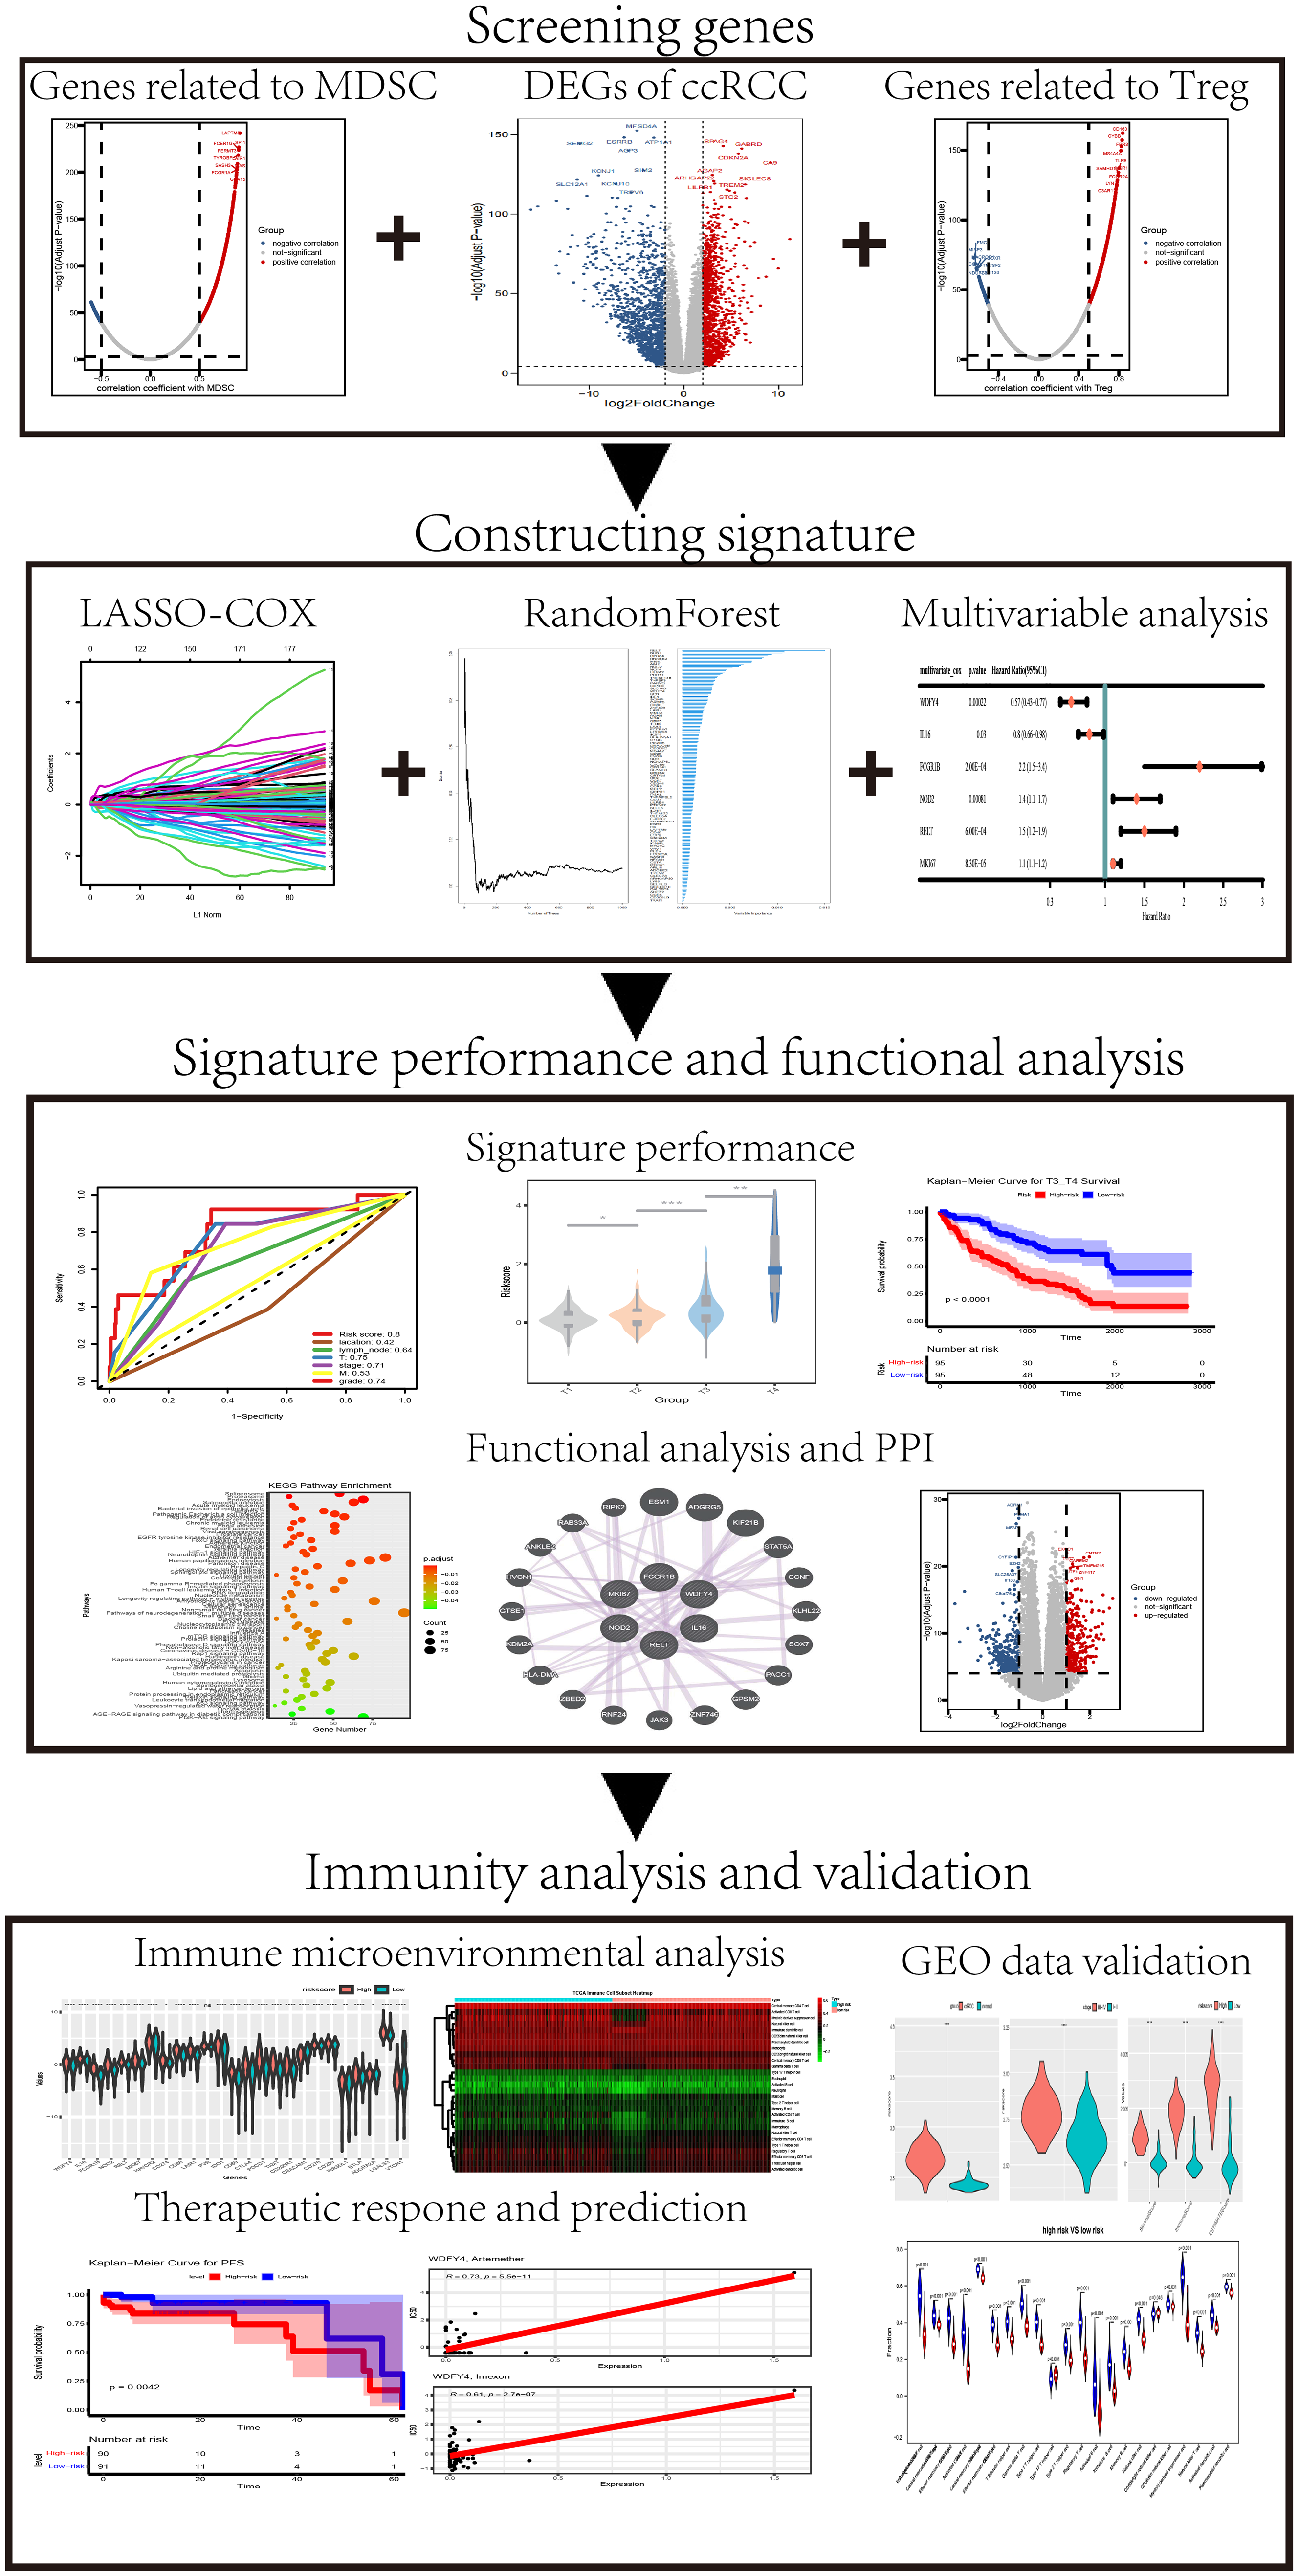
Schematic Diagram of the Present Study.
Immune Infiltration Analysis of the TCGA Cohort
To establish a prognostic signature based on MDSC- and Treg-related genes, we initially performed immune infiltration analysis in the TCGA cohort. The results revealed that the abundances of 23 types of immune cells were increased, and that the abundances of 2 types of immune cells were reduced in the ccRCC group (Figure 2A-B). The abundance of MDSCs was significantly greater in the ccRCC group (Figure 2B). Additionally, high infiltration of MDSC/Treg immune cells was associated with poor overall survival (OS) (Figure 2C-D).

Identification of MDSC/Treg-Specific DEGs. (A) Heatmap of Immune Infiltration in ccRCC and Normal Tissues. (B) Volcano Plot Showing the Infiltration Changes in 28 Immune Cells. Red: Increased Infiltration; Blue: Decreased Infiltration. Gray: No Significant Change. (C-D) K–M Curve Analysis Revealed that High MDSC and Treg Infiltration was Associated with a Shorter OS. (E-F) The Scatter Diagram Shows the Gene Correlation with Different MDSC (C)/Treg (D) Infiltration Levels. Red: Positive Correlation. Blue: a Negative Correlation. Gray: No Significant Correlation. The Cutoff Value was Set at a Correlation Coefficient = +/-0.5. p value = 0.0001. (G) Volcano Plot Displaying the DEGs Between ccRCC and Normal Tissues. Red: Upregulated Expression; Blue: Downregulated Expression. Gray: No Significant Change. The Cutoff Value was Set at Log FC = +/-2. p value = 0.0001. (H) Venn Diagram Showing the Common to MDSC-Specific Genes, Treg-Specific Genes and DEGs in ccRCC.
Identification of Candidate hub Genes
A total of 751 genes were identified as MDSC-related genes, and 1017 genes were classified as Treg-related genes through correlation analysis (Figure 2E-F). Additionally, 2831 differentially expressed genes (DEGs) between ccRCC and normal tissues were screened (Figure 2G). A total of 185 common genes in the MDSC/Treg-related gene list and the DEG list were identified as candidate hub genes (Figure 2H, Table S2 gene list 1).
Identification of hub Genes and Construction of the Signature
Thirteen genes (Table S2, gene list 2) and 60 genes (Table S2, gene list 3) were screened from among the candidate hub genes through LASSO Cox regression and random forest analysis. The results of tenfold cross-validation for tuning parameter selection and coefficient profiles in the LASSO model are presented in Figure 3A-B. The random forest results of the relative importance of candidate genes are displayed in Figure 3C-D. Twelve genes that overlapped between gene list 2 and gene list 3 were further analyzed via multivariate Cox regression. The multivariate Cox regression models revealed that six genes were independent predictors (wdfy4: HR = 0.68, 95% CI = 0.46-0.98, p = 0.048; il16, HR = 0.77, 95% CI = 0.62-0.96, p = 0.02; fcgr1b, HR = 2, 95% CI = 1.2-3.3, p = 0.011; nod2, HR = 1.3, 95% CI =1.1-1.6, p = 0.0083; relt, HR = 1.5, 95% CI = 1.2-2, p = 0.00068; mki67, HR = 1.2, 95% CI = 1.07-1.3, p = 0.047; Figure 3E). The six genes above were subjected to multivariate Cox analysis a second time to obtain coefficients (Figure 3F). The risk score is = −0.5579*wdfy4-0.2198*il16 + 0.8014*fcgr1b + 0.3344*nod2 + 0.4111*relt + 0.1131*mki67.

Screening hub Genes via Machine Learning Combined with Multivariate Regression Analysis. (A-B) Tenfold Cross-Validation for Parameter Selection and LASSO Coefficient Profiles in the LASSO Analysis. (C) Random Forest Results of the Relative Importance of the Candidate Genes. the Blue Bars on the Right Display the Variable Importance of the Genes. (E-F) Multivariate Cox Analysis of the Twelve Genes Common to the LASSO and Random Forest Results (E). Multivariate Cox Analysis of the Six Selected Genes from the First Multivariate Cox Analysis (F).
Characteristics of the six hub Genes
K–M analysis revealed that low expression of fcgr1b, nod2, relt, and mki67 was correlated with prolonged OS, but the expression of wdfy4 and il16 was not significantly correlated with prolonged OS (Figure 4A–F). The six hub genes presented higher expression levels in the ccRCC group than in the control group (Figure 4G). The characteristics of the six hub genes, including “gene symbol”, “description”, “gene category”, “location”, and “summary of function”, are listed in Table S3.
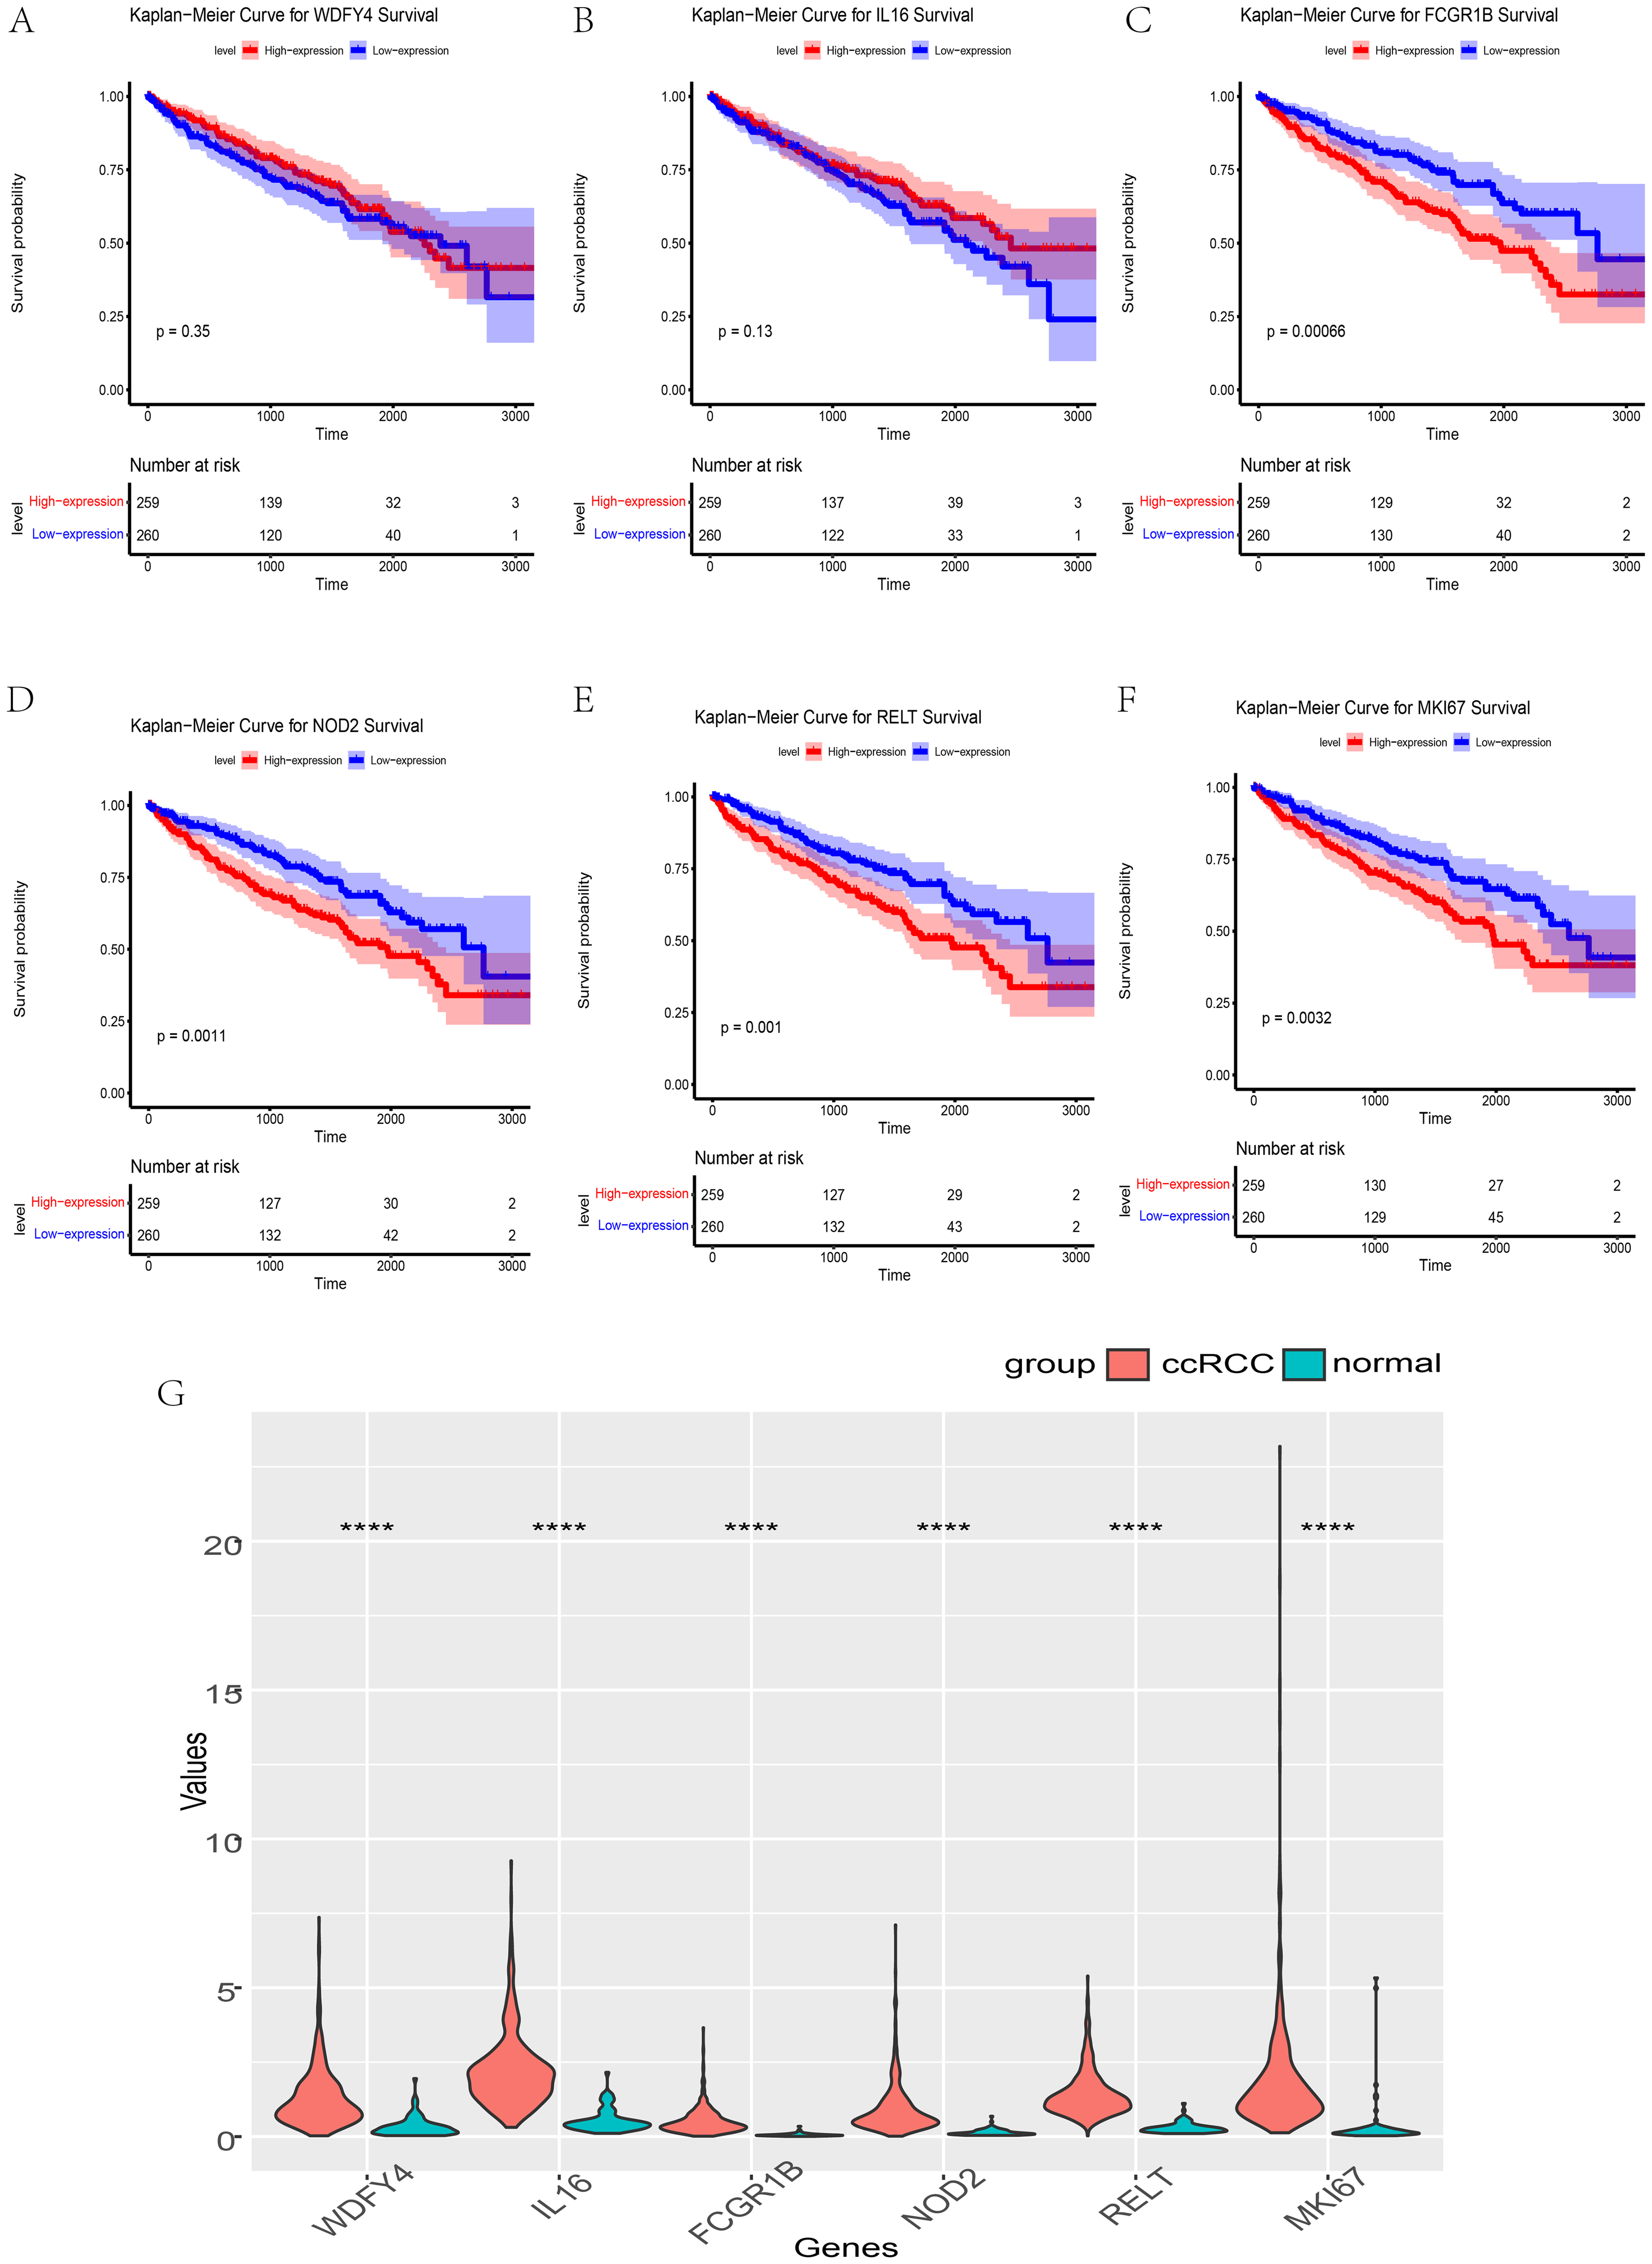
Expression and OS Analysis of the Six Hub Genes. (A–B) wdfy4 and il6 had No Independent Prognostic Significance. (C–F) Patients with Higher Expression of fcgr1b, nod2, relt, and mki67 had a Better OS Prognosis. (G) wdfy4, il6, fcgr1b, nod2, relt, and mki67 were Highly Expressed in the ccRCC Group. ****p < 0.0001.
Clinical Value of the Signature
First, we calculated the risk score in the clinical subgroups. The results indicated that different clinical subgroups presented distinct risk scores. These differences were significant, except for those in stages I/II and G1/G2 (Figure 5). Although the p values of stages I/II and G1/G2 were greater than 0.05, the risk scores of the stage II and G2 subgroups were higher than those of the stage I and G1 subgroups, respectively. In addition, K–M analysis revealed that the high-risk group was associated with worse overall survival (OS) in each subgroup (Figure 6).

The Risk Score in Different Subclinical Groups. (A–D) A Higher Risk Score was Observed in Higher Clinical Subgroups. There Were Significant Differences for all Stage Except I Versus Stage II and G1 Versus G2. *p < 0.05. **p < 0.01. ***p < 0.001. NS p > 0.05.
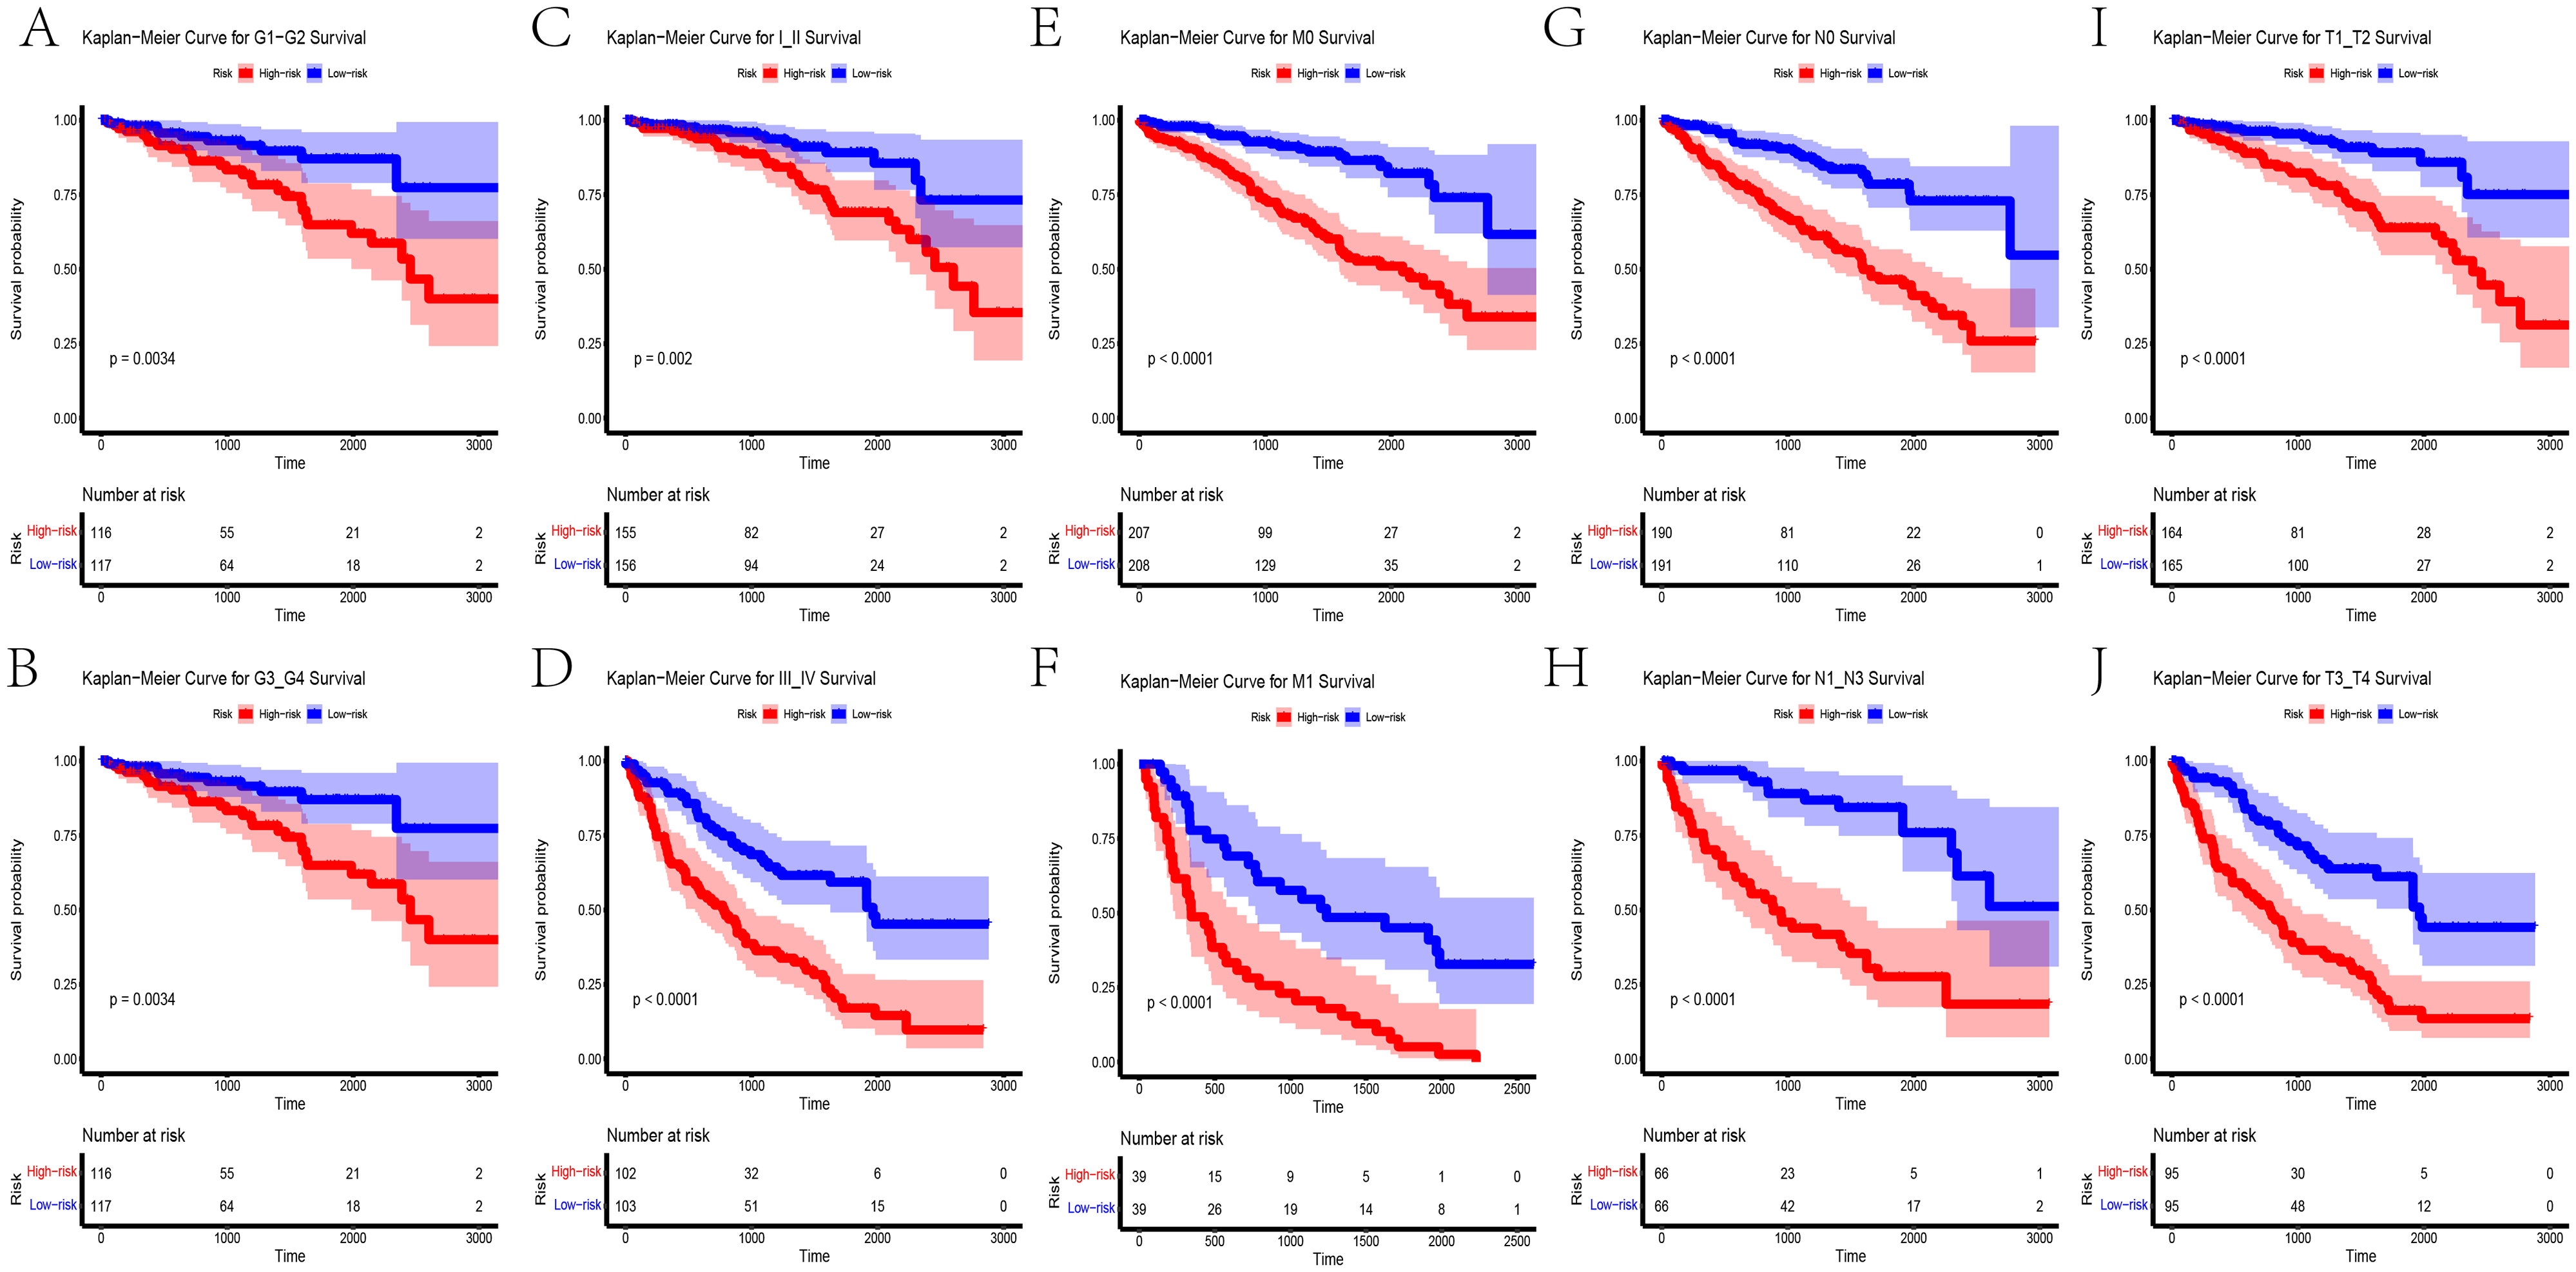
Prognostic Performance of the Signature in Different Subclinical Groups. The K–M Curves Revealed a Higher Risk Score, Indicating Poorer OS in all the Subclinical Groups.
Additionally, univariate and multivariate Cox regression analyses were performed to assess the relationships between the signature and clinical traits. In the univariate analysis, T stage (HR = 2.1, 95% CI: 1.7-2.5, p value <0.0001), M stage (HR = 4.4, 95% CI: 3.2-6, p value <0.0001), stage (HR = 1.9, 95% CI: 1.7-2.2, p value <0.0001), grade (HR = 2.4, 95% CI: 2-3, p value <0.0001), and risk score (HR = 2.7, 95% CI: 2.3-3.2, p value <0.0001) had significant prognostic value (Figure 7A). In the multivariate analysis, stage (HR = 1.7, 95% CI: 1-2.6, p value = 0.012) and the risk score (HR = 2.0, 95% CI: 1.6-2.4, p value <0.0001) had independent prognostic power (Figure 7B). Time-ROC analysis revealed that the AUC values of the signature at 1, 2, and 3 years were 0.8, 0.74, and 0.76, respectively (Figure 7C). ROC analysis revealed that the signature had a greater AUC value (0.8) than the other six clinical traits did (location: 0.42, lymph node: 0.64, T: 0.75, stage: 0.71, M: 0.53, grade: 0.74) (Figure 7D).
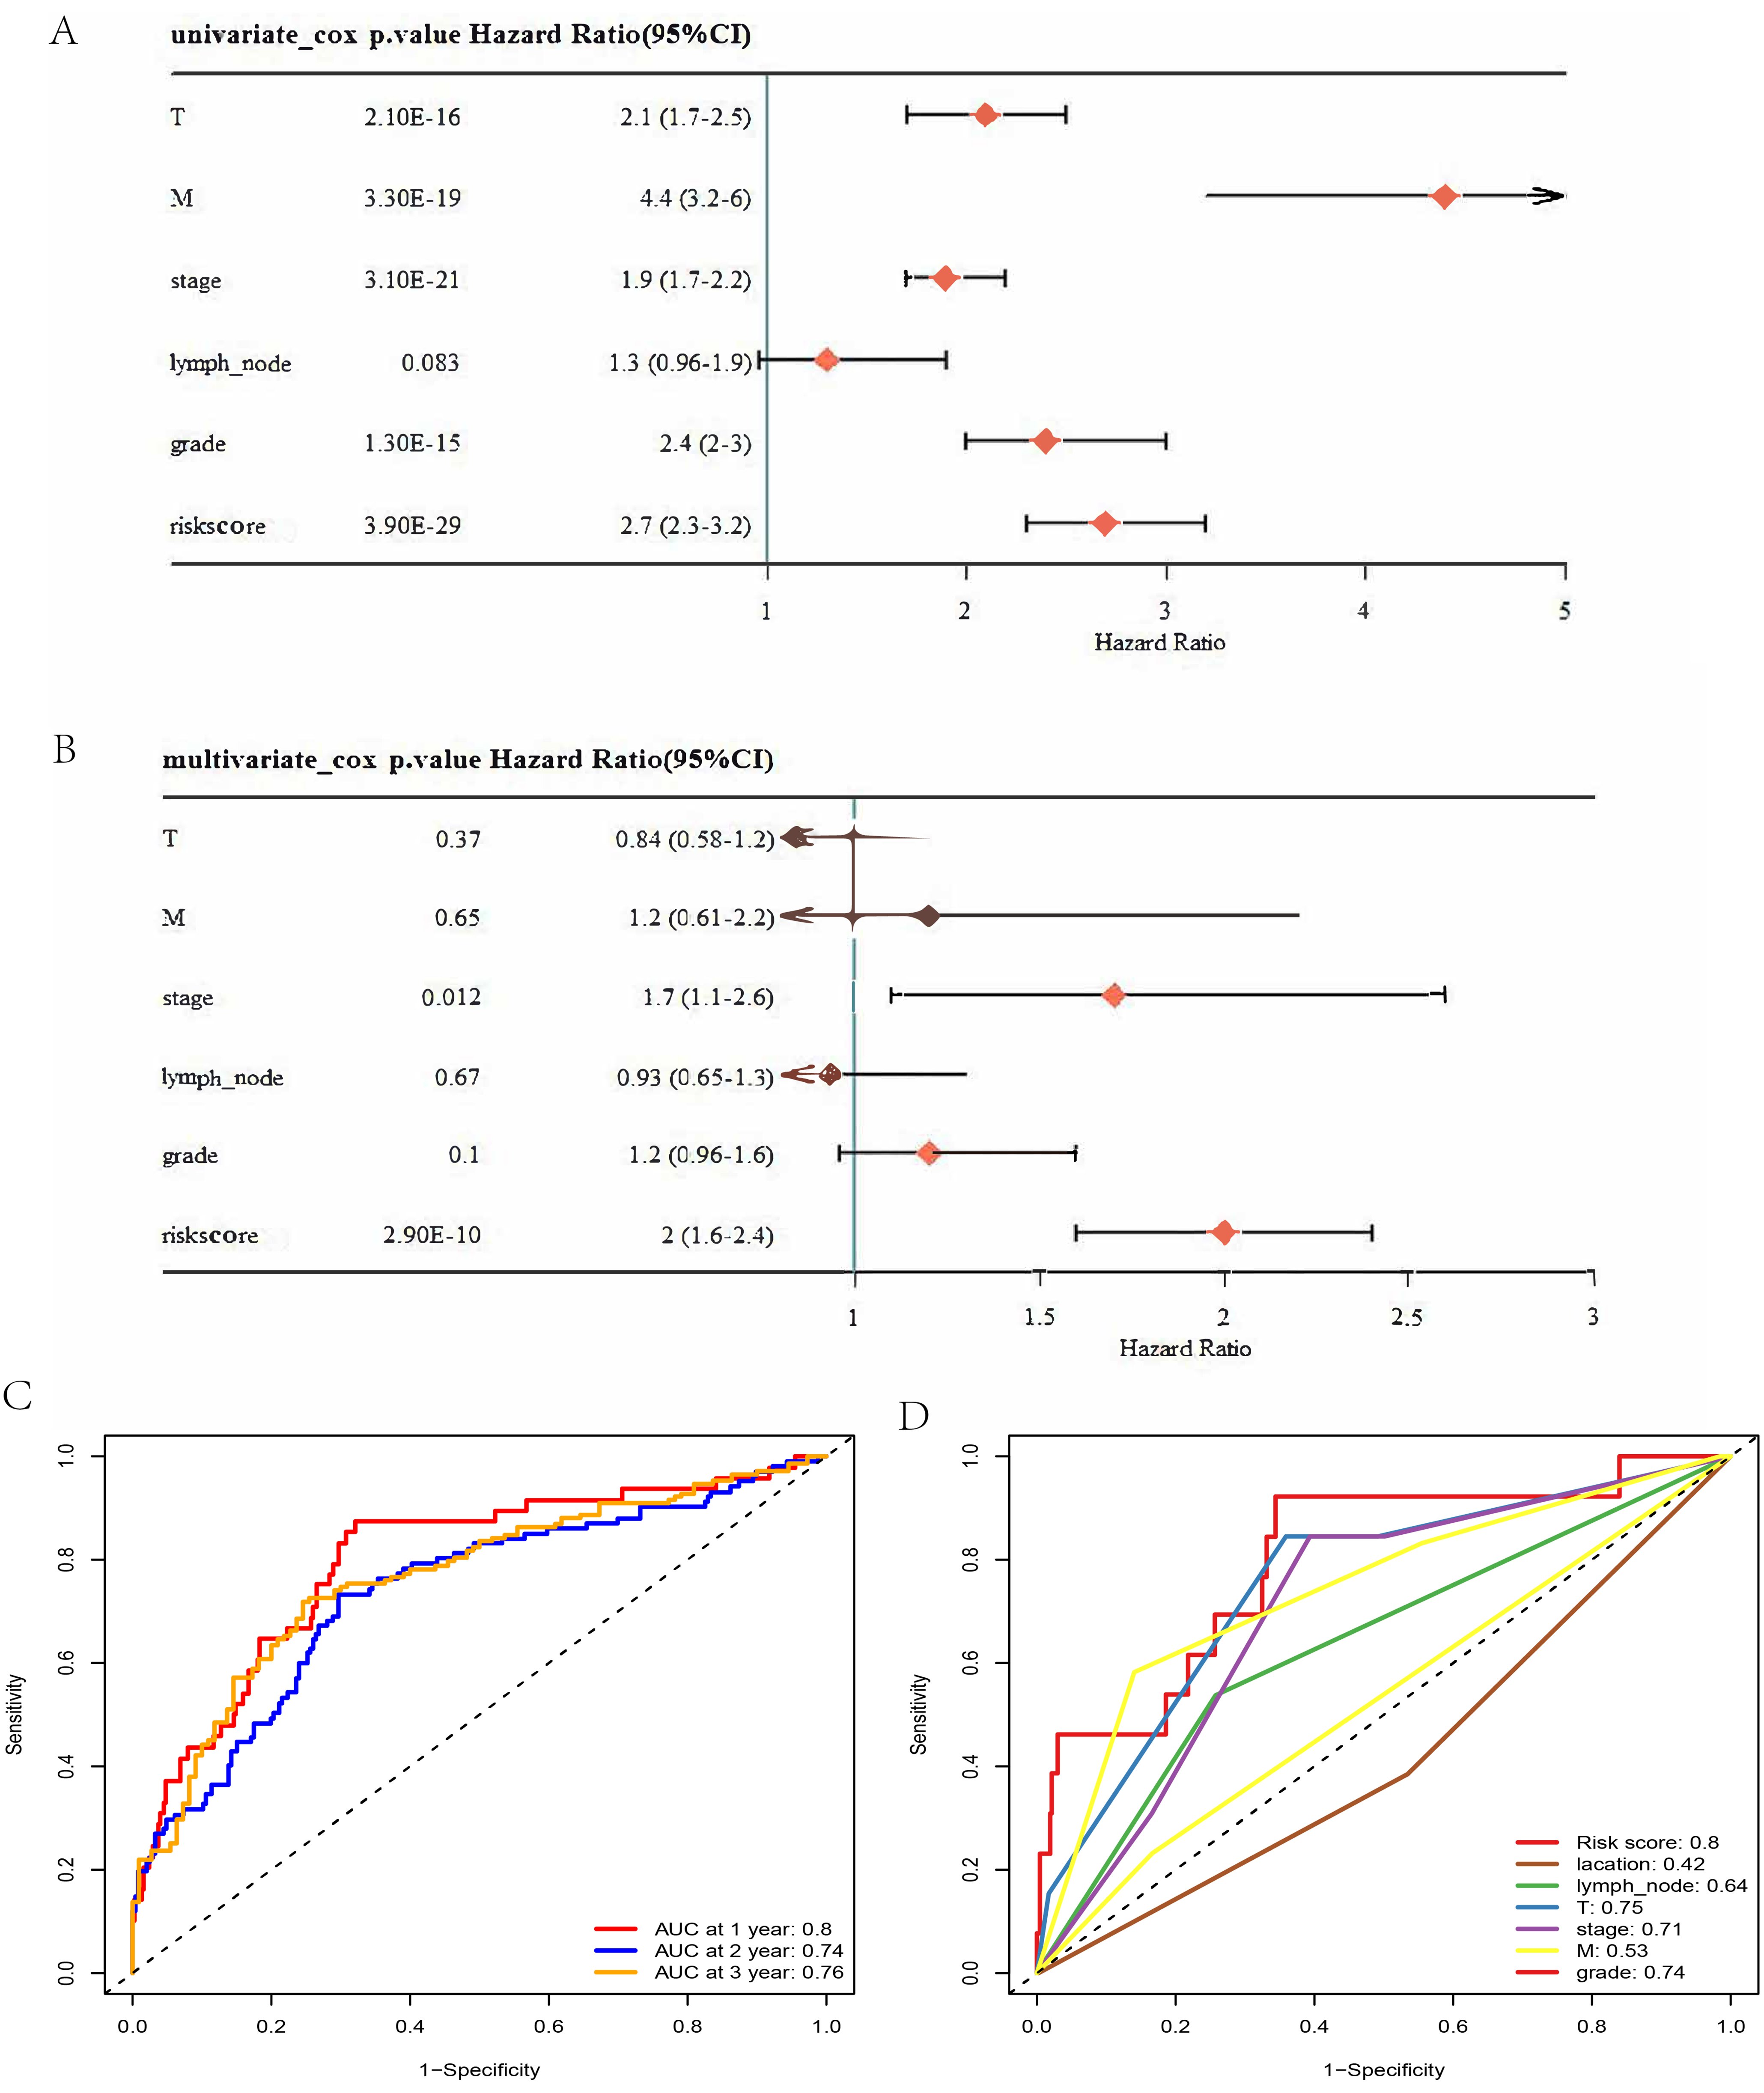
(A) Univariate Cox Analysis Revealed That T and M Stage, Grade, and Risk Score had Robust Prognostic Ability. (B) Cox Multivariate Analysis Revealed That Stage and Risk Score had Robust Prognostic Ability. (C) Time–ROC Analysis Revealed That the AUC Values at 1, 2, and 3 Years Were 0.8, 0.74, and 0.76, Respectively. (D) the ROC Analysis Revealed That the AUC Values of the Risk Score, Location, Lymph Node Status, T Stage, M Stage, and Grade Were 0.8, 0.42, 0.64, 0.75, 0.71, 0.83, and 0.74, Respectively.
Pathway Enrichment Analysis and PPIs
A volcano plot revealed 309 upregulated genes and 335 downregulated genes between the high-risk and low-risk groups (Figure 8A). Moreover, we screened 20 potential interacting proteins (Figure 8B). KEGG enrichment analysis revealed that the DEGs were enriched primarily in the “spliceosome,” “proteasome,” “endocytosis,” “Salmonella infection,” “acute myeloid leukemia,” and “bacterial invasion of epithelial cells” pathways. “Renal cell carcinoma” was also a major enrichment pathway (Figure 8C). GO enrichment analysis revealed that the DEGs were enriched mainly in “R splicing”, “R splicing, via transesterification reactions”, “R splicing, via transesterification reactions with bulged”, and “mR splicing, via spliceosome” (Figure 8D).
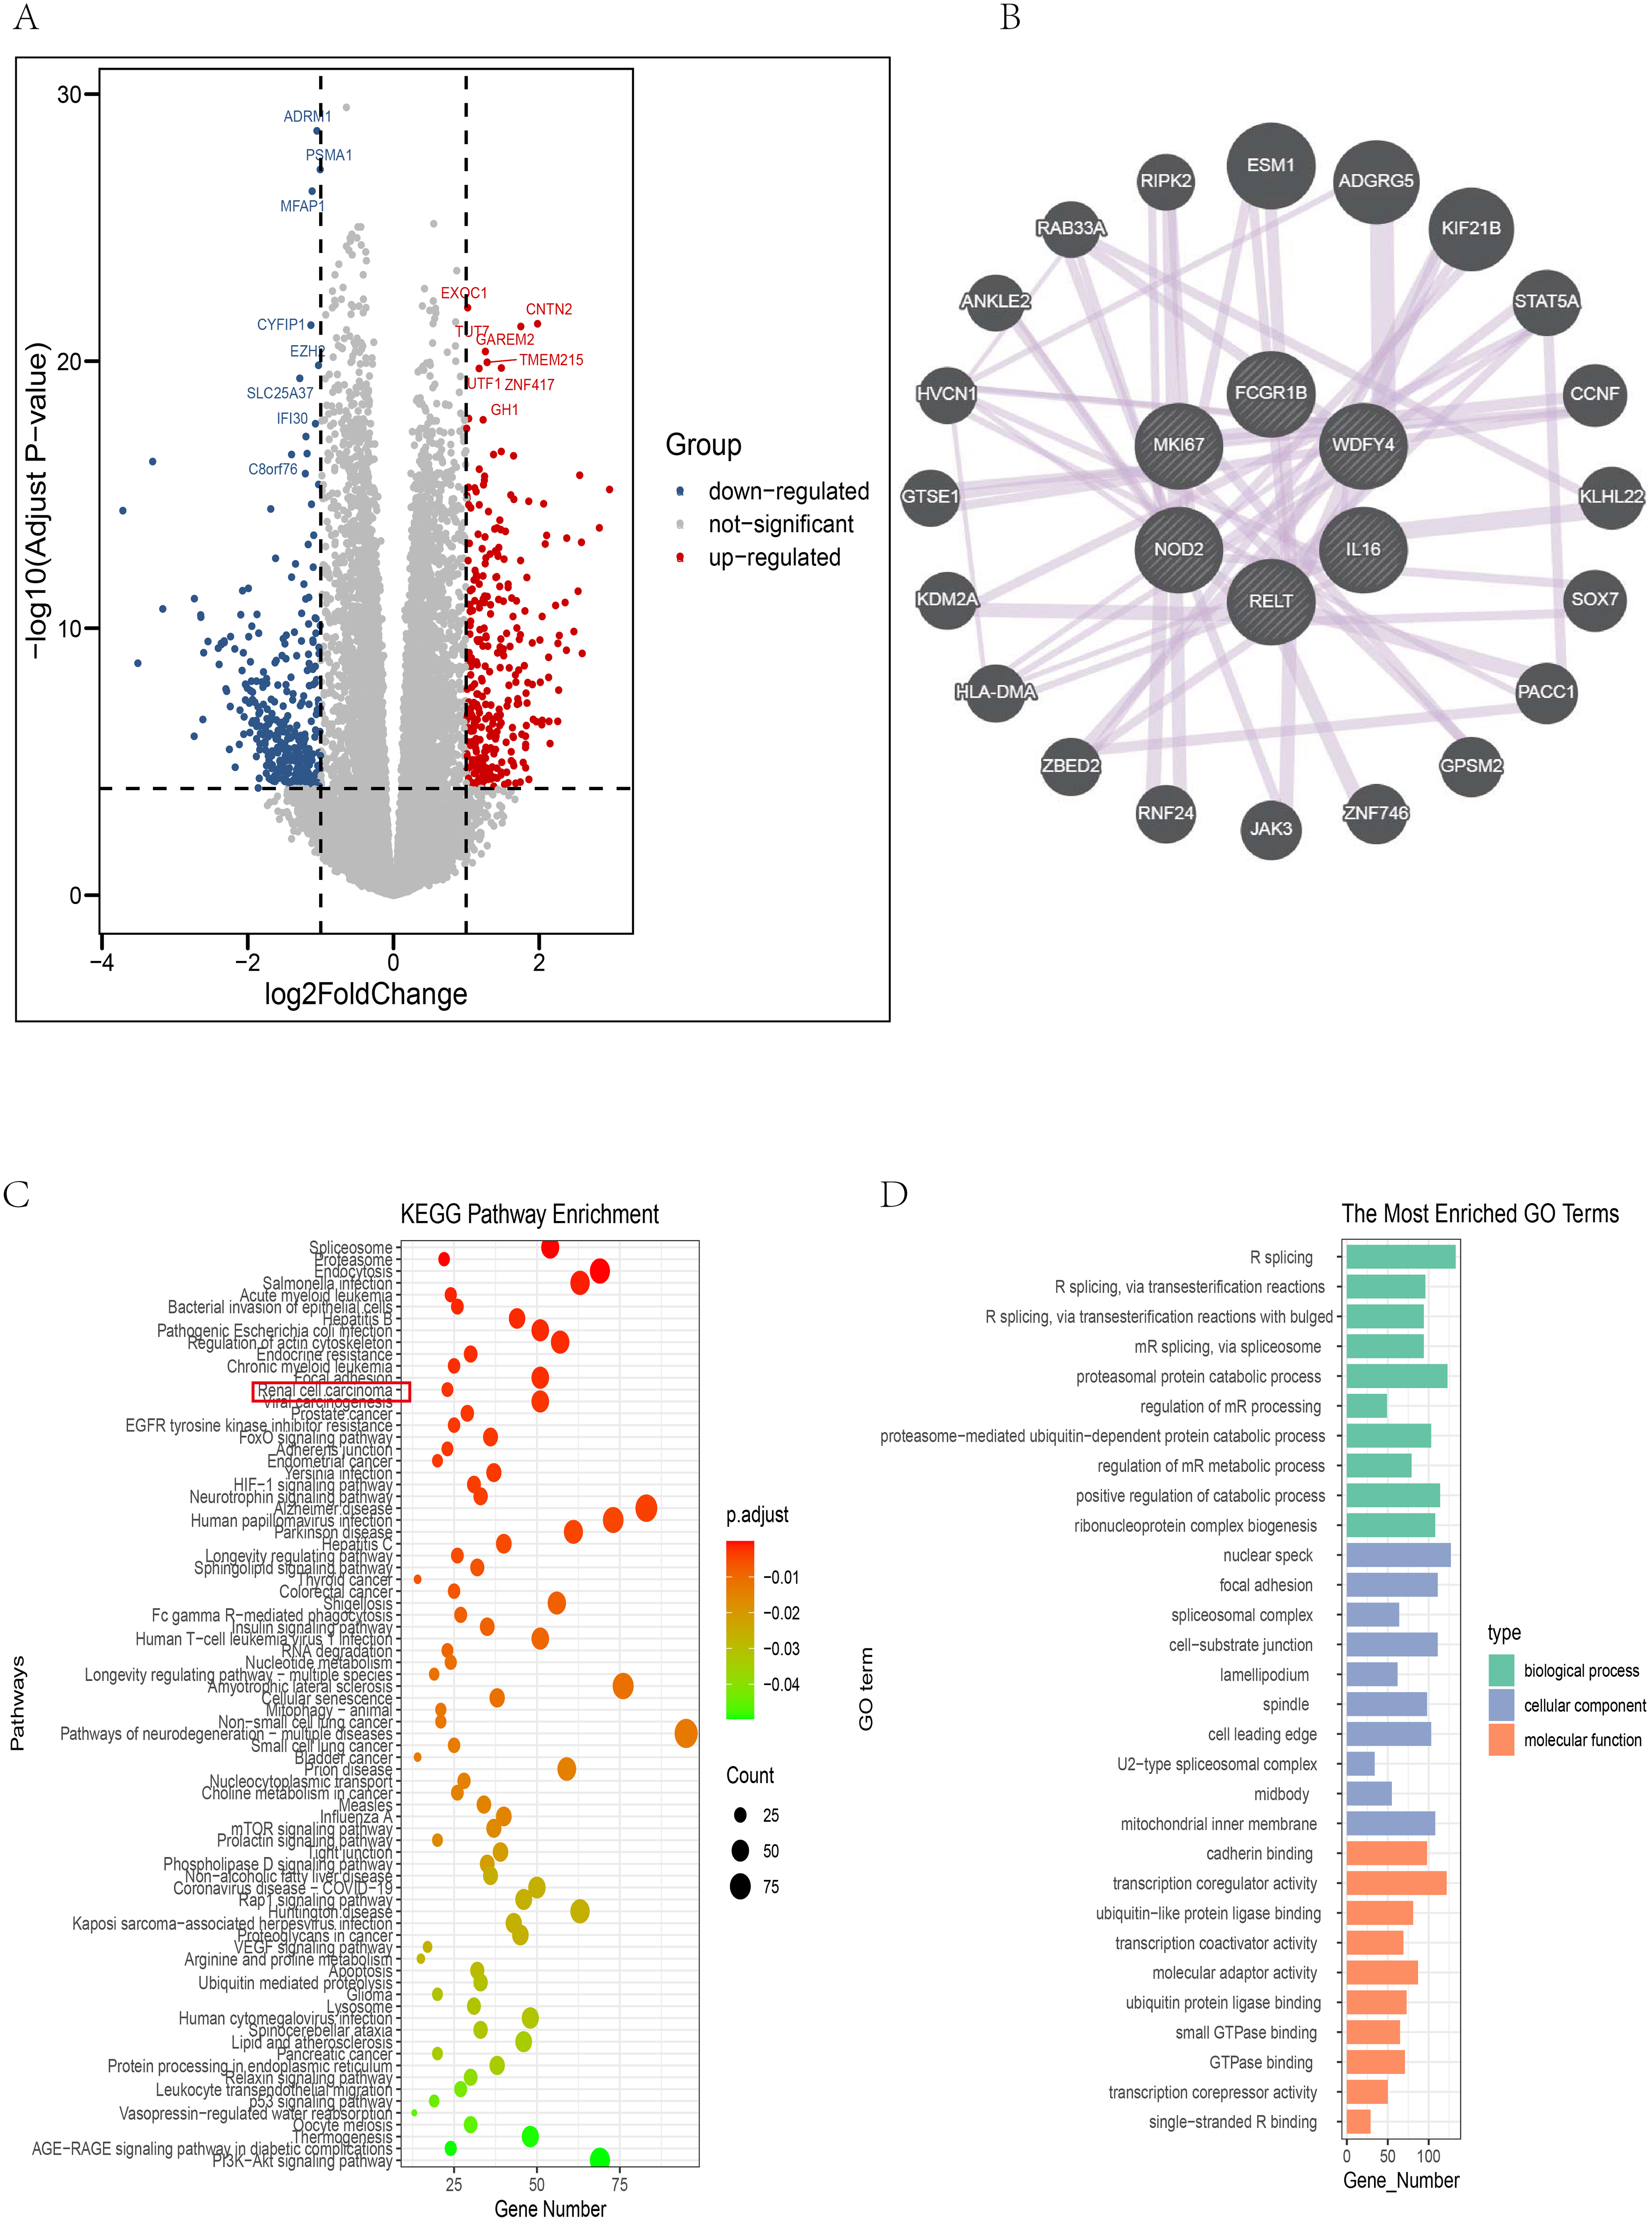
Functional and PPI Analyses of the Signature. (A) DEG Analysis between the High- and Low-Risk Score Groups. Red: Upregulated Genes. Blue: Downregulated Genes. The Cutoff Value was Set at |log FC|>1. A p Value <0.0001 was Used. (B) PPI Analysis of the Six Hub Genes Via the GENEMANIA Database. (C-D) KEGG (C) and GO (D) Enrichment Analyses. A p Adjust Value < 0.05 was Considered a Differential Enrichment Pathway. The Top 10 GO Pathways are Displayed. KEGG Enrichment Revealed that “Renal Cell Carcinoma” was a Major Enriched Pathway.
Immune-Related Values of the Signature
Immune infiltration analysis revealed differential infiltration of 15 types of immune cells between the high-risk and low-risk groups. MDSCs (p < 0.001) and Tregs (p = 0.04) were more highly infiltrated in the high-risk group (Figure 9A-B). The correlation heatmap revealed that 18 types of immune cells, including activated B cells, immature B cells, activated CD8T cells, activated CD4T cells, mast cells, central memory CD8T cells, gamma delta T cells, effector memory CD4T cells, activated dendritic cells, macrophages, regulatory T cells, effector memory CD8T cells, T follicular helper cells, myeloid-derived suppressor cells, natural killer cells, natural killer T cells, central memory CD4T cells, and type 1 T helper cells, were positively correlated with risk. Notably, MDSCs were strongly correlated with Tregs (coefficient value = 0.86) (Figure 9C).

Immunophenotypes and Immunotherapy Efficacy of the Signature. (A) Immune Landscape Between the High-Risk and low-Risk Groups. (B) Violin Plots Showing That the Signature Could Distinguish Between the Infiltration of Several Immune Cell Types, Including MDSCs and Tregs. (C) Heatmap of the Correlations Between Different Immune Cell Types Showing That Several Immune Cell Types Were Positively Correlated. the Value of the Correlation Between MDSCs and Tregs was 0.86. Red: Positive Correlation; Blue: Negative Correlation. (D) Several Immune Checkpoints, Including cd274 (PDL1) and PDCD1 (PD1), Were Differentially Expressed Between the High- and low-Risk Groups. (E) Several HLA-Related Genes Were Differentially Expressed Between the High- and low-Risk Groups. (F-G) the K–M Curves of OS (F) and PFS (G) Showing the Immunotherapy Efficacy in the mccRCC Cohort Treated with NIVOLUMAB. A Higher Risk Score Could Predict Poor PFS. *p < 0.05. **p < 0.01. ***p < 0.001. ****p < 0.0001.
The majority of immune checkpoints exhibited differential expression between the high-risk and low-risk groups. Both PD1 (PDCD1) and PDL1 (CD274) were expressed at significantly higher levels in the high-risk group (Figure 9D). Additionally, the high-risk group presented increased expression of HLA-related genes (Figure 9E). These findings indicate that the high-risk and low-risk groups have distinct immune profiles. Furthermore, we assessed the prognostic value of these features for the response to PD-1 blockade in a mccRCC cohort. K–M analysis showed no significant difference in overall survival (OS) between the high- and low-risk groups (Figure 9F), but the high-risk group had poorer progression-free survival (PFS) (Figure 9G).
Validation of the Performance of the Signature in Independent Cohorts
GSE40435 and GSE53757 were used to validate the clinical and immunotherapy predictive performance of the signature (Figure 10). First, we compared the risk scores between the ccRCC and normal groups (Figure 10A, E). The analysis demonstrated that the risk score was greater in the ccRCC group than in the normal group in both GEO datasets. Additionally, we assessed the relationships between the signature and clinical traits (Figure 10B, F). The results indicated that the risk score in patients with stages III-IV disease was significantly greater than that patients with stages I-II disease in the GSE40435 dataset (p < 0.0001). Although no significant difference was observed in the GSE53757 dataset, the Stage III-IV group still presented a higher score than did the Stage I-II group.

Two GEO Datasets Validating the Clinical and Immunotherapy Predictive Performance of the Signature. (A, K) Violin Plot Showing the Risk Score Between the ccRCC and Normal Groups. The ccRCC Group had a Higher Risk Score. (B, F) Violin Plot Showing the Risk Score Between Stages III-IV and Stages I-II. Patients III-IV had a Higher Risk Score. (C, G) Violin Plot Showing the Stromal Score, Immune Score, and ESTIMATE Score Between the High- and Low-Risk Groups. The High-Risk Group had Higher Stromal, Immune, and ESTIMATE Scores. (D, H) Violin Plot Showing that Almost all Immune Cells had Differential Infiltration Between the High- and Low-Risk Groups. MDSCs and Treg Cells were More Highly Infiltrated in the High-Risk Group (p<0.001) than in the Low-Risk Group in Both GEO Datasets. ****p < 0.0001. ns >0.05.
Furthermore, the ESTIMATEScore, immune score, and stromal score for the high-risk and low-risk groups were calculated (Figure 10C, G). The results revealed that the ESTIMATEScore, immune score, and stromal score were greater in the high-risk group than in the low-risk group in both GEO cohorts.
In addition, the immune infiltration of the high-risk group and low-risk group was also assessed (Figure 10D, H). Nearly all immune cells showed differential infiltration between the two subgroups. MDSCs and Treg cells exhibited increased infiltration in the high-risk group (p < 0.001) in both GEO datasets. Additionally, the expression of immune checkpoints (PD1 and PDL1) and most of the HLA-related genes differed between the high-risk and low-risk groups were different (Figure 11).

Two GEO Datasets Validating the Differential Expression of Immune Checkpoints and HLA-Related Genes Between the High-Risk and low-Risk Groups. *p < 0.05. **p < 0.01. ***p < 0.001. ****p < 0.0001. ns >0.05.
Drug Response Analysis
To explore the drug sensitivity prediction ability of the signature for potential drugs, the data derived from the CellMiner platform were introduced for analysis. Consequently, cancer cells with high wdfy4 expression were sensitive to artemether (R = 0.73, p < 0.0001) and imexons (R = 0.61, p < 0.0001) (Figure 12A). Cancer cells with a high relt expression were sensitive to fludarabine (R = 0.44, p < 0.0001) and cladribine (R = 0.42, p < 0.0001) (Figure 12B). Cancer cells with high expression of nod2 were sensitive to isotretinoin (R = 0.61, p = 0.0001) and imiquimod (R = 0.56, p < 0.0001) (Figure 12C). Cancer cells with a high expression of mki67 were sensitive to ENMD-2076 (R = 0.35, p = 0.0068) and irofulven (R = 0.34, p = 0.0084) (Figure 12D). Cancer cells with high expression of il16 were sensitive to vemurafenib (R = 0.68, p < 0.0001) and SB-590885 (R = 0.61, p < 0.0001) (Figure 12E). Cancer cells with high expression of fcgr1b were sensitive to artemether (R = 0.70, p < 0.0001) and imexon (R = 0.58, p < 0.0001) (Figure 12F).
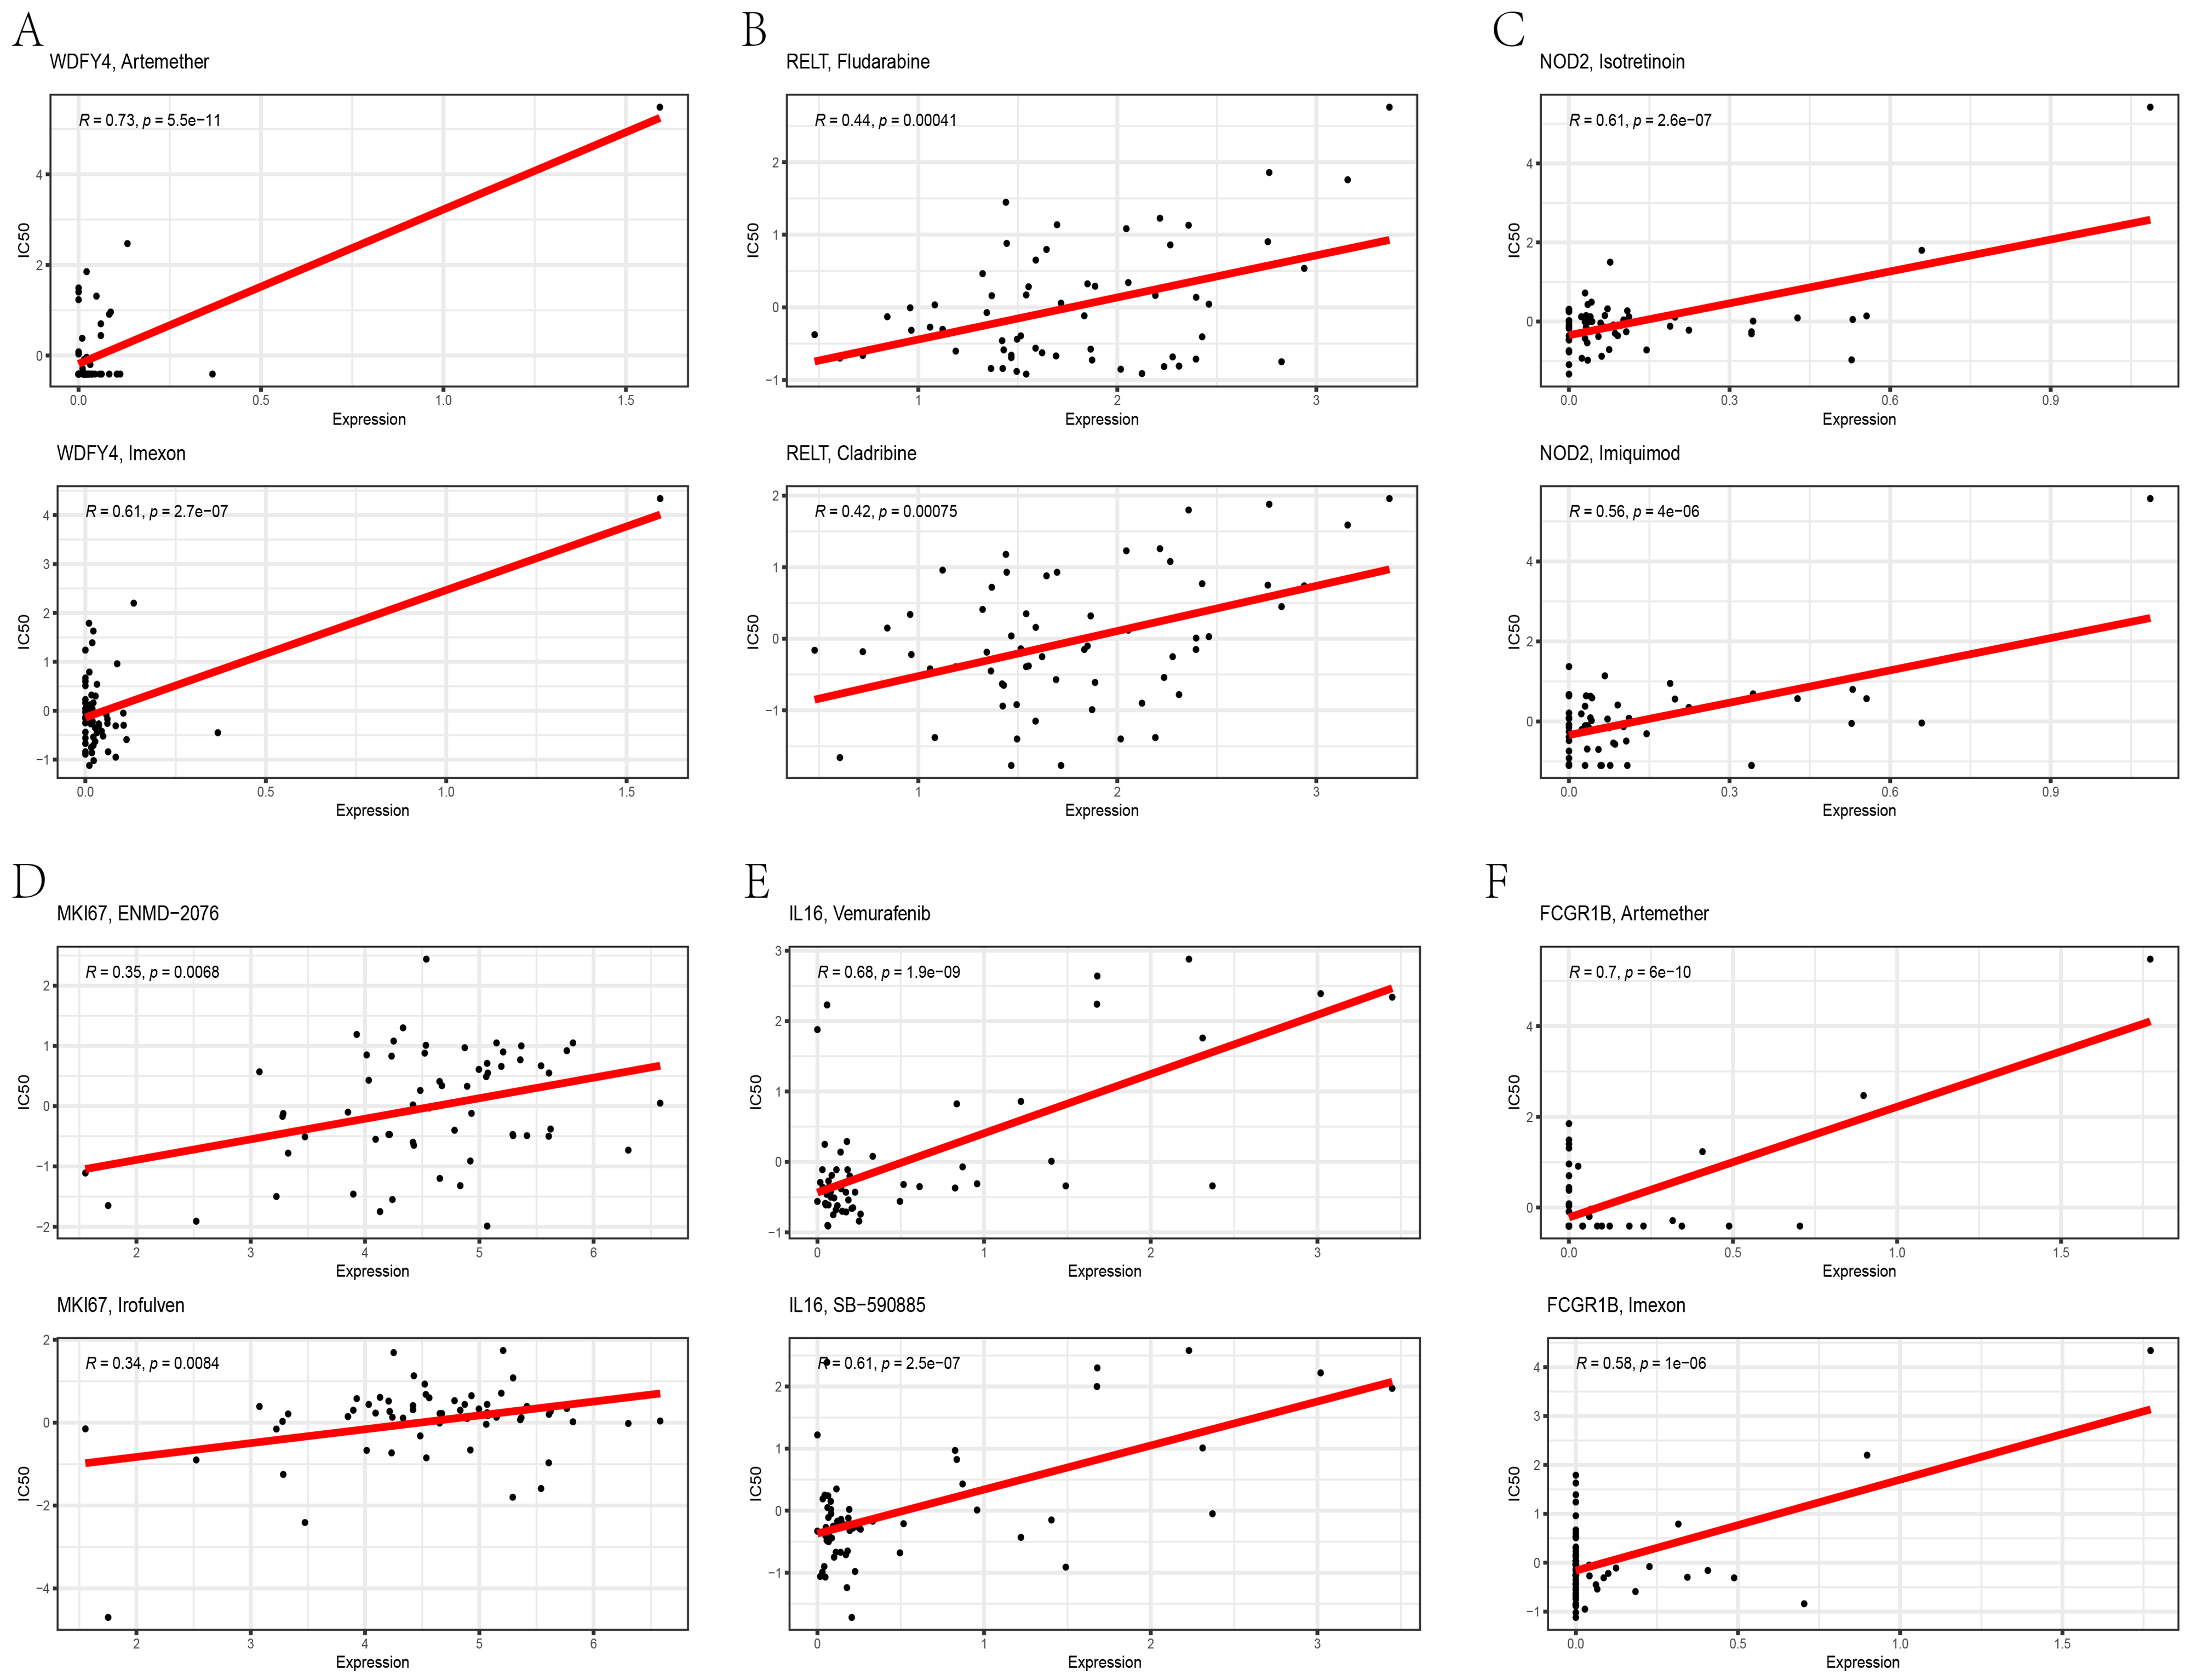
Drug Response Analysis of the Six Hub Genes Via the CellMiner Platform. The Scatter Plots Display the Two Most Relevant Medicines for the Six Hub Genes.
Experimental Validation of the RNA Expression Levels
A total of 11 pairs of ccRCC and noncancerous tissue samples were collected, and detailed clinical information is provided in Table 2. Ill6 (p < 0.05), mki67 (p < 0.001), nod2 (p < 0.01), wdfy4 (p < 0.01), and relt(p < 0.01) were found to be elevated in ccRCC (Figure 13), whereas the RNA expression of fcgr1b was not significantly different (Figure 13C).

Validation of the Expression Levels of the hub Genes via RT–qPCR. ill6, mki67, nod2, wdfy4, and Relt Were Elevated in ccRCC, Whereas the Expression of fcgr1b was not Significantly Different. *p < 0.05. **p < 0.01. ***p < 0.001. ns >0.05.
Clinical Information of Paired ccRCC and Normal Tissues.

Discussion
The tumor microenvironment (TME) consists of tumor cells, nontumor cells (including immune cells, stromal cells, and endothelial cells), blood vessels, and various signaling molecules. Immune cells can secrete cytokines, chemokines, exosomes and growth factors. 28 They can also crosstalk with several nonimmune cells directly or indirectly, 29 ultimately promoting or suppressing tumors. For example, in the context of tumor metastasis, the immune cells and the cytokines they release are essential for establishing the premetastatic niche, controlling the survival of circulating cancer cells, and facilitating the extravasation of tumor cells; they also assist in controlling the dormancy of metastatic cells, coordinating the reawakening of dormant cells and subsequently supporting the growth of metastases during the metastatic stage. However, by interacting with the TME, tumor cells can avoid recognition and killing by the immune system and thus escape immune surveillance. 30 Therefore, the efficacy of immunotherapy is closely linked to the TME. A more detailed understanding of the TME is essential for improving cancer immunotherapy outcomes (CIT).3,4
MDSCs and Tregs are two important components of the TME. MDSCs have the ability to inhibit the antitumor activities of T cells and natural killer (NK) cells, thereby promoting an immunosuppressive environment. 31 Additionally, MDSCs can promote tumor progression via nonimmunological mechanisms, such as the production of high concentrations of matrix metalloproteinase 9 (MMP9), to facilitate the penetration of cancer cells. 32 However, Tregs can also suppress immune functions in several ways, such as IL-2 depletion, the secretion of immunosuppressive cytokines, and the production of immunosuppressive metabolites. 33 Research has demonstrated that the accumulation and activation of MDSCs and Tregs are associated with tumor progression, tumor recurrence, and poor clinical outcomes.33,34
In the present study, we utilized these properties to construct a novel prognostic signature to guide clinical practice. First, we examined immune cell infiltration in both the ccRCC group and the normal group. The analysis confirmed that MDSCs/Tregs were more highly infiltrated in the ccRCC group and that increased MDSC/Treg infiltration was associated with a shortened OS. These results are consistent with the conclusions of previous studies.
Six MDSC/Treg-related DEGs were subsequently screened to construct a prognostic signature. All six genes presented higher expression in the ccRCC group than in the control group. Elevated expression of fcgr1b, nod2, relt, and mki67 predicted a worse OS. A comprehensive analysis revealed that the signature had satisfactory clinical performance. Generally, each clinicopathologic subgroup presented a distinct risk score, with more advanced clinical subgroups showing higher scores. With respect to prognostic prediction, the signature emerged as an independent predictor of prognosis. ROC analysis demonstrated its superior predictive performace compared with other traditional clinical factors, such as T stage, N stage, M stage, and grade. The use of molecular markers and signatures can assist doctors in assessing tumor pathological grading and predicting malignancy levels. Furthermore, these findings offer valuable insights for developing personalized treatment strategies and predicting patient prognosis.
Moreover, through protein–protein interaction (PPI) analysis, we identified the main interacting proteins of the six molecular markers. Pathway enrichment analysis was performed on the DEGs between the high- and low-risk score groups, identifying several potentially relevant pathways. These pathways may reflect the molecular mechanisms by which our high- and low-risk score groups rely on tumor progression, such as “RNA splicing”. Previous studies have shown that alternative RNA splicing is linked to the development and progression of various tumors, including RCC. 35 RNA splicing varies by tissue type and race and is regulated by factors such as cis-/trans-acting elements and mutation conditions. In addition, splicing-related antigens and irregular RNA splicing also play a role in immune reprogramming and the immunosuppressive TME. 35 The “KEGG-renal cell carcinoma” pathway was also enriched, indirectly confirming the accuracy of the molecular labels we constructed. However, a critical perspective is necessary for the enriched pathways mentioned above. Pathway enrichment methods themselves have inherent limitations. 36 Gene annotation is heavily influenced by the depth and volume of prior research in the field, resulting in unequal annotations across genes. Furthermore, this disparity tends to grow over time, following a “rich-getting-richer” pattern in gene research. 37
Furthermore, describing immune characteristics and predicting the efficacy of immunotherapy are also important aspects for evaluating a signature. In our study, more than half of the types of immune cells were differentially expressed between the high-risk group and the low-risk group. Correlation analysis indicated that multiple immune cells were positively correlated with infiltration. The correlation value of MDSCs with Tregs was 0.86. This finding aligns with previous studies showing that Tregs can recruit MDSCs to the tumor site. 38 Additionally, the expansion of MDSCs can also result in increased infiltration of Tregs in the primary tumors. 39
In recent years, the advent of immune checkpoint inhibitors has led to revolutionary advancements in oncotherapy.40,41 The programmed cell death 1 (PD1)/programmed cell death ligand 1 (PDL1) axis plays a critical role in immune evasion and cancer progression. 42 Therefore, anti-PD1/PDL1 therapy has become an important immunotherapy. Satisfactory clinical benefits have been demonstrated for solid tumors in several clinical trials.43,44 Unfortunately, the low response rate to anti-PD1/PDL1 therapy remains an indisputable challenge. 45 The development of a preclinical model could offer an effective approach to predict the response to anti-PD1/PDL1 therapy. In our study, two subgroups classified based on the signature had differential immune infiltration and differential expression of immune checkpoints. MDSCs/Tregs were more highly infiltrated in the high-risk group. The expression of PD1/PDL1 was greater in the high-risk group than in the other groups. Furthermore, we tested the predictive value of the signature for the response to anti-PD1/PDL1 therapy (NIVOLUMAB) in a mccRCC cohort. The results revealed that a high risk score was significantly correlated with poor PFS. Notably, KEGG was also enriched in the HIF-1 signaling pathway. This suggests that immune-suppressing cells (MDSC and Treg) may have a crosstalk relationship through the HIF-1 signaling pathway, which aligns with previous research findings.46,47 However, in terms of OS, there was no significant difference. One plausible explanation is that the patients in this cohort had advanced disease, resulting in a relatively short OS.
Moreover, HLA-related genes have been demonstrated to be potential prognostic biomarkers of ccRCC.48,49 In addition, HLA-related genes and PDL1 can be coexpressed, exerting an adverse effect on the prognoses of ccRCC patients. 50 Therefore, HLA-related genes represent promising targets for immunotherapy in solid cancers (46). Our study revealed that the expression levels of all the HLA-related genes were greater in the high-risk group than in the low-risk group. Consequently, this signature may hold potential as a predictor of the efficacy of HLA-related immunotherapies.
Moreover, we conducted a comprehensive validation of the signature's clinical and immunotherapy predictive performance via two independent GEO datasets. The validation included six key aspects: the risk scores of the ccRCC and normal groups, the risk scores across different clinical subgroups, the immune scores of the high-risk and low-risk groups, the expression of immune checkpoints in these groups, and the expression of HLA-related genes in both groups. In general, the results were in favorable agreement with previous conclusions. Hence, we considered this signature to exhibit good clinical and immunotherapy predictive performance.
Currently, with significant advancements in computing power and algorithms, computer-aided bioinformatics in drug design has become a widely accepted and applied tool in the field of drug development. This approach has great potential for revolutionizing traditional drug research. 51 To facilitate the clinical translation of this signature, we screened potential FDA-approved medicines through the CellMiner website. The CellMiner database serves as a comprehensive resource for data on the molecular and pharmacological characteristics of the extensively studied NCI-60 cancer cell lines. It encompasses various molecular features at the DNA, RNA, protein, methylation, and pharmacological levels. These data exhibit a high degree of reproducibility. 52 In our study, twelve drugs were screened out. These results can provide more precise options for further research on kidney cancer drugs, potentially accelerating and improving the drug development process. Importantly, however, these findings are based on predictions from bioinformatics and artificial intelligence algorithms. The accuracy of these predictions depends on the quality and quantity of the data used in the initial stages. Therefore, the actual therapeutic effects still await experimental verification and clinical trials. In addition, the development of new drugs for the treatment of advanced RCC has been a recent research focus. With the emergence of an increasing number of new drugs, combination therapy with multiple medications has become a new trend for advanced RCC, such as, immune therapy combined with TKIs, dual immune therapy, and dual immune therapy with TKIs.53,54 However, that the optimization of treatment strategies for advanced RCC remains a direction for further exploration in the future. Furthermore, current research on kidney cancer has focused mostly on ccRCC. However, in nonccRCC, there are numerous subtypes with strong heterogeneity, and some subtypes are less sensitive to treatment. Therefore, there is a need to increase the research efforts in this area.
In this study, a molecular signature was established and validated via independent datasets. Interestingly, the PCR validation results for the fcgr1b gene were not consistent with the results of the bioinformatics analysis. This discrepancy may be attributed to several factors: (1) Methodological differences. While public datasets predominantly employ RNA-seq, our validation utilized PCR, introducing variations in detection sensitivity. 55 (2) Sample heterogeneity. The limited sample size for PCR validation coupled with potential batch effects, variations in sample preservation/collection, and RNA degradation may contribute to technical variability. (3) Transcript-specific detection. PCR can only verify a single transcript isoform, potentially missing critical information present in other isoforms that could explain the observed inconsistency. To address these limitations, our future studies will incorporate larger cohorts of high-quality samples and employ identical detection methodologies to validate the bioinformatics findings.
This study has several limitations. First, while validated in two independent datasets, our bioinformatics findings require prospective clinical cohort verification; Second, the current work provides only an initial investigation into predictive modeling of immunotherapy efficacy; the potential mechanism remains unclear and warrants further investigation. There remains an extensive translational pathway before these results could enhance the effectiveness of clinical immunotherapy in RCC patients.
Conclusions
We constructed a prognostic signature based on six MDSC/Treg-related DEGs. The analysis demonstrated its strong predictive performance for both clinical outcomes and response to immunotherapy. Furthermore, we verified the primary findings via two independent GEO datasets. Finally, several potential drugs were screened to facilitate clinical transformation. Interestingly, the PCR validation results for the fcgr1b gene were not consistent with the results of the bioinformatics analysis.
Supplemental Material
sj-doc-1-tct-10.1177_15330338251382839 - Supplemental material for A Prognostic Risk Signature Based on Myeloid-Derived Suppressor Cells and Regulatory T Cells in Clear Cell Renal Cell Carcinoma
Supplemental material, sj-doc-1-tct-10.1177_15330338251382839 for A Prognostic Risk Signature Based on Myeloid-Derived Suppressor Cells and Regulatory T Cells in Clear Cell Renal Cell Carcinoma by Zhaoyu Xu, Ken Liu, Qiangqiang Xu, Peng Li, Qi Wu and Junjie Ye in Technology in Cancer Research & Treatment
Footnotes
Abbreviations
Acknowledgments
Not applicable.
Ethics Statement
The ethical approval for the study was granted by the Ethics Committee of Lishui City People's Hospital (LLW-FO-403).
Informed Consent/Patient Consent
Not applicable.
Author Contributions
Study conception and design: Z X; data collection: P L and Q W, analysis and interpretation of results: J Y and Z X; draft manuscript preparation: Q X and K L. All authors reviewed the results and approved the final version of the manuscript.
Funding
The authors disclosed receipt of the following financial support for the research, authorship, and/or publication of this article: This work was supported by the Lishui Welfare Technology Application Research Project, (grant number No. 2024SJZC117).
Declaration of Conflicting Interests
The authors declared no potential conflicts of interest with respect to the research, authorship, and/or publication of this article.
Data Availability
The datasets included in this study are available from the TCGA (https://portal.gdc.cancer.gov/) and GEO (https://www.ncbi.nlm.nih.gov/geo/). The accession numbers are provided in ![]() . All original datasets and codes are available from the corresponding author upon email request.
. All original datasets and codes are available from the corresponding author upon email request.
Supplemental Material
Supplemental material for this article is available online.
References
Supplementary Material
Please find the following supplemental material available below.
For Open Access articles published under a Creative Commons License, all supplemental material carries the same license as the article it is associated with.
For non-Open Access articles published, all supplemental material carries a non-exclusive license, and permission requests for re-use of supplemental material or any part of supplemental material shall be sent directly to the copyright owner as specified in the copyright notice associated with the article.