
Abstract
Background
Objective
This study aims to investigate the role of RBPs in the stepwise progression of HNSC at the single-cell level, focusing on their expression patterns, prognostic potential, and involvement in key signaling pathways.
Methods
We analyzed single-cell RNA-sequencing data from HNSC samples across four stages, from normal tissue to precancerous leukoplakia, then to primary cancer and finally to metastatic tumors, examining the expression of 2141 previously reported RBPs. We identified RBP-based cell clusters and explored their associations with disease stages, cell types, and cancer progression. A prognostic risk model was developed based on RBPs with significant relevance to patient outcomes.
Results
RBPs displayed distinct cell type-specific expression patterns across different stages of HNSC. We found a significant correlation between RBP-based cell clusters and cancer progression. Notably, a prognostic model was constructed using RBPs such as CELF2, which showed downregulation from early leukoplakia to advanced cancer stages. Fibroblast RBPs were dynamically regulated, particularly in extracellular matrix remodeling, with key proteins like CFL1 and PFN1 linked to improved prognosis. Furthermore, we identified heterogeneity in RBP regulation of the Macrophage Migration Inhibitory Factor (MIF) signaling pathway across cell types during the precancerous stage.
Conclusions
Our findings highlight the crucial roles of RBPs in HNSC progression and suggest their potential as therapeutic targets and prognostic markers, offering insights into personalized treatment strategies.
Introduction
Most head and neck cancers (HNSC) are squamous cell carcinomas, encompassing various sites such as the oral cavity, larynx, and pharynx. 1 It is a widespread malignancy posing a significant threat to human health on a global scale. According to statistics, there are approximately 600,000 new cases of HNSC diagnosed worldwide each year, resulting in nearly 300,000 fatalities. 2 Despite some progress in treatment and prevention, the cure rate for HNSC remains relatively low. 3 HNSC progresses through distinct stages, from normal tissue to preneoplastic lesions such as leukoplakia, followed by carcinoma in situ and metastatic carcinoma, with each stage exhibiting noticeable cellular and molecular characteristics. Leukoplakia represents an early lesion of HNSC, characterized by abnormal proliferation and inadequate keratinization of epithelial cells. Leukoplakia is associated with tobacco and alcohol use and chronic inflammation with the risk of malignant transformation to HNSC of approximately 5% to 17%. 4 The precise mechanisms and molecular regulatory networks driving the carcinogenesis of HNSC remain yet to be fully elucidated.
RNA-binding proteins (RBPs) are pivotal regulators of gene expression. 5 They engage with RNA, controlling the maturation and destiny of target RNAs, while also influencing various gene expression aspects, including mRNA splicing, cleavage, adenylation, RNA stability, localization, editing, and translation. 6 Precise RBP expression maintains tissue identity and cell function, while temporal alterations promote cell differentiation and tissue development. Importantly, dysregulated RBPs can trigger aberrant biological actions, leading to various diseases, including cancer. 7 In the context of HNSC, dysregulation of RBPs is associated with tumor development, metastasis, and treatment resistance. 8 Studies reveal their crucial role in transcriptional or post-transcriptional regulation, significantly impacting cancer development and drug resistance, including YBX1,9,10 La protein,11–14 FXR1, 15 PTBP1, 16 KHDC1L, 17 and others. Furthermore, recent research suggests that RBPs are released in exosomes, small extracellular vesicles that facilitate intercellular communication. 18
Notably, cell-specific RBPs play a crucial role in governing essential processes that regulate cell-specific functional protein expression, 19 and their potential significance in cancer development is becoming increasingly evident. In a recent study, researchers discovered that the RBP FMRP exhibited specific upregulation in cancer cells, influencing cellular communication with immune cells and facilitating immune evasion by tumors. 20 However, much of the current research on RBPs in HNSC is confined to studying whole tissue samples or mixed cell populations, lacking a comprehensive exploration of RBPs at the single-cell level. This limitation hampers our comprehensive understanding of cellular heterogeneity and the molecular regulatory networks in HNSC. Fortunately, the rapid advancements in single-cell sequencing technology have opened new perspectives for HNSC research. Pioneering work by Ji-Hye Choi et al. performed scRNA-seq on samples from non-tumoral surrounding normal tissue (NL), precancerous leukoplakia (LP), primary cancer (CA), and metastatic tumors in the lymph nodes (LN) from HNSC patients. 21 By analyzing these data, we aim to reveal the distinctive features and abnormal expression patterns of RBPs across different cell types in HNSC, shedding light on their potential critical roles in the tumor progression of HNSC.
To elucidate the expression and regulatory changes of RBPs in distinct cell types during the stepwise progression of HNSC, we conducted a comprehensive reanalysis of single-cell transcriptome data from HNSC (GSE181919) mentioned before. 21 Our investigation into RBP expression patterns across four stages revealed distinct cell specificity and progressive alterations in RBP expression. Our primary focus was on epithelial cells, fibroblast cells, and T cells, where we identified RBPs associated with HNSC progression and predicted their functions and prognostic relevance. Additionally, we conducted cell communication analysis among epithelial cells, fibroblast cells, and T cells, pinpointing upstream RBP regulators involved in significantly regulated signaling ligand-receptor interactions during the early precancerous stages. Our findings provide novel insights for early diagnosis and treatment strategies for HNSC.
Materials and methods
Retrieval and processing of public scRNA-seq data
The UMI count matrix of single-cell RNA-seq data from 37 tissue specimens, including non-tumoral surrounding normal tissue (A-NL, n = 9), leukoplakia (B-LP, n = 4), primary cancer (C-CA, n = 20), and metastatic tumors in lymph nodes (D-LN, n = 4), was obtained from the GEO database (GSE181919). The inclusion criteria for selecting data were as follows: (1) availability of high-quality UMI count matrices with minimal technical noise, (2) adequate sample representation across different stages of head and neck squamous cell carcinoma (HNSC) progression, including normal, precancerous, primary tumor, and metastatic stages, and (3) availability of sufficient clinical information related to the specimens, such as patient characteristics and disease stage.
The initial UMI count matrix underwent rigorous filtering using the R package Seurat (v4.3.0.1). 22 Cells failing to meet quality criteria, such as having UMI numbers <500 or detected genes < 200 and >8000, or exhibiting over 10% mitochondrial-derived UMI counts, were deemed low-quality and consequently excluded. Moreover, genes detected in less than 2 cells were also eliminated for downstream analyses. Following stringent quality control, the count values were normalized using ‘SCTransform’ function in Seurat, employing the ‘glmGamPoi’ method. The ‘SelectIntegrationFeatures’ function of Seurat was then utilized to identify the top 3000 variable genes. Subsequently, to reduce dimensionality and mitigate potential batching effects, Principal Component Analysis (PCA) and Harmony (v0.1.1) 23 were executed in sequence.
Using the ‘Elbowplot’ function of Seurat, 22 the top 50 principal components (PCs) were determined for downstream analysis. Subsequently, the primary cell clusters were identified through the ‘FindNeighbors’ (dims = 1:50) and ‘FindClusters’ functions provided by Seurat (resolution = 0.6), resulting in the categorization of cells into 29 major cell clusters. The visualization of these cell clusters was achieved using UMAP (Uniform Manifold Approximation and Projection) with the ‘RunUMAP’ function (dims = 1:50). To characterize the clusters, marker genes were identified by employing the ‘FindAllMarker’ function in Seurat, with criteria set at avg_log2FC ≥ 0.5, pct.1-pct.2 ≥ 0.25, and p_val_adj≤0.05. Furthermore, for differential expression analyses between adjacent disease stages, the ‘FindMarkers’ function from the Seurat package was utilized, requiring |avg_log2FC|≥0.5 and p_val_adj≤0.05. Similarly, the subtyping of Epithelial cells, Fibroblast cells, and T cells was performed using a comparable strategy, but with reduced dimensions (dims = 1:25) and a different resolution parameter (resolution = 0.4).
To ascertain the cell type for each cluster, we utilized a compilation of previously published marker genes (Supplementary Table) representing different cell types in HNSC.21,24 Initially, an automatic cell type annotation R package called ScType 25 was employed to annotate the cell types. Subsequently, a meticulous manual review and corrections were undertaken to refine the annotations. In the end, a total of 13 distinct cell types were successfully annotated.
RNA binding protein (RBP) regulatory program analysis
Firstly, a comprehensive catalog of 2141 RNA-binding proteins (RBPs) was assembled, drawing from four previously published reports.26–29 The UMI count matrix encompassing all expressed RBPs was extracted and utilized as input for Seurat, employing a similar clustering strategy as mentioned earlier (dims = 1:20 and resolution = 0.4). Differential activation of RBPs in cell clusters or cell types was determined using the “FindAllMarkers” function from the Seurat package, with criteria set at avg_log2FC ≥ 0.5, pct.1-pct.2 ≥ 0.15, and p_val_adj≤0.05. Additionally, for the identification of differentially expressed RBPs between adjacent disease stages, the ‘FindMarkers’ function from Seurat was utilized, with conditions |avg_log2FC|≥0.5 and p_val_adj≤0.05. Specifically, we compared leukoplakia with normal tissue, primary HNSC with leukoplakia, and metastatic tumors with primary HNSC.
For correlation analysis, the first step involved constructing metacells from the single-cell dataset. 30 Essentially, metacells are aggregates of small groups of similar cells originating from the same biological sample. The k-Nearest Neighbors (KNN) algorithm was employed to identify groups of similar cells for aggregation, and their average or summed expression was computed to create a metacell gene expression matrix. The sparsity of the metacell expression matrix was significantly reduced compared to the original expression matrix, rendering it more suitable for subsequent analysis. Pearson correlation coefficients between RBPs and target genes were then calculated, and only correlations with |correlation| ≥ 0.7 and p-value ≤0.01 were retained. The resulting networks, comprising modules of RBPs and their corresponding target genes, were visually represented using Cytoscape (v3.9.1) (https://cytoscape.org/).
Pseudotime analysis of epithelial cells
Epithelial cells were isolated, and for pseudotime analysis, trajectory construction, and pseudotime-dependent gene expression calculations, we employed Monocle2 (v2.26.0). 31 Highly variable genes with mean expression ≥0.1 were specifically chosen for unsupervised ordering of the cells, and the DDRTree algorithm within Monocle2 was applied for trajectory reconstruction. To identify RNA-binding proteins (RBPs) that displayed significant differences in expression levels along the developmental trajectory, we utilized the BEAM method, which is integrated into the Monocle2 package.
Establishment of a risk assessment model using trajectory-associated RBPs in epithelial cells
To develop a risk assessment model based on trajectory-associated RBPs in Epithelial cells, we utilized the gene expression and survival analysis data of the TCGA HNSC dataset from the UCSC XENA database (https://xenabrowser.net/datapages/). Initially, univariate Cox regression analysis was performed to identify RBPs significantly associated with prognosis (P ≤ 0.01). Subsequently, multivariate Cox regression analysis was employed to calculate the coefficient values of these RBPs.8,9 The risk score for each patient was then computed using the formula: risk score = Σ(Ci × EXPi), where EXP represents the gene expression level and C denotes the coefficient corresponding to each gene obtained from the multivariate Cox model. The risk score cutoff for classifying patients into high- and low-risk groups was automatically determined using the “surv_cutpoint” function from the “survival” R package. To assess the survival differences between the high- and low-risk groups, we utilized the “survival” R package for statistical analysis.
Tcseq analysis on fibroblasts cells
Initially, the Fibroblast cells were isolated, and the R package TCseq (v1.23.0, available at https://bioconductor.org/packages/release/bioc/html/TCseq.html) was employed to assess trends in RBP expression across different progression stages. RBPs showing differential expression between any two stages which having a |avg_log2FC| ≥ 1 were selected for TCseq analysis. Finally, the RBPs were further categorized into 4 distinct clusters based on their similar expression patterns.
Cell–cell communication
Cell-cell interactions based on the expression of known ligand-receptor pairs in different cell types were inferred using CellChat (v1.6.1). 32 To investigate potential cell-cell communication networks that may be perturbed or induced during HNSC progression, we followed the official workflow and loaded the normalized counts into CellChat. Subsequently, we applied the preprocessing functions “identifyOverExpressedGenes,” “identifyOverExpressedInteractions,” and “projectData” with standard parameters set. As the database, we selected the Secreted Signaling pathways and utilized the precompiled mouse Protein-Protein Interactions as priori network information. For the main analyses, the core functions “computeCommunProb,” “computeCommunProbPathway,” and “aggregateNet” were employed with standard parameters and fixed randomization seeds. Finally, to determine the senders and receivers in the network, the function “netAnalysis_signallingRole” was applied to the netP data slot.
Other analysis
The pheatmap package (v1.0.12, https://cran.r-project.org/web/packages/pheatmap/index.html) was used to conduct clustering based on Euclidean distance. For generating dotplots and heatmaps of the single-cell data, we employed scanpy (v1.9.3). 33 To compare cell clusters between two groups of replicates, we used the R package speckle (version: 0.0.3). 34 Principal Component Analysis (PCA) was conducted using the R package factoextra (https://cloud.r-project.org/package=factoextra) to visualize the clustering of samples with the first two components. To identify functional categories of genes, we employed the clusterProfiler package (v4.6.2), 35 which enabled us to determine Gene Ontology (GO) terms and KEGG pathways.
Results
ScRNA-Seq analysis of the stepwise progression of HNSC reveals cell-specific expression patterns of RBPs that dynamically change over the course of disease advancement
RBPs undergo a remarkably dynamic spatiotemporal regulation process, and disruptions in the RBP-RNA network activity have been strongly associated with tumor progression, highlighting their significance in cancer biology.36,37 To investigate the abnormal regulation of RBPs in the development of HNSC at the single-cell level, we utilized the GEO dataset (GSE181919) of single-cell RNA-seq, comprising samples from 37 patients with HNSC (Figure 1(a)). This dataset covers various stages of disease progression, ranging from normal tissues to precancerous leukoplakia, primary HNSC, and metastasized tumors. Totally, we obtained 54,239 single cells from all samples after strict data quality control. The count matrix of 54,239 cells underwent normalization, PCA, and UMAP visualization, leading to 29 cell clusters (Figure S1a). Based on previously reported markers for HNSC, we identified 13 major cell types using a combination of automated and manual annotation methods (Figure 1(b) and (c)). Disease progression showed changing proportions: B cells, T cells, pDCs increased; endothelial, fibroblast, pericytes decreased; epithelial and macrophages were highest in primary HNSC (Figure S1b). These findings provide crucial insights into cellular dynamics during the progression of HNSC.
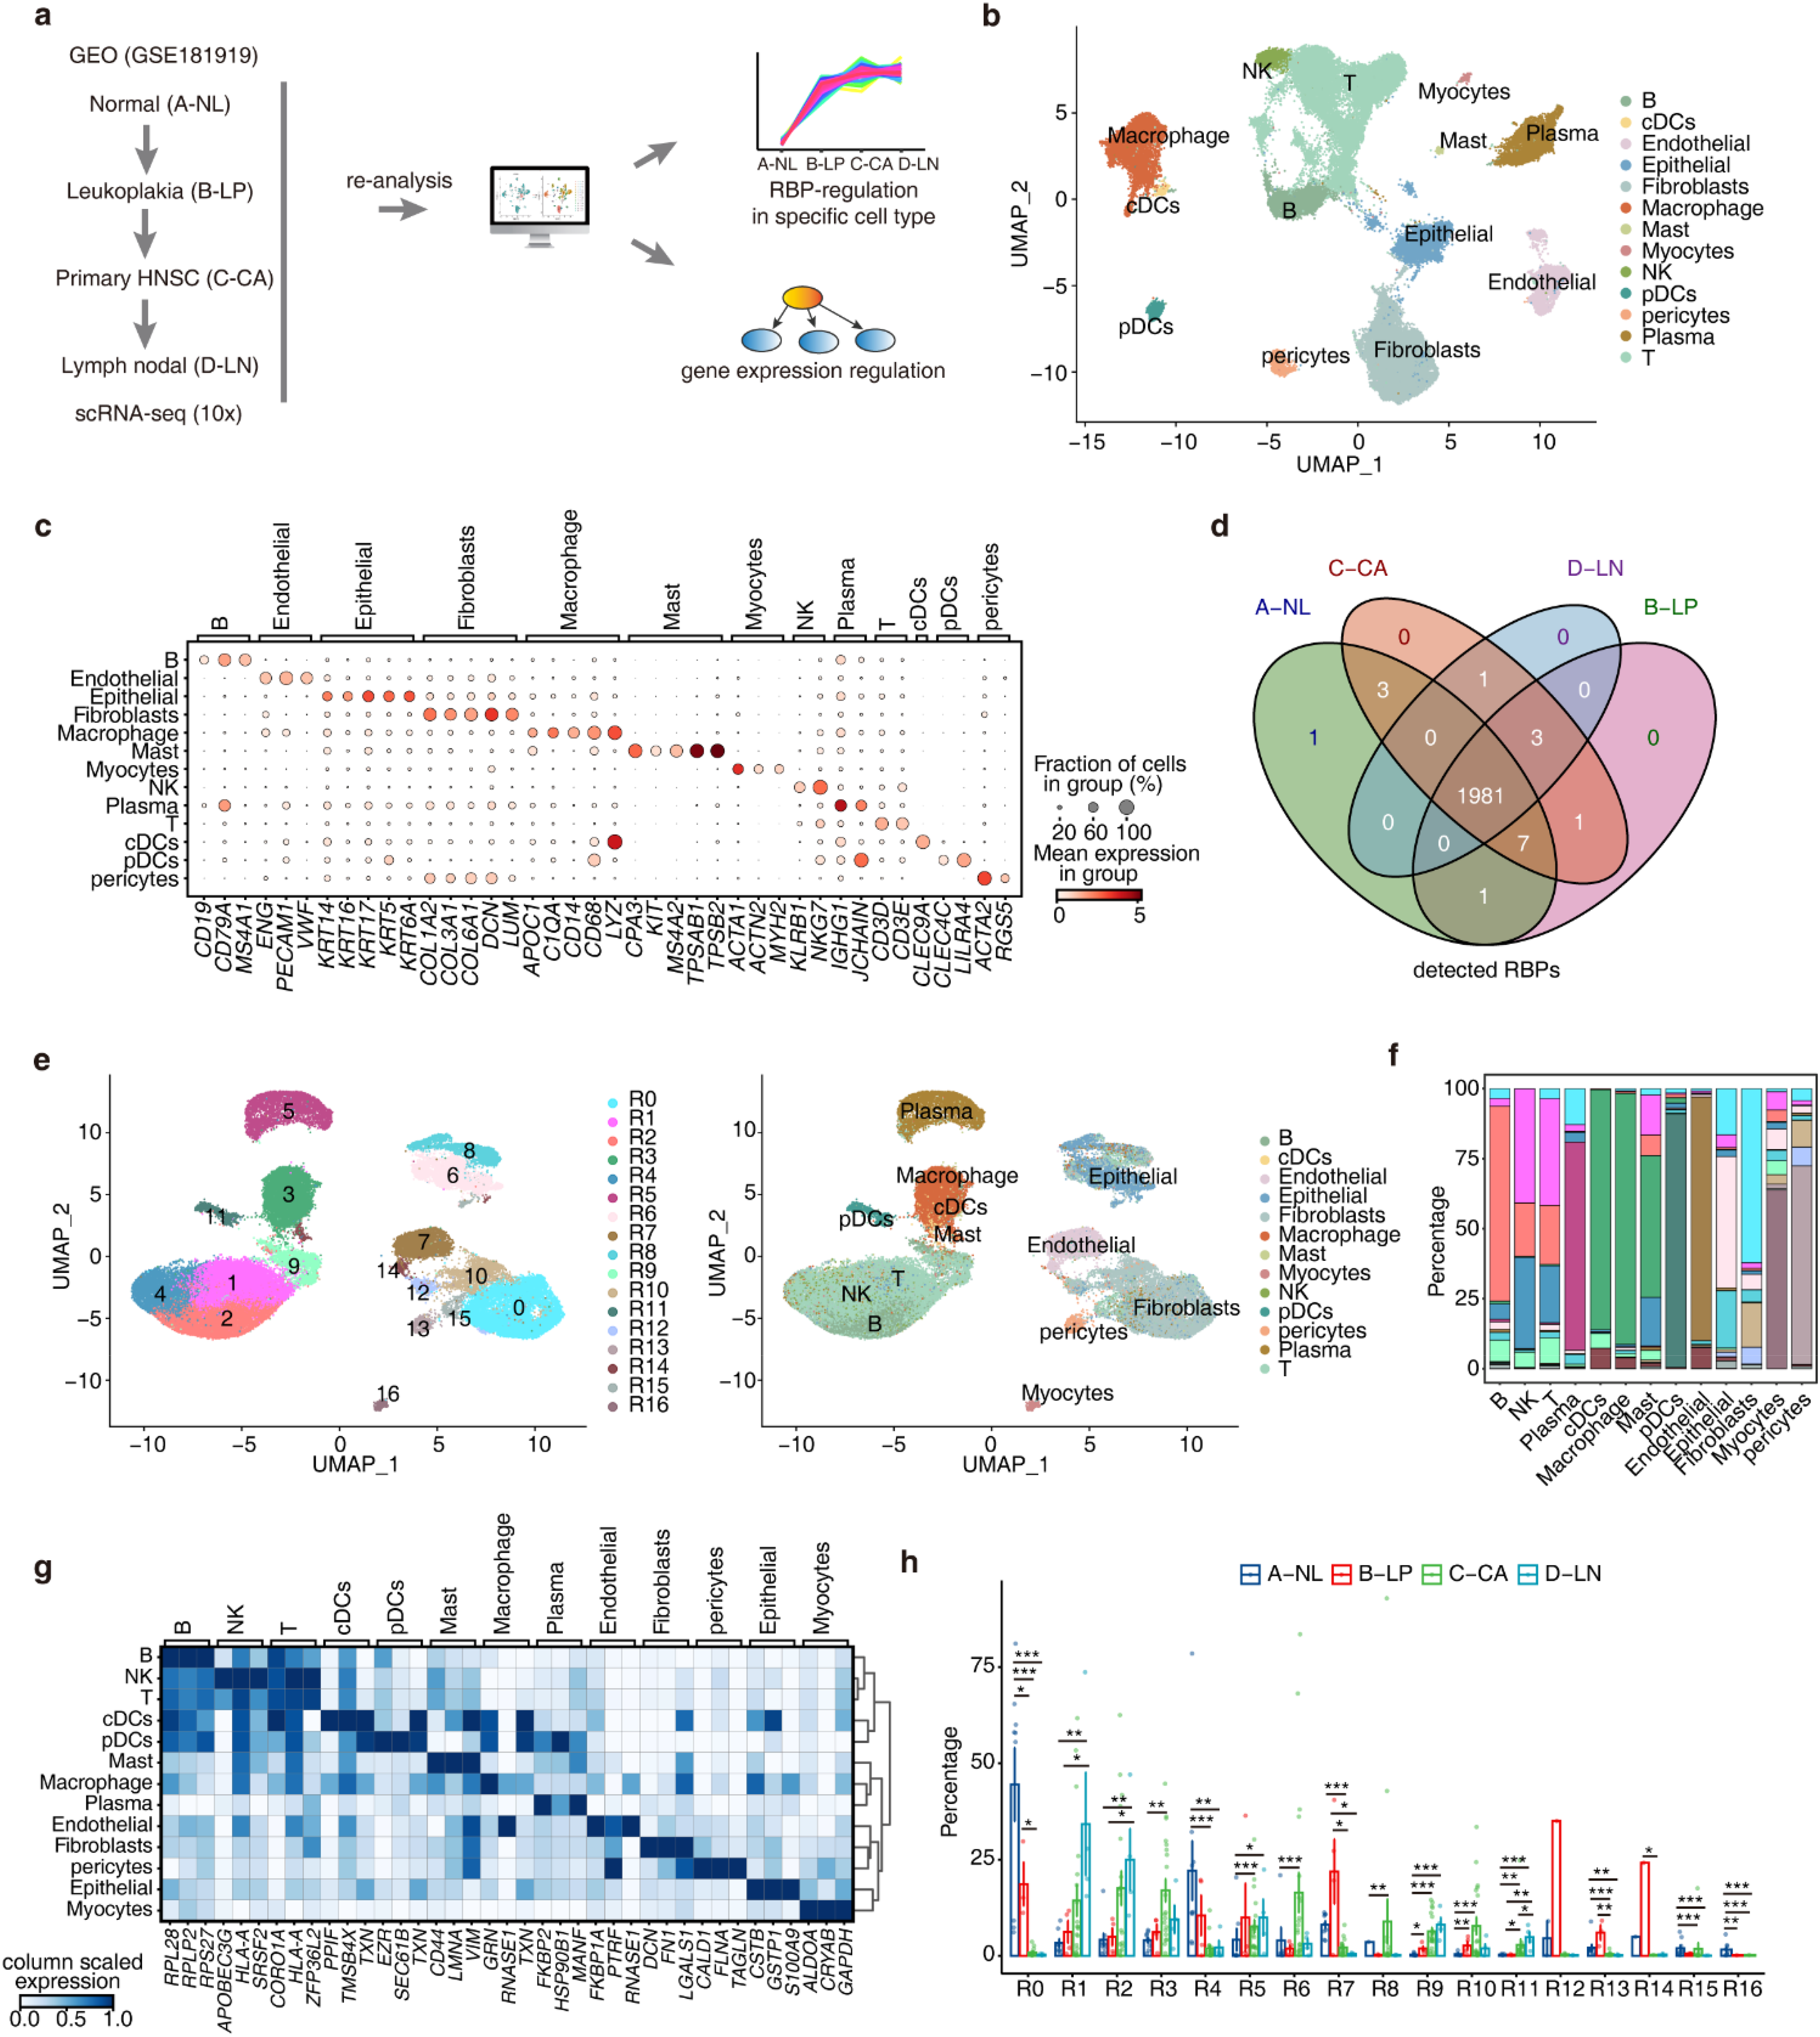
ScRNA-Seq analysis of the stepwise progression of head and neck cancer reveals cell-specific expression patterns of RBPs that dynamically change over the course of disease advancement. (a) Schematic illustration of the study design and analytical workflow. (b) Uniform Manifold Approximation and Projection (UMAP) plot of composite single-cell transcriptomic profiles from all samples. Colors indicate annotated cell types. cDCs, conventional DCs; pDCs, plasmacytoid DCs; NK, natural killer. (c) Dot plot showing expression patterns of representative genes in each cell type. Dot size denotes the percentage of cells expressing the corresponding gene and dot color represents the average expression. (d) Venn diagram showing RBPs detected in different disease stages. An RBP is considered detected if expressed in at least 2 cells. (e) UMAP plot in the left displays the distributions of 17 RBP-based cell clusters determined by Seurat package. Colors of UMAP in the right indicate cell types. (f) Stacked bar plot showing the relative proportions of RBP-based cell clusters composing different cell types. (g) Unsupervised clustering heatmap showing relative expression (z score, column scaled) levels of top3 RBP markers of each cell type in single-cell dataset. (h) Bar plot comparing the relative proportions of each RBP-based cell cluster within each sample group.
To investigate the expression patterns of RBPs in different cell subpopulations of HNSC, we collected 2141 RBPs from previous reports.26–29 The majority of RBPs showed detectable expression across various stages and cell types, suggesting their widespread involvement (Figure 1(d), Figure S1c). Using Seurat, we performed unsupervised clustering based on the expression levels of all detected RBP genes to depict distinct RBP expression patterns in different cells (Figure 1(e), Figure S1d). RBP-based cell clusters exhibited high cell type specificity: B, NK, and T cells predominantly expressed R1, R2, R4, and R9 clusters; cDCs, Macrophage, and Mast cells mainly expressed R3 cluster; Plasma cells showed R5 cluster expression; pDCs cells were associated with R11 cluster; Endothelial cells displayed R7 and R14 cluster expression; Epithelial cells presented R6 and R8 cluster expression; Fibroblasts cells demonstrated R0, R10, and R12 cluster expression; Myocytes cells exhibited R16 cluster expression; and pericytes cells showed R13 cluster expression (Figure 1(f)). We highlighted the top 3 RBP markers specific to different cell types (Figure 1(g)). Notably, CORO1A was predominantly expressed in immune cells, while DCN showed specific expression in fibroblasts (Figure S1e). The high RBP specificity in different cell types implies their crucial role in maintaining cell functions and features.
On the other hand, we observed a close correlation between the relative proportions of different RBP-based cell clusters and cancer progression. For instance, B, NK, and T cells predominantly expressed R4 and R9 clusters in the precancerous stage, while they shifted to R1 and R2 clusters in the advanced stage. Similarly, Fibroblast cells exhibited R0 and R12 cluster expression in the precancerous stage but switched to R10 cluster expression in the advanced stage (Figure 1(h), Figure S1f). We further explored the heterogeneity of RBP expression at the single-cell level in different RBP-based cell clusters and between sample groups (Figure S1g), revealing substantial variability. These findings provide a comprehensive view of the cellular composition in HNSC tissues and the changes in RBP expression throughout cancer progression.
RBPs which associated with prognosis are involved in the cancerization of epithelial cells in HNSC
Epithelial cells play a vital role in the development of precancerous leukoplakia and its progression to cancer. 38 Dysregulation of RBPs is crucial in epithelial cell malignant transformation.39,40 We analyzed 4067 epithelial cells using Monocle2 and identified three branches (Figure 2(a)). Pseudotime analysis showed normal tissue cells primarily in the initial stage (Figure 2(a), Figure S2a). Branch proportions varied significantly over four stages (Figure 2(b)). Normal tissue (A-NL) and leukoplakia (B-LP) cells mainly clustered in the early S1 branch, while primary HNSC (C-CA) cells were prevalent in S3 and metastasized tumors (D-LP) in S2 and S3 branches. S1 branch markers were linked to extracellular matrix, cell adhesion, and growth factor pathways. S2 branch markers were enriched in RNA localization to Cajal bodies. S3 branch markers were associated with epidermal development and keratinocyte differentiation, both relevant to tumor development (Figure S2b). The marker RBPs of S1 are predominantly highly expressed in the normal tissue, while those of S2 and S3 are upregulated in other disease groups (Figure S2c).
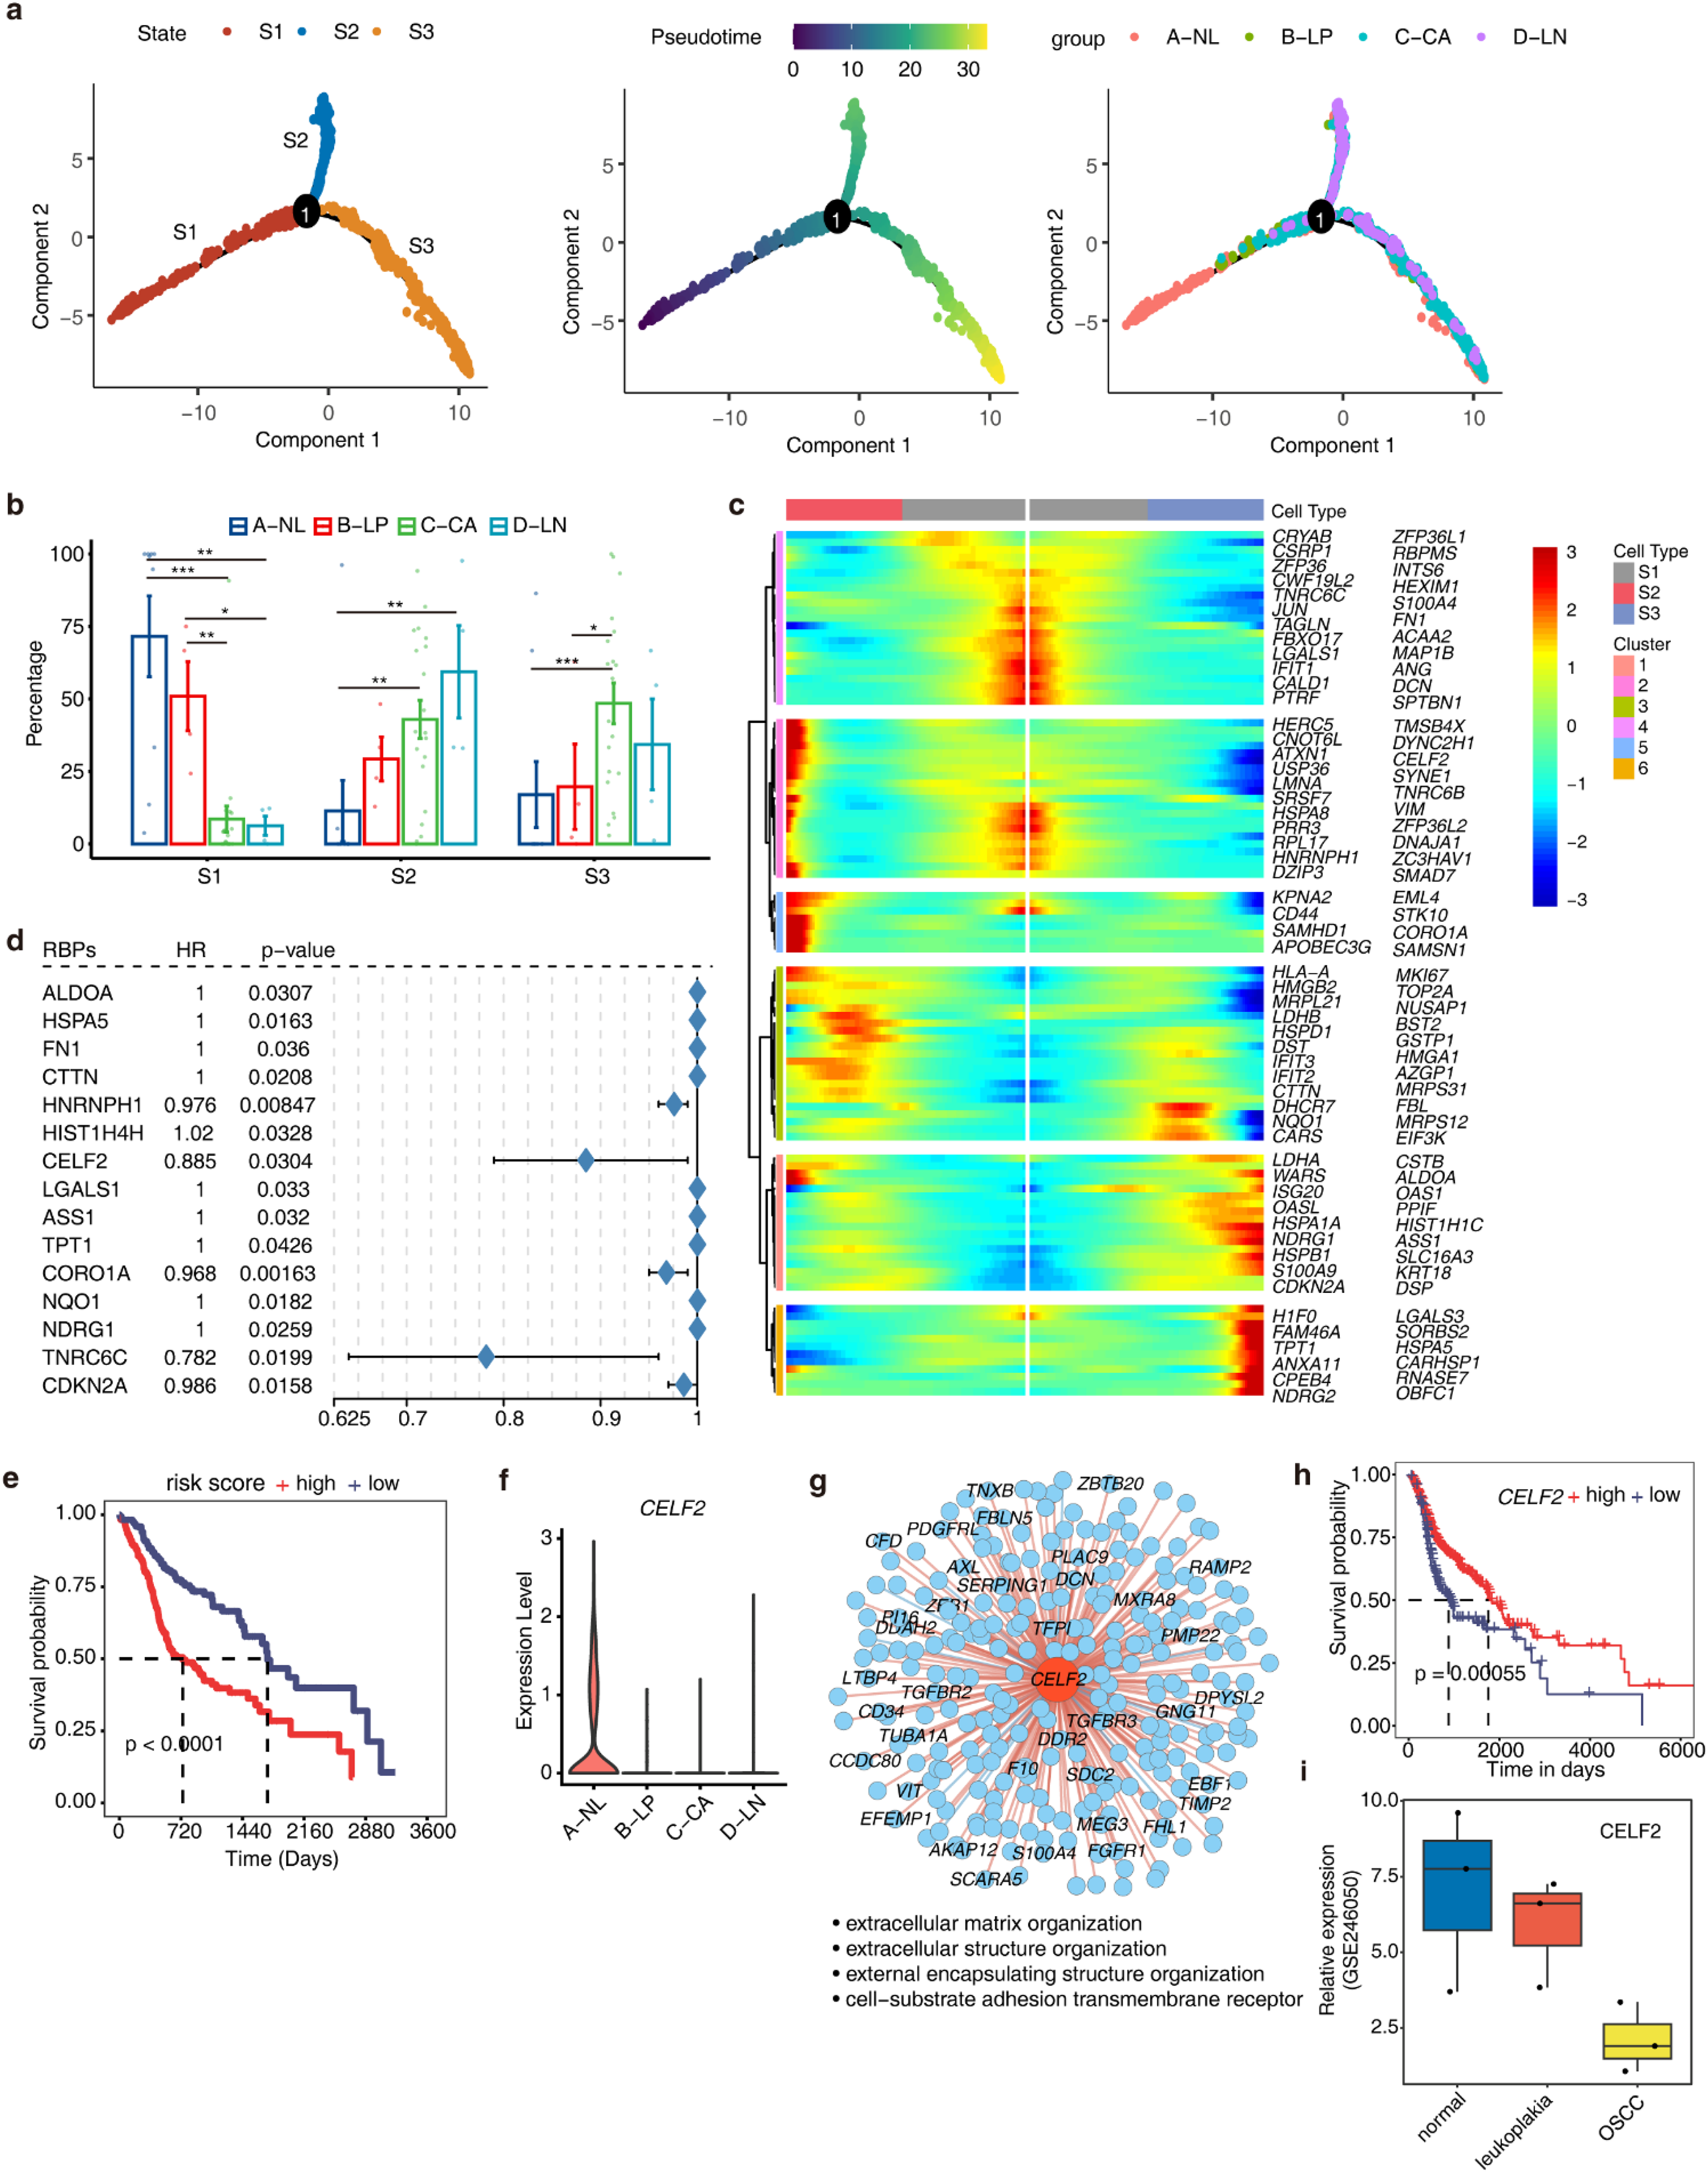
RBPs which associated with prognosis are involved in the carcinogenesis of epithelial cells in HNSCC. (a) Pseudo-time of Epithelial cells inferred by Monocle2. Cells color-coded according to different cell branches (left), pseudotime value (center), and sample groups (right). (b) Bar plot comparing the relative proportions of cell populations of each cell branch within each sample group. *, P ≤ 0.05; **, P ≤ 0.01; ***, P ≤ 0.001. (c) BEAM analyses of RBPs with significant differential expression dependent on major branchpoint. (d) Prognostic value of the candidate RBPs in the HNSC cohort. The hazard ratio (HR) and P-values were calculated using the univariate Cox regression analysis. (e) Comparison of overall survival according to the risk score calculated from candidate RBPs. (f) Gene expression level of CELF2 in four sample groups was represented in the violin plot. (g) Cytoscape shows the co-expression networks comprising CELF2 and target genes in Epithelial cells. Edges connect RBP-target gene pairs while nodes represent genes. Positive correlations were colored with red lines and negative correlation were colored with blue lines. Metacells of CSC cells were constructed and then co-expression associations of RBPs and target genes were built with Persons’ correlation analysis. Pairs with |correlation| ≥ 0.7 and p value ≤ 0.01 were left. Target genes with |correlation| ≥ 0.9 were labeled. (h) Kaplan–Meier curves of overall survival for patients with different expression levels of CELF2 in HNSC patients from the TCGA database. (i) Validation of CELF2 expression levels across normal tissues, oral leukoplakia, and OSCC tissues using the GSE246050 dataset. The box plot illustrates the progressive downregulation of CELF2 expression.
Using the Monocle2 branch expression analysis modeling (BEAM) test, we identified 105 RBP genes showing significant branch-dependent differential expression (Figure 2(c), Table S1). Hierarchical clustering of Monocle2 branched model fits grouped these branch-dependent genes into six clusters (Figure 2(c)). Next, we aimed to investigate whether these RBPs associated with epithelial cell carcinogenesis are correlated with patient survival. Based on these RBPs, we extracted the expression and prognosis information of 350 tumor samples from 70% of TCGA HNSC. Subsequently, we performed univariate cox regression analysis and selected 15 RBPs with p < 0.05 to construct a risk model (Figure 2(d)). These RBPs included ALDOA, HSPA5, FN1, CTTN, HNRNPH1, HIST1H4H, CELF2, LGALS1, ASS1, TPT1, CORO1A, NQO1, NDRG1, TNRC6C, and CDKN2A. By performing multivariate cox regression analysis, we obtained the risk score for each sample, where higher risk scores were associated with significantly poorer prognosis (Figure 2(e)). The prognostic model was well validated by the remaining 30% TCGA HNSC samples and the external data from the CPTAC database (Figure S2d).
We particularly noticed CELF2, a gene encoding an RNA-binding protein (RBP) that plays a critical role in regulating RNA processing, stability, splicing, and translation within cells. 41 It has been reported to have anti-proliferative functions in cancer cells. 42 CELF2 exhibited high expression in normal tissues and significant downregulation in other stages (Figure 2(f)). Co-expression analysis in epithelial cells indicated that CELF2 was mainly associated with extracellular matrix and cell adhesion-related genes (Figure 2(g)). TCGA samples with high CELF2 expression showed better prognosis (Figure 2(h)). Using the GSE246050 dataset, we validated our findings and observed a progressive downregulation of CELF2 expression across normal tissues, oral leukoplakia, and OSCC tissues (Figure 2(i)). These findings suggest that CELF2 expression is suppressed in precancerous leukoplakia and may be associated with epithelial cell malignant proliferation. Two other RBPs, ASS1 and ALDOA, previously reported to be related to tumor progression,43,44 showed increased expression and were associated with worse prognosis (Figure S2e-f). Overall, our results demonstrate the involvement of numerous RBPs in epithelial cell carcinogenesis, making them potential therapeutic targets.
Temporal analysis of RBPs in fibroblasts indicates progressive dysfunction, associated with matrix remodeling and actin filament processes during HNSC progression
In the early stages of leukoplakia, fibroblasts may already display some features resembling cancer-associated fibroblasts (CAFs). 45 However, the factors initiating this transformation remain unclear. To explore the role of RBPs in this process, UMI counts of RBP genes were used to construct the regulatory atlas of fibroblast cells. Unsupervised clustering grouped fibroblast cells into 12 regulatory clusters (fR1 to fR11) (Figure 3(a)), each showing distinct RBP expression features (Figure S3a). Remarkably, the RBP-based cell clusters were found to be distributed according to stepwise stages, implying dynamic regulation of RBPs in fibroblast transformation during the carcinogenesis process (Figure 3(b)). Normal tissue mainly consists of fR0, fR1, fR3, and fR6; leukoplakia is mainly composed of fR5, fR2, fR0, fR1, and fR4; primary HNSC is mainly composed of fR4, fR7, fR9, fR10, and fR11; and metastasized tumors is mainly composed of fR8, fR4, and fR11 (Figure S3b). From the proportions of RBP-based cell clusters, normal and leukoplakia tissues appear to be relatively similar, with fR4 being the predominant type in primary HNSC and metastasized tumors, and also occurring to a lesser extent in leukoplakia (Figure 3(c), Figure S3b). Functional pathway enrichment analysis of co-expressed genes of marker RBPs in RBP-based cell clusters revealed that fR4 enriched in pathways related to extracellular matrix, fibrosis, angiogenesis, and cell migration, closely associated with cancer progression (Figure 3(d)). The proportions of fR4 showed a significant increase from normal to leukoplakia tissue, suggesting its potential transition into CAFs. We extracted the marker RBPs of fR4 and constructed an RBP-target regulatory network through co-expression analysis (Figure 3(e)). The findings indicated that these RBPs potentially regulate genes mainly involved in matrix remodeling, cell adhesion, and related functions (Figure 3(f)).
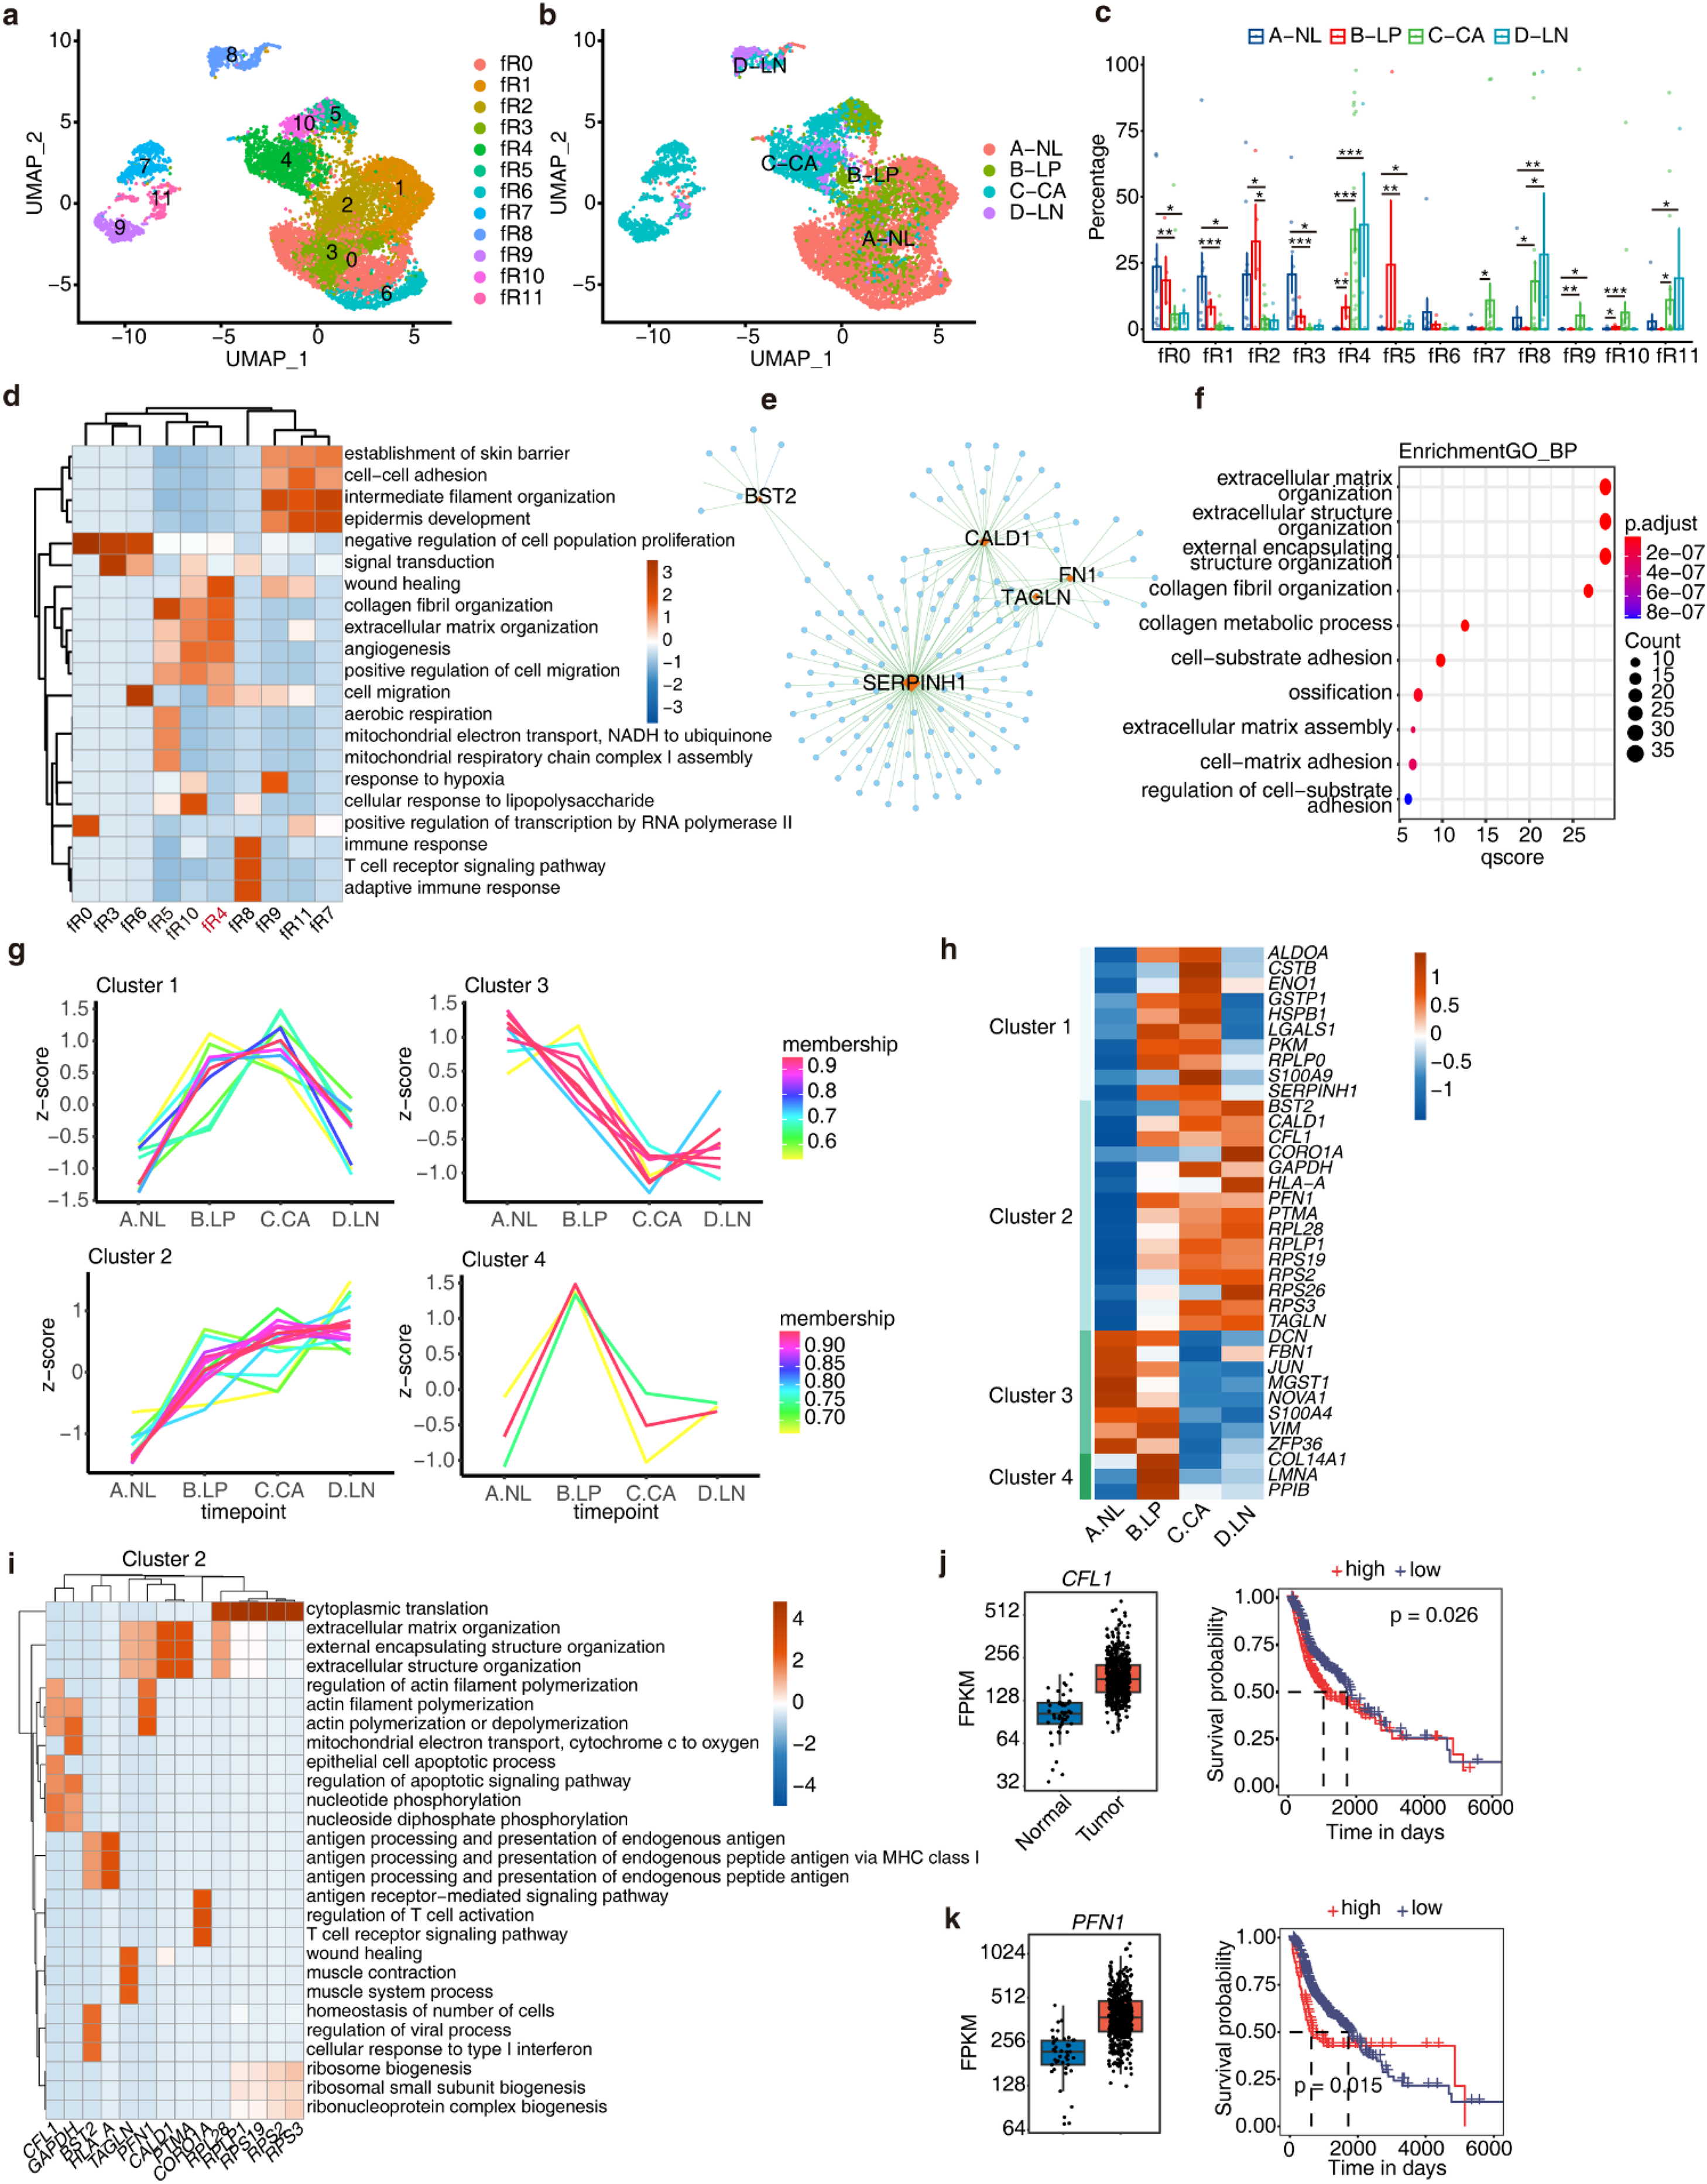
Temporal analysis of RBPs in Fibroblasts indicates progressive dysfunction, associated with matrix remodeling and actin filament processes during HNSC progression. (a) UMAP plot displays the distributions of 12 RBP-based cell clusters of Fibroblasts cells determined by Seurat package. Colors of UMAP in the right indicate cell types. (b) UMAP plot of Fibroblasts cells profile. The color indicates the sample groups. (c) Bar plot comparing the proportions of cell populations of each RBP-based cell cluster within each sample group. (d) Gene ontology enrichment analysis of biological processes of target genes co-expressed with marker RBPs in each RBP-based cell cluster. Top 3 terms were selected for each cluster and heatmap shows the enrichment q-value of these terms (scaled by column). (e) Cytoscape shows the co-expression networks comprising marker RBPs from fR4 and target genes. Edges connect RBP-target gene pairs while nodes represent genes. RBPs are displayed in red and target genes are displayed in blue. Metacells of all cells were constructed and then co-expression associations of RBPs and target genes were built with Persons’ correlation analysis. Pairs with |correlation| ≥ 0.7 and p value ≤ 0.01 were left. (f) Top10 enriched GO biological process terms of genes involved target genes of marker RBPs from fR4. (g) Dynamic cluster analysis of RBP expression in Fibroblast cells during HNSC progression based on TCseq. RBPs showing differential expression in any two sample groups were used for temporal analysis. Four clusters were determined based on RBP expression modules. (h) Heatmap showing relative average expression (z score, row scaled) levels of differentially expression RBPs across sample groups. (i) Gene ontology enrichment analysis of biological processes of target genes co-expressed with each RBP from Cluster 2. Top 3 terms were selected for each cluster and heatmap shows the enrichment q-value of these terms (scaled by column). (j-k) Gene expression levels of CFL1 and PFN1 in tumor and normal samples from TCGA HNSC dataset are represented in the left violin plot. Kaplan–Meier curves of overall survival for patients with different expression levels of CFL1 and PFN1 in HNSC patients from the TCGA dataset are shown on the right.
Next, we explored the dynamic changes of RBPs in fibroblasts during cancer progression. Firstly, we identified RBPs with differential expression between each two stages (|logFC| ≥ 1) and classified them into four distinct time-dependent expression clusters using TCseq package (Figure 3(g) and (h), Table S2). Subsequently, we evaluated the biological functions of co-expressed genes within these clusters (Figure S3b). We observed that Cluster 1, Cluster 2, and Cluster 4 exhibited lower expression levels in the normal group, with their co-expressed genes mainly enriched in pathways related to extracellular matrix remodeling. In contrast, Cluster 3 showed a distinct pattern, where its expression decreased progressively as the disease advanced from leukoplakia to metastatic stages. The co-expressed genes in Cluster 3 were primarily associated with skin development pathways, indicating a potential role in early disease stages that diminishes as tumor progression intensifies. These findings suggest that as the disease progresses, RBPs related to extracellular matrix remodeling in fibroblasts are aberrantly activated, while RBPs involved in maintaining normal skin development and function are suppressed. This process may lead to the transformation of fibroblasts into CAFs.
Cluster 2 RBPs exhibited an increasing expression pattern from normal to leukoplakia and in situ carcinoma (Figure 3(i)). We conducted functional enrichment analysis on co-expressed genes of each RBP in Cluster 2, revealing associations with extracellular matrix remodeling (TAGLN, PFN1, CALD1, PTMA, and RPL28), actin polymerization (CFL1, GAPDH, and PFN1), and antigen presentation/T cell activation (BST2, HLA-A, and CORO1A). CFL1 and PFN1 regulate actin polymerization. TCGA data indicated their upregulation in tumors, significantly correlating with poor prognosis (Figure 3(j) and (k)). In contrast, Cluster 3 RBPs showed a decreasing expression pattern from normal to leukoplakia and primary HNSC (Figure S3c). Functional enrichment associated DCN, S100A4, VIM with normal skin development and differentiation, JUN, ZFP36 with transcription and protein stress response, FBN1 with cytoplasmic translation and cell adhesion, and MGST1 with extracellular matrix remodeling. Notably, NOVA1 was linked to epithelial to mesenchymal transition. TCGA data showed its downregulation in tumors, significantly correlating with poor prognosis (Figure S3d). Overall, these dynamically regulated RBPs in fibroblasts exhibited distinct expression patterns and were associated with tumor prognosis. These findings provide important insights into tumor initiation and progression, offering potential new therapeutic targets and biomarkers for cancer treatment and prognosis assessment.
RBPs exhibit heterogeneity in regulating the aberrant activation of MIF signaling across different cell types during the precancerous stage of HNSC
To further investigate the expression patterns and functions of RBP genes in T cell subsets, we extracted T cells for secondary analysis. After unbiased secondary clustering and annotation, we divided T cells into four main subgroups (Figure S4a). Subsequently, based on the expression patterns of RBPs in T cells, we further categorized them into 11 RBP-based cell clusters (tR0-tR10) (Figure 4(a) and (b)). By comparing the composition of RBP-based cell clusters among different T cell subtypes, we found that Cycling T cells in the leukoplakia stage already exhibited RBP expression patterns similar to primary HNSC. CD8 NKT and Treg CD4T cells in the leukoplakia stage began to include the tR2 cluster, which was the main module of primary HNSC and metastasized tumors (Figure 4(c)). tR1 mainly comprised normal and leukoplakia stages, with typical RBPs such as LMNA, ZFP36, and RPL17. tR5 was the major component of Cycling T cells in the normal stage, with typical RBPs including DCN, LGALS1, and JUN (Figure S4b). ZFP36 and LGALS1 can promote T cell apoptosis and inhibit T cell activity,46,47 and their expression decreases as the disease progresses, suggesting their role as regulators of immune responses in T cells (Figure S4c-d).
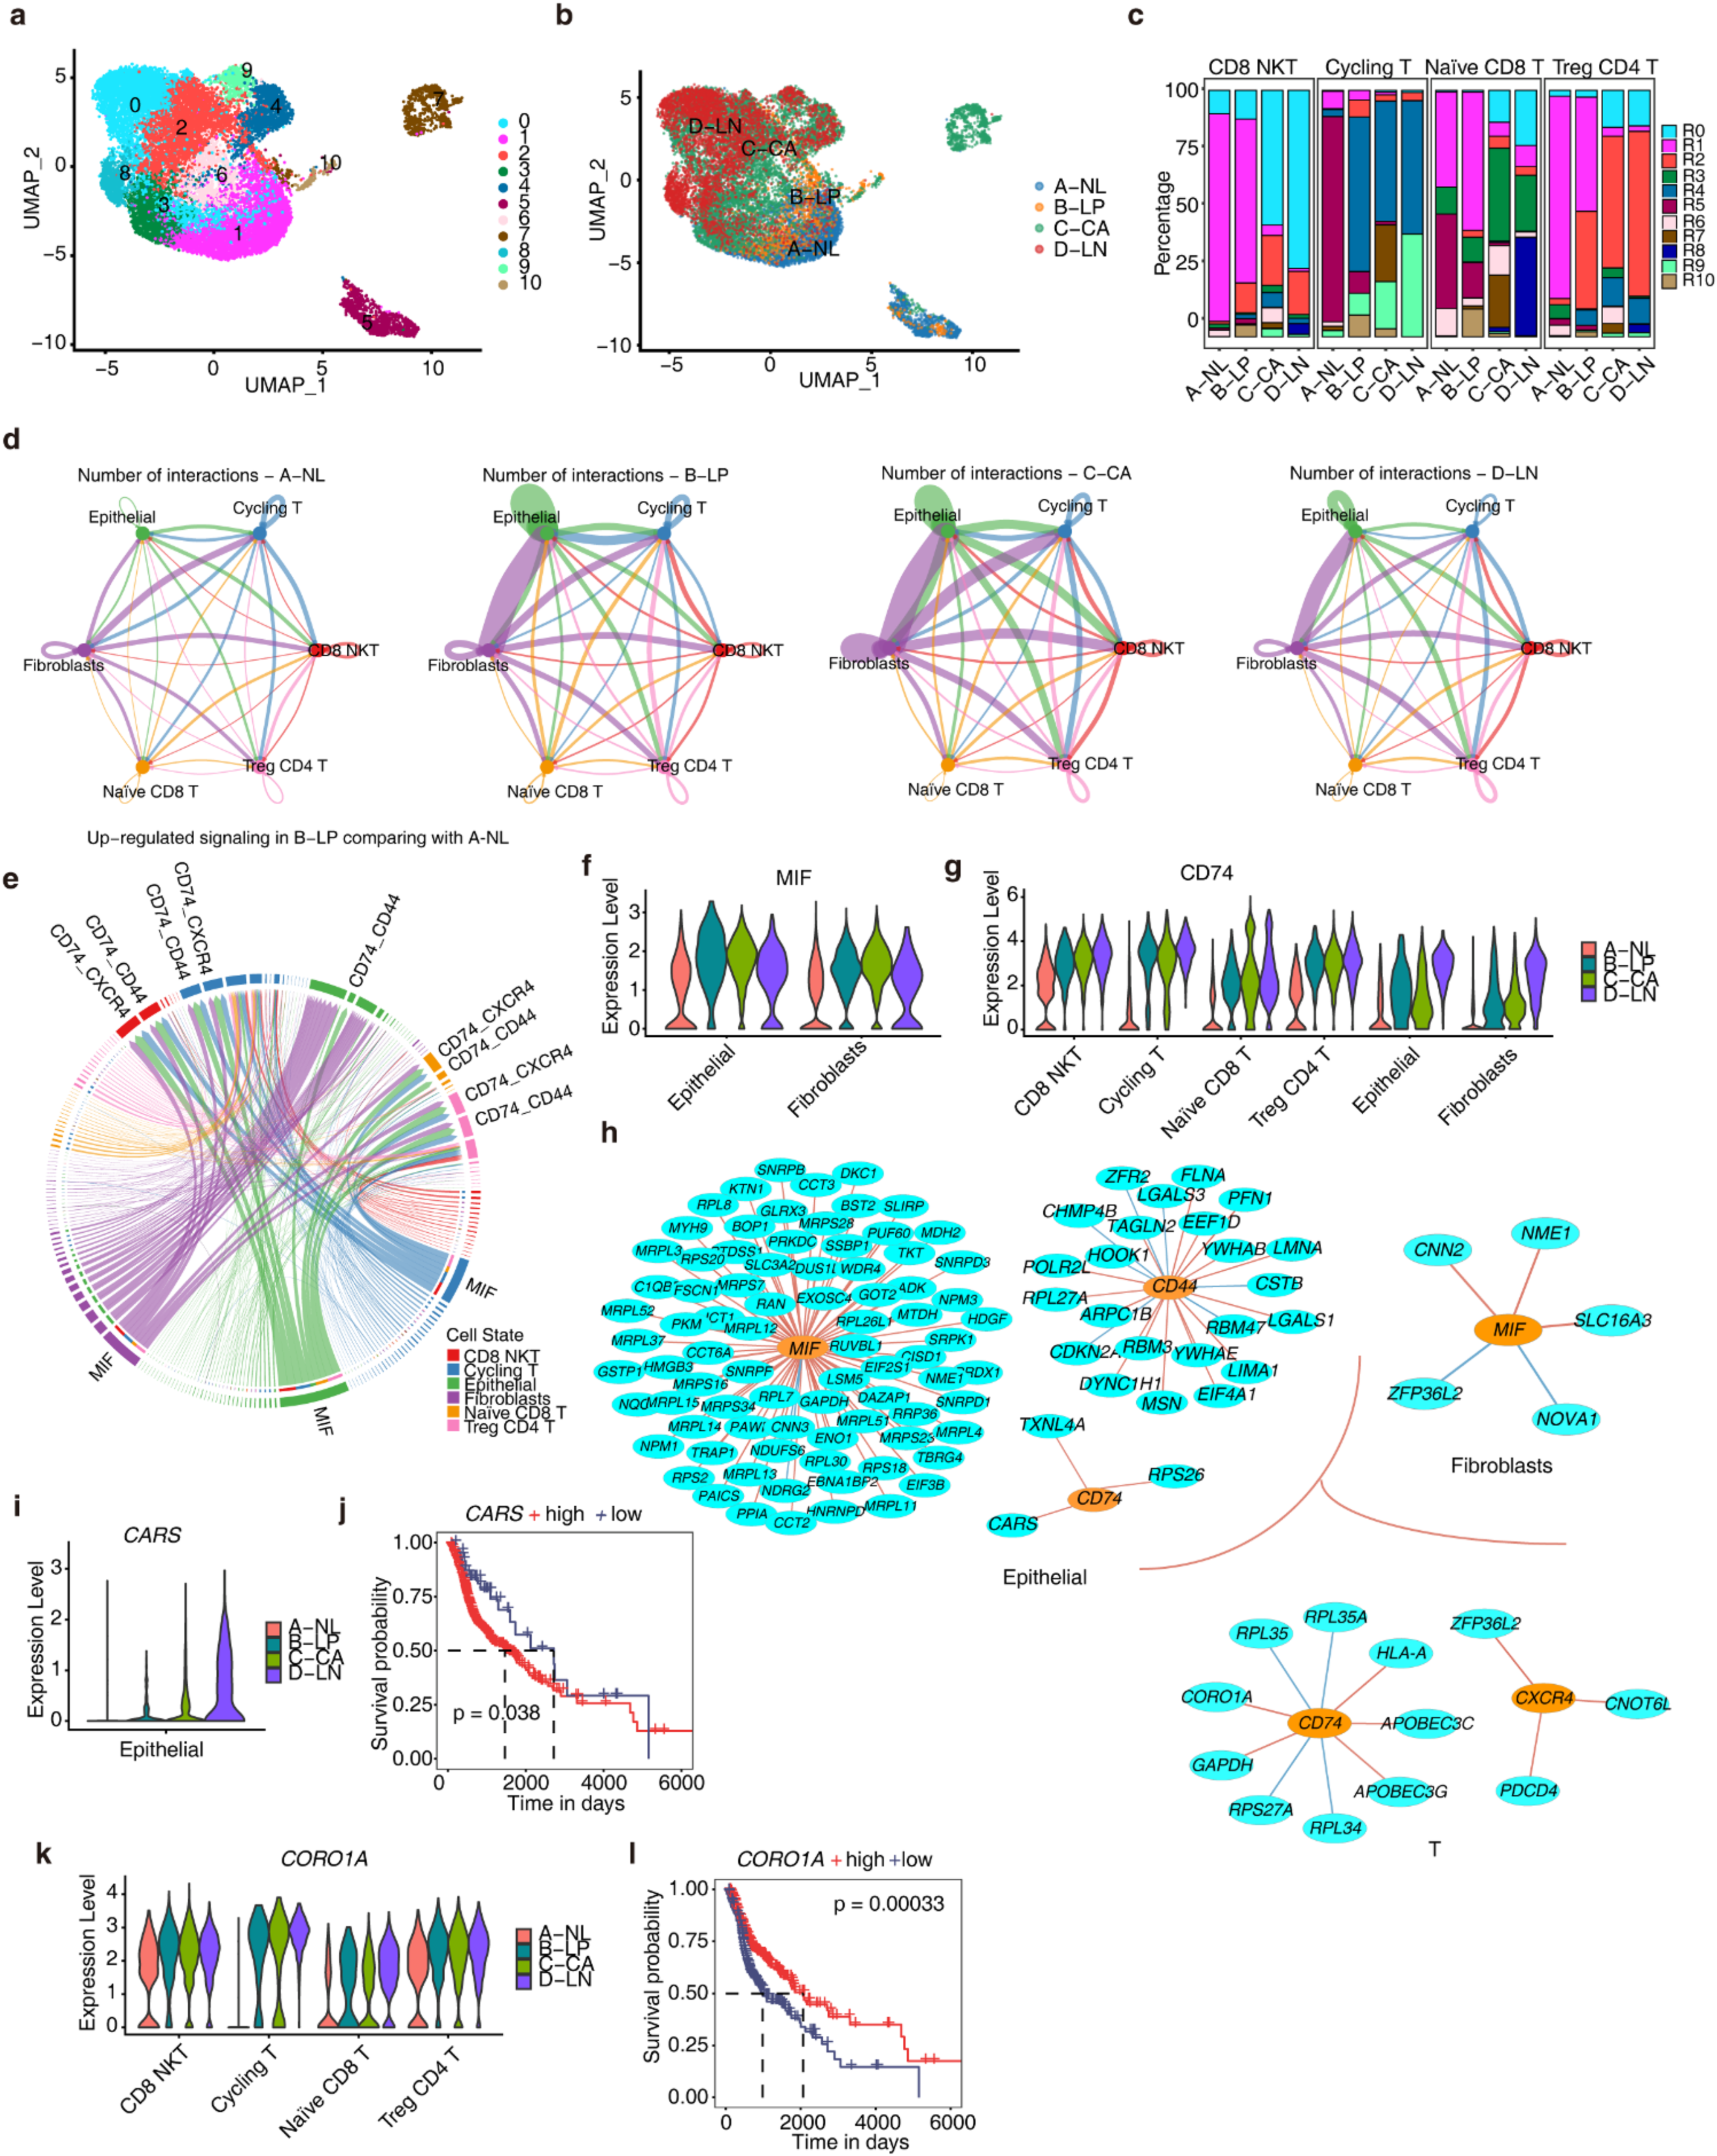
RBPs exhibit heterogeneity in regulating the aberrant activation of MIF signaling across different cell types during the precancerous stage of HNSC. (a) UMAP plot displays the distributions of 11 RBP-based cell clusters of T cells determined by Seurat package. Colors of UMAP in the right indicate cell types. (b) UMAP plot of T cells profile. The color indicates the sample groups. (c) Stacked bar plot showing the relative proportions of RBP-based cell clusters in different subtype of T cells from different sample groups. (d) Number of interactions among the Epithelial cells, fibroblasts, and T cells in four sample groups. (e) Circular plot displaying up-regulated ligand-receptor pairs in leukoplakia comparing with normal sample group. (f-g) Gene expression level of MIF and CD74 involved in MIF signaling pathway was represented in the violin plot. (h) For the up-regulated ligands and receptors of the MIF signaling pathway, co-expression analysis was carried out with RBPs in each cell type, respectively, to extract the RBP co-expression relationships with these ligands and receptors. The resulting network is shown. (i, k) Gene expression level of CARS and CORO1A was represented in the violin plot. (j, l) Kaplan-Meier curves depicting the overall survival of HNSC patients from the TCGA dataset based on different expression levels of CARS and CORO1A.
The complex interactions among epithelial cells, fibroblasts, and T cells in the tumor microenvironment play a pivotal role in the process of cancer development. 48 Using Cellchat, we analyzed the cell communication between epithelial cells, fibroblasts, and different T cell subtypes in the four-stage samples. Compared to the normal group, the number of intercellular interactions significantly increased from the leukoplakia stage, particularly between fibroblasts and epithelial cells (Figure 4(d)). This suggests that the interactions among various cell types in the pre-cancerous microenvironment have become more complex, and deciphering the characteristics of these interactions can help understand the mechanisms of carcinogenesis. Compared to the normal samples, we observed a specific upregulation of the macrophage migration inhibitory factor (MIF) signaling pathway in the leukoplakia stage (Figure 4(e)). In particular, the ligand MIF gene showed significant upregulation in epithelial cells, fibroblasts, and cycling T cells (Figure 4(f)), while the receptor gene CD74 was markedly upregulated in different cell types (Figure 4(g)). The receptor gene CXCR4 was predominantly upregulated in cycling T cells and Naïve CD8T cells (Figure S4e), and the receptor gene CD44 maintained a relatively high expression level (Figure S4f-g). These results indicate that CD74 may be a crucial receptor gene in response to the MIF signal during disease progression.
The interaction between MIF and CD74 has a dual role. MIF binding to CD74 activates the NF-κB pathway, leading to the release of inflammatory factors and regulating immune cell activation and response. 49 However, this interaction also plays a crucial role in tumor development, promoting tumor cell proliferation, metastasis, and invasion. 50 To identify RBPs associated with MIF signaling activation during cancer development, we extracted RBPs expressed in epithelial cells, fibroblasts, and T cells and conducted co-expression analysis with the receptor and ligand genes of the MIF signaling pathway (Figure 4(h)). In epithelial cells, many RBPs showed correlation with the MIF gene, indicating the complexity of MIF signaling regulation. Three RBPs, TXNL4A, RPS26, and CARS, whose expression gradually increases with disease progression (Figure 4(i), Figure S4h), were specifically associated with CD74 activation. Of particular interest is CARS, and TCGA analysis reveals a significant correlation between its high expression and poor prognosis (Figure 4(j)), suggesting that CARS may promote CD74 expression in epithelial cells, thus facilitating tumor cell development. In T cells, the expression of CORO1A increases gradually, especially in cycling T cells and naive CD8T cells (Figure 4(k)), showing a significant correlation with CD74 expression. TCGA analysis indicates that high expression of CORO1A is associated with better prognosis (Figure 4(l)), suggesting that CORO1A plays a positive role in anti-tumor response in T cells. These findings provide insight into the upstream RBP regulatory factors of MIF signaling activation in different cell types during the pre-cancerous stage, offering clues for precision therapy.
Discussion
RBPs have attracted growing attention in HNSC research due to their significant role in regulating critical aspects of cell function during cancer initiation, development, and metastasis. 36 However, current research on RBPs in HNSC is primarily limited to analyzing whole tissue samples or mixed cell populations, lacking a comprehensive exploration of RBPs at the single-cell level. In this study, we comprehensively investigated the expression patterns and regulatory roles of RBPs during HNSC progression, encompassing normal tissue, precancerous leukoplakia, primary cancer, and metastatic tumors. Through single-cell transcriptome analysis, we revealed distinct cell-specific RBP expression patterns that dynamically changed during disease advancement. We identifed RBPs associated with HNSC progression and predict their functions and prognostic relevance in epithelial cells, fibroblasts, and T cells. Notably, we observed that RBPs in fibroblasts underwent progressive dysfunction, particularly in pathways related to extracellular matrix remodeling and actin filament processes, which are closely associated with cancer progression. Moreover, we found heterogeneity in the regulation of the macrophage migration inhibitory factor (MIF) signaling pathway by RBPs across different cell types during the precancerous stage. The identification of these RBPs provides potential therapeutic targets for cancer treatment and these findings shed light on the complex interplay of RBPs in different cell types and their impact on tumor development.
Previous studies have identified cell-specific RBPs that play crucial roles in various processes essential for proper protein expression. Dysregulation of RBPs has been linked to several clinical disorders. 19 For example, Nova-1, exclusively expressed in hindbrain and spinal cord neurons, acts as a regulator of neuronal alternative splicing and is implicated in the pathogenesis of the neurodegenerative syndrome paraneoplastic opsoclonus-myoclonus ataxia. 51 However, the mechanisms by which cell-specific RBPs influence protein expression patterns in their respective cell types remain poorly understood. In this study, we employed a method based on gene set expression patterns to cluster single cells and obtained RBP-based cell clusters in head and neck cancer. The cells within the same cluster exhibited similar RBP expression patterns, indicating strong cell specificity of RBPs. We identified cell-type-specific RBPs in HNSC tissues, suggesting their essential roles in maintaining normal cellular functions. Interestingly, most RBPs were detected across different cell types and stages, indicating that RBP cell specificity is not restricted to certain highly specific RBPs but rather represents a complex regulatory network of RBPs with cell-type-specific expression and regulation. Notably, as cancer progressed, the proportions of cell populations with different RBP expression patterns significantly changed, suggesting dynamic alterations in RBP expression during disease progression. These abnormal changes in RBP expression may reflect both the cancer transformation process and the body's response and resistance to cancer. The cellular heterogeneity and cell-type-specific RBP expression patterns may provide valuable insights for further research into the functional and regulatory mechanisms of HNSC cells.
Recently, the rapid advancements in single-cell RNA sequencing have provided a novel perspective for unraveling cellular heterogeneity and understanding the dynamic changes of molecular regulatory networks over time and space in specific cells.52–54 Some studies have utilized single-cell techniques to investigate the functions of certain genes in cancer development, such as m6A regulatory factors, 55 iron death-related genes, 56 autophagy-related genes, 57 among others. To our knowledge, this is the first study to systematically investigate the role of RBPs in HNSC development at the single-cell level. By focusing on epithelial cells, fibroblasts, and T cells, we identified RBPs associated with HNSC progression and predicted their functions and prognostic relevance. To ensure the validity of our prognostic model, we performed cross-validation using the TCGA dataset and further validated the model externally with the CPTAC dataset. These additional validations confirm the model's robustness and its potential applicability in predicting patient outcomes in HNSC. For instance, we observed significantly reduced expression of CELF2 begin from precancerous leukoplakia in epithelial cells. CELF2 plays a critical role in normal cellular function by regulating RNA processing and stability, thereby exerting essential control over gene expression. 58 CELF2 is reported as a tumor suppressor and be associated with tumor cell growth, migration, and invasion,42,59 with our analysis revealing its relevance to extracellular matrix remodeling and cell adhesion.
For fibroblasts cells, our analysis reveals that RBP-based cell clusters fR4, fR5, and fR10 are all enriched in extracellular matrix remodeling and cell migration pathways. However, it is worth noting that fR4 shows a gradual and significant increase in proportion as the disease progresses, especially in primary HNSC and metastatic stages, compared to fR5 and fR10. This suggests that while all three clusters are involved in similar biological processes, fR4 appears to play a more pivotal role in tumor development and progression. Furthermore, we identified two genes, CFL1 and PFN1, which are closely related to cellular cytoskeleton remodeling and cell motility,60–62 significantly upregulated in fibroblasts of precancerous leukoplakia and tumor. These genes may enhance actin polymerization and depolymerization, leading to cytoskeletal remodeling and increased cell motility. Enhanced cell motility in fibroblasts plays a crucial role in cancer invasion, metastasis, and angiogenesis processes. 63 Understanding the intricate interplay between RBPs and cellular processes in the tumor microenvironment will pave the way for developing more precise and effective strategies for cancer treatment.
The tumor microenvironment plays a crucial role in cancer development, with complex interactions among epithelial cells, fibroblasts, and T cells influencing carcinogenesis. 64 Cell communication analysis revealed an increased number of intercellular interactions in the leukoplakia stage, particularly between fibroblasts and epithelial cells, indicating the heightened complexity of interactions in the pre-cancerous microenvironment. Notably, the MIF signaling pathway showed specific upregulation in the leukoplakia group, with MIF and CD74 genes significantly upregulated in multiple cell types. The MIF-CD74 interaction plays a dual role in immune response regulation and tumor development.49,50 To identify RBPs associated with MIF signaling activation, we performed co-expression analysis and identified specific RBPs, such as TXNL4A, RPS26, CARS, and CORO1A, associated with CD74 activation in epithelial cells and T cells. Particularly, CARS may promote CD74 expression and facilitate tumor cell development, while CORO1A may play a positive role in anti-tumor response in T cells. CARS, also known as cysteinyl-tRNA synthetase 1, is a critical component of tRNA function and has been implicated in the pathogenesis of inflammatory myofibroblastic tumors 65 and kidney cancer. 66 CORO1A, or Coronin-1A, is a key regulator of actin dynamics in T cells, crucial for T cell homeostasis and activation of autoantigen-specific T cells. 67 Overall, our findings shed light on the heterogeneity of RBP-mediated regulation of the MIF signaling pathway in different cell types during the pre-cancerous stage. These results provide potential targets for precision therapy and deepen our understanding of the complex interactions within the tumor microenvironment that impact cancer progression and immune responses. Further investigation into the functions and mechanisms of these RBPs is warranted for the development of effective therapeutic strategies for cancer treatment.
We acknowledge several limitations in our study. First, scRNA-seq datasets typically have limited sample sizes and are subject to technical noise, which may impact the resolution of certain cell populations and their associated RBP expression patterns. Moreover, although we utilized multiple datasets for validation, experimental verification at the cellular and tissue levels was limited due to sample availability, which restricts the immediate clinical applicability of our findings. Additionally, while we identified key RBPs and proposed their involvement in HNSC progression, further functional studies are needed to confirm their roles and therapeutic potential. Future research should focus on validating these RBPs in larger clinical cohorts and performing functional experiments to elucidate their precise mechanisms of action in HNSC development.
In conclusion, this study reveals the critical roles and regulatory mechanisms of RBPs during HNSC progression in single-cell level, offering new insights for HNSC early diagnosis and treatment. These findings are of great significance for a deeper understanding of HNSC pathogenesis and the search for novel therapeutic targets, as well as providing opportunities for personalized treatment and precision medicine. We believe that our research results will contribute to advancing HNSC therapy, providing more hope for the recovery and survival of patients.
Supplemental Material
sj-docx-1-cbm-10.1177_18758592251328172 - Supplemental material for Stepwise single-cell data identifies RNA binding proteins associated with the development of head and neck cancer and tumor microenvironment remodeling
Supplemental material, sj-docx-1-cbm-10.1177_18758592251328172 for Stepwise single-cell data identifies RNA binding proteins associated with the development of head and neck cancer and tumor microenvironment remodeling by Bin Yang, Wei Sun, Ping Peng and Dongbo Liu in Cancer Biomarkers
Supplemental Material
sj-xlsx-2-cbm-10.1177_18758592251328172 - Supplemental material for Stepwise single-cell data identifies RNA binding proteins associated with the development of head and neck cancer and tumor microenvironment remodeling
Supplemental material, sj-xlsx-2-cbm-10.1177_18758592251328172 for Stepwise single-cell data identifies RNA binding proteins associated with the development of head and neck cancer and tumor microenvironment remodeling by Bin Yang, Wei Sun, Ping Peng and Dongbo Liu in Cancer Biomarkers
Footnotes
Acknowledgments
The authors would like to thank Chao Cheng and Qingqing Yin (Center for BioBigData Analysis, Wuhan Biosalt Biotechnology Co., Ltd, Wuhan, Hubei, China) for their guidance during data analysis.
Author contributions
Conception: BY and DL
Interpretation or analysis of data: WS and PP
Preparation of the manuscript: BY, WS and DL
Revision for important intellectual content: BY and DL
Supervision: DL
Funding
This study is supported by grant from National Natural Science Foundation of China (81904019).
Declaration of conflicting interests
The authors declared no potential conflicts of interest with respect to the research, authorship, and/or publication of this article.
Supplemental material
Supplemental material for this article is available online.
References
Supplementary Material
Please find the following supplemental material available below.
For Open Access articles published under a Creative Commons License, all supplemental material carries the same license as the article it is associated with.
For non-Open Access articles published, all supplemental material carries a non-exclusive license, and permission requests for re-use of supplemental material or any part of supplemental material shall be sent directly to the copyright owner as specified in the copyright notice associated with the article.