Molecular target therapy has become a hot spot in cancer treatment, finding effective targets for diffuse large B cell lymphoma (DLBCL) is an urgent problem.
OBJECTIVE:
To detect the expression level of C-C motif chemokine ligand 18 (CCL18) in DLBCL and clarify its potential role in the progression of DLBCL.
METHODS:
Gene expression datas of DLBCL were obtained from TCGA and GEO databases. The relationship between CCL18 and clinicopathologic information of DLBCL was assessed using meta-analysis method. Then we conducted bioinformatics analysis to uncover the biological function of CCL18 and its co-expression genes. Immunohistochemistry was applied to detect expression of CCL18 in DLBCL and reactive hyperplasia lymphoid tissues.
RESULTS:
The expression of CCL18 in DLBCL was higher than negative control group. The levels of CCL18 were distinct in different molecular subtypes and ages, and patients with higher level of CCL18 had a shorter overall survival than those with lower level. CCL18 and its co-expression genes were enriched in biological function such as cell proliferation, migration, apoptotic, and correlated with NF-B, pathway in cancer, PI3K-AKT pathway.
CONCLUSIONS:
CCL18 was up-regulated in DLBCL and related to poor prognosis. CCL18 may act as a valuable target for diagnosis and treatment of DLBCL.
Diffuse large B cell lymphoma (DLBCL), accounts for about 30 40% of adult non-Hodgkin lymphoma (NHL), is the most common type of NHL [1]. According to the 2017 America cancer statistics, the morbidity of NHL ranges the 7th in malignant tumor, meanwhile, mortality ranges the 9th [2]. With the first-line chemotherapy R-CHOP application in treatment, nearly 40 60% patients with DLBCL have significant better outcomes [3], but for patients those relapse or are insensitive to treatment, seeking novel therapy is of great importance. Over the years, molecular target therapy has become a spotlight in tumor treatment, multiple target drugs have achieved remarkable effects in clinic [4, 5]. For instance, Sorafenib prolong lifetime of hepatocellular carcinoma patients via targeting Raf/MAPK/ERK signaling pathway, it also shows strong inhibitory activity against VEGFR and PDGFR [6]. Breast cancer patients with HER2-positive expression gain longer survival time and improvement of 5-year survival from trastuzumab (anti-HER2 drug) [7]. Therefore, searching for effective molecular target of DLBCL should be put on the agenda.
C-C motif chemokine ligand 18 (CCL18) locates on human 17th chromosome (https://www.ncbi.nlm.nih.gov/gene/6362), mainly secreted by macrophagocytes, monocytes and dendritic cells [8]. It regulates various immune cells, for instance, T cells, B cells and dendritic cells, and plays an unsubstitutable role in immune response [9]. A large number of researches show that CCL18 overexpresses in divers cancers like breast cancer, ovarian cancer and oral squamous cell carcinoma [10, 11, 12], moreover, correlates with tumor cells proliferation, invasion, transferation and angiogenesis [13]. Chen et al. found that CCL18 was highly expressed in prostate cancer, it promoted tumor growth and angiogenesis in vitro and vivo [14]. Miyake et al. disclosed that CCL18 was upregulated in bladder patients urine compared with healthy people [15]. Wu et al. detected the expression level of CCL18 in serum and certified that CCL18 was overexpressed in gastric cancer patients, besides, in connection with TNM stage [16]. In addition, CCL18 is also upregulated in childhood acute lymphoblastic leukemia [17]. However, the relationship between CCL18 and DLBCL remains ambiguous until now, furthermore, seldom research involved in it. Whether CCL18 contributes to the development of DLBCL, whether CCL18 can act as a diagnostic and therapeutic target or not, is still a mystery.
Materials and methods
Data sources
Gene expression data of 47 DLBCL cases was obtained from The Cancer Genome Atlas (TCGA) database (https://cancergenome.nih.gov). We also searched DLBCL gene expression datasets in Gene Expression Omnibus (GEO) database (https://www.ncbi.nlm.nih.gov/geo/), all datasets should meet the criteria as follows: (1) Detected CCL18 expression level. (2) Tissue samples. (3) Normal or reactive hyperplasia lymphoid tissues as control, or clinicopathological data of DLBCL patients is included in the datasets. Exclusion criteria: (1) Datasets do not provide sufficient data to calculate the standardized mean difference (SMD) and 95% confidence interval (95% CI). (2) Cellular samples. (3) Data do not distribute in Gaussian state.
Data process and procedures of meta-analysis
For CCL18 original expression values, we conducted log2 transformation, then data presented in Gaussian distribution after dropping out several maximum and minimum values based on each dataset’s condition. The datasets which did not contribute in normal state were excluded. Stata12.0 software was used to analyse the relationship between CCL18 and clinicopathological parameters of DLBCL: (1) We calculated SMD and 95% CI to analyze continuous data, test was utilized to evaluate the heterogeneity among included datasets, if there was no heterogeneity among researches ( 0.05, 50%), the data was pooled by fixed effect model. When heterogeneity existed, random effect model was utilized. (2) Sensitivity analysis was applied by wiping one single research out which generated heterogeneity to assess the influence of that study on the entire results, so as to evaluate the stability of the pooled results. (3) Publication bias was assessed via employing Begg’s funnel plot and Egger’s test. If the funnel plot was asymmetric, or 0.05, publication bias existed.
Co-expression genes and functional enrichment analysis
The function of genes is closely related with their co-expression genes [18]. We searched co-expression genes of CCL18 from Multi Experiment Matrix database (MEM) [19] (http://biit.cs.ut.ee/mem/index.cgi) and cBioPortal database (http://www.cbioportal.org). CCL18 and its co-expression genes were submitted to online tool of the Database for Annotation, Visualization and Integrated (DAVID, https://david.ncifcrf.gov) to perform Gene Ontology (Go) analysis and Kyoto Encyclopedia of Genes and Genomes (KEGG) pathway analysis [20]. STRING10.5 (https://string-db.org) was used to conduct the interaction of protein products of these genes [21].
Patients
The diagnosis and classification of DLBCL were based on the criteria of the 2008 WHO that include a combination of clinical findings, morphological assessment of tumor specimens and immunohistochemistry results. Patients were first diagnosed of DLBCL at the first affiliated hospital of Guangxi Medical University, China. Patients without sufficient clinical and laboratory data were excluded from this study. All samples were collected following institutional guidelines with informed consent in accordance with the Declaration of Helsinki. Forty-three DLBCL tissue samples with complete clinicopathological information from Jan 1st, 2014 to May 30th, 2017 were collected through operation. The patients in our study did not receive any chemotherapy, radiotherapy or related treatment before operation. These patients included 22 men and 21 women with a median age of 58 years (range 18 to 89). We collected their clinical characteristics including name, gender, age, molecular subtype, Ann Arbor stage, the number of extranodal localization, LDH level in serum, Eastern Cooperative Oncology Group (ECOG) performance status, and International Prognostic Index (IPI). Besides, we collected 36 cases of lymph node reactive hyperplasia, including 18 male and 18 female, median age was 56.5 years (range 19 to 83). This study was approved by the ethics committee of the first affiliated hospital of Guangxi Medical University, China.
Immunohistochemistry and evaluation criteria
Four-micrometer-thick sections were cut from paraffin-embedded tissues, deparaffinized with xylene and rehydrated. After submerging the slides into sodium citrate buffer (PH6.0) boiling 2.5 min for antigen retrieval, we utilized 3% Hydrogen peroxide for 15 min to quench endogenous peroxidase activity. After that, slides were incubated with polyclonal rabbit antibodies against CCL18 (Abcam, Cat: ab104867, at a dilution of 1:200) in 4C overnight. Secondary antibodies (ZSGB-BIO, Cat: pv-6000) were added to the slides incubating for 1 h at room temperature. Finally we used 3, 3’-diaminobenzidine (DAB) for color development, haematoxylin for counterstain, resin for mounting. Immunohistochemical staining was assessed by two pathologists independently, who were blind to the diagnosis and clinical information of patients. When there were controversies, the score would be reevaluated by both pathologists to reach a consensus. The percentage of positive-staining cell was scored into four grades: 0 for none, 1 for 25%, 2 for 25% to 50%, 3 for 50% to 75%, 4 for 75% [22]. The method to score staining intensity was as follows: 0 for negative, 1 for weakly staining, 2 for moderately staining, and 3 for strongly staining [14]. The final immunoreactivity scores were acquired by the multiplication of the percentage and the intensity score (0 to 12): 0 for negative, 1 to 4 for weakly positive, 5 to 8 for moderately positive, and 9 to 12 for strongly positive expressed. The final score lower than 6 was defined low expression, on the contrary, high expression.
Statistical analysis
We applied Stata 12.0 software to conduct meta-analysis. SPSS 18.0 software was used for data analysis, T test was applied to measure the difference of CCL18 expression level between DLBCL and negative control group, while test was utilized to assess the relationship between CCL18 and clinicopathological characteristics of DLBCL patients. 0.05 was considered statistical significant for all text.
Results
Main information of the datasets
The original CCL18 expression values of 47 DLBCL cases with clinical information were downloaded from TCGA database, including gender, age, the number of extranodal involvement, tumor size, clinical stage, ECOG score, overall survival (OS) and progress free survival (PFS). Twenty-eight datasets in GEO database were included in our study referring to the criteria mentioned above. In these 28 datasets, 4 datasets had detected the expression of CCL18 in DLBCL compared with negative control group, 24 datasets contained clinicopathological data, while 11 datasets exhibited survival time of DLBCL patients (Table 1). The expression level of CCL18 in DLBCL and negative control tissues were shown in Fig. 1.
Main information of the included datasets from GEO database
GEO Accession
Platform
Country
DLBCL
Negative control
Clinicopathological parameters and follow-up
samples
camples
GSE56315
GPL570
Denmark
89
33
Subtype
GSE32018
GPL6408
Spain
22
13
GSE9327
GPL6011
Spain
36
8
GSE5051
GPL3443
Netherlands
30
3
Gender
GSE74266
GPL570
Denmark
62
0
Subtype, IPI
GSE64555
GPL570
UK
40
0
Subtype
GSE53786
GPL570
USA
119
0
Subtype, gender, age, ECOG score, clinical stage, number of extranodal involvement, OS
GSE44164
GPL96
Germany
32
0
Subtype, gender, age
GSE32918
GPL8432
UK
173
0
Subtype, gender, age, OS
GSE21849
GPL1708
Spain
29
0
OS, PFS
GSE23501
GPL570
USA
69
0
Subtype, IPI, gender, age, B symptom, OS, PFS
GSE19246
GPL570
USA
59
0
Subtype
GSE11318
GPL570
USA
172
0
Subtype, gender, age, clinical stage, number of extranodal involvement, OS
GSE4732
GPL3706
USA
252
0
Subtype, gender, age, ECOG score, clinical stage, number of extranodal involvement, OS
GSE84464
GPL6244
Germany
20
0
Subtype
GSE93986
GPL570
USA
88
0
Subtype, PFS
GSE87371
GPL570
France
223
0
Gender, age, clinical stage
GSE69053
GPL8432
UK
32
0
Age, OS
GSE69053
GPL14951
UK
150
0
Age, OS
GSE48097
GPL96
Germany
29
0
Subtype
GSE57612
GPL96
Germany
37
0
Subtype, gender, age, clinical stage, B symptom, OS
GSE31312
GPL570
USA
498
0
Subtype
GSE38202
GPL8432
South Korea
164
0
Gender, age
GSE22470
GPL96
Germany
271
0
Subtype, gender, age
GSE18376
GPL6244
USA
22
0
PFS
GSE19459
GPL9798
France
20
0
Gender, age
GSE16920
GPL7015
Japan
46
0
Gender, age, IPI
GSE10172
GPL96
Germany
14
0
Subtype, gender
The expression of CCL18 with Mean SD in DLBCL and negative control group. Red and green nodes represent for DLBCL and normal (or reactive hyperplasia) lymphoid samples, respectively. 0.01.
Meta-analysis
Molecular subtypes
In the basis of distinct gene expression profilings, DLBCL consists of three molecular subtypes: germinal center B cell like subtype (GCB), expressing normal germinal center B cells, has a higher overall survival rate than any other subtype; activated B cell like subtype (ABC), expressing genes characteristic of activated blood B cell, indicates poor prognosis; and type 3, similar outcome to ABC, which is undefined with heterogeneity [23]. ABC and type 3 are combined into non germinal center B cell like (non-GCB) subtype, in consideration of prognosis [24].
There are 17 datasets of GEO database had detected the subtypes of DLBCL patients. Significant heterogeneity was identified across the datasets ( 43.3%, 0.029), thus the data was pooled by random effect model. The pooled results indicated that in DLBCL, CCL18 expression was significantly higher in non-GCB subtype than that in GCB subtype (SMD 0.48, 95% CI: 0.34 to 0.62, 0.000) (Fig. 2A). Sensitivity analysis was to assess the stability of the pooled results by dropping out one dataset which was the most probable reason of the heterogeneity. In this case, GSE31312 was wiped out, but the pooled data was closed to the previous result (SMD 0.47, 95% CI: 0.31 to 0.62, 0.000), demonstrating that the results were stable. The publication bias was estimated by Begg’s funnel plot and Egger’s test. The funnel plot was approximately symmetric ( 0.564 in Begg’s test, 0.678 in Egger’s test) (Fig. 2B), suggesting that there was no publication of bias over all datasets.
A. Forest plot of CCL18 expression and subtype in DLBCL. B. Funnel plot of publication bias.
Gender
Fifteen datasets including 1 from TCGA database and 14 from GEO database had detected CCL18 expression in different gender DLBCL patients. There was no statistically significant heterogeneity across the included datasets ( 20.9%, 0.221). No distinction of CCL18 expressed in male and female DLBCL patients was found by fixed effect model (SMD 0.05, 95% CI: 0.05 to 0.15, 0.321) (Fig. 3A). We conducted sensitivity analysis by excluding GSE22470 datasets. The combined effect was closed to the result before exclusion, suggesting that the analysis was stable and believable (SMD 0.1, 95% CI: 0.01 to 0.2, 0.082). The Begg’s funnel plot and Egger’s test showed no evidence of publication bias ( 0.299 with Begg’s test, 0.265 with Egger’s test) (Fig. 3B).
A. Forest plot of CCL18 expression and gender in DLBCL. B. Funnel plot of publication bias.
Age
Patients aged above 60 years is associated with poor prognosis in DLBCL, according to IPI. We collected 15 datasets from TCGA and GEO database that had detected DLBCL patients CCL18 level in different age groups ( 60 and 60). There was no heterogeneity among the datasets ( 0.0%, 0.752). The pooled analysis showed that expression level of CCL18 in DLBCL patients older than 60 was statistically significant higher than those under or equal to 60 (SMD 0.16, 95% CI: 0.06 to 0.26, 0.001) (Fig. 4A). We excluded GSE22470 datasets to reassess the summary effect. The result was equal to the analysis before exclusion, demonstrating that the conclusion was stable and convincing (SMD 0.13, 95% CI: 0.02 to 0.23, 0.019). The funnel plot ( 0.216) and Egger’s test ( 0.443) provided no evidence of publication bias (Fig. 4B).
A. Forest plot of CCL18 expression and age in DLBCL. B. Funnel plot of publication bias.
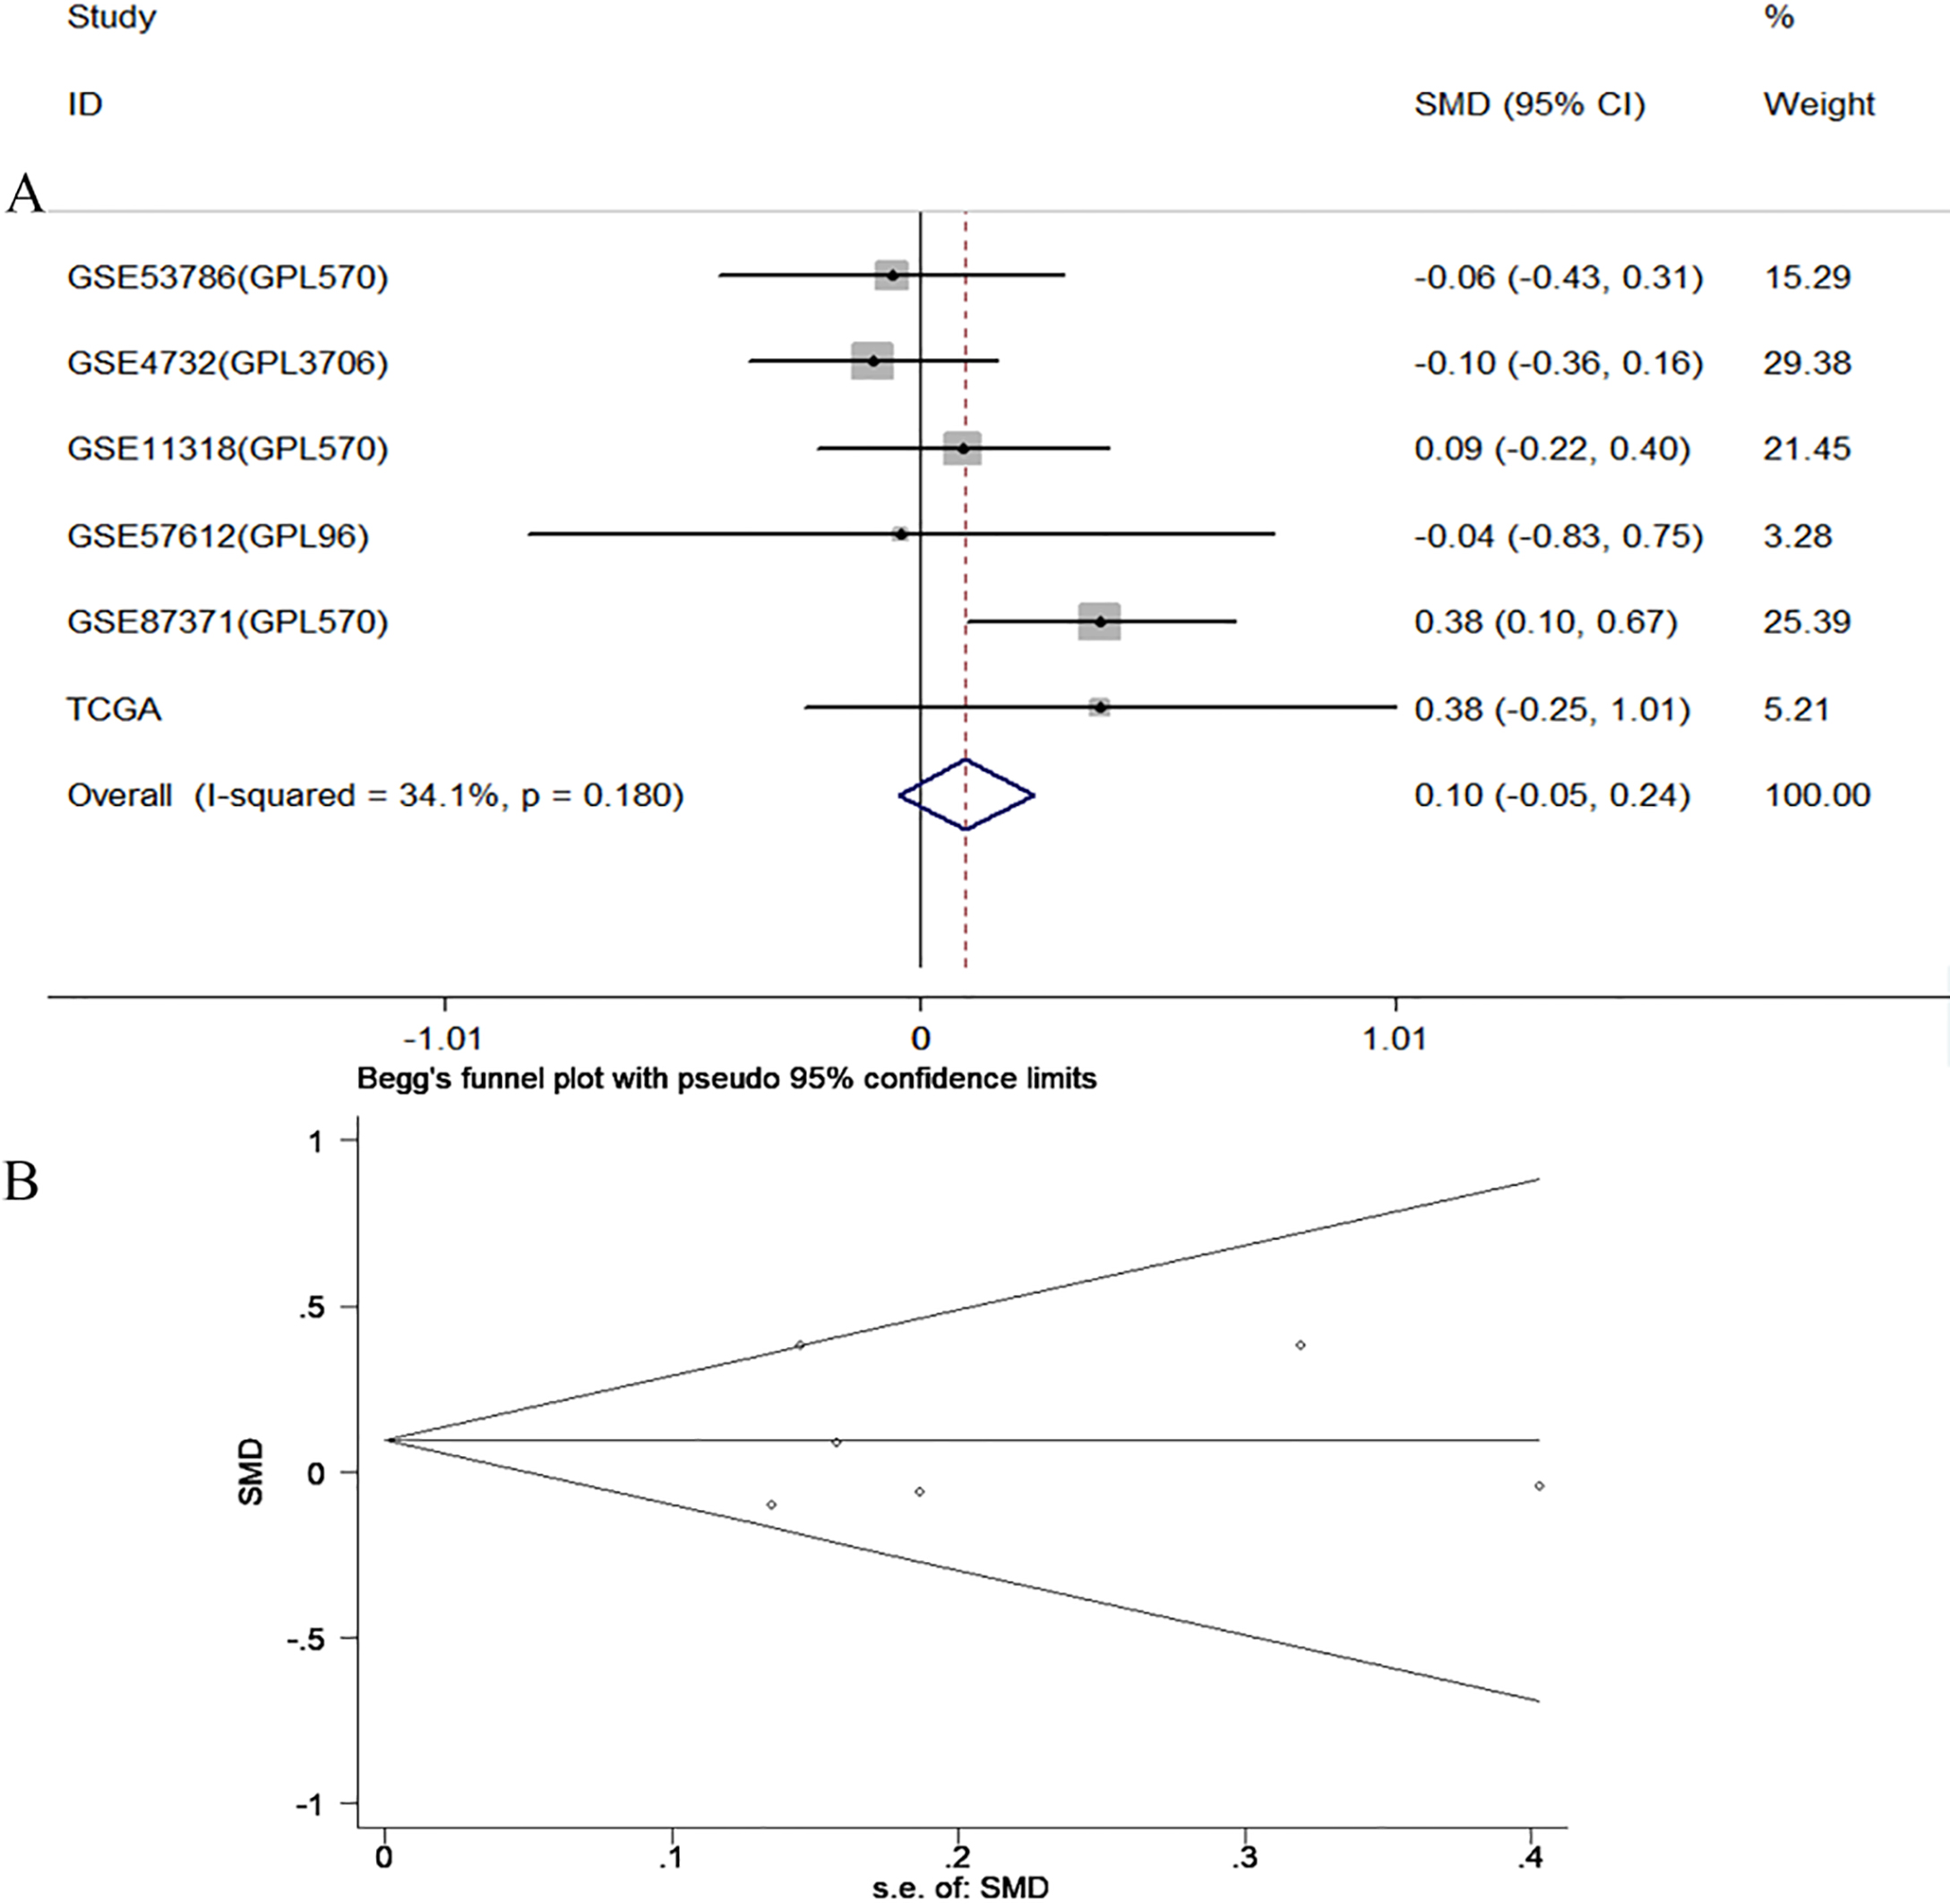
Clinical stage
Six datasets including 1 from TCGA database and 5 from GEO database had detected CCL18 expression in different clinical stage patients. There was no statistically significant heterogeneity across the included datasets ( 34.1%, 0.18). No distinction of CCL18 expressed in stage l II and stage III IV patients was found by fixed effect model (SMD 0.10, 95% CI: 0.05 to 0.24, 0.19) (Fig. 5A). We conducted sensitivity analysis by excluding GSE87371 datasets. The combined effect was closed to the result before exclusion, suggesting that the analysis was stable and believable (SMD 0, 95% CI: 0.17 to 0.16, 0.987). The Begg’s funnel plot and Egger’s test showed no evidence of publication bias ( 0.851 with Begg’s test, 0.875 with Egger’s test) (Fig. 5B).
A. Forest plot of CCL18 expression and clinical stage in DLBCL. B. Funnel plot of publication bias.
A. Forest plot of CCL18 expression and overall survival in DLBCL. B. Funnel plot of publication bias.
A. Forest plot of CCL18 expression and progress free survival in DLBCL. B. Funnel plot of publication bias.
Overall survival
Ten datasets from both databases were included for overall survival. The heterogeneity across the datasets was considered to be accepted ( 0.0%, 0.456), hence the fixed effect model was applied to pool the effect size. The combined effect exhibited that CCL18 overexpressed in DLBCL patients was related to poorer overall survival (HR 1.12, 95% CI: 1.04 to 1.20, 0.002) (Fig. 6A). We conducted sensitivity analysis by omitting GSE53786 datasets. There was little influence on the pooled data after exclusion (HR 1.14, 95% CI: 1.05 to 1.22, 0.001), demonstrating that the conclusion was credible and stable. The funnel plot ( 0.655) and Egger’s test ( 0.593) indicated no significant publication bias was found among datasets (Fig. 6B).
Progress free survival
Five datasets were included for progress free survival. The heterogeneity across the datasets was accepted (I 0.0%, 0.585), therefore the fixed effect model was applied to pool the effect size. The combined effect showed that expression of CCL18 in DLBCL patients had no significant influence on progress free survival time (HR 1.14, 95% CI: 0.92 to 1.40, 0.228) (Fig. 7A). We conducted sensitivity analysis by omitting GSE23501 datasets. There was little influence on the pooled data after exclusion (HR 1.06, 95% CI: 0.08 to 1.41, 0.684), demonstrating that the conclusion was credible and stable. The funnel plot ( 0.624) and Egger’s test ( 0.457) indicated no significant publication bias was found among datasets (Fig. 7B).
Other clinicopathological parameters
Other clinicopathological parameters like IPI, ECOG score, the number of extranodal involvement and B symptom were not further analysed with meta-analysis as there was little dataset involved.
A. Go enrichment analysis of CCL18 co-expression genes. B. KEGG pathway enrichment analysis of CCL18 co-expression genes.
Protein-protein interaction network of CCL18 and its co-expression genes.
Co-expression genes and functional enrichment analysis
Five thousand genes of both probeset (209924_AT, 32128_AT) in MEM database were identified associated with CCL18. These genes were overlapped with 20437 genes, which were retrieved by cBioPortal database. A total of 1049 genes that co-expressed with CCL18 were selected by this means.
GO and KEGG pathway enrichment analysis for the 1049 genes and CCL18 itself was performed using DAVID6.8. GO analysis showed that CCL18 related genes were enriched in functions such as immune response, inflammatory response, signal transduction, regulation of cell proliferation, positive regulation of cell migration, apoptotic process and positive regulation of angiogenesis (Fig. 8A). KEGG pathway analysis exhibited that these genes were significantly enriched in signaling pathways like Chemokine signaling pathway, Cytokine-cytokine receptor interaction, TNF, NF-B, pathway in cancer, Jak-STAT, PI3K-Akt and p53 signaling pathway (Fig. 8B). STRING10.5 was used to perform protein-protein interaction analysis. We selected 33 hub genes that interacted with 90 genes as center nodes of the interaction network (Fig. 9), and these genes were IL6, MAPK1, IL10, CD44, IFNG, PIK3CD, ITGAM, NFKB1, RHOA, PTPRC, PIK3CG, CD19, CCL2, LYN, CXCL12, ICAM1, IL1B, CSF2, JAK2, MMP9, IL8, CD40, ACTB, CCR7, MMP2, CALM1, ESR1, GNB1, PTGS2, HGF, ACTA2, CD79A and ITGAX.
Relationship between CCL18 expression and clinicopathological parameters in DLBCL
Clinical
CCL18 expression
-value
parameter
Low
High
expression (24)
expression (19)
Gender
Male
9 (40.9%)
13 (59.1%)
0.044
Female
15 (71.4%)
6 (28.6%)
Age
60 y
7 (36.8%)
12 (63.2%)
0.026
60 y
17 (70.8%)
7 (29.2%)
Subtype
Non-GCB
18 (54.5%)
15 (45.5%)
1.000
GCB
6 (60.0%)
4 (40.0%)
Tumor size
5 cm
11 (47.8%)
12 (52.2%)
0.258
5 cm
13 (65.0%)
7 (35.0%)
Extranodal localization
2
4 (36.4%)
7 (63.6%)
0.249
2
20 (62.5%)
12 (37.5%)
Ann Arbor stage
III IV
12 (50.0%)
12 (50.0%)
0.388
I II
12 (63.2%)
7 (36.8%)
B symptom
Yes
10 (52.6%)
9 (47.4%)
0.708
No
14 (58.3%)
10 (41.7%)
ECOG score
2
5 (41.7%)
7 (58.3%)
0.245
2
19 (61.3%)
12 (38.7%)
IPI
2
8 (44.4%)
10 (55.6%)
0.203
2
16 (64.0%)
9 (36.0%)
LDH (U/L)
245
14 (50.0%)
14 (50.0%)
0.294
245
10 (66.7%)
5 (33.3%)
Hb (g/L)
120
13 (50.0%)
13 (50.0%)
0.342
120
11 (64.7%)
6 (35.3%)
ESR (mm)
15
14 (48.3%)
15 (51.7%)
0.152
15
10 (71.4%)
4 (28.6%)
0.05.
Immunohistochemistry staining of CCL18 in reactive hyperplasia lymphoid tissues and DLBCL. A–C. Reactive hyperplasia lymph node (magnification X100, X200, X400, respectively). D–F. DLBCL (magnification X100, X200, X400, respectively).
Immunohistochemistry of CCL18 protein and its relationship with clinicopathological parameters in DLBCL
CCL18 was mainly positive expressed in the nucleus and cytoplasm. In 43 DLBCL cases, CCL18 was negative in one case (2.3%), weakly positive in 11 cases (25.6%), positive in 28 cases (65.1%), and strongly positive expressed in 3 cases (7.0%). Clinical information of 43 DLBCL patients was summarized in Table 2. While in 36 lymph node reactive hyperplasia cases, CCL18 was negative in one case (2.8%), weakly positive in 33 cases (91.6%), positive in 2 cases (5.6%), and strongly positive expressed in 0 case (Fig. 10). The expression of CCL18 in DLBCL was higher than in reactive hyperplasia lymphoid tissues ( 0.000), furthermore, higher in male DLBCL patients compared with female ( 0.044), higher in patients age 60 years than 60 ( 0.026). However, there were no statistically significant differences of CCL18 expression in subtypes, tumor sizes, numbers of extranodal involvement, B symptoms, ECOG scores and IPI ( 0.05).
Discussion
We extracted gene expression data of DLBCL from GEO and TCGA databases and found that CCL18 was distinctly expressed in DLBCL from negative control lymphoid tissues. The results of meta-analysis indicated that the expression level of CCL18 in DLBCL was significantly higher in non-GCB subtype than GCB, in aged 60 than 60 group, but there was no difference in genders and clinical stages. In addition, the overall survival time was shorter in high expression group than in low group. Non-GCB subtype usually indicates worse prognosis than GCB subtype [23], besides, according to IPI evaluation criteria, DLBCL patients aged above 60 is one of the factors that associated with poor prognosis. All of these suggest that high expression of CCL18 in DLBCL may be related to poor outcome.
To verify our assumption, we conducted functional enrichment analysis of CCL18 and its co-expression genes, and discovered these genes were enriched in a series of biological events like immune response, cell proliferation, cell migration and apoptosis, implying that CCL18 may play important role in DLBCL via affecting proliferation, migration and apoptosis of tumor cells. The results of pathway enrichment analysis indicated that CCL18 and its co-expression genes were strongly related to signaling pathways such as cytokine-cytokine receptor interaction, NF-B, pathway in cancer, Jak-STAT, PI3K-Akt, p53 signaling pathway and Epstein-Barr virus(EBV) infection. Sequential studies revealed that p53 is a pivotal tumor suppressor gene, additional Jak-STAT and PI3K-AKt signaling pathway are involved in functions such as cell proliferation, differentiation and apoptosis, while NF-B signaling pathway is tightly correlated with tumor development and metastasis. Researches showed that CCL18 promoted epithelial-mesenchymal transition through PI3K-AKT and NF-B signaling pathway in breast cancer [25], CCL18 and its receptor PITPNM3 induced tumor cells migration, invasion and epithelial-mesenchymal transition in hepatocellular carcinoma via NF-B signaling pathway [26]. Moreover, CCL18 enhanced the expression of MMP3 and accelerated tumor cells migration and invasion through NF-B pathway in gastric cancer [27]. Therefore, we speculated that CCL18 and its co-expression genes might regulate tumor growth and metastasis via these signaling pathways in DLBCL. Researches showed that 10% DLBCL patients with integrated immune system were accompanied by EBV infection [28], additional, CCL18 was closely in connection with serum EBV titers in nasopharyngeal carcinoma patients [29], whether CCL18 in DLBCL is associated with EBV infection, is still unclear.
PPI analysis formed interaction network of CCL18 and its related protein, 33 proteins such as IL6, MAPK1, IL10, PIK3CD, ITGAM, PIK3CG, CXCL12, ICAM1, MMP9, MMP2 and CALM1 served as the center nodes of the network. MAPK1 is a key protein kinase of MAPK/ERK signaling pathway, researches have verified that MAPK/ERK signaling pathway is involved in inflammatory response, cell proliferation, differentiation, apoptosis and transcription regula- tion [30, 31]. MAPK/ERK signaling pathway is relevant to multiple tumors, molecular drugs targeting MAPK/ERK signaling pathway have been applied to clinical treatment [32]. Furthermore, PIK3CD is one of the regulatory factors in PI3K-AKT signaling pathway, while MMPs are involved in tumor invasion and metastasis [33]. Therefore, we hypothesized CCL18 regulated the expression of MAPK1, PI3KCD, MMP2 and MMP9, and it regulated tumor cells proliferation, migration and invasion in DLBCL via NF-B, PI3K-AKT, MAPK/ERK and p53 signaling pathway.
Immunohistochemical staining further confirmed that CCL18 was upregulated in DLBCL, CCL18 was higher expressed in male patients than female, in patients aged 60 years than 60. But there was no statistically evidence of distinct expression in molecular subtypes, Ann Arbor stages, the number of extranodal involvement, ECOG scores and IPI, the reason may be deficiency in sample scale resulting in no significant difference. The sample scale needs to be enlarged to further validate our conclusion.
Bioinformatics methods shed light on the probable mechanism of CCL18 in the development of DLBCL, subsequently we will focus on experiments in vitro and vivo for deeper exploration.
Conclusions
In this study, we confirmed that the expression of CCL18 was upregulated in DLBCL patients, overexpression of CCL18 indicates poor outcome. CCL18 is expected to be a novel biological target of DLBCL for diagnosis and treatment.
Footnotes
Acknowledgments
We would like to thank the Promoting Project of Basic Capacity for University Young and Middle aged Teachers in Guangxi (No. 2017KY0091).
Conflict of interest
None.
References
1.
ZhongW.XuX.ZhuZ.DuQ.DuH.YangL.LingY.XiongH. and LiQ., Increased expression of IRF8 in tumor cells inhibits the generation of Th17 cells and predicts unfavorable survival of diffuse large B cell lymphoma patients, Oncotarget8 (2017), 49757–49772.
2.
SiegelR.L.MillerK.D. and JemalA., Cancer Statistics, 2017, CA Cancer J Clin67 (2017), 7–30.
3.
CuiW.ZhengS.LiuZ.WangW.CaiY.BiR.CaoB. and ZhouX., PIK3CA expression in diffuse large B cell lymphoma tissue and the effect of its knockdown in vitro, Onco Targets Ther10 (2017), 2239–2247.
4.
ShinJ.W. and ChungY.H., Molecular targeted therapy for hepatocellular carcinoma: current and future, World J Gastroenterol9 (2013), 6144–6155.
5.
SwainS.M.BaselgaJ.KimS.B.RoJ.SemiglazovV.CamponeM.CiruelosE.FerreroJ.M.SchneeweissA.HeesonS.ClarkE.RossG.BenyunesM.C. and CortesJ., Pertuzumab, trastuzumab, and docetaxel in HER2-positive metastatic breast cancer, N Engl J Med372 (2015), 724–734.
6.
WilhelmS.M.AdnaneL.NewellP.VillanuevaA.LlovetJ.M. and LynchM., Preclinical overview of sorafenib, a multikinase inhibitor that targets both Raf and VEGF and PDGF receptor tyrosine kinase signaling, Mol Cancer Ther7 (2008), 3129–3140.
7.
ArtemovA.AliperA.KorzinkinM.LezhninaK.JellenL.ZhukovN.RoumiantsevS.GaifullinN.ZhavoronkovA.BorisovN. and BuzdinA., A method for predicting target drug efficiency in cancer based on the analysis of signaling pathway activation, Oncotarget6 (2015), 29347–29356.
8.
AdemaG.J.HartgersF.VerstratenR.de VriesE.MarlandG.MenonS.FosterJ.XuY.NooyenP.McClanahanT.BaconK.B. and FigdorC.G., A dendritic-cell-derived C-C chemokine that preferentially attracts naive T cells, Nature387 (1997), 713–717.
9.
HectorA.KronerC.CarevicM.BakeleM.RieberN.RiethmullerJ.GrieseM.ZisselG. and HartlD., The chemokine CCL18 characterises Pseudomonas infections in cystic fibrosis lung disease, Eur Respir J44 (2014), 1608–1615.
10.
NaritaD.SeclamanE.UrsoniuS.IlinaR.CireapN. and AnghelA., Expression of CCL18 and interleukin-6 in the plasma of breast cancer patients as compared with benign tumor patients and healthy controls, Rom J Morphol Embryol52 (2011), 1261–1267.
11.
LaneD.MatteI.LaplanteC.Garde-GrangerP.CarignanA.BessetteP.RancourtC. and PicheA., CCL18 from ascites promotes ovarian cancer cell migration through proline-rich tyrosine kinase 2 signaling, Mol Cancer15 (2016), 58.
12.
JiangX.WangJ.ChenX.HongY.WuT.ChenX.XiaJ. and ChengB., Elevated autocrine chemokine ligand 18 expression promotes oral cancer cell growth and invasion via Akt activation, Oncotarget7 (2016), 16262–16272.
13.
WangH.LiangX.LiM.TaoX.TaiS.FanZ.WangZ.ChengB. and XiaJ., Chemokine (CC motif) ligand 18 upregulates Slug expression to promote stem-cell like features by activating the mammalian target of rapamycin pathway in oral squamous cell carcinoma, Cancer Sci108 (2017), 1584–1593.
14.
ChenG.LiangY.X.ZhuJ.G.FuX.ChenY.F.MoR.J.ZhouL.FuH.BiX.C.HeH.C.YangS.B.WuY.D.JiangF.N. and ZhongW.D., CC chemokine ligand 18 correlates with malignant progression of prostate cancer, Biomed Res Int2014 (2014), 230183.
15.
MiyakeM.RossS.LawtonA.ChangM.DaiY.MengualL.AlcarazA.GiacoiaE.G.GoodisonS. and RosserC.J., Investigation of CCL18 and A1AT as potential urinary biomarkers for bladder cancer detection, BMC Urol13 (2013), 42.
16.
WuJ.LiuX. and WangY., Predictive value of preoperative serum CCL2, CCL18, and VEGF for the patients with gastric cancer, BMC Clin Pathol13 (2013), 15.
17.
StruyfS.SchutyserE.GouwyM.GijsbersK.ProostP.BenoitY.OpdenakkerG.Van DammeJ. and LaureysG., PARC/CCL18 is a plasma CC chemokine with increased levels in childhood acute lymphoblastic leukemia, Am J Pathol163 (2003), 2065–2075.
18.
StuartJ.M.SegalE.KollerD. and KimS.K., A gene-coexpression network for global discovery of conserved genetic modules, Science302 (2003), 249–255.
19.
AdlerP.KoldeR.KullM.TkachenkoA.PetersonH.ReimandJ. and ViloJ., Mining for coexpression across hundreds of datasets using novel rank aggregation and visualization methods, Genome Biol10 (2009), R139.
20.
HuangD.W.ShermanB.T. and LempickiR.A., Systematic and integrative analysis of large gene lists using DAVID bioinformatics resources, Nat Protoc4 (2009), 44–57.
21.
JensenL.J.KuhnM.StarkM.ChaffronS.CreeveyC.MullerJ.DoerksT.JulienP.RothA.SimonovicM.BorkP. and von MeringC., STRING 8 – a global view on proteins and their functional interactions in 630 organisms, Nucleic Acids Res37 (2009), D412–416.
22.
SatoY.InokuchiM.TakagiY.OtsukiS.FujimoriY.YanakaY.KobayashiK.HiguchiK.KojimaK. and KawanoT., Relationship between expression of IGFBP7 and clinicopathological variables in gastric cancer, J Clin Pathol68 (2015), 795–801.
23.
AlizadehA.A.EisenM.B.DavisR.E.MaC.LossosI.S.RosenwaldA.BoldrickJ.C.SabetH.TranT.YuX.PowellJ.I.YangL.MartiG.E.MooreT.HudsonJ., Jr.LuL.LewisD.B.TibshiraniR.SherlockG.ChanW.C.GreinerT.C.WeisenburgerD.D.ArmitageJ.O.WarnkeR.LevyR.WilsonW.GreverM.R.ByrdJ.C.BotsteinD.BrownP.O. and StaudtL.M., Distinct types of diffuse large B-cell lymphoma identified by gene expression profiling, Nature403 (2000), 503–511.
24.
RosenwaldA.WrightG.ChanW.C.ConnorsJ.M.CampoE.FisherR.I.GascoyneR.D.Muller-HermelinkH.K.SmelandE.B.GiltnaneJ.M.HurtE.M.ZhaoH.AverettL.YangL.WilsonW.H.JaffeE.S.SimonR.KlausnerR.D.PowellJ.DuffeyP.L.LongoD.L.GreinerT.C.WeisenburgerD.D.SangerW.G.DaveB.J.LynchJ.C.VoseJ.ArmitageJ.O.MontserratE.Lopez-GuillermoA.GroganT.M.MillerT.P.LeBlancM.OttG.KvaloyS.DelabieJ.HolteH.KrajciP.StokkeT. and StaudtL.M., The use of molecular profiling to predict survival after chemotherapy for diffuse large-B-cell lymphoma, N Engl J Med346 (2002), 1937–1947.
25.
LinX.ChenL.YaoY.ZhaoR.CuiX.ChenJ.HouK.ZhangM.SuF.ChenJ. and SongE., CCL18-mediated down-regulation of miR98 and miR27b promotes breast cancer metastasis, Oncotarget6 (2015), 20485–20499.
26.
LinZ.LiW.ZhangH.WuW.PengY.ZengY.WanY.WangJ. and OuyangN., CCL18/PITPNM3 enhances migration, invasion, and EMT through the NF-kappaB signaling pathway in hepatocellular carcinoma, Tumour Biol37 (2016), 3461–3468.
27.
HouX.ZhangY. and QiaoH., CCL18 promotes the invasion and migration of gastric cancer cells via ERK1/2/NF-kappaB signaling pathway, Tumour Biol37 (2016), 641–651.
28.
RoschewskiM. and WilsonW.H., EBV-associated lymphomas in adults, Best Pract Res Clin Haematol25 (2012), 75–89.
29.
HuangD.SongS.J.WuZ.Z.WuW.CuiX.Y.ChenJ.N.ZengM.S. and SuS.C., Epstein-Barr Virus-Induced VEGF and GM-CSF Drive Nasopharyngeal Carcinoma Metastasis via Recruitment and Activation of Macrophages, Cancer Res77 (2017), 3591–3604.
30.
ZhaoJ.LiL. and PengL., MAPK1 up-regulates the expression of MALAT1 to promote the proliferation of cardiomyocytes through PI3K/AKT signaling pathway, Int J Clin Exp Pathol8 (2015), 15947–15953.
31.
YiweiT.HuaH.HuiG.MaoM. and XiangL., HOTAIR Interacting with MAPK1 Regulates Ovarian Cancer skov3 Cell Proliferation, Migration, and Invasion, Med Sci Monit21 (2015), 1856–1863.
32.
BurottoM.ChiouV.L.LeeJ.M. and KohnE.C., The MAPK pathway across different malignancies: a new perspective, Cancer120 (2014), 3446–3456.
33.
GialeliC.TheocharisA.D. and KaramanosN.K., Roles of matrix metalloproteinases in cancer progression and their pharmacological targeting, FEBS J278 (2011), 16–27.