
Abstract
Colorectal cancer is a very common cancer worldwide. Serum tumor-associated autoantibodies (TAAbs), especially the anti-p53 autoantibody, may be promising biomarkers to detect early-stage colorectal cancer. This study aimed to identify all known autoantibodies and their value in colorectal cancer diagnosis, as well as exploring the underlying connections and mechanisms through a bioinformatics analysis. Databases were used to select available articles of TAAbs in colorectal cancer. In a meta-analysis of the anti-p53 autoantibody, the diagnostic odds ratio and area under the curve (AUC) of the summary receiver-operating characteristic (SROC) curve were calculated using Stata 12.0 and Meta-Disc 1.4. We identified 73 articles including 199 single autoantibodies and 42 multiple autoantibodies. The maximum value of Youden’s index was 0.76, combining c-MYC, p53, cyclin B1, p62, Koc, IMP1, and survivin. The diagnostic odds ratio for anti-p53 autoantibody at all stages was 10.86 (95% CI 8.40, 14.06) with low heterogeneity (I2 = 40.3%) and the AUC of the SROC curve was 0.82. For the anti-p53 autoantibody in early-stage colorectal cancer, the diagnostic odds ratio was 4.82 (95% CI 2.95, 7.87) with heterogeneity (I2 = 7.9%) and the AUC of the SROC curve was 0.72. Eighty-seven autoantibodies were selected for bioinformatics analyses. We found that the most enriched functional terms and protein–protein interactions may relate to the mechanism of autoantibody generation. In summary, our study summarized the diagnostic value of TAAbs in colorectal cancer, either as single molecules or in combination. Bioinformatics analyses may be a new approach to explore the mechanism of autoantibody generation.
Introduction
Colorectal cancer (CRC) ranks third in terms of incidence but second in terms of mortality. 1 In men and women combined, the death rate has dropped by 51% at its peak of 28.6 per 100,000 in 1976 to 14.1 per 100,000 in 2014. Reductions in mortality are attributed to improvements in treatment (12%), changing patterns in CRC risk factors (35%), and screening uptake (53%). 2 In the European Group on Tumour Markers (EGTM) guidelines for the use of biomarkers in gastrointestinal cancer for screening of colorectal cancer, preoperative carcinoembryonic antigen (CEA) levels may be combined with clinical and histopathological criteria in determining prognosis in patients with newly diagnosed CRC. CEA and carbohydrate antigen 19-9 have an important role in monitoring the recurrence of disease, but they are not recommended for use as early biomarkers because of their low sensitivity and specificity. Genetic-based screening methods such as mRNA expression, gene mutations, or aberrantly methylated genes present in stool or body fluid samples have emerged and are changing CRC detection approaches. In October 2014, a non-invasive stool-based DNA test from Exact Sciences (Cologuard) for average-risk patients became the first US Food and Drug Administration (FDA)-approved test to be eligible for reimbursement. This test evaluates the presence of blood and DNA in a patient’s stool sample, which may be indicative of precancerous or cancerous polyps. However, it detects fewer than half of all large advanced adenomas (42%). 3
The presence of autoantibodies precedes clinical findings by months or even years. 4 The anti-p53 autoantibody was detected as early as 17–47 months prior to clinical tumor manifestation in uranium workers at high risk of lung cancer development. Furthermore, autoantibodies may be valuable biomarkers as they are stable serological proteins that are expressed at high levels in serum despite low levels of the corresponding antigen. CRC has the second highest anti-p53 autoantibody sero-positivity rates due, in part, to the high frequency of TP53 mutations. 5 Panels of autoantibodies with the anti-p53 autoantibody are considered to have greater application value with high sensitivity and specificity. 6 However, no detailed systematic review and meta-analysis has been performed to evaluate the diagnostic accuracy of autoantibodies in CRC. Although there are innumerable studies exploring their underlying value as biomarkers, the mechanisms of autoantibody generation remain unknown.
In this study, we first extensively searched for autoantibody studies conducted on CRC. Then, relevant information for the anti-p53 autoantibody regarding the diagnostic odds ratio (DOR), and area under curve (AUC) of the summary receiver-operating characteristic (SROC) curves were analyzed. Bioinformatics analyses—as a new method—were undertaken to analyze the corresponding genes and proteins of autoantibodies to reveal their underlying connections.
Methods
Search strategy
We performed a comprehensive search of all eligible literature using PubMed, EMBASE, the Cochrane library, and Web of Science databases until 11 January 2018. The following combination of terms was used: [colorectal (or) colon (or) rectum] (and) [cancer (or) neoplasm (or) carcinoma (or) adenoma (or) malignancy] (and) [autoantibodies (or) antibodies (or) immunoglobulin] (and) [detection OR diagnosis OR screen OR screening OR biomarker OR marker] (and) [serum carried (or) blood (or) plasma]. Related or additional articles were also identified by manual searches to ensure that all relevant articles were included. When the search was complete, duplicate articles were deleted.
Study selection
Studies that met the following criteria were included in our systematic review: (a) participants were evaluated for the presence of serum autoantibodies or antibodies; (b) studies provided both the sensitivity and specificity of the levels of mixed autoantibodies for the diagnosis of CRC; and (c) studies included a cancer-free group or information regarding a control group. Studies were excluded if they were: (a) conference abstracts and letters to journal editors; (b) reviews, meta-analyses, or proceedings; (c) studies concerning the function of autoantibodies in animal models; (d) studies with small sample sizes (n < 10) to avoid selection bias; and (e) studies without full texts available.
Data extraction and quality assessment
Two reviewers extracted the following information: first author, year of publication, location, autoantibodies, number of patients, test methods, cut-off value or AUC, and evaluation indexes (sensitivity, specificity).
The Quality Assessment of Diagnostic Accuracy Studies (QUADAS-2) was used to assess the quality of studies for the meta-analysis. 7 This tool comprises four domains: patient selection, index test, reference standard, and flow and timing. Answers of “yes,” “no,” or “unclear” were given to each study. Only answers of “yes” were assigned a score.
Functional enrichment analysis
The genes of 92 corresponding non-repetitive autoantibodies were screened out for functional enrichment analysis using Metascape (http://metascape.org). 8 Gene Ontology (GO) terms and Kyoto Encyclopaedia of Genes and Genomes (KEGG) pathways were enriched. Only terms with P-values of < 0.01 and the number of enriched genes ⩾ 3 were considered significant. All the resultant terms were grouped into clusters based on their similarities.
Integration of a protein–protein interaction network and module analysis
The STRING database is an online tool that can evaluate protein–protein interaction (PPI) information, and includes 18,838 human proteins with 25,914,693 core network interactions (STRING; https://string-db.org/). 9 Identified autoantibodies were imported into STRING. The PPI network was built using Cytoscape (http://www.cytoscape.org/). 10 In addition, higher-degree nodes were regarded as hub nodes. Sub-modules of the PPI network were analyzed by Molecular Complex Detection (MCODE; Version 1.5.1; Toronto, ON, Canada), with the criteria set as default.
Statistical analyses
Statistical analyses were undertaken utilizing Stata 12.0 (Stata Corp, College Station, TX, USA) and Meta-Disc 1.4 (Cochrane Colloquium, Barcelona, Spain). Diagnostic threshold effects were accessed by the Spearman rank correlation analysis. Heterogeneity was defined using the Cochrane-Q test (P < 0.05) and I2 index (I2 >50%). In the presence of significant heterogeneity, a random-effects model (DerSimonian-Laird) was used to calculate the pooled results. A fixed-effects model (Mantel-Haenszel) was used to calculate the pooled statistics if there was no statistical heterogeneity. The DOR and AUC with the corresponding 95% confidence interval (CI) were calculated using a bivariate binomial mixed model. Sensitivity analysis was conducted to assess the stability. Deeks funnel plot asymmetry analysis was performed to identify publication bias.
Results
Study selection and characteristics
A total of 6106 potentially relevant publications were identified by the first search of the four databases. According to the criteria, 73 articles were included in our systematic analysis (Figure S1). These included 199 single autoantibodies, which also encompassed some autoantibodies studied with high frequency (Table 1). We also collected multiple autoantibodies in 42 different combinations for CRC (Table 2).11-83 The research was mainly undertaken in China (n = 20) and the USA (n = 12), with the remainder in Japan, Germany, Spain, and elsewhere. The sample size of the populations with CRC ranged from 13 to 1068. Patients’ ages ranged from 21 to 95. The autoantibodies studied in more than three different trials were p53, MUC1, c-MYC, survivin, ANXA, CEA, and p62.
Studies on the single TAAbs in CRC.
AS: all stage; BD: benign disease; CRC: colorectal cancer; EIA: enzyme immunoassay; ELISA: enzyme-linked immunosorbent assay; ES: early stage; NH: normal healthy control; QUADAS: diagnostic accuracy studies; Ref: reference; SADA: serum antibody detection array; Se: sensitivity; SEREX: serological analysis of recombinant cDNA expression library; Sp: specificity; TAAbs: tumor-associated autoantibodies; WB: western blotting.
Studies on the multiple TAAbs in CRC.
AS: all stage; BD: benign disease; CRC: colorectal cancer; ES: early stage; NH: normal healthy control; QUADAS: diagnostic accuracy studies; Ref: reference; Se: sensitivity; Sp: specificity; TAAbs: tumor-associated autoantibodies.
Diagnostic value of single tumor-associated autoantibodies for any stage of CRC
A total of 199 individual autoantibodies were selected from 73 articles. The sensitivity ranged from 3.0% to 85.0%, with a mean of 24.0% and a median of 18.0%. The specificity ranged from 52.2% to 100%, with a mean of 94.2% and a median of 97.6%. When the sensitivity was < 50%, 173 single autoantibodies were selected with a mean of 17.9% and a median of 15.2%, but the specificity still ranged from 61.0% to 100% (mean, 96.4%; median, 98%). When sensitivity was not lower than 50.0%, with a mean of 63.9% and a median of 63.3%, the specificity ranged from 52.0% to 100% (mean, 79.4%; median, 80.5%).
Diagnostic value of multiple autoantibodies for patients at all stages of CRC
There were 42 test results for multiple autoantibodies from 19 articles. The sensitivity ranged from 15.5% to 88.0% (mean, 47.0%; median: 41.7%); at the same time, the specificity ranged from 71.4% to 100% (mean, 90.5%; median, 91.4%). The maximum value of the Youden index was 0.76 from an article combining c-MYC, p53, cyclin B1, p62, Koc, IMP1, and survivin, with a sensitivity of 88% and a specificity of 88%. A combination of multiple autoantibodies is a better choice to detect CRC than a single autoantibody.
Diagnostic value for early stages of CRC
The diagnostic value of a single autoantibody for early-stage CRC was assessed for 48 autoantibodies. The sensitivity was 4.0% to 100% (mean, 21.3%; median, 10.8%) and the specificity was 61.6% to 100% (mean, 94.1%; median, 98.0%). Sixteen combinations of autoantibodies were used to assess early-stage CRC. The sensitivity was 22.0% to 65.7% (mean, 42.0%; median, 40.5%) in early-stage CRC and the specificity was 80.0% to 95.0% (mean, 88.8%; median, 89.0%).
Meta-analysis for the anti-p53 autoantibody
The anti-p53 autoantibody was described 27 times. A study by Pedersen et al. 23 on the diagnosis value of p53 peptides was excluded because of huge heterogeneity. For the anti-p53 autoantibody in all stages, the Spearman rank correlation coefficient was 0.633 (P < 0.05), suggesting that there were diagnostic threshold effects. The best summary of study results is an ROC curve rather than a single pair of pooled indexes. Parameter b = 0.52 (P > 0.05) including the ROC curve was symmetrical. The DOR and AUC of the SROC were used in the meta-analysis using a fixed-effects model (Mantel-Haenszel). The DOR was 10.86 (95% CI 8.40, 14.06) with low heterogeneity (I2 = 40.3%) (Figure 1(a)). AUC of the SROC curve was 0.82 (Figure 1(b)). Sensitivity analysis was performed by eliminating studies one by one (Figure S2). The results showed that the studies by Fan et al. 12 and Müller et al. 27 accounted for 25.5% and 12.7% of the heterogeneity, respectively. When these two studies were removed, there was no heterogeneity (I2 = 0). The DOR was 11.01 (95% CI 8.15, 14.86) and the AUC of the SROC curve was 0.83 (Figure S3).
Forest plot of diagnostic odds ratio (DOR) (a) and summary receiver-operating characteristic (SROC) (b) for anti-p53 autoantibodies in all stage of colorectal cancer. Forest plot of DOR (c) and summary receiver-operating characteristic (SROC) (d) for anti-p53 autoantibodies in early stage of colorectal cancer.
For the anti-p53 autoantibody in early-stage disease, the Spearman rank correlation coefficient was 0.964 (P < 0.05) with parameter b = 0.15 (P > 0.05). The DOR and AUC were researched in the meta-analysis by a fixed-effects model. The DOR was 4.82 (95% CI 2.95, 7.87) with low heterogeneity (I2 = 7.9%) (Figure 1(c)). The AUC of the SROC curve was 0.72 (Figure 1(d)).
Publication bias
As shown in Deeks funnel plots (Figure S4), publication biases were likely absent with symmetrical funnel shapes. The P-values for the funnel plot asymmetry tests (P = 0.43, P = 0.79) indicated no evidence of publication bias.
Functional characterization of autoantibodies
In total, 87 genes were identified, among which 5 could not be identified, including F. nucleatum, HIPIR, KIAA1416, SSX-2, and TOPO48. The analysis was performed using Metascape, which was carried out with the four GO sources: KEGG Pathway, GO Biological Processes, Reactome Gene Sets, and CORUM. This analysis revealed that “bladder cancer” was the most significantly enriched functional cluster. This finding may illustrate the low specificity associated with autoantibodies. It was remarkable to find that the GO analysis revealed no association with inflammation. This may be the reason why autoantibodies could be biomarkers for cancers. “Cell cycle” may provide a new clue in the study of autoantibody generation. “Regulation of protein serine/threonine kinase activity” and “Regulation of cellular protein location” were consistent with the theory of abnormal protein localization. Molecules in canonical pathways were also related to the production of autoantibodies. The top 20 clusters of significantly enriched terms are shown in Figure 2.
Functional enrichment results: a network of top 20 clusters of enriched terms. Each node represents one enriched term colored by cluster ID, nodes share the same cluster are typically close to each other. Terms with Kappa similarity above 0.3 were connected. The thicker edge displayed, the higher the similarity is. The term with the best P-value was selected to represent each cluster; B heatmap of top 20 clusters, colored by P-values.
PPI network construction and module screening
The PPI network of corresponding to autoantibodies is presented in Figure 3(a). The network is composed of 83 nodes and 125 edges. Degrees > 2 were set as the cut-off criterion, from which nine genes were selected as hub genes. Hub nodes included TP53, MDM2, RAF1, MYC, CDKN1A, ERBB2, BIRC5, HRAS, and CDKN2A. The significant module with the highest score was selected using the plug-in MCODE program. This module included nine nodes and 34 edges (Figure 3(b)).
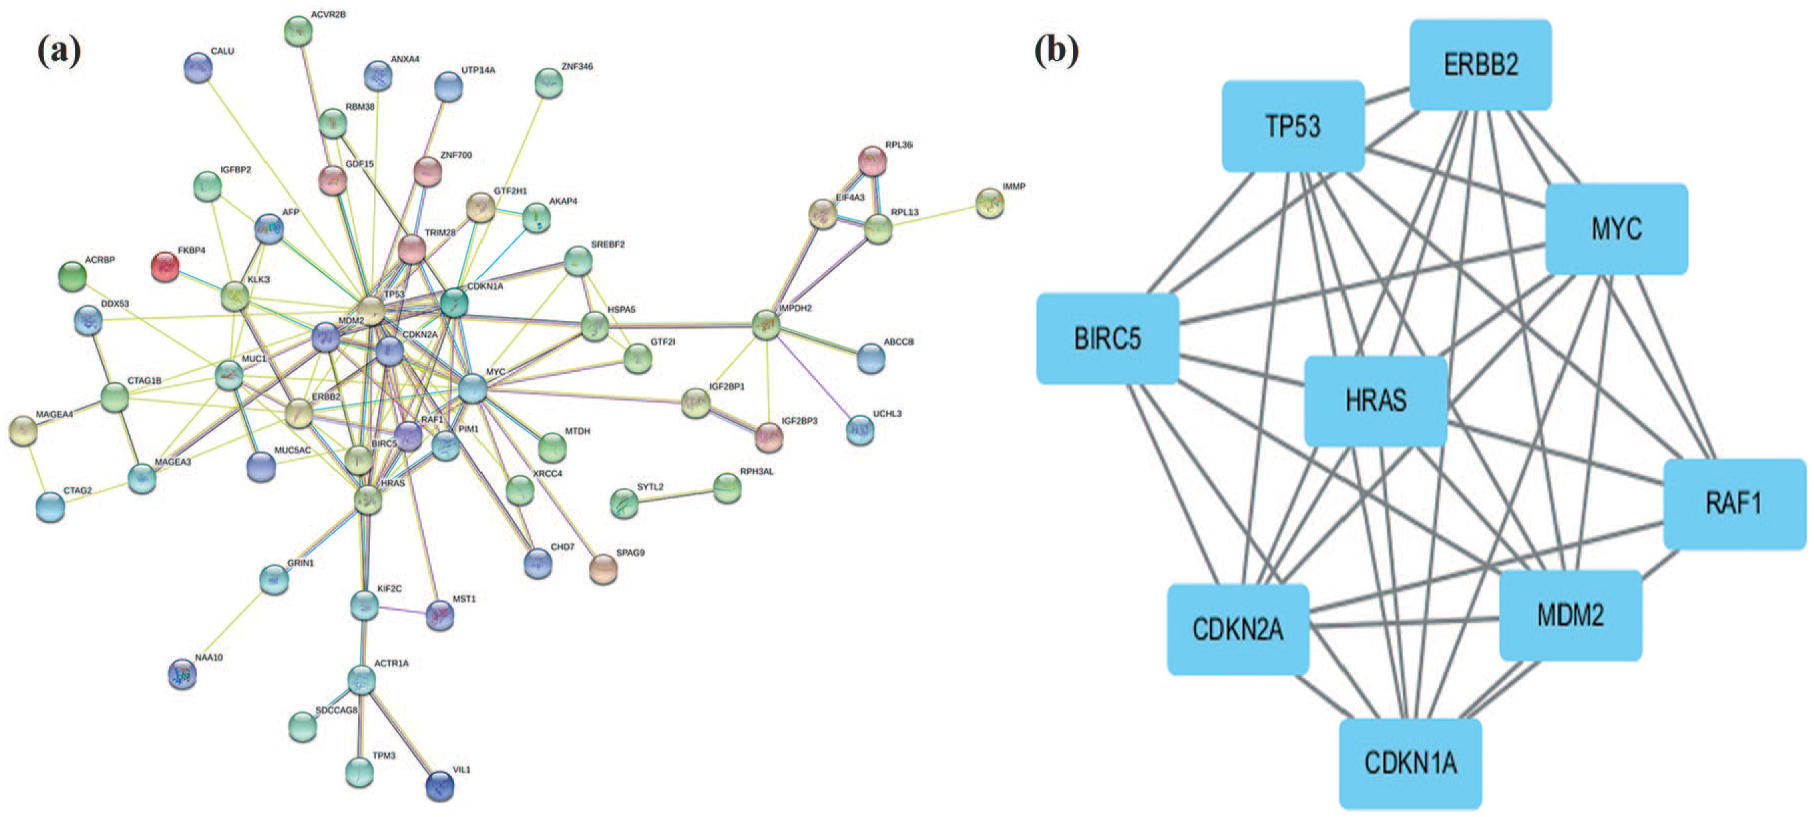
PPI network and hubs.
Discussion
Autoantibodies can be detected in sera from many kinds of cancers at the asymptomatic stage, so they usually serve as biomarkers for early cancer diagnosis. Many researchers devote themselves to the discovery of new autoantibodies, but some autoantibodies are limited in clinical practice because of their poor specificity and sensitivity. In our research, 199 single autoantibodies and 42 multiple autoantibodies were selected and analyzed. For a single autoantibody, the sensitivity and specificity are usually lower than that for an ideal cancer biomarker. The sensitivity ranged from 3.0% to 85.0%, while the specificity ranged from 52.2% to 100%. Combining multiple autoantibodies can elevate the sensitivity and specificity. The sensitivity ranged from 15.5% to 88.0%; at the same time, the specificity ranged from 71.4% to 100%.
In a review of the anti-p53 autoantibody, the researchers found that the anti-p53 autoantibody had low (13%–32%) sensitivity in CRC but was nearly 100% specific for malignancy. 6 In our research, the DOR was 10.86. The AUC of the SROC curve was 0.82. Two studies accounted for the heterogeneity, and when these were removed the DOR was 11.01 and the AUC of the SROC curve was 0.83. However, the diagnostic threshold effects could not be eliminated. The diagnostic methods varied between different studies, which included mean absorbance or levels of the autoantibodies in the control group plus two or three SD or maximum levels, ROC curve, and positive proportion. This is the main barrier to replicating the same autoantibody or comparing the different autoantibodies. For the anti-p53 autoantibody in early-stage CRC, the DOR was 4.82 and the AUC was 0.72. There may be a promising future role of the anti-p53 autoantibody in screening.
The production mechanism of autoantibodies is so complex that a large number of researchers have only studied their clinical application. In turn, the lack of a known mechanism limits the clinical application of autoantibodies. In our research, we attempted to identify a new approach to the study of these mechanisms. Bioinformatics can be used to rapidly analyze big data, and it can provide guidelines in medical research that can save money and time. We used databases and software to analyze the corresponding genes and proteins of all identified autoantibodies. The results showed that the gene functions and pathways may relate to the connections of generation. PPIs indicate a relationship between proteins that can provide clues when studying autoantibodies at the protein level.
Conclusion
Our study summarized and presented the diagnostic value of autoantibodies in CRC, either as single molecules or in combination. Bioinformatics analysis may be a new approach to explore the connections of autoantibody generation.
Supplemental Material
Figure_S1 – Supplemental material for Autoantibodies as biomarkers for colorectal cancer: A systematic review, meta-analysis, and bioinformatics analysis
Supplemental material, Figure_S1 for Autoantibodies as biomarkers for colorectal cancer: A systematic review, meta-analysis, and bioinformatics analysis by Hejing Wang, Xiaojin Li, Donghu Zhou and Jian Huang in The International Journal of Biological Markers
Supplemental Material
Figure_S2 – Supplemental material for Autoantibodies as biomarkers for colorectal cancer: A systematic review, meta-analysis, and bioinformatics analysis
Supplemental material, Figure_S2 for Autoantibodies as biomarkers for colorectal cancer: A systematic review, meta-analysis, and bioinformatics analysis by Hejing Wang, Xiaojin Li, Donghu Zhou and Jian Huang in The International Journal of Biological Markers
Supplemental Material
Figure_S3 – Supplemental material for Autoantibodies as biomarkers for colorectal cancer: A systematic review, meta-analysis, and bioinformatics analysis
Supplemental material, Figure_S3 for Autoantibodies as biomarkers for colorectal cancer: A systematic review, meta-analysis, and bioinformatics analysis by Hejing Wang, Xiaojin Li, Donghu Zhou and Jian Huang in The International Journal of Biological Markers
Supplemental Material
Figure_S4 – Supplemental material for Autoantibodies as biomarkers for colorectal cancer: A systematic review, meta-analysis, and bioinformatics analysis
Supplemental material, Figure_S4 for Autoantibodies as biomarkers for colorectal cancer: A systematic review, meta-analysis, and bioinformatics analysis by Hejing Wang, Xiaojin Li, Donghu Zhou and Jian Huang in The International Journal of Biological Markers
Footnotes
Declaration of conflicting interests
The author(s) declared no potential conflicts of interest with respect to the research, authorship, and/or publication of this article.
Funding
The author(s) disclosed receipt of the following financial support for the research, authorship, and/or publication of this article: The current study was supported by grants from the Nature Science Foundation of China (grant no. 81650014).
Supplemental material
Supplemental material for this article is available online.
References
Supplementary Material
Please find the following supplemental material available below.
For Open Access articles published under a Creative Commons License, all supplemental material carries the same license as the article it is associated with.
For non-Open Access articles published, all supplemental material carries a non-exclusive license, and permission requests for re-use of supplemental material or any part of supplemental material shall be sent directly to the copyright owner as specified in the copyright notice associated with the article.