
Abstract
This paper describes the development of the clinical indicators used in the Clinical Practice Improvement Network for Early Psychosis (CPIN-EP), an Australian multi-site evaluation of the effectiveness of services for patients presenting with a recent first-ever diagnosis of psychotic disorder. Implemented within a quality assurance framework, CPIN-EP was an observational cohort study that used audit methodology to examine the relationship between levels of clinical guideline adherence and effectiveness of the first six months of treatment of early psychosis (EP) patients.
The CPIN-EP measurement protocol was designed to build upon Consumer Outcome measurements mandated by the Australian Government for routine use in public mental health services nationally. This mandated protocol applies to all people receiving public mental healthcare and includes the Health of the Nation Outcome Scales (HoNOS) [1], the Life Skills Profile (LSP) [2], and a self-report consumer-rated questionnaire (either the K-10 [3], BASIS [4], or Mental Health Inventory [5]). Data collection occurs at the beginning and end of (and every three months during) an episode of care. CPIN-EP developed a number of clinical indicators based on indicator constructs first selected by EP clinicians in the state of New South Wales (NSW) for routine coding of EP patients in conjunction with the HoNOS and LSP.
Clinical indicators are indirect or partial measures that summarize or act as proxies for complex situations [6]. Elaborate research instruments are avoided in favour of using simple indicators, usually identifying the rate of occurrence of an event [7]. Indicators must have adequate inter-rater reliability, be applicable (meaningful assessments that typical clinicians can easily and quickly code in relevant real-world service settings), and yet validly capture the phenomenon being assessed [8]. The primary purpose of the CPIN-EP indicators was to flag, and characterize in a consistent manner across services, patients presenting for treatment for the first time with a psychotic disorder. They were not designed to code the nature and quality of early psychosis intervention (EPI). Herein, we describe procedures used in NSW to select indicator constructs, the subsequent operationalization of these constructs as clinical indicators for routine use by the CPIN-EP project, and the performance of the CPIN-EP training package supporting the introduction of these indicators into routine service settings.
Methods
Development of the EP indicators involved: 1) selecting and conceptually describing indicator constructs, 2) operationally transforming indicator definitions, and 3) designing and delivering an indicator training package that included inter-rater reliability assessment.
Selecting and conceptually describing early psychosis indicator constructs
In 1996 the NSW Early Psychosis Research and Evaluation Working Group was convened under the auspices of the NSW Director of Mental Health. The Working Group consisted of leading EP clinicians based in NSW interested in research and evaluation. In 1997 a survey of the small number of EPI programmes that existed at the time revealed high agreement across services about the domains of assessment that were considered relevant but showed considerable variation between services in rating instrumentation to assess these domains. In April 1999, after the number of active EP clinicians in NSW had increased, a second questionnaire was distributed to ask about the utility of outcome measures being used. All EP programmes found it necessary to use supplementary measurement to the HoNOS and LSP to assess outcome domains that were similar to those reported to be relevant in the 1997 survey. The Working Group then drafted an options paper to select and recommend by consensus a number of rating scales for each assessment domain. In December 1999 an unpublished draft recommending published research instruments only was released for comment, titled Evaluating Early Psychosis Intervention: A Users’ Guide (available on request).
In early 2000 the NSW Director of Mental Health requested that the Users’ Guide be prepared for publication but be expanded to describe 5 to 10 simple EP indicators for inclusion in the state-wide clinical information management system (the Mental Health Outcomes and Assessment Tools: MH-OAT) then under development. In May 2000 a third questionnaire was distributed requesting EP clinicians to describe and list in order of priority 10 measurement domains (not research instrument assessments), especially ones considered likely to distinguish patients receiving EPI from those in standard care. For measurement domains rated as essential by more than 40% of respondent clinicians, two or three published indicator or instrument options for coding were selected by the Working Group. Then in September 2001, a one-day state-wide EP indicator forum was held attended by more than 50 experienced EP clinicians. At the forum clinicians were divided into groups to encourage face-to-face discussion and consensus about the most highly ranked indicator constructs. As well as a conceptual definition for an EP flagging indicator (defining an early psychosis patient), the forum proposed five other domains to be measured at baseline (duration of initially untreated psychosis [DUP], substance use [SU], suicidal risk [SR], psychosocial function, and family functioning) and five review indicator domains to be measured at review or follow-up (programme drop-out [PDO], SU, SR, psychosocial function, and family functioning). The mandated HoNOS and LSP ratings were proposed as intermediate health outcome indicators. This evaluation framework was included as the centre piece of a revised NSW Clinician's guide to evaluating early psychosis initiatives, submitted for departmental editing in December 2001 but in fact for unknown reasons never published (draft available on request).
Operationally transforming indicator definitions
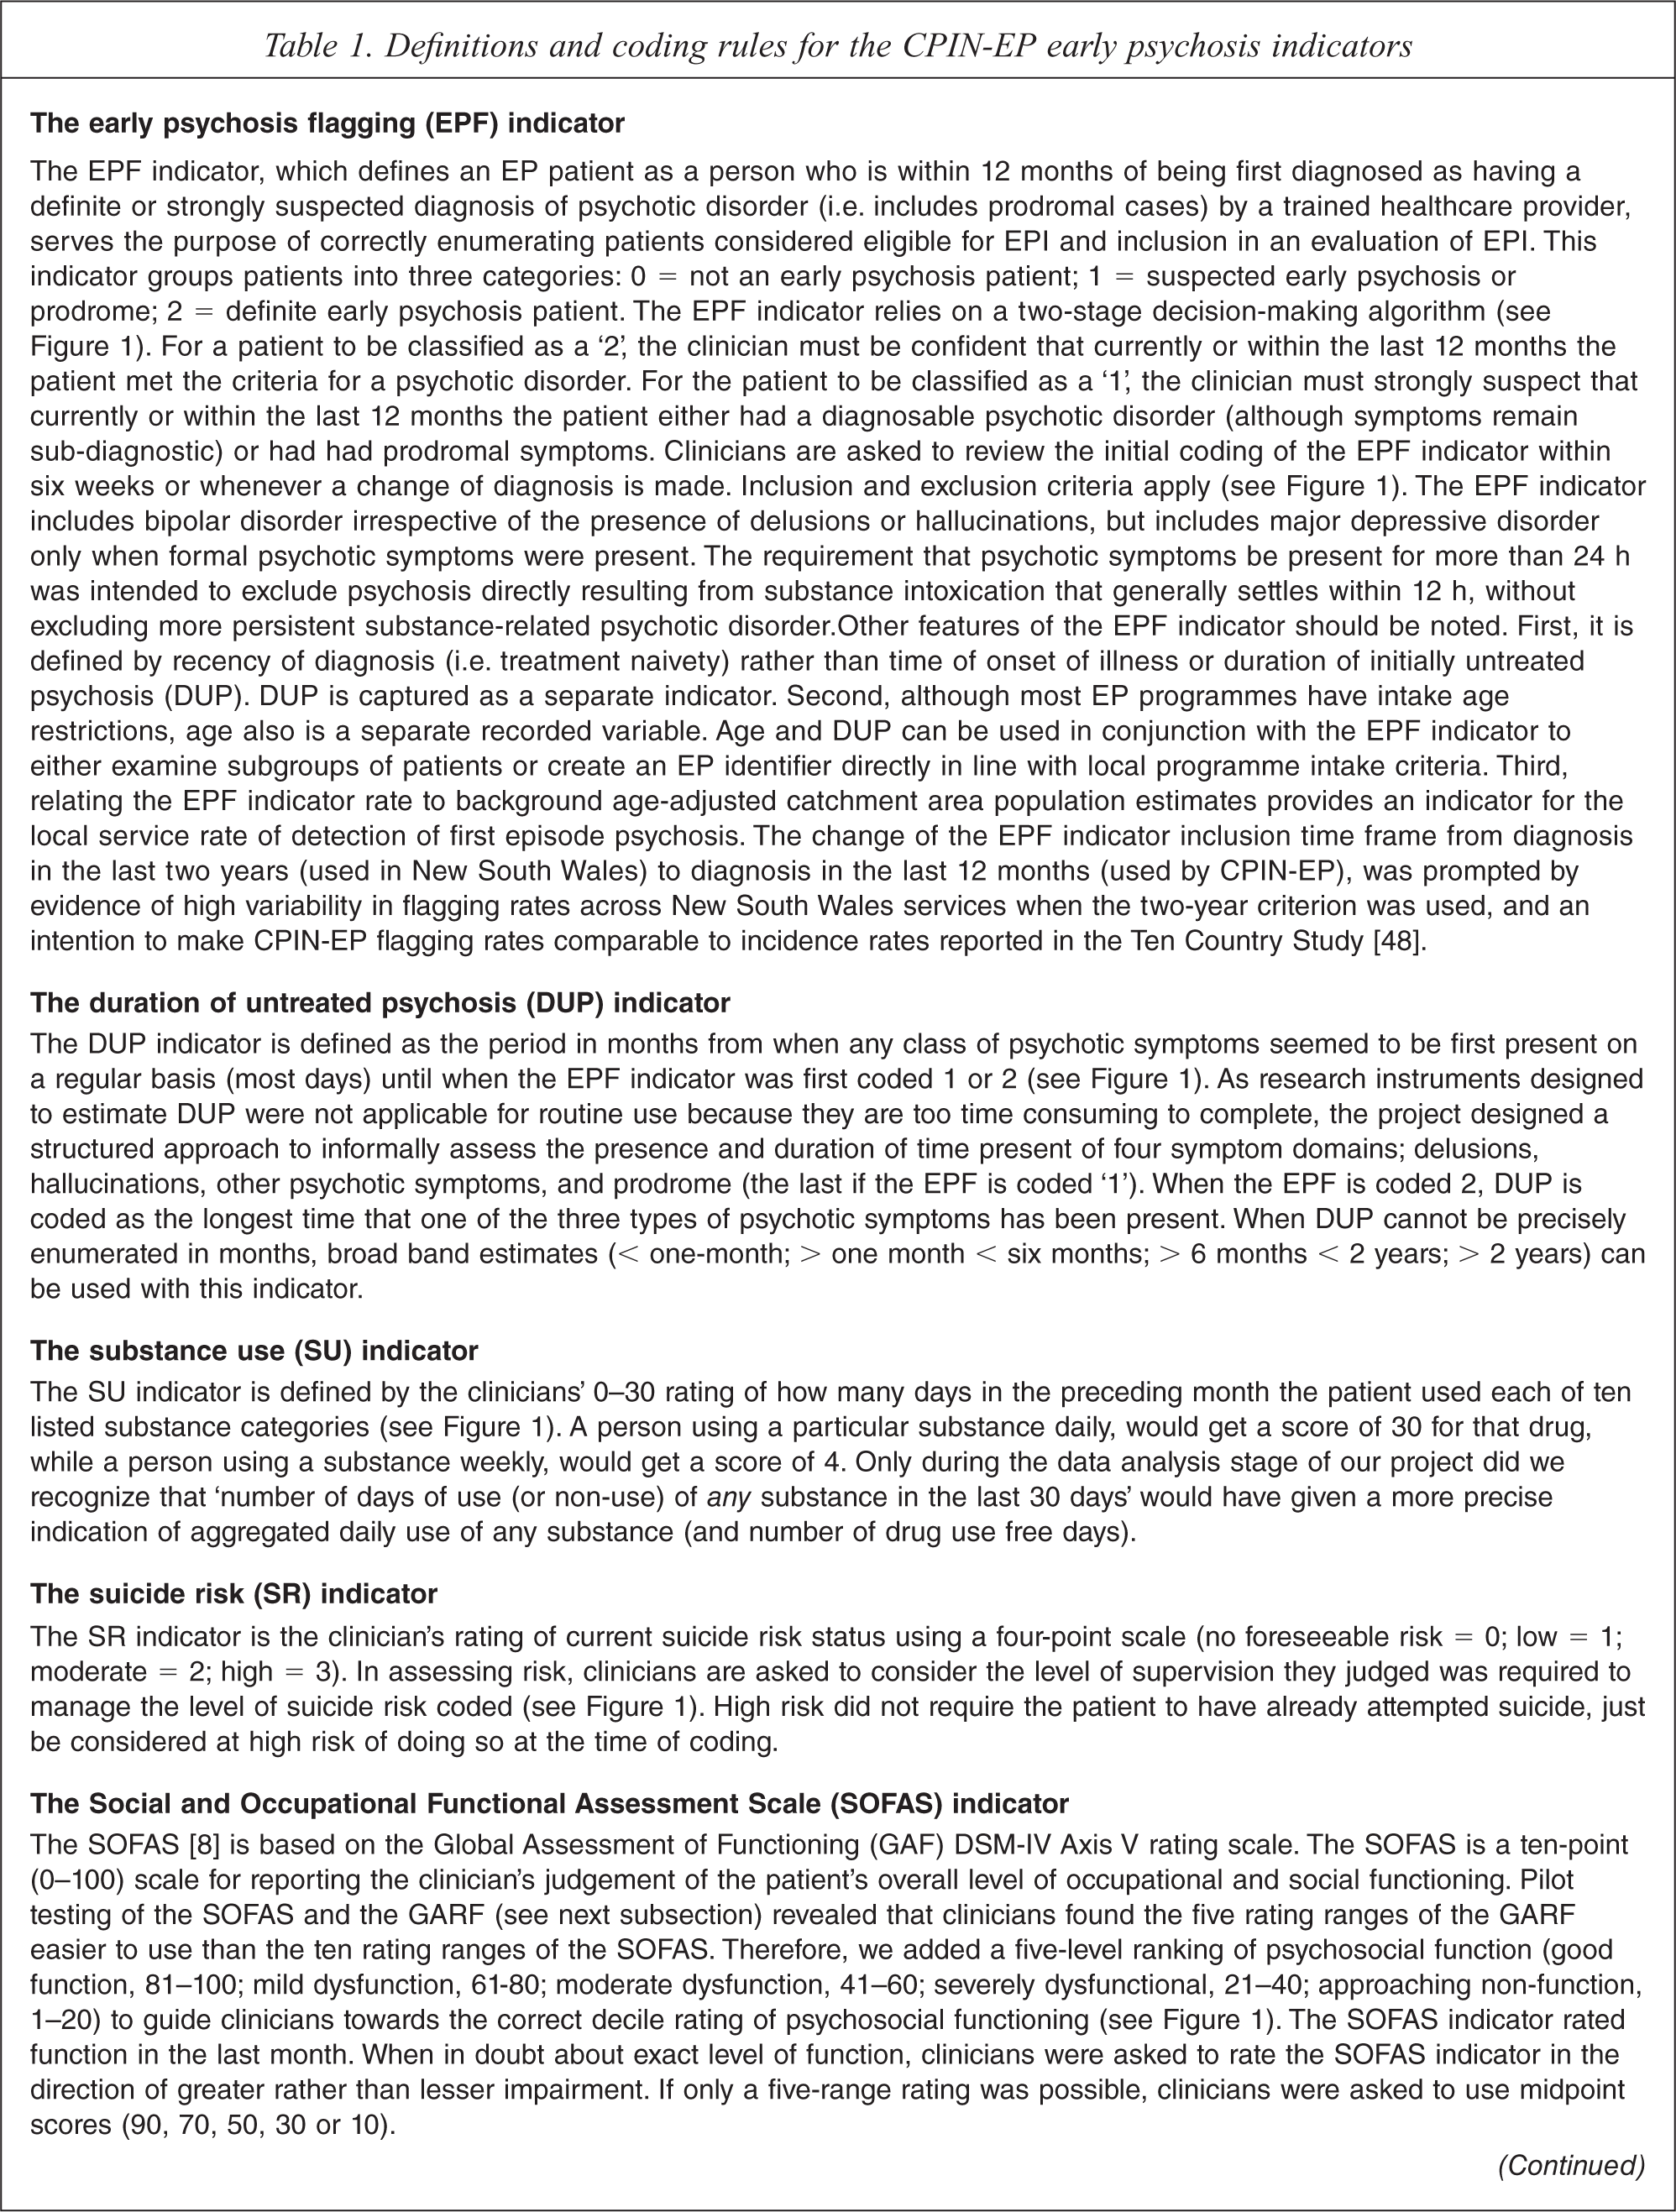
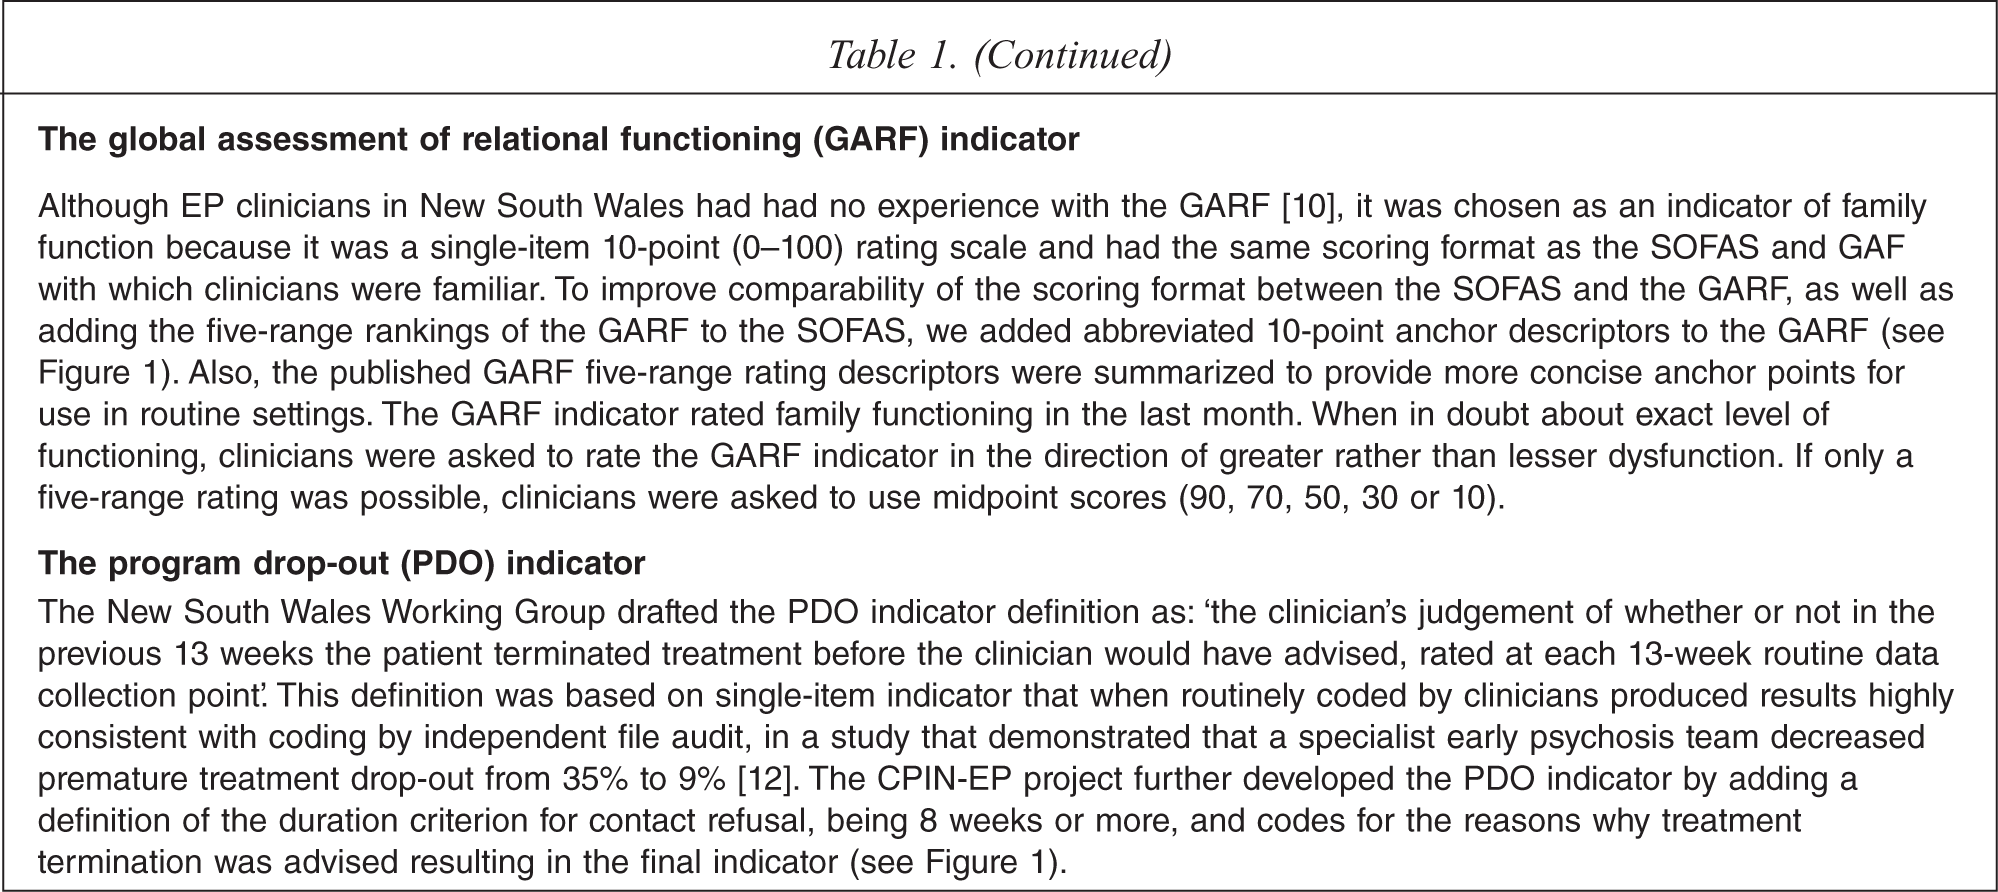
In 2002, in parallel with the NSW Working Group processes, the National Health and Medical Research Council of Australia (NHMRC) awarded funding to our group to carry out an evaluation of existing EPI teams, a project we called the NHMRC Clinical Practice Improvement Network for Early Psychosis (CPIN-EP). The evaluation was approved by the Human Research Ethics Committee at the University of Queensland. Apart from two indicators based on published rating scales (the Social and Occupational Functioning Assessment Scale (SOFAS) [9,10] and the Global Assessment of Relational Functioning (GARF) [11,12]), coding procedures for the other indicators had not been specified by the NSW Working Group. Therefore, indicators required further development before being judged suitable in terms of ease-of-training and clinician confidence in using them in routine settings. This was done in cycles of review of draft indicator definitions and coding systems by the CPIN-EP national expert reference committee and piloting of indicator definitions by clinicians in routine service settings. Even indicators based on published scales (SOFAS and GARF) required re-formatting (both) or more concise anchor point descriptions (GARF) before clinicians could use them efficiently in routine settings. The EP flagging indicator (EPF indicator) defining an EP patient was contentious because it was diagnostically based. Many clinicians objected to the procedure of making a provisional diagnosis within 10 days of raising the EPF indicator. The final operational definitions for each indicator (EPF, DUP, SU, SR, SOFAS, GARF and PDO indicators) and their coding procedures are described in Table 1 (the pocket-sized Clinician's guide with essential coding information is shown in Figure 1 and available on request).
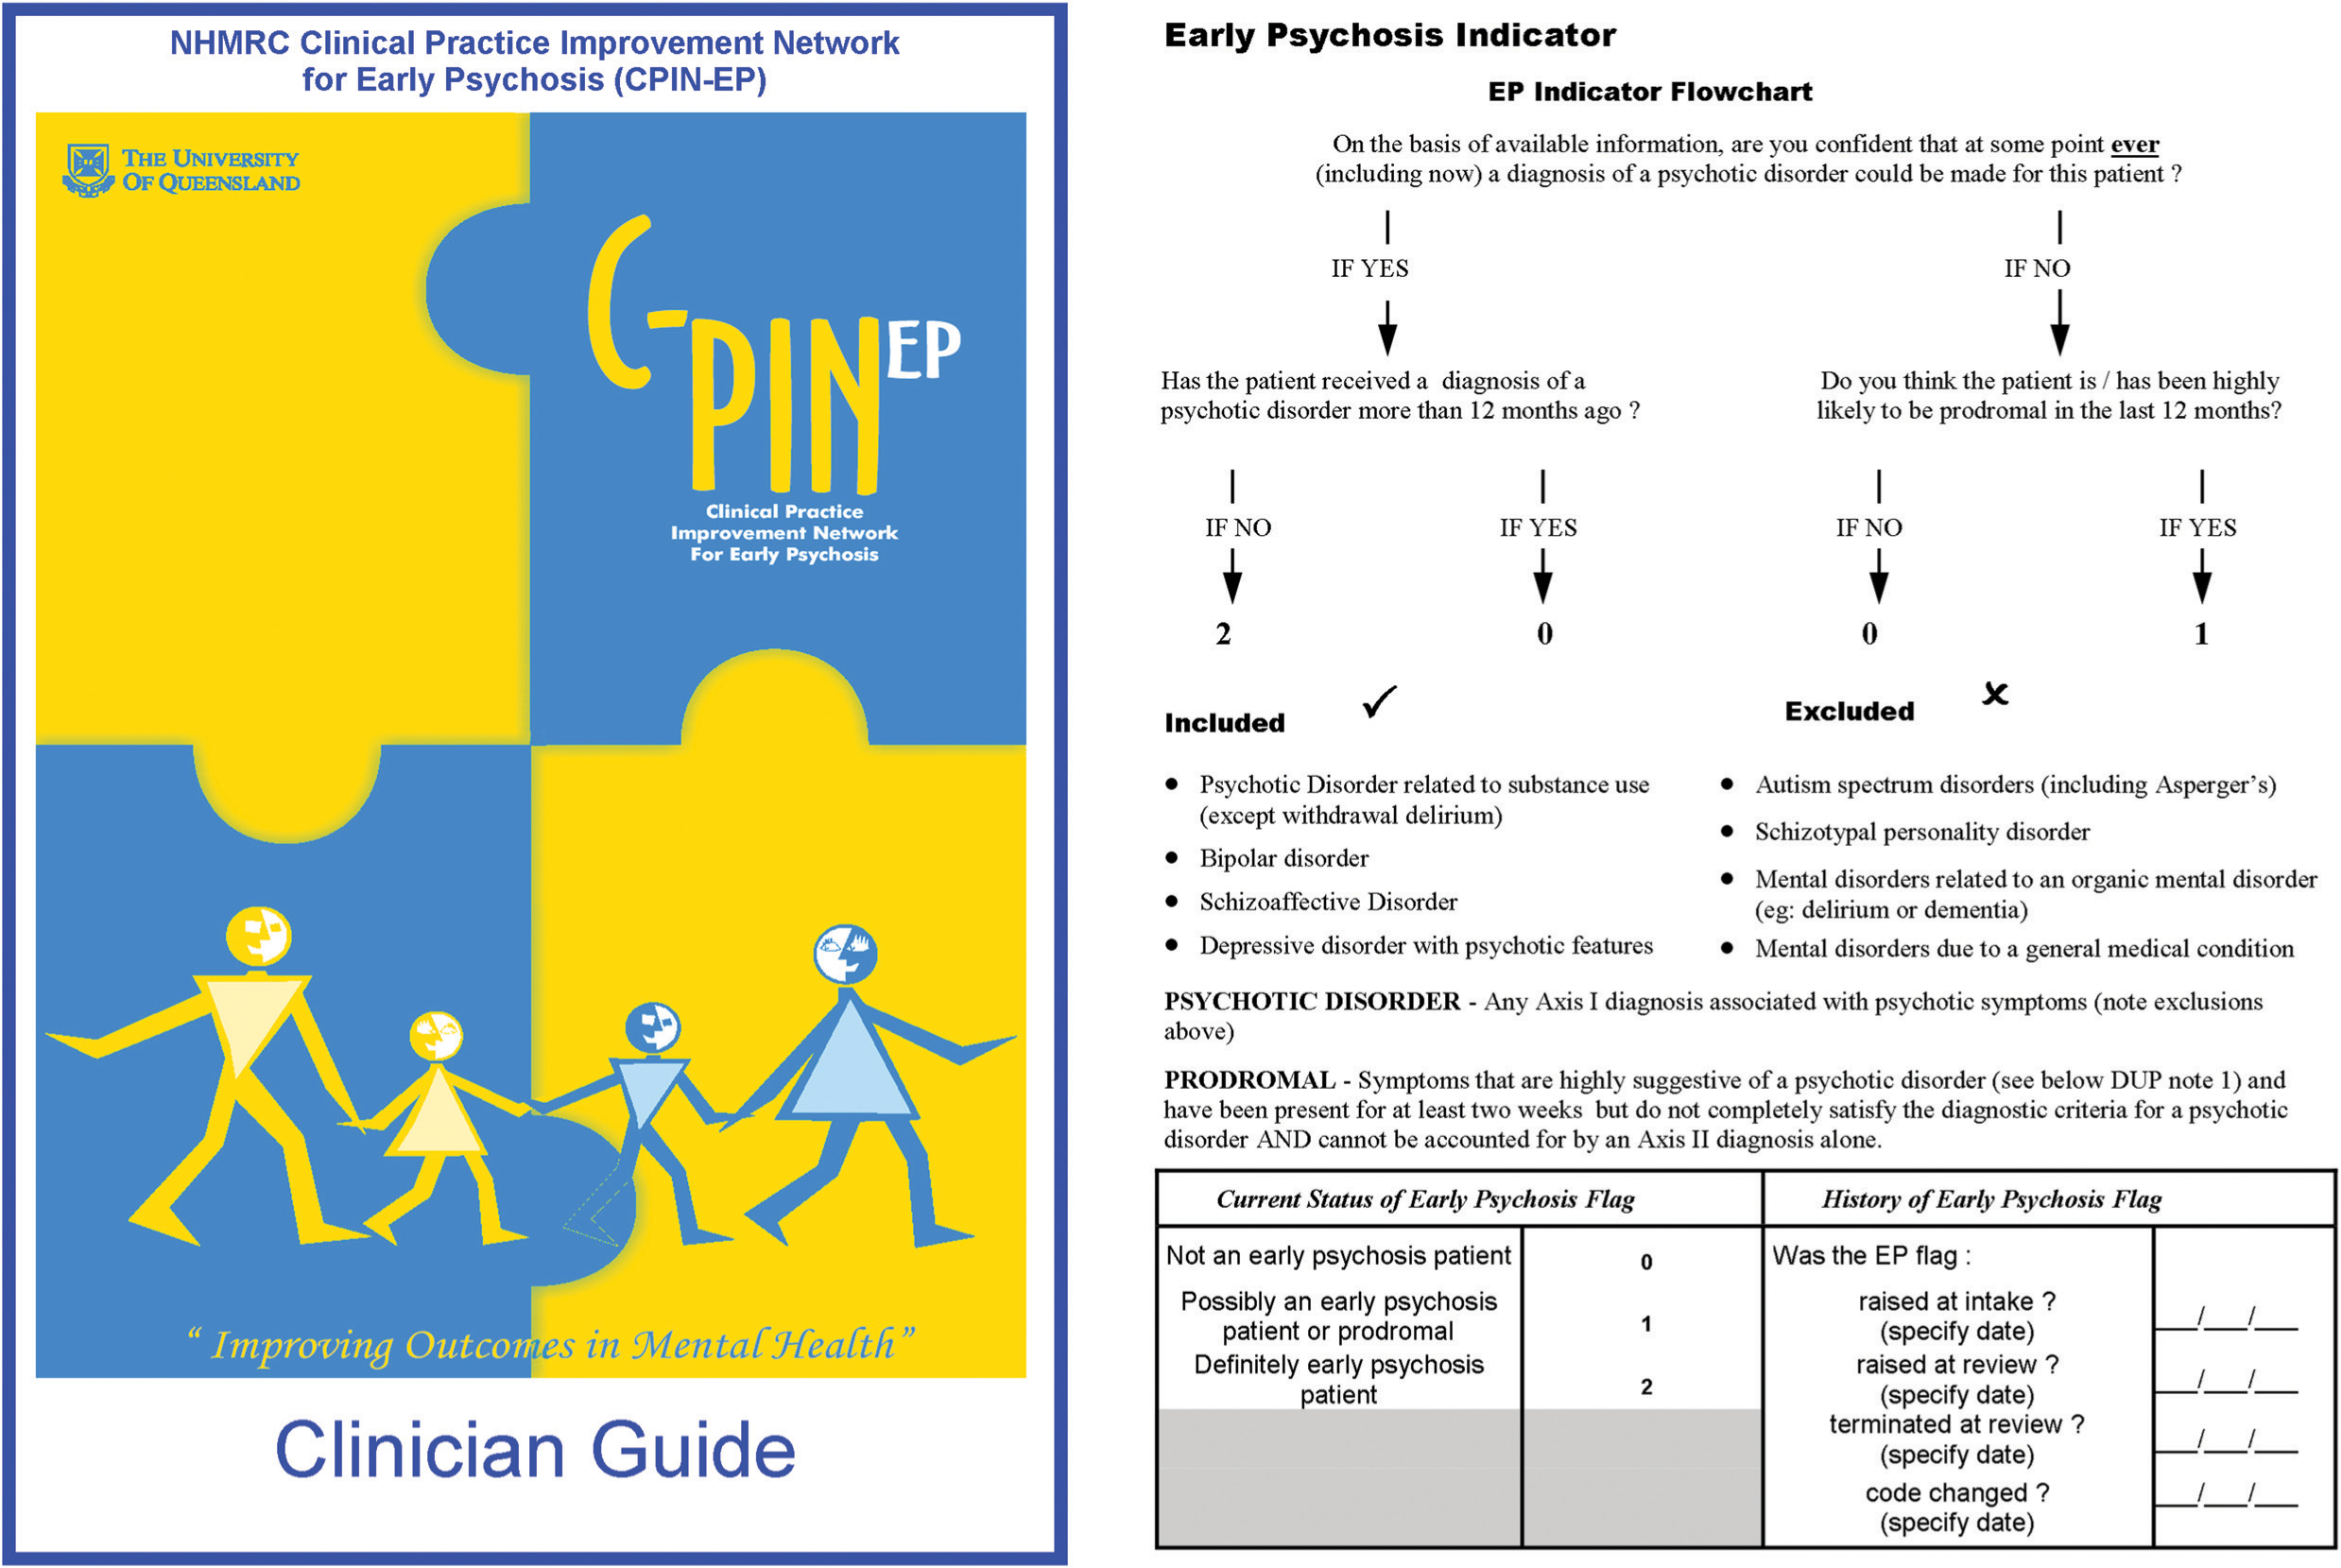
The CPIN-EP Clinician's guide to coding the early psychosis clinical indicators.
Definitions and coding rules for the CPIN-EP early psychosis indicators
Designing and delivering the indicator training package
Service manager consultation indicated a number of constraints should be placed upon the design of the indicator training package (ITP). It must: be no longer than 2 h; be able to train from 4 to 20 clinicians at once; be deliverable without relying upon local mental health service audio-visual resources; measure clinician performance to ensure that training has been effective; and function as both a training package as well as a motivational tool. Given the brevity (2 h), mode (small group) and highly specified learning objectives (familiarization with indicator coding rules), a simple expositional instruction package was designed [13], with step-wise didactic tuition about the rating rules for each indicator, inclusion of guided and unguided practice to stimulate discussion and clarifying questions about rating rules, and use of simple instructional media (PowerPoint slides and a single instructor).
An important aspect of the training was to assess reliability both within and between mental health services. In order to do this, paper-based vignettes were designed. The aim was for clinicians to rate up to four vignettes within a single training session. Correct answers were provided after the trainees had completed a coding form on each vignette. In this way the vignettes served as both a training tool and a tool to assess reliability. Familiarization procedures for the SU and PDO indicators (see Table 1 and Figure 1) were also included in the ITP, but because experience with these indicators in New South Wales showed that clinicians achieved excellent inter-rater reliability after only a familiarization procedure (data on the PDO has been published [14], the SU indicator was an item from the MH-OAT documentation package found to be reliable with familiarization only), inter-rater reliability of these indicators was not formally tested as part of the ITP. The final training procedures were deemed by the CPIN-EP expert reference group to be the minimum instruction likely to achieve an understanding of indicator coding by generalist mental health clinicians. Evaluation of training acceptability was limited to the informal anecdotal verbal feedback of clinicians-in-training. No formal test of knowledge transfer was included. Training effectiveness was assumed to be reflected in levels of inter-rater agreement.
Training sessions, all carried out by one author (A.D.J.F.), were conducted in nine area mental health services across three states. Services were self-selected as willing to participate in the CPIN-EP prospective evaluation, training with the ITP being part of site initiation procedures. To minimize the impact on the operation of the mental health service, multiple training sessions were offered so that clinical staff could attend with the minimum requirement for backfill from the organization. Instruction received in training sessions was supported logistically by: 1) supply to the local service CPIN-EP coordinator of the training package, and asking this person to individually coach new staff or staff who had missed training; 2) design of an indicator coding form (paper-based or electronic, available on request) for attachment immediately after the scoring forms for the HoNOS and LSP; 3) a job performance aid in the form of a pocket-sized Clinician's guide (see Figure 1) containing all the essentials of coding rules/definitions as a reminder when completing the indicator coding form; 4) a single follow-up site visit by the CPIN-EP trainer to offer an additional training session or answer specific questions about coding, especially for the local service coordinator; and 5) ongoing support of the local service coordinator via email and telephone contact with CPIN-EP project staff.
Procedures for testing inter-rater reliablity
During the training session, all clinicians were asked to code written clinical vignettes on five indicators: the EPF, DUP, SR, SOFAS and GARF. Vignettes were presented in fixed order, Jim (Vignette 1), Andrew (Vignette 2), Jane (Vignette 3), and Scott (Vignette 4). Vignettes were reviewed by the CPIN-EP expert reference committee who provided expert consensus ratings. The coding data from coding forms completed by clinicians during training sessions were collected for analysis.
Data analysis
Codes for all indicators were deemed to be categorical data. Reliability was assessed descriptively by calculating percentage agreement between coding of clinicians-in-training versus consensus coding made by the expert reference group. For the SR, SOFAS, and GARF indicators we followed Australian procedures used to assess HoNOS training [15] and calculated ‘broad range’ (consensus score plus or minus one scoring level) percentage agreement, as well as that for the exact consensus score. An index of reliability was estimated by entering for each indicator the rates of agreement on each of the four vignettes into an online kappa calculator (http://justus.randolph.name/kappa). The online kappa calculator computes a multi-rater variation of Brennan and Prediger's (1981) [16] free-marginal kappa, which is recommended when raters are not forced to assign a certain number of cases to each category. To use this calculator, we assumed a constant total pooled number of raters (n =100) and substituted agreement percentages (as whole numbers) for the numbers of raters coding a category for a particular indicator (kappa was little affected by exactly what number above 50 that was entered to represent the total pooled number of raters). The number of vignettes was entered as the number of cases into the calculator. Due to the nature of our data (a variable number of vignettes rated by a variable number of clinicians across multiple services) we were unable to identify an appropriate statistical test of consistency of rating across services. In particular, formal statistical testing of variability across services was precluded by the ‘ceiling effect’ of a large proportion of the cells in the contingency table (indicator category by health service) containing zero or very low entries. Therefore, simple inspection of the patterns of indicator category codings and comparison of modal scores across services were used to assess across-service rating consistency (bias).
Results
A total of 95 clinicians representing all health practitioner disciplines attended training sessions. Most worked in the role of case manager. Training group size varied (average 8 clinicians, range 2–28). The total number of clinicians trained on Vignette 1 (n = 95) was more than on Vignette 2 (n = 67), Vignette 3 (n = 65) and Vignette 4 (n = 18). Time constraints resulted in only a minority of groups training quickly enough to finish four vignettes, but most groups completed three. Informal anecdotal verbal feedback from clinicians-in-training about training sessions was universally positive in terms of judged high relevance, utility and enjoyment. This feedback was consistent with informal verbal and email follow-up feedback from local service coordinators assisting the project. A number of clinicians handed vignette coding forms to the trainer with a number of un-coded indicators. On average about 10% of the coding forms per training session were incomplete with a trend for non-completion rates to be higher with the first two vignettes compared to the third and fourth vignettes. As there was only one instructor, complete compliance of clinicians-in-training in regards to this matter was not feasible. The trainer (A.D.J.F.) considers the higher non-completion rates with Vignette 1 and 2 to simply reflect his greater focus on explaining the rating rules in the first part of training sessions, and higher completion rates with subsequent vignettes related to greater attention to inter-rater reliability later in the training sessions.
Table 2 presents the percentage agreement between coding by clinicians-in-training versus coding by the expert group. Averaged across the vignettes, overall percentage agreement for the indicators ranged from fair (60–65% for the GARF and SOFAS) to good (>80% for the EPF and DUP). Because there was both vignette-related and indicator-related coding variability, results will be presented separately for each indicator by vignette (see next section).
Percentage agreement between clinician-in training versus expert consensus ratings
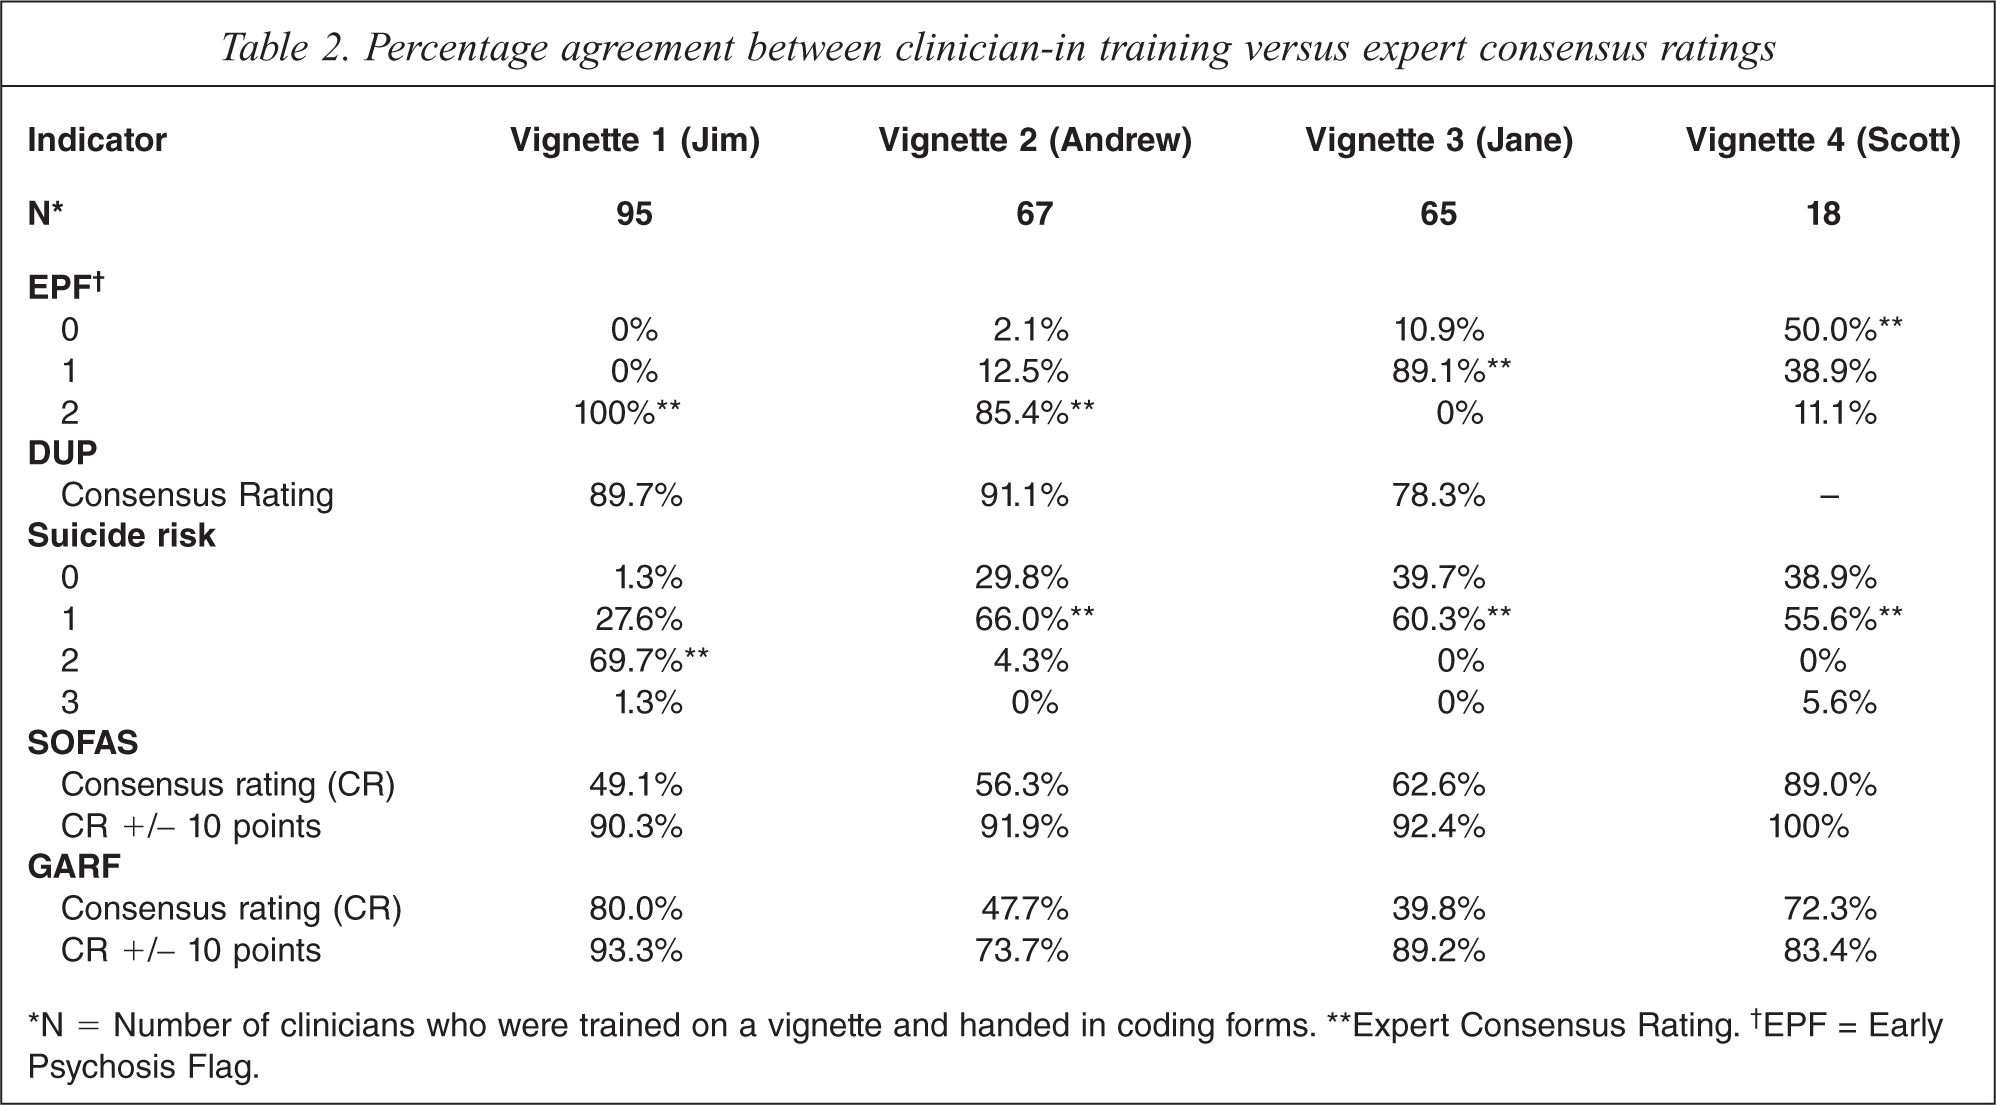
∗N = Number of clinicians who were trained on a vignette and handed in coding forms. ∗∗Expert Consensus Rating.† EPF = Early Psychosis Flag.
The EPF indicator
Percentage agreement for the EPF indicator (see Table 2, first panel) was 100% (Jim, EPF = 2), 85.4% (Andrew, EPF = 2), and 89.1% (Jane, EPF = 1). Only 18 clinicians had time to code the fourth vignette (Scott), for which there was low agreement (50%) with the expert consensus coding of EPF = 0. This vignette described a GP referral for urgent assessment with clinical features that did not strongly suggest prodrome, except perhaps for social withdrawal. About 39% of clinicians coded the vignette as EPF = 1, suggesting that they had responded to the urgent context of the referral rather than its clinical features thereby resulting in a coding disagreement but one of little clinical importance. Because of this diagnostically confusing aspect of Vignette 4 and the low numbers that rated it (n = 18), only Vignettes 1, 2 and 3 were included in the calculation of the free marginal kappa statistic for the EPF indicator, which resulted in a value of 0.78. Inspection of the pattern of the contingency cell numbers (indicator category by service) revealed most raters identified EPF status with a high degree of consistency across services. The modal EPF codes for each vignette were identical across services.
The DUP indicator
Percentage agreement for the DUP indicator (see Table 2, second panel) was 89.7% (Jim, DUP = 18), 91.1% (Andrew, DUP = 2) and 78.3% (Jane, DUP = 6). Many of the 18 clinicians who incorrectly coded the EPF on Vignette 4 (Scott) were as a result also unable to code DUP, so the DUP indicator codes for this vignette are not listed in Table 2 or included in calculating kappa. High agreement was achieved with Vignettes 1 and 2, where definite cases with clear cut psychotic symptoms were described. Vignette 3 was more complex as it required clinicians to recognize that there were no psychotic symptoms, to remember that there was a rule to rate duration of prodromal symptoms in this situation, and to estimate the length of the prodrome. Inspection of the raw data for Vignette 3 revealed that in one service clinicians had struggled with the complexity of the rating rule that required realization that DUP was still coded (duration of non-psychotic prodromal symptoms) even when the EPF indicator was coded 1 (prodromal patient). The kappa value for the DUP indicator was 0.65 when data from Vignettes 1 and 2 were entered (with Vignette 3 also included kappa was 0.55). A high degree of coding consistency across services was evident with modal DUP codes for each vignette being identical across services.
The SR indicator
Percentage agreement for the SR indicator (see Table 2, third panel) was 69.7% (Jim, SR = 2), 66% (Andrew, SR = 1), 60.3% (Jane, SR = 1) and 55.6% (Scott, SR = 1). The reason why agreement was consistently lower across all vignettes for the SR indicator was related to the tendency of clinicians to code SR one rank lower than expert consensus. When vignette content was reviewed, it was found that in none of the clinical scenarios did suicidal thinking or behaviour occur. Expert coders had placed more weight on contextual symptoms (e.g. a young man with personally threatening delusions) than clinicians-in-training who apparently assess risk solely on presence or absence of suicidal ideation.
As most coding disagreements on the SR indicator resulted from clinicians ranking risk one level below expert consensus, percentage agreement was re-calculated for ‘broad range’ expert consensus by combining the two ranks (see Table 2). Using ‘broad range’ coding, percentage agreement for the SR indicator was 97.3% (Jim), 95.8% (Andrew), 100% (Jane) and 94.5% (Scott). Estimated kappa values for the SR indicator using ‘narrow range’ consensus was 0.36 (reflecting fair agreement) and 0.92 using ‘broad range’ consensus (reflecting excellent agreement). Hence, although less precise inter-rater agreement for the SR indicator was possible with vignettes that did not refer directly to active suicidality, it was clear that clinicians grasped the coding definitions and coding rules within the training session. Inspection of raw coding data revealed a tendency for clinicians in acute care services to more often rate the SR indicator lower than community-based workers. The modal SR codes for each vignette were identical across services, except for two aberrant services.
The SOFAS indicator
Same-decile percentage agreement for the SOFAS indicator (see Table 2, fourth panel) was 49.1% (Jim, SOFAS = 25–35), 56.3% (Andrew, SOFAS = 55–65), 62.6% (Jane, SOFAS = 50–60) and 89.0% (Scott, SOFAS = 55–65). Levels of agreement for ‘narrow range’ (same-decile) SOFAS scores were below 60% for two of the vignettes. A more tolerant test of agreement using ‘broad range’ expert consensus SOFAS scores (i.e. narrow range expert consensus scores ± 10 points) produced percentage agreement for the SOFAS indicator of 90.3% (Jim), 91.9% (Andrew), 92.4% (Jane) and 100.0% (Scott). Estimated kappa values for the SOFAS indicator (narrow range consensus) was 0.16 (reflecting little agreement) and for broad range agreement was 0.76 (reflecting substantial agreement). Raters appeared to code the SOFAS indicator with a high degree of consistency across services. Modal SOFAS codes for each vignette were identical across all services.
The GARF indicator
Same-decile (narrow range) percentage agreement for the GARF indicator (see Table 2, fifth panel) was 80% (Jim, GARF = 60–70), 47.7% (Andrew, GARF = 30–40), 39.8% (Jane, GARF = 40–50) and 72.3% (Scott, GARF = 50–60). Clinicians found that the GARF indicator had an additional level of complexity over and above the SOFAS indicator. Firstly, the clinician was required to identify which person or people exactly are considered the family, and secondly they must rate the functioning of this relational unit. Vignette 1 was considered a more straight forward family situation, whilst 2, 3 and 4 represented more complex clinical presentations. Using ‘broad range’ GARF scores (narrow range expert consensus scores ± 10 points) percentage agreement for the GARF indicator was 93.3% (Jim), 73.7% (Andrew), 89.2% (Jane) and 83.4% (Scott). Estimated kappa values for the GARF indicator (narrow range consensus) was 0.14 (little agreement) and for ‘broad range’ agreement was 0.51 (moderate agreement). Hence, as with the SOFAS indicator only less precise consensus agreement for the GARF indicator was possible. Modal GARF codes for each vignette were identical across services, except for two aberrant services.
Discussion
Using consensus methods adapted to requirements, EP clinicians in New South Wales could readily agree about what were the most relevant assessment domains for evaluating the effectiveness of EPI but when asked to restrict their choice to less than ten clinical indicators with precisely agreed-upon constructs for routine use with EP patients, agreement was much more difficult to achieve taking almost two years and involving regular meetings of the expert Working Group, repeated literature reviews, and the convening of a one-day consensus development conference. As another psychiatric subspecialty (consultation-liaison) developed agreed-upon indicators much more rapidly [17], reasons for the slow pace of consensus around the EP indicators may be related to the non-standard Delphi process adopted by the NSW Working Group or the immaturity of the EP field generally at the time. The utility of standard consensus methods, such as Delphi processes [18] and nominal group (expert panel) techniques [19], have been demonstrated in developing mental health clinician agreement about: categories of generalist practice [20]; essential components of schizophrenia care [21]; essential elements of EP services [22]; performance measures for EP services [23]; indicators of conformance with practice guidelines for schizophrenia [24]; and first-aid recommendations for people developing a psychotic disorder [25]. Limitations that these studies have in common are the large number of items (e.g. 136 items in [22]; 73 items in [23]; and 89 items in [25]) and definitions only at the conceptual level or by using comprehensive rating on a research instrument. Perhaps the requirement to be extremely selective, when the best indicators of EPI processes were still unclear, made difficulties with consensus in New South Wales inevitable.
Our research team operationally defined indicator constructs using ease-of-training as a criterion of success. A similar approach was taken by a Canadian group to operationalize conceptually defined EP performance indicators [26]. Others have argued that unless coding definitions and rules are almost self-evident, it is unlikely that clinicians will routinely rate standardized measures reliably after only a brief training procedure [27]. The role of training in supporting routine use of indicators is highly controversial. For example, some [28] propose that the reported low reliability of some of the HoNOS sub-scales [29–32] is related to inadequate training, whilst others suggest that training may be of no value [31], and yet others conclude that the HoNOS is inherently unreliable and is not suitable as a training material [32]. Practicability constraints imposed a number of limitations on the training procedure we used. First, CPIN-EP training relied on paper-based clinical vignettes. Clinical vignettes are well suited to large-scale multi-site assessments of clinician behaviour, being inexpensive, easy to use and allowing many clinicians to be presented with the same clinical scenario [33]. Although vignettes appear to be as effective in assessing clinician practice as the use of standardized patients (trained actors) or abstracting medical records [34], they only assess the ability to apply coding rules to written summaries, and do not assess this ability on unedited videotaped patients or the skills to elicit the necessary information during an interview with a real patient. Other limitations in our training procedure relate to the absence of a formal test of knowledge transfer or training acceptability.
We assessed indicator reliability within the ITP training session by asking clinicians to code the written clinician vignettes embedded within the instructional material. In this situation, observed inter-rater agreement is as much influenced by the adequacy of the training procedures, the quality of the clinical vignettes, and clinician compliance with data collection, as by indicator reliability per se. Given the elaborate training procedures developed to support HoNOS ratings [15,35], the single 2-h CPIN-EP training session may not have given trainees enough time to learn all coding rules, an effect with the potential to deflate indicator reliability estimates. Some verbal feedback from trainees suggested that there were deficiencies in the vignettes themselves, resulting mainly from the need to compress information to code five indicators into a single-page clinical narrative. Also, about 10% of the clinicians did not hand in completed coding forms. We cannot know whether some of the clinicians who did not complete coding forms did so because of their lack of confidence in knowing the correct answers. This effect had the potential to inflate our reliability estimates as missing data rates could not be adjusted for in calculating the multi-rater kappa statistic used. Clinician compliance could have been better supervised if two instructors attended ITP training sessions. Measurement in quality improvement studies will always be impacted on by demands of management, time pressure on clinical staff, and under-funding of study projects. Perhaps giving higher priority to evaluating service quality will be required to re-balance competing resource demands so that optimum levels of training [36], ongoing rating supervision, and integration of regular indicator feedback to clinicians can make routine measurement feasible [27].
With the above caveats in mind, what conclusions can we draw about the value of the EP indicators? Importantly, our study is the first published attempt to develop a reliable indicator defining EP patients suitable for routine use (kappa = 0.78). This level of reliability is comparable or superior to those associated with training on HoNOS items in Australia, which only achieved broad-band percentage agreement of 44%–99% [15]. The EPF indicator appears to have easily followed coding rules and inclusion and exclusion criteria. Contrary to other proposals [37], this indicator was designed to be independent of age and DUP but able to be used in conjunction with these variables. The EPF indicator can be used to calculate population-based detection rates for first episode psychosis consistently across service sites (or regions). Also, three other measures developed by CPIN-EP, namely the DUP, PDO and SU indicators appear to have the potential to be reliable in routine service delivery settings.
A number of authors have called for the development of standardized assessment [38] and measurement [39] of DUP, despite the difficulties in doing so [40]. Our DUP indicator may meet some of these requirements (e.g. kappa = 0.65) but this proposition will have to be tested in the field. Despite the emphasis placed on service and treatment engagement [41,42], there has been little consensus on how to best measure it [41]. Our programme drop-out indicator assumes service retention or drop-out can serve as a proxy for engagement. Although we do not report reliability data for this indicator here, supporting data in a field trial has been published elsewhere [14]. In the ITP training session, clinicians found the logic of the coding rules for the PDO indicator self-explanatory and required no more than brief familiarization to feel confident to use it. Similar considerations applied to the substance use indicator, which also did not require more than brief familiarization for reliable coding in New South Wales.
Others have emphasized the importance of suicide risk as a performance indicator for EP [26]. Our results suggest that the CPIN-EP SR indicator, based on clinical judgement of the level of risk monitoring required, may only perform well when obvious suicidality is present. This finding calls into question whether a supplementary suicide risk indicator is needed when the HoNOS is used to rate suicidal behaviour (item 2). Reliable use of a suicide risk indicator may require more intensive training support than we provided [43].
The SOFAS indicator was highly acceptable to clinicians, seemingly related to previous routine coding of the GAF. It was rated reliably across services after training but only at an imprecise ‘broad range’ level. Whether this reliability will be maintained in the field cannot be known, though studies with the GAF suggest that it can [9]. Although sensitivity of the SOFAS in EP contexts has been demonstrated [14], it remains to be seen whether rating psychosocial functioning on a single dimension is overly limiting with EP, and more detailed information such as total number of hours engaged in work or study [44,45] might be a more useful indicator of function. Obtaining clinician consensus on an indicator for family functioning was the most difficult. Despite no known prior use of the GARF by EP teams, this scale was selected mainly because of a perceived lack of a practical alternative. Precise ‘narrow range’ inter-rater agreement was not achieved in our study, though somewhat unexpectedly brief training resulted in adequate inter-rater agreement at a ‘broad range’ level. Whether this reliability will be maintained in the field, and whether the uni-dimensional GARF rating adequately captures the complexity of family function or whether it is sufficiently sensitive to change in the context of EP programmes is unknown. Perhaps self-report alternatives to the GARF such as the nine-item family function scale used in the Western Australian Aboriginal Child Health Survey [46] should be considered, as these do not have training requirements.
In conclusion, based on the premise that clinical indicators have the advantage of being better suited for routine application than research instruments in terms of training requirements and extra burden on clinical staff [27,47], we developed a limited number of indicators for EP services to supplement routine consumer outcomes measurement. Clinicians were able to select by consensus indicator assessment domains and conceptual definitions. Our research team was able to operationalize these definitions to achieve ease-of-training and after brief training inter-rater agreement that was comparable or better than that reported for the HoNOS. However, a number of limitations with the indicators and our training procedures remain. A full assessment of the feasibility of the CPIN-EP indicators for general implementation will require field trials.
Footnotes
Acknowledgements
The work of the New South Wales Early Psychosis Research and Evaluation Committee (Jane Beckman, John Brennan, Joanne Gorrell, Anthony Harris, Deborah Howe, Louise Nash, Sian O'Brien, Maryanne O'Donnell, Marc Reynolds, Alan Rosen, Elizabeth Spencer, Maree Teesson, Mark Welch), the New South Wales State Coordinators for Early Psychosis (Bernadette Dagg, Kathy Paterson, and Vickie Ryan) and the support of the former Director of the New South Wales Centre for Mental Health (Beverley Raphael) and her adviser (Kym Scanlon) are gratefully acknowledged. We thank the New South Wales Project Officer Elizabeth Temple.