
Abstract
Major depression is a public health concern, not only because it is one of the most common mental health conditions [1–3], but also because there are shortcomings in its detection and management [4–7], and the associated excess burden of disease is considerable and expected to increase [8].
In Australia during the last decade, determined efforts have been made at government, professional, charitable and industry levels to enhance public knowledge about the ubiquity of mental health disorders, particularly major depression, and the effectiveness and availability of treatments. These have included the Better Outcomes in Mental Health Care initiative [8], which is part of the Australian National Mental Health Strategy [9]; the establishment of beyondblue: the national depression initiative [10], a predominantly federally funded body, albeit with contributions from a number of states. Other initiatives include the 2001 Access to Allied Psychological Services programme [11], the extension in 2006 of Medicare rebate services to general practitioners and allied health professionals providing mental health care (the Access to Allied Psychological Services programme) under the Better Access to Mental Health Care initiative [12] and increases in antidepressant medications [13]. There have also been continuing medical education programmes from national organizations in Australia [14,15] and New Zealand [16]; publicity from the Mental Health Foundation of Australia [17]; and marketing via general practice and specialist educational programmes sponsored by pharmaceutical companies [18].
Issues that have been addressed have included not only publicizing the common symptoms of major depression, but also providing information about appropriate management and reducing the stigma associated with help seeking. These endeavours have resulted in changes in mental health literacy in the community, both Australia-wide [19] and specifically in South Australia [20,21], but whether these have translated into changes in the prevalence of major depression and its management is open to debate [22], although there is some evidence that patient outcomes may have improved as a result of some interventions [11].
It is now timely to examine whether there have been such changes. This paper reports the findings of surveys in 1998, 2004 and 2008 of major depression in random and representative samples of the South Australian community, thereby allowing a broad analysis of the effectiveness of these programmes.
Method
Survey design and sample selection
Data were obtained from the 1998, 2004 and 2008 South Australian Health Omnibus surveys (SAHOS) conducted in the autumn of each year by the Population Research and Outcomes Studies Unit, Department of Health, South Australia (SA). Ethics approval for each of the three surveys was received from the SA Department of Health Human Ethics Committee.
A full description of the SAHOS methodology can be found elsewhere [23,24], a brief outline is given here. The SAHOS is an annual user-pays population-based survey for health organizations, which includes questions related to both physical and emotional conditions. The survey is administered to metropolitan and country residents of South Australians aged 15 years or more, via a face-to-face interview. It uses a random stratified sampling technique in metropolitan areas based on the census collectors’ districts used by the Australian Bureau of Statistics. Ten dwellings were chosen in each district by selecting every fourth household from a random starting point. The rural sample included country towns with a population of 1000 or more. Where more than one person aged 15 years or more resided in the household, the person who had a birthday most recently was selected for interview. A minimum of six visits were made to each household in an attempt to interview the selected person, and replacement interviews were not conducted.
Measures
Respondents were asked their country of birth, relationship status, education attainment, labour force participation and area of residence.
Major depression was assessed using the Mood module of the Primary Care Evaluation of Mental Disorders (PRIME-MD) instrument, which has demonstrated reliability and validity in primary health care settings [25,26]. It consists of 16 questions relating to symptoms of depression experienced nearly every day for the last 2 weeks (categorized as yes/no). Major depression was derived from an algorithm based on the DSM-IV definition. Other mood disorders including partial remission of major depression, dysthymia, minor depression and bipolar disorder can also be delineated by the algorithm, but they were not analysed for this study.
Mental health literacy was assessed with Jorm et al.'s [27] depression recognition instrument. This comprises a vignette describing a depressed person, and 20 items which probe recognition of the condition and knowledge of various people who may be helpful. Scoring of the test was carried out using a modified version of Dunn et al.'s algorithm [28], which provides a summative model with a score range up to 200 points. The data in the present study showed that ∼40% of participants obtained ceiling scores. Scores were therefore tertiled into those whose mental health literacy was poor or fair (score range: 0–149), good (150–199) and excellent (200).
Health status was measured using the Physical and Mental Component Summary scores (PCS and MCS) of the SF-36 [29,30], which has been previously validated in Australian population studies [31,32]. The PCS and MCS are derived from the aggregation of scores from 36 questions across eight dimensions of health and well-being. SF-36 Version 1 (SF-36V1) was used in 1998 and was followed by Version 2 (SF-36V2) in the subsequent surveys [29,30]. After the advice of Ware et al., concerning studies where different versions of the SF-36 are to be compared, scores are presented as T-scores [30]. Australian weights were used. For the SF-36V1 the weights were from the Australian Bureau of Statistics [31] and from Hawthorne et al. for the SF-36V2 [32]. A single question from the SF-36: ‘In general would you say your health is excellent, very good, good, fair, poor’, was also used to assess population health status.
Statistical analyses
Data were weighted by the inverse of the individual's probability of selection, metropolitan and rural response rates and reweighted to benchmarks derived from the appropriate population census.
Overall significance for categorical data was examined using Pearson chi-square (χ2) tests and adjusted standardized residuals used to test deviations from expected values separately for each χ2 test in the multiple contingency tables. An adjusted standardized residual of > 1.96 indicated a statistically higher or lower than expected difference between observed or expected counts for each χ2 test. Continuous data are presented as means and standard deviations, and were examined using analysis of variance tests (ANOVA). Overall significance was examined further using post-hoc Tukey honestly significant difference (HSD) tests.
Multivariate logistic regression models were developed to determine the variables that best predicted major depression. Variable selection for inclusion in the model was based on prior univariate models and included all variables with a p value of ≤ 0.25. All variables were entered simultaneously into the logistic regression models. Odds ratios for categorical variables represent the odds of having major depression relative to the reference category, and 95% confidence intervals are reported. Data were analysed using SPSS version 15.0 [33].
Results
In 1998, 4400 households were selected, 732 were out of scope (vacant, unable to contact after 6 visits, unable to speak English, or mental incapacity), there were 658 refusals and 3010 interviews were conducted, a participation rate of 82% of those in scope. In 2004, 4700 dwellings were selected, 734 were out of scope, there were 951 refusals and 3015 interviews were completed, a participation rate of 76% of those in scope. In 2008, 5000 dwellings were selected, 856 were out of scope, there were 1110 refusals and 3014 interviews were conducted, a participation rate of 73% of those in scope.
Table 1 demonstrates sociodemographic characteristics, self-perception of general health, and health status summaries from the SF-36. Compared to 1998, in 2004 and 2008 participants were older; the statistical difference was between those who partipated in 1998 and 2004. The proportion of people born in the UK/Ireland or other countries significantly declined between 2004 and 2008, whereas the proportion of people born in Asia significantly increased over the study period. Participants in the 2008 survey were significantly more highly educated than in the earlier surveys, and there was a significant increase in the proportions working part time or being retired, and a decrease in those reporting other labour force status. There were no significant differences between the surveys by gender or relationship status.
Socio-demographic characteristics of the three South Australian cohorts, 1998, 2004, 2008
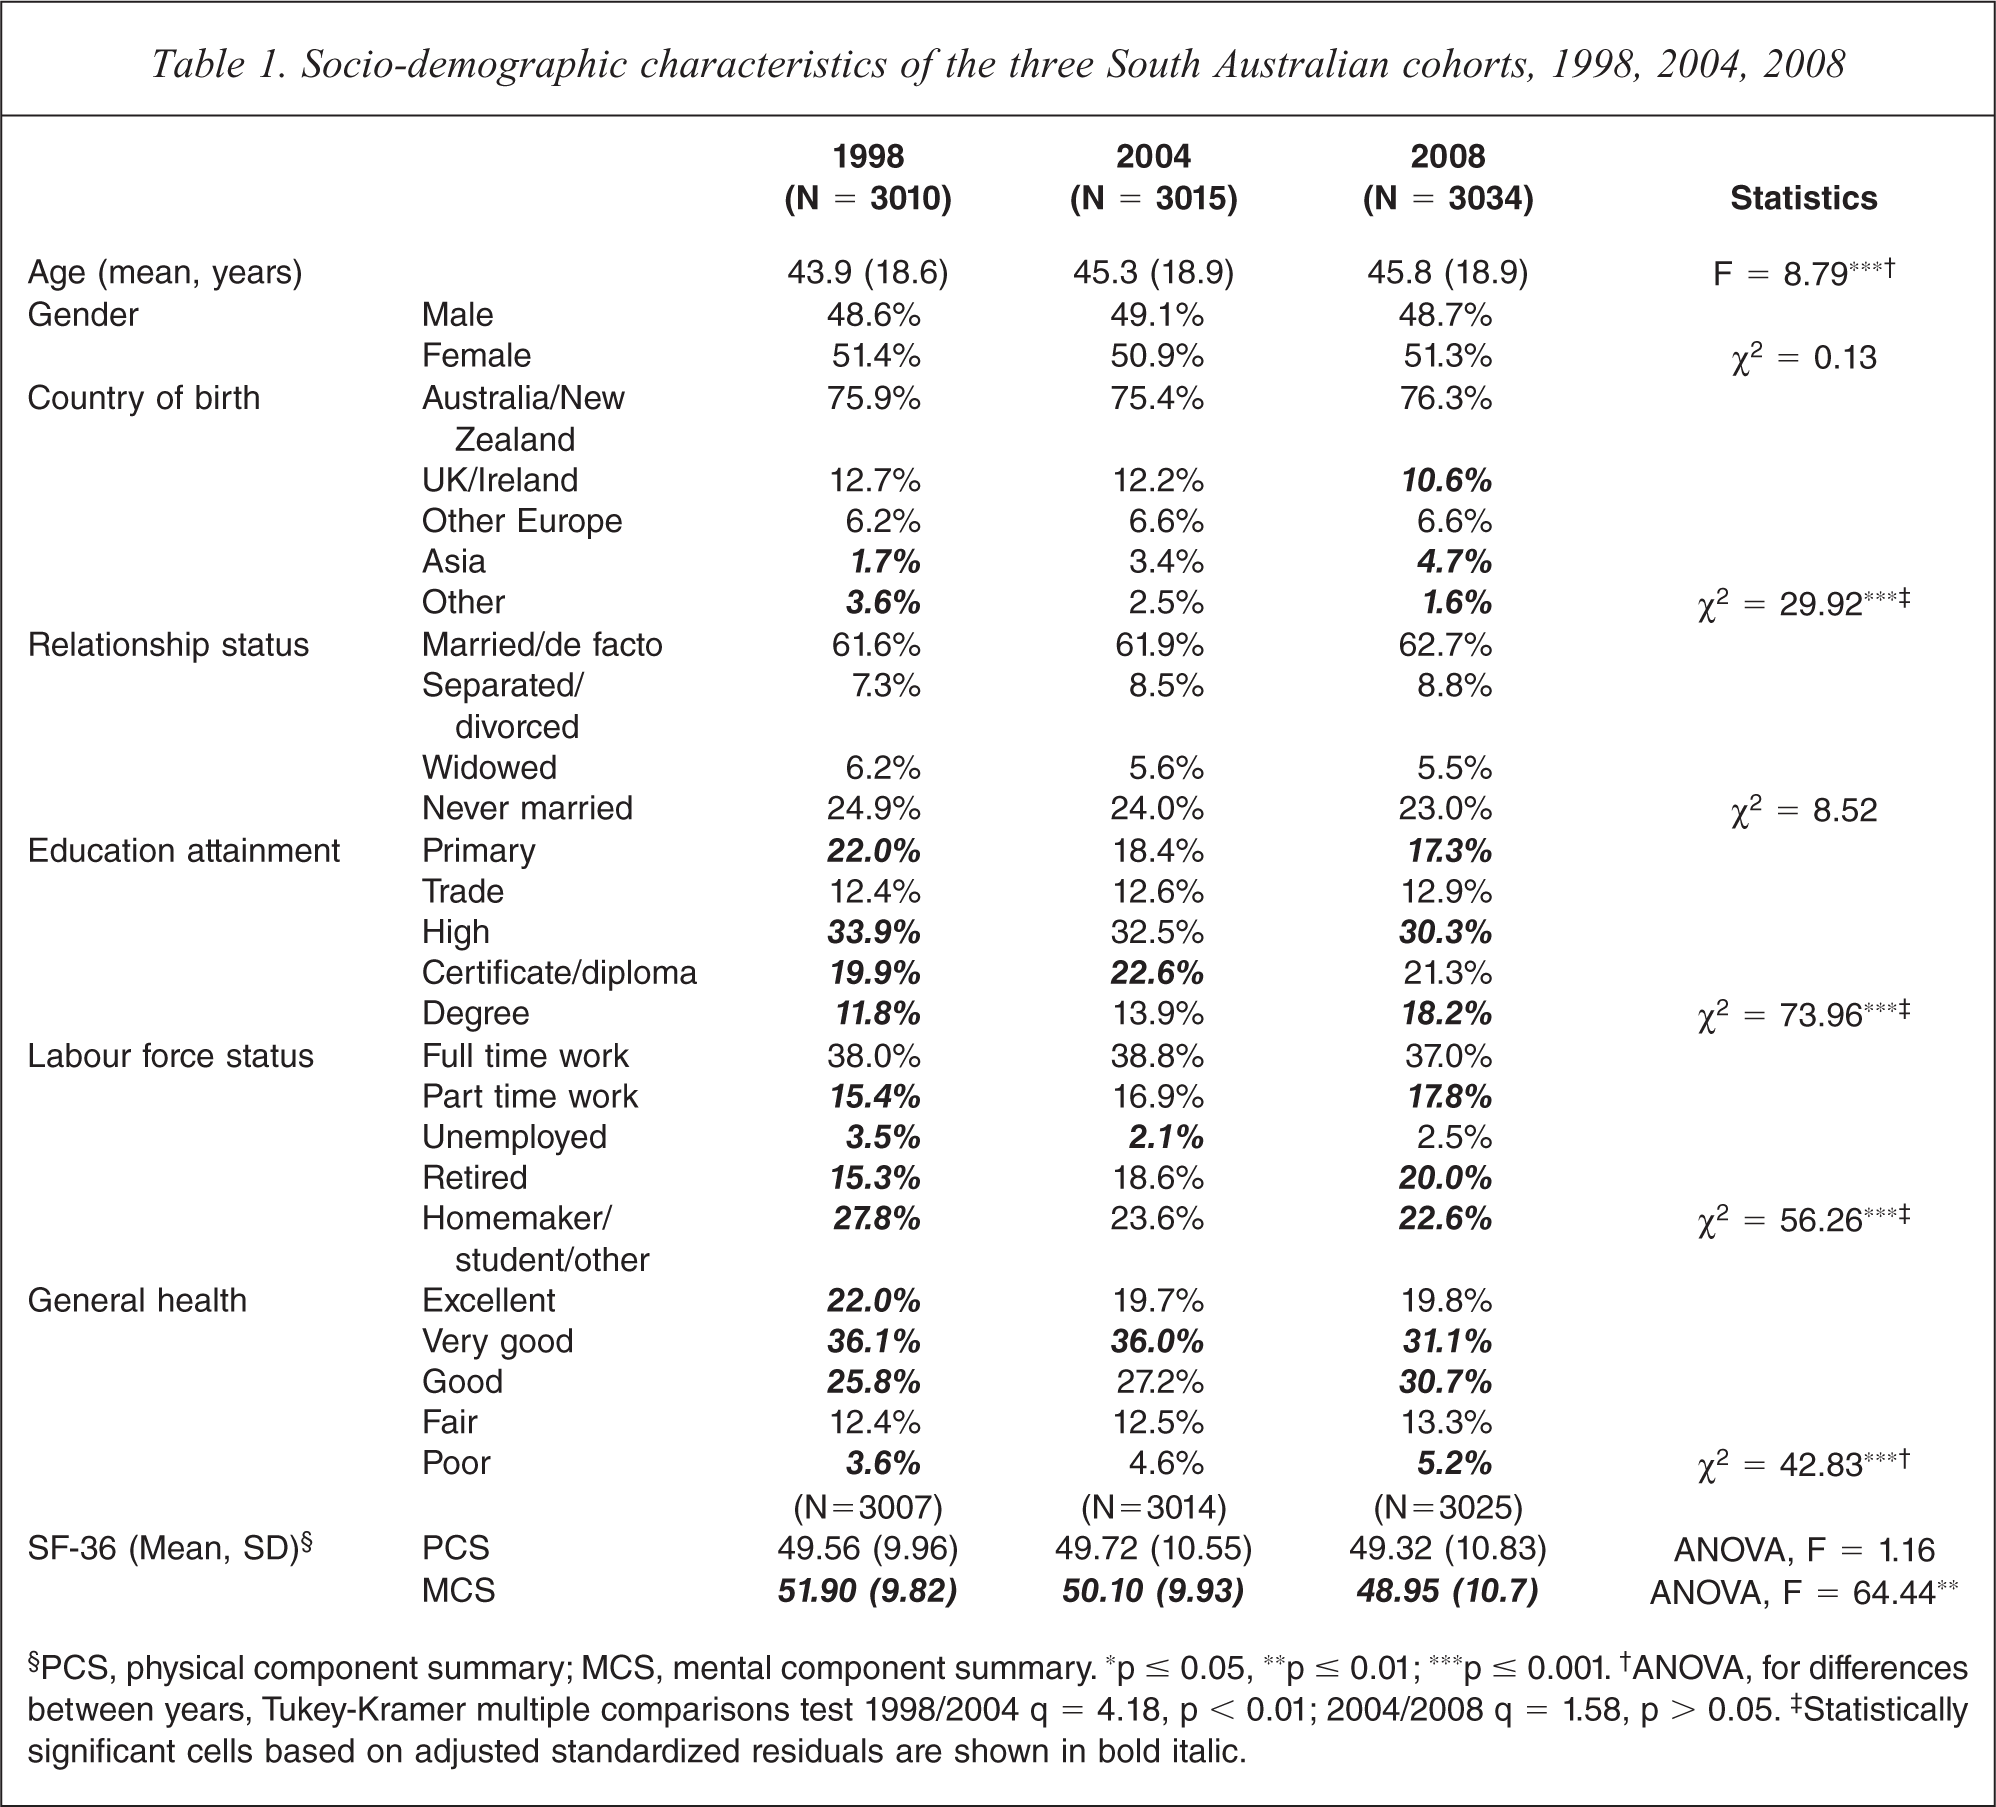
§PCS, physical component summary; MCS, mental component summary. ∗p ≤ 0.05, ∗∗p ≤ 0.01; ∗∗∗p ≤ 0.001. †ANOVA, for differences between years, Tukey-Kramer multiple comparisons test 1998/2004 q = 4.18, p < 0.01; 2004/2008 q = 1.58, p > 0.05. ‡Statistically significant cells based on adjusted standardized residuals are shown in bold italic.
Examination of the SF-36 PCS and MCS T-scores showed that there was no statistically significant difference in physical health between 1998 and 2008, but there was a significant decline in mental health over that period. Post-hoc Tukey HSD analysis showed that for the MCS the mean score in 1998, 2004 and 2008 (p < 0.001 for each comparison), suggested a continuous decline across the three waves of data collection. Table 1 shows this reduction in SF-36 T-score points was −1.8 between 1998 and 2004, and −1.15 between 2004 and 2008.
There were also statistically significant differences in self-reported health status between 1998 and 2008, with adjusted standardized residuals demonstrating more cases than expected reporting excellent, very good or good health in 1998, and fewer cases than expected reporting very good and more cases than expected reporting good or poor health in 2008.
Table 2 shows participants’ mental health literacy classification over the three study periods. There was a statistically significant increase in the percentage of those classified with excellent mental health literacy, and a commensurate decline in the percentage with either fair or poor mental health literacy. As shown, most of the gain in mental health literacy was achieved between 1998 and 2004. When examined by age group, sex and year the data showed that the greatest gains in mental health literacy were achieved by middle-aged and older females and that the least gains were by young adults.
Mental health literacy, including proportion of participants classified with excellent mental health literacy, by age group, gender and year
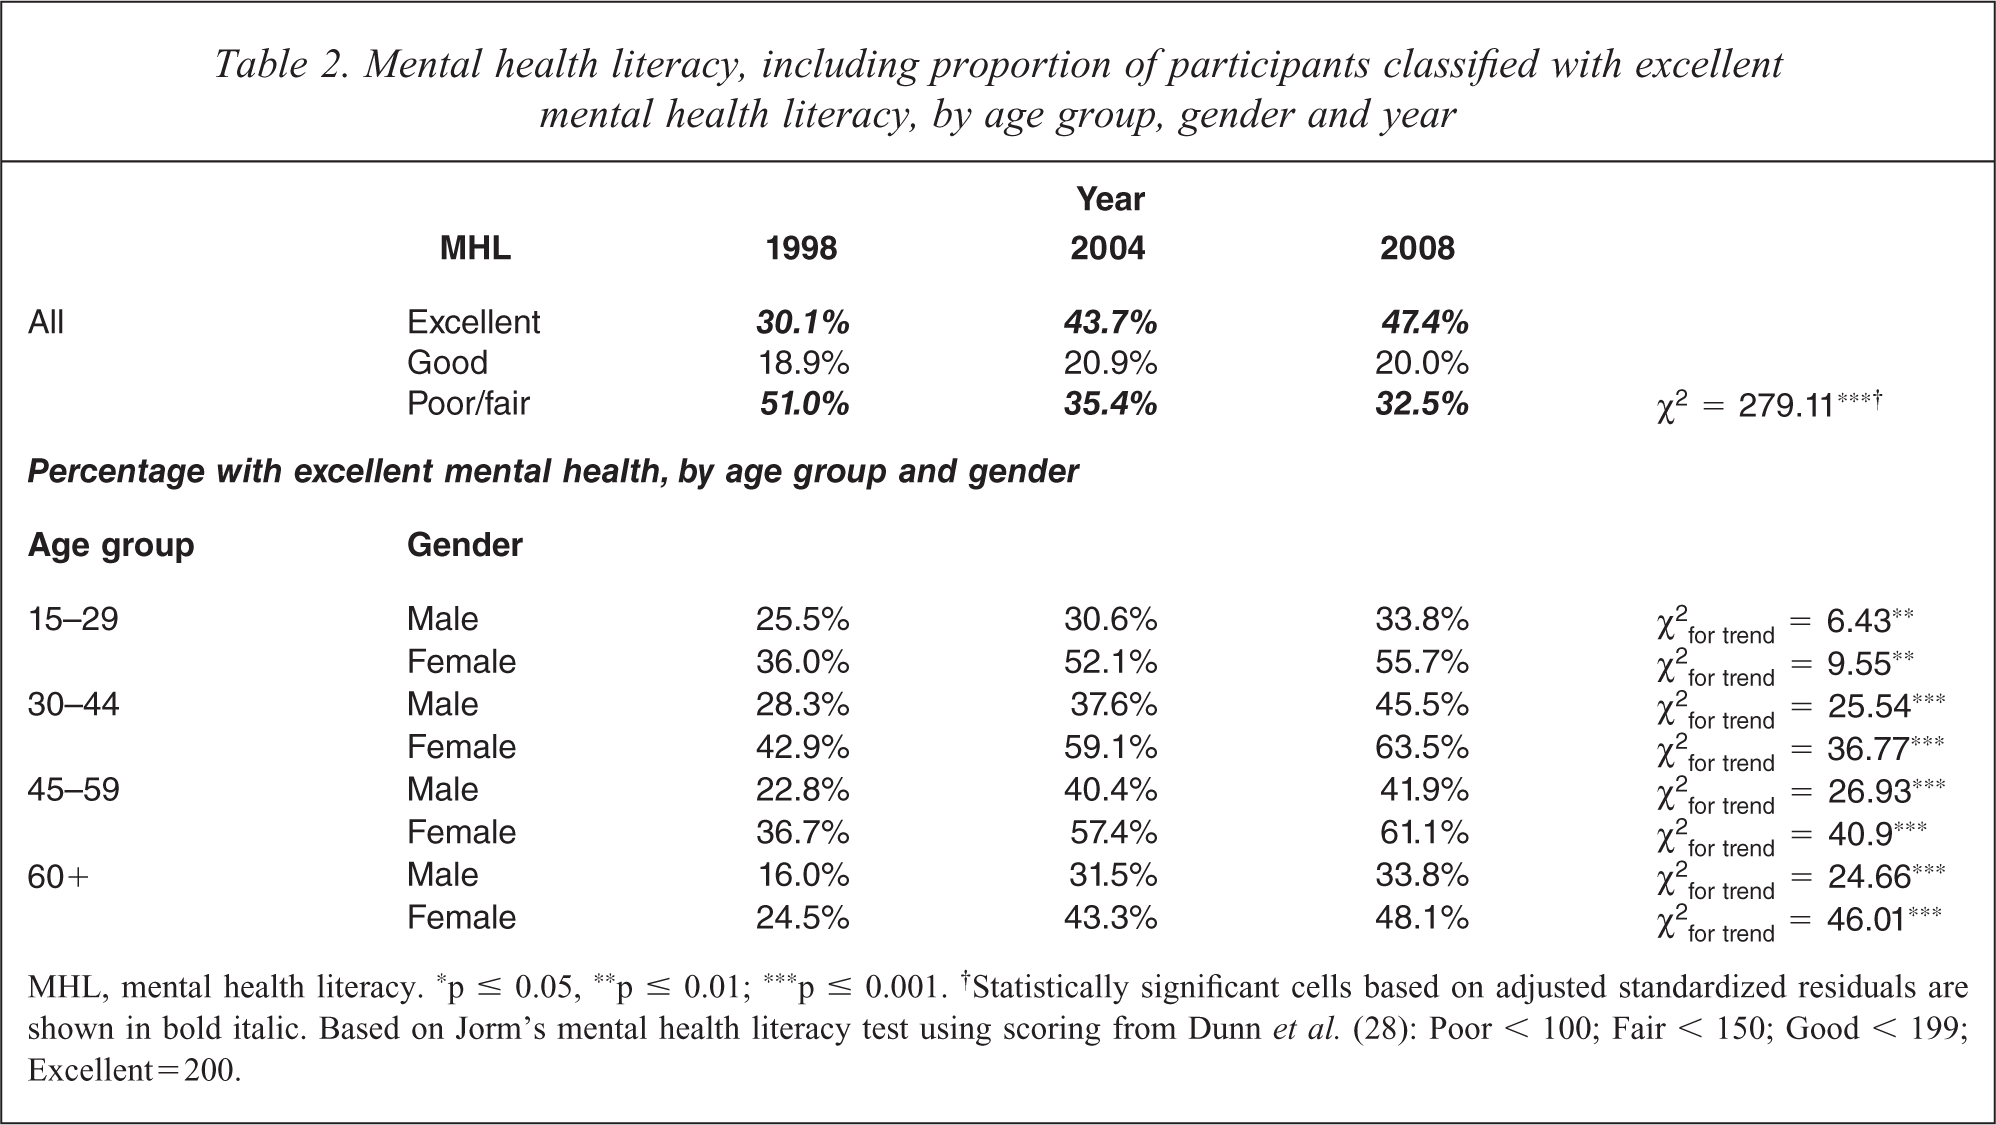
MHL, mental health literacy. ∗p ≤ 0.05, ∗∗p ≤ 0.01; ∗∗∗p ≤ 0.001. †Statistically significant cells based on adjusted standardized residuals are shown in bold italic. Based on Jorm's mental health literacy test using scoring from Dunn et al. (28): Poor < 100; Fair < 150; Good < 199; Excellent = 200.
Table 3 presents the prevalence of major depression by age group, sex and year. There was no statistically significant difference in the prevalence of major depression between 1998 and 2004: 6.8% (95%CI: 5.9%–7.7%) in 1998 and 8% (95%CI: 7%–8.9%) in 2004. However, the prevalence for the 2008 survey was statistically significantly higher than both the earlier surveys (10.3% (95%CI: 8.9%–11.2%)).
Major depression by age group, gender and year, 1998, 2004, 2008
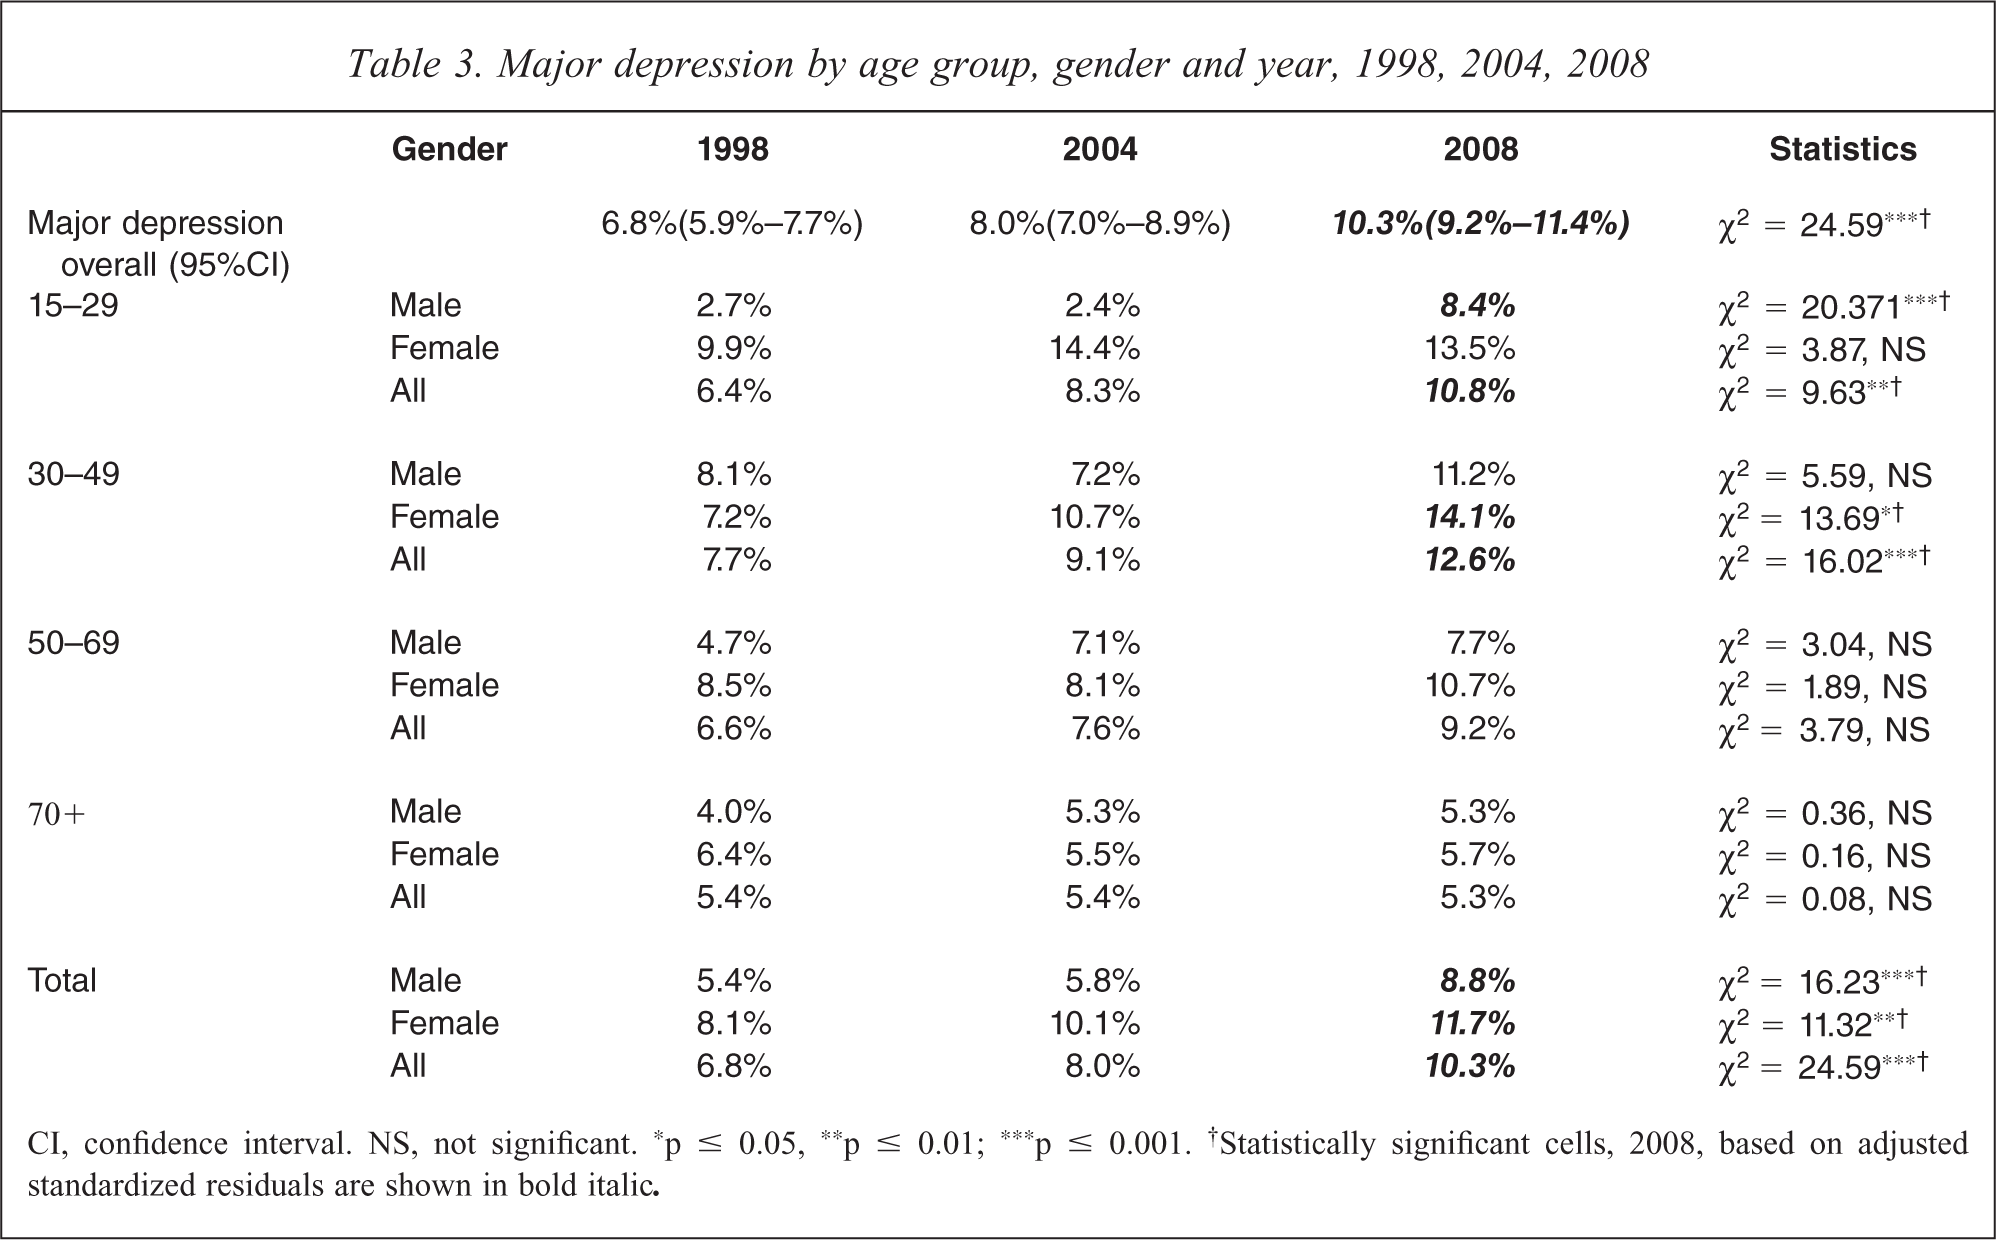
CI, confidence interval. NS, not significant. ∗p ≤ 0.05, ∗∗p ≤ 0.01; ∗∗∗p ≤ 0.001. †Statistically significant cells, 2008, based on adjusted standardized residuals are shown in bold italic.
Age and sex-specific patterns indicated that significantly more young males aged between 15–29 years met the criteria for major depression in 2008 when compared with the earlier surveys, as did females aged 30–49 years. There were no statistically significant results for any other age group. The changes in these sub-groups, however, were sufficient for there to be an overall statistically significant increase in the prevalence of depression.
Logistic regression was used to examine the predictors of major depression (Table 4). After adjustment for the other predictors in the model, the strongest predictor of major depression was self-reported general health status. When compared with those in excellent or very good health, those with good health were 2.5 times more likely to meet the criteria for the delineation of major depression; those with fair health almost 9 times more likely; and those who reported being in poor health were over 20 times more likely to meet the criteria. Females were 42% more likely than males to be classified with major depression. When compared with 70+ year olds, those aged 15–29 were almost three times more likely to be classified with major depression; those aged 30–49 years were over four times more likely; and those aged 50–69 years were twice as likely. Those who were not partnered were 66% more likely to suffer major depression than the partnered, and those who were unemployed or out of the workforce were 85% more likely to be classified with major depression. Mental health literacy was inversely associated with major depression, with those with poor/fair mental health literacy being 37% less likely to be classified with major depression. Finally, there was no significant increase in major depression between 1998 and 2004, whereas when compared with the 1998 cohort, 2008 participants were 25% more likely to be classified with major depression.
Predicting major depression
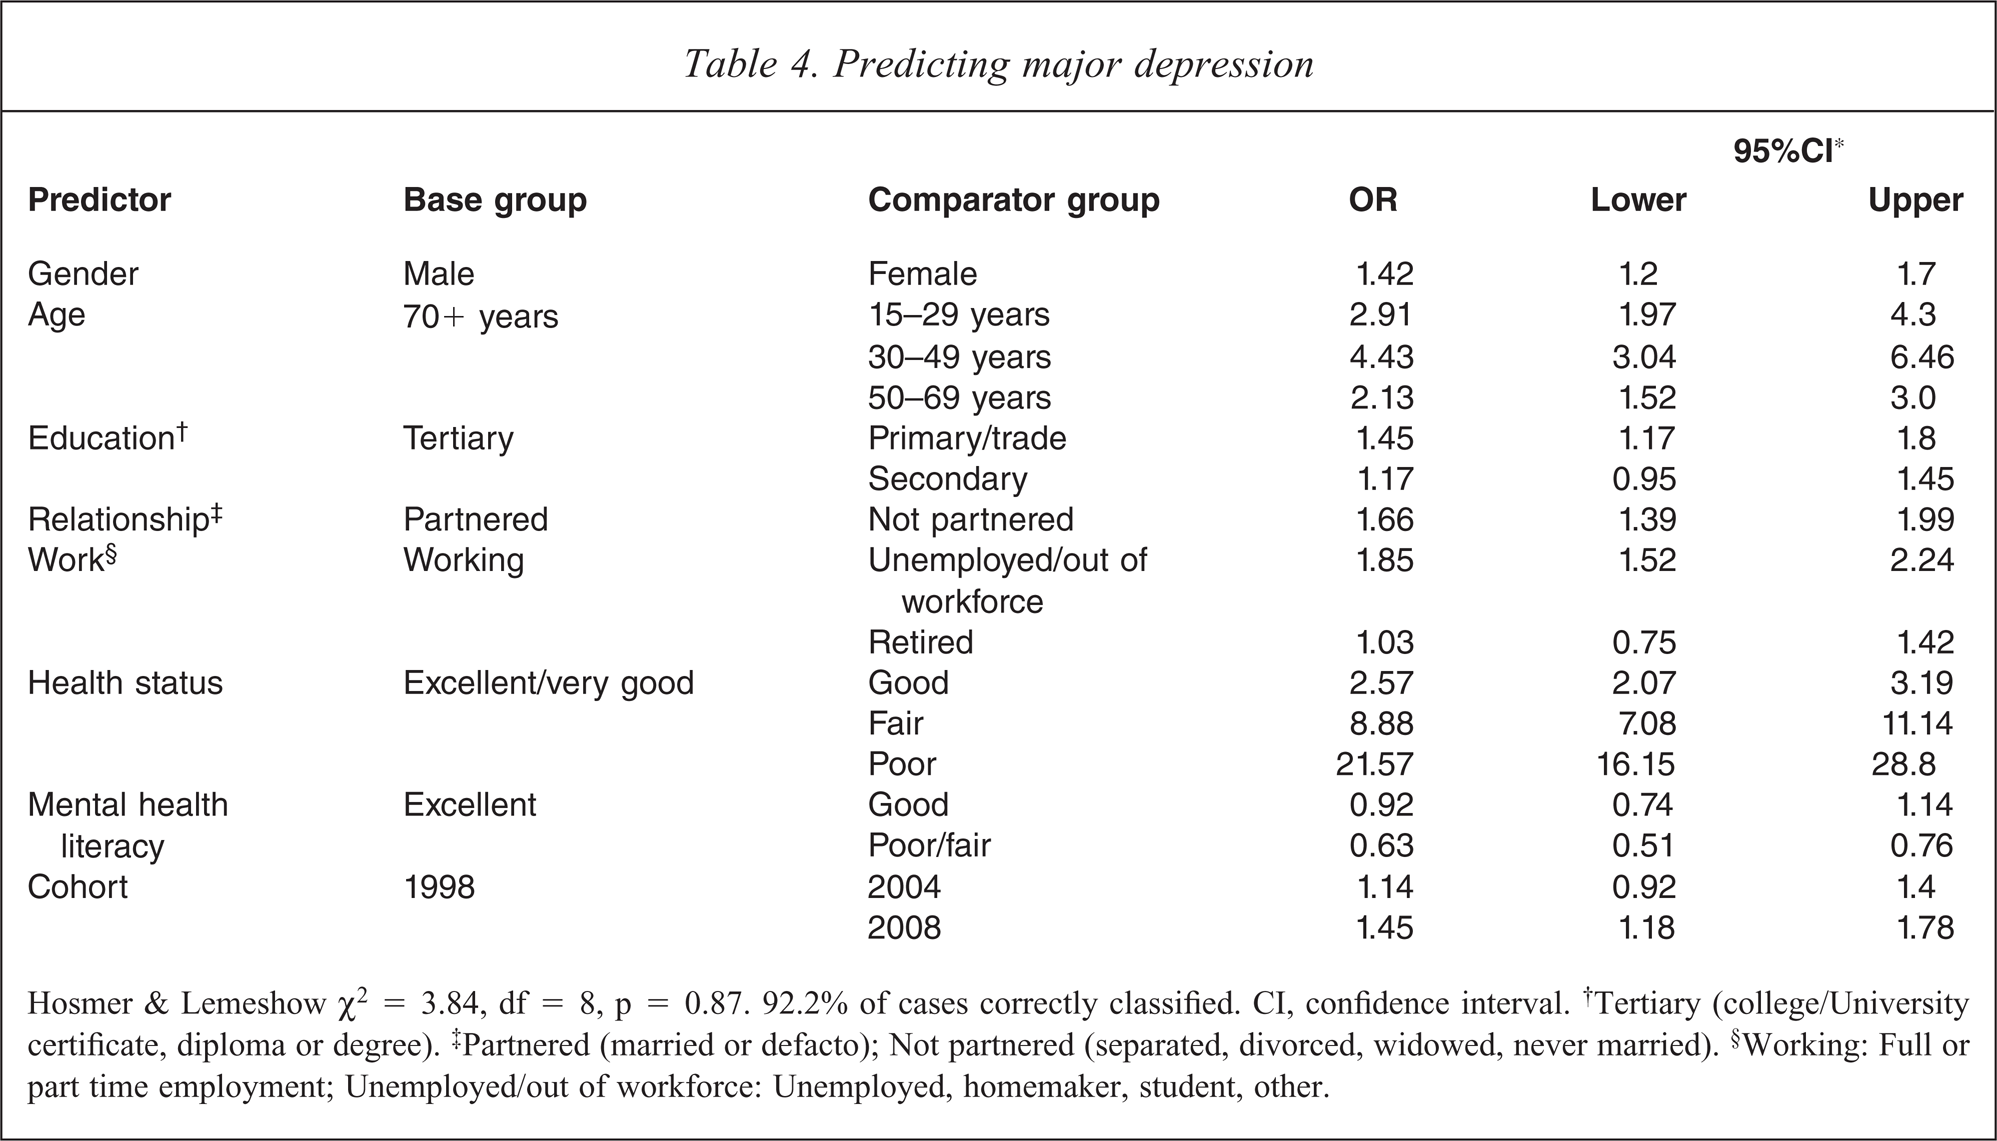
Hosmer & Lemeshow χ2 = 3.84, df = 8, p = 0.87. 92.2% of cases correctly classified. CI, confidence interval. †Tertiary (college/University certificate, diploma or degree). ‡Partnered (married or defacto); Not partnered (separated, divorced, widowed, never married). §Working: Full or part time employment; Unemployed/out of workforce: Unemployed, homemaker, student, other.
As shown in Table 4, the key predictor of depression was general health status, in particular those reporting fair/poor health. Detailed examination of this relationship showed that among those depressed, this was a constant relationship across the three surveys (Figure 1). Therefore, the contribution of fair/poor health, as a proportion of those with depression, was entirely a function of changes in the proportion of cases reporting fair/poor general health.
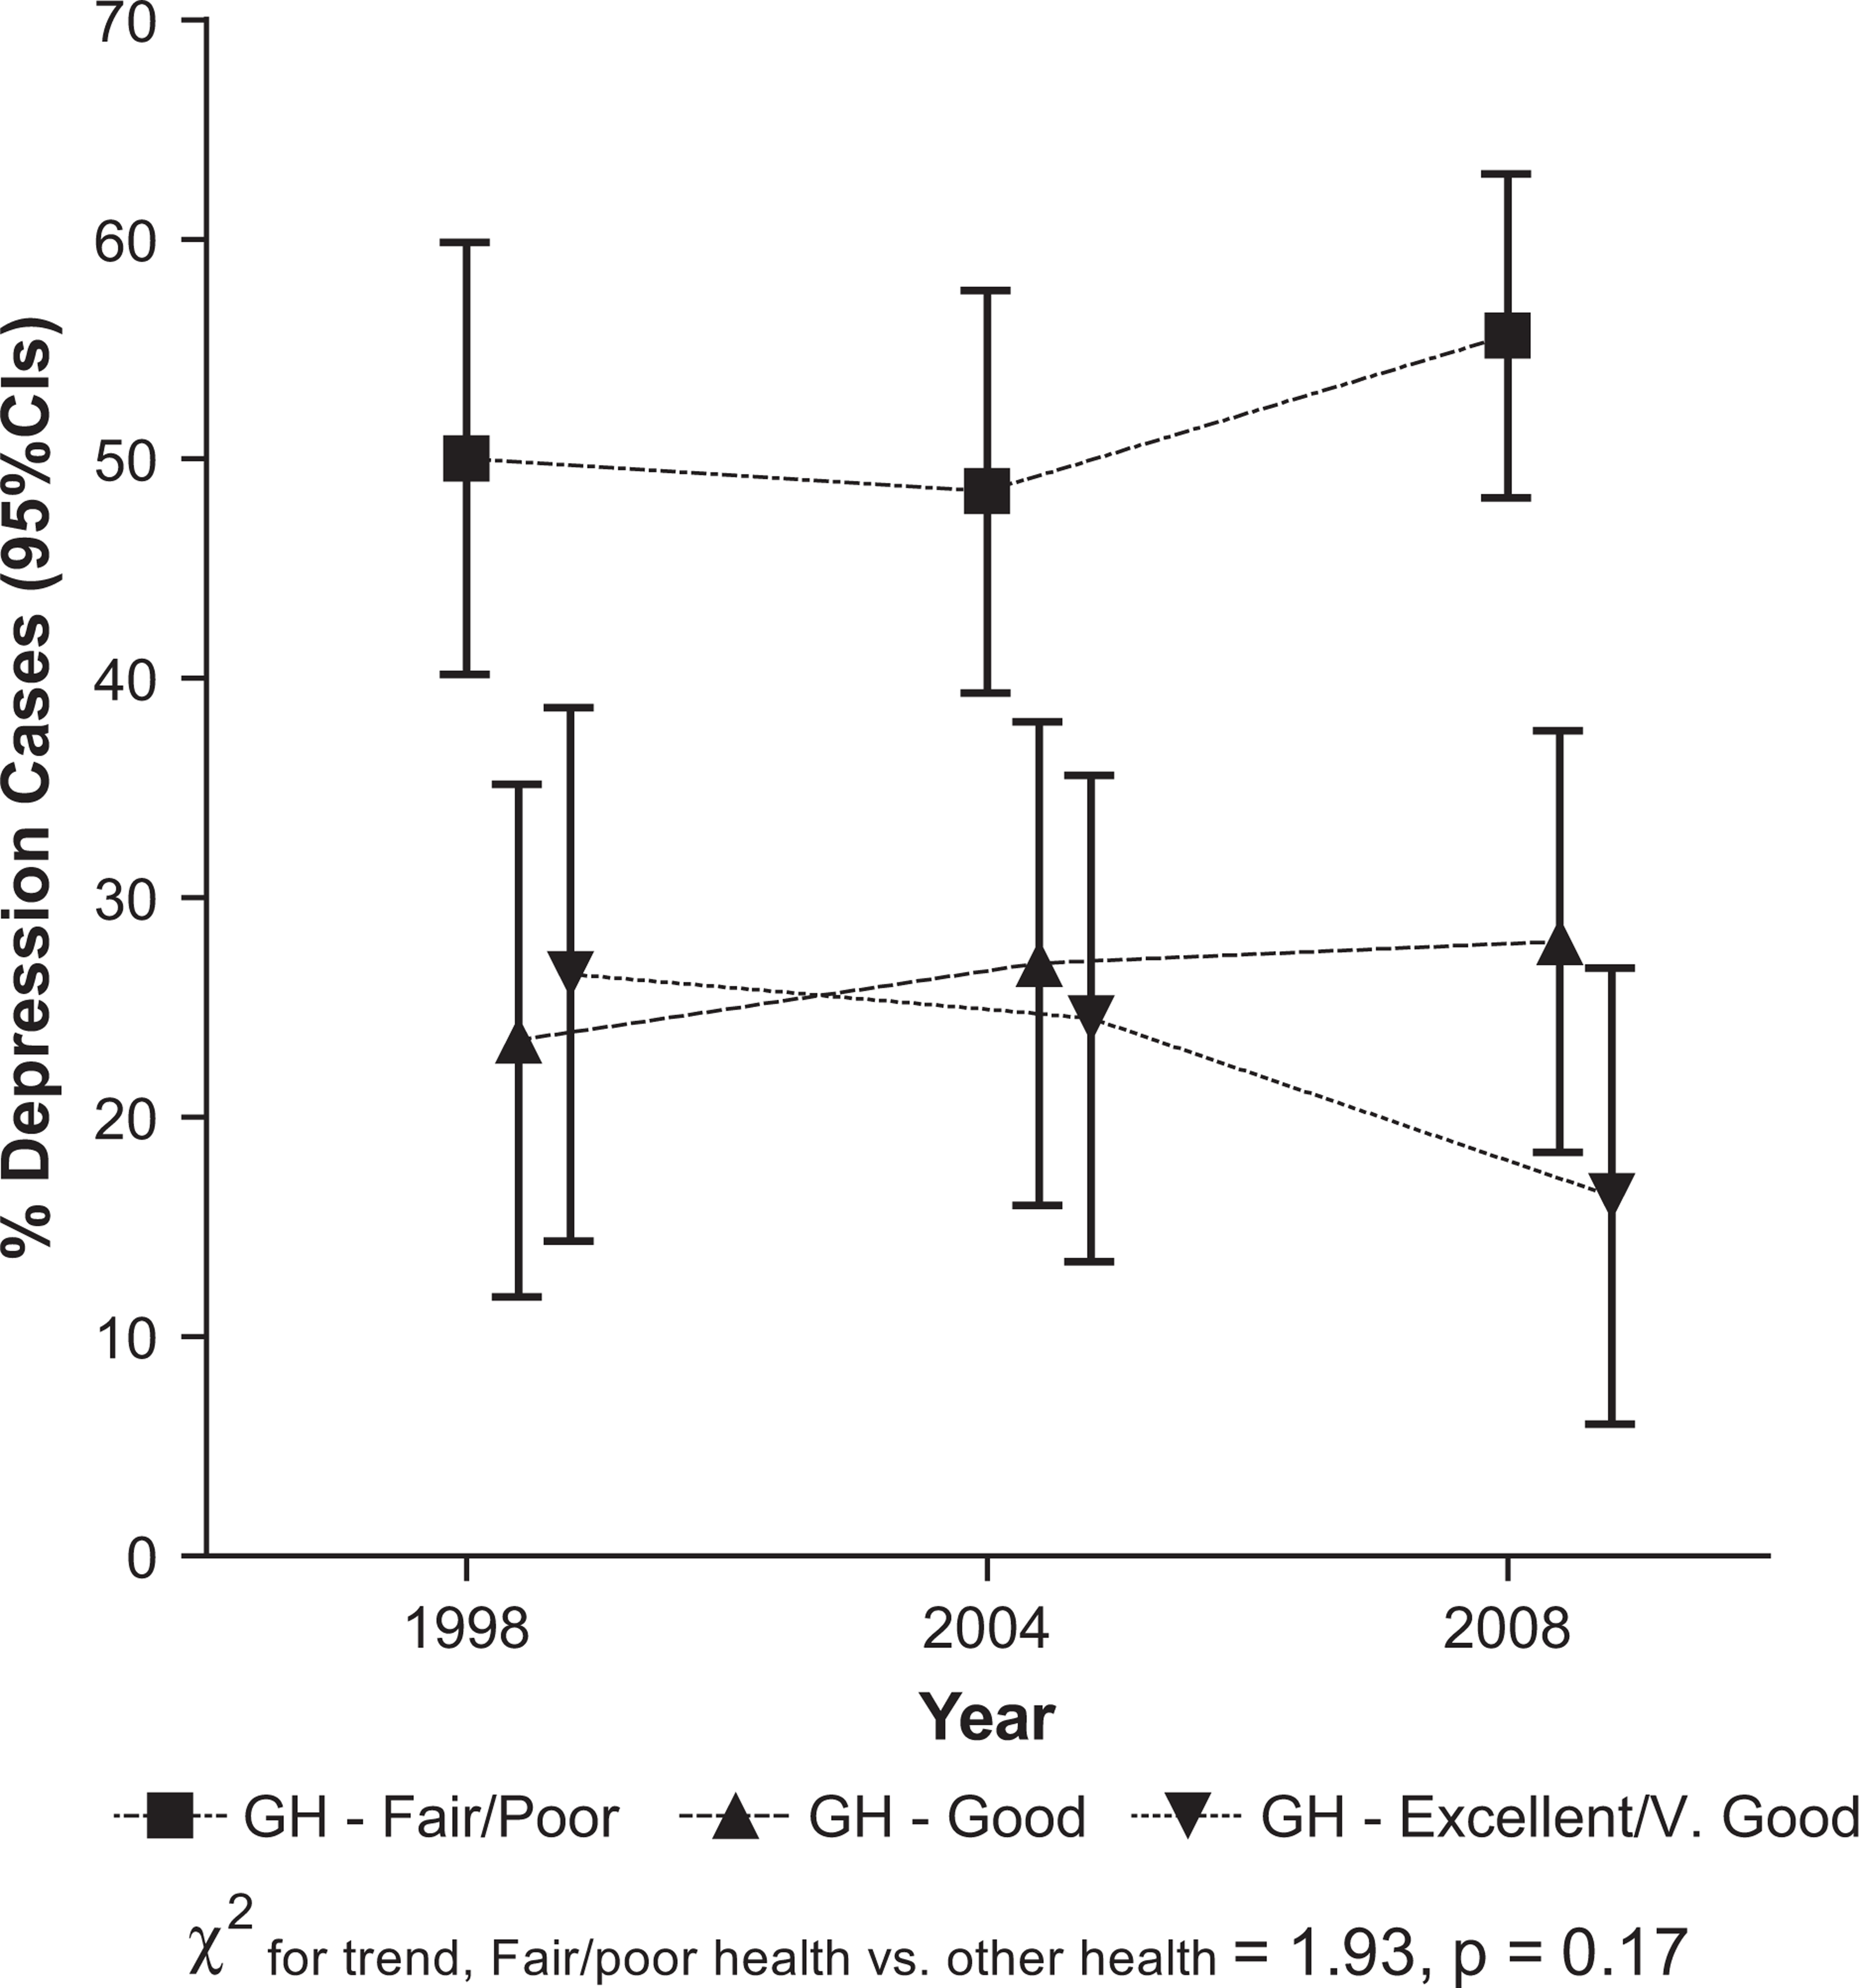
Percentage of depressed cases by general health (GH) status, by year.
This can be contrasted with the association between excellent mental health literacy and depression. In 1998 the percentage of those classified with depression among those with excellent mental health literacy was 31%, rising to 58% in 2004 and falling slightly to 54% in 2008. Analysis of these data showed that there was no significant difference in proportions of depression caseness by mental health literacy status in 1998, but by 2004 those with excellent mental health literacy were significantly more likely to be classified with depression than those with either good or fair/poor mental health literacy, a situation that remained unchanged in the 2008 survey. These data directly parallel the gains over time in mental literacy described above, where most of the gain in the proportion of the depressed occurred between 1998 and 2004, and this trend was statistically significant, as shown in Figure 2. This indicates that the contribution of excellent mental health literacy increased over time above what would be expected based on a fixed proportion, like Figure 1 shows for general fair/poor health.
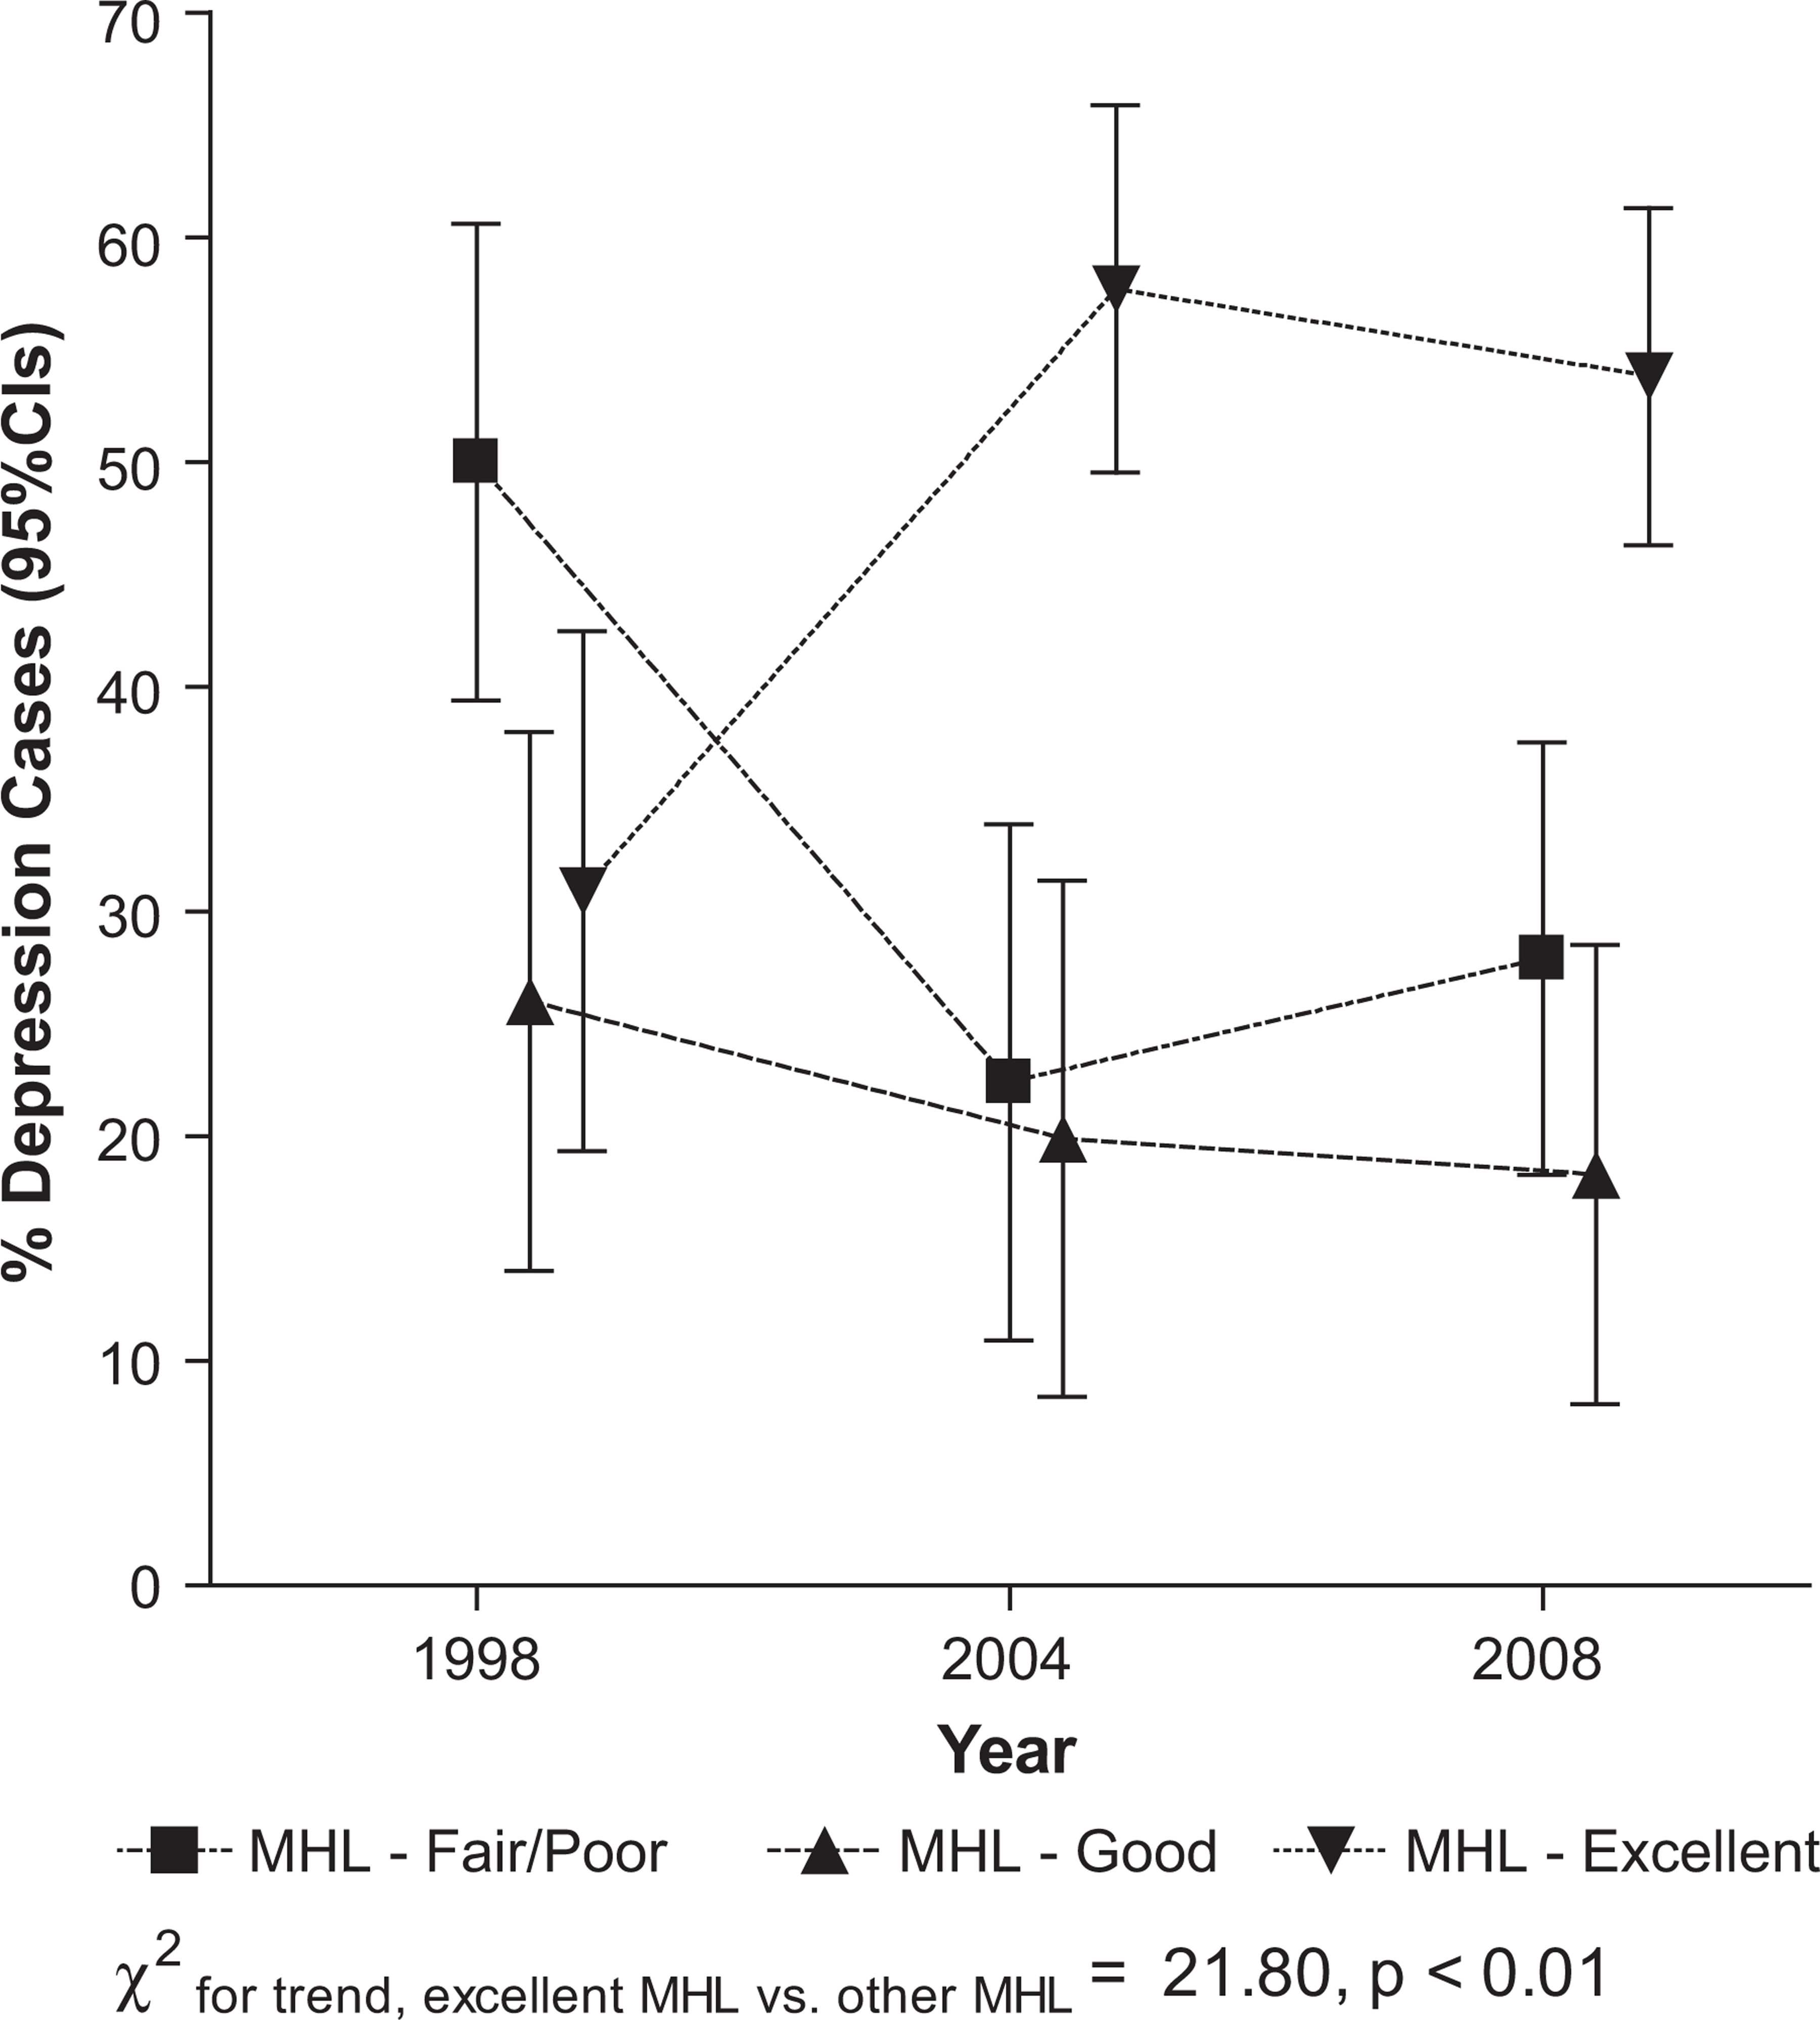
Percentage of depressed cases by mental health literacy (MHL) status by year.
To more fully understand the relationship between mental health literacy and depression, the logistic regression model in Table 4 was re-run, excluding mental health literacy. The cohort effect was strengthened; when compared with the 1998 cohort the probability of depression for 2004 was OR = 1.22 (95%CI: 0.99–1.51) and for 2008 OR = 1.57 (95%CI: 1.29–1.92), suggesting confounding between mental health literacy, study cohort and depression classification. These findings suggest that, after adjustment, the changes in mental health literacy accounted for 27% of the change in depression prevalence between 1998 and 2008.
Discussion
This study examined major depression prevalence over a 10-year period in South Australia. Contrary to what might be expected due to an increased focus on the detection, management and treatment of mental health disorders in the last decade, we found a significant increase in major depression between 2004 and 2008 as measured by the Mood module of the PRIME-MD instrument. This was consistent with a significant reduction in mental health status as measured by the SF-36 MCS, and a significant increase in participants reporting a poor health status. The increase in major depression in 2008 occurred among younger adults aged 15–49; specifically males aged 15–29 and females aged 30–49. This increase in morbidity was notwithstanding significant gains in mental health literacy.
Before discussing these findings further, it is pertinent to reflect on potential shortcomings in this study. The differences in the response rates (1998: 82%, 2004: 76%, and 2008: 73%) could have influenced the results, although these rates compare favourably with other community mental health surveys which have reported response rates between 54–80% [34–39]. That the response rate for the 2004 and 2008 surveys was similar yet that these were the two surveys where the increase in depression prevalence was observed suggests declining participation between 1998 and 2008 was not an important factor in the findings.
Those with major depression may also have been more willing to participate in the 2008 survey, possibly as a result of the various mental health literacy and treatment campaigns. Indeed, these may have made people with depression feel more comfortable participating in community surveys. We have no evidence to either support or refute this argument, but if it occurred it may have inflated the numbers of depressed cases in the 2008 survey.
It is possible that notwithstanding the random and representative nature of the three samples, differences in demographic features of the samples, for example changes in labour force participation over the years, could have influenced the results. The limitations of the mental health literacy scale are also acknowledged. Finally, it is also possible that the PRIME-MD misclassified major depression, and it is fair to note that we were unable to preclude those participants whose depressive symptoms may have been related to physical illness or substances. However, this would have affected each of the three surveys in a similar manner.
On the other hand, a strength of the research design is that the three random and representative samples were drawn in an identical manner, they were similar in size, and the instruments used and data collection methods were the same for the three surveys.
Subject to these caveats, the results show an increase in the prevalence of major depression in South Australia during the last decade from 6.8% in 1998 to 10.3% in 2008, due to significant increases in depression among young males aged 15–29 years and females aged 30–39 years (Table 3). The finding for young males is consistent with Jorm & Butterworth's [40] earlier report of significant increases in psychological distress among young males between 1995 and 2003/4; although it is noted that they did not report an increase in distress among females aged 30–39 years. After adjustment for various demographic variables, the findings from the present study represent an increase in the probability of major depression of 25% over the 10-year period. The logistic regression model demonstrated that the key predictors of major depression were being female; aged less than 70 years; having only primary school or trade education attainment; being unpartnered; being out of the workforce or unemployed; and being in good, fair or poor health as opposed to very good or excellent health. Unexpectedly, having poor or fair mental health literacy was significantly protective for major depression.
The strongest predictor of depression was reporting being in poor, fair or good health. Detailed analysis of the proportions of those with depression within the general health categories was constant over the three surveys. As shown in Table 1, between the three surveys there were significant increases in the percentage of those reporting they were in good or poor health, and significant decreases in those reporting excellent or very good health. This relationship between general health and depression is consistent with the literature.
Part of the reason the association between mental health literacy and depression was unexpected is that it occurred during a time period when there have been a number of public and professional education programmes about the identification and management of depression. Although it is possible the impact of broad national depression management initiatives, such as those noted in the introduction, was not felt in South Australia, the data showed a statistically significant overall increase in mental health literacy over the study years, consistent with our previous examination [20,21]. As shown in Table 2, the greatest increase in mental health literacy occurred among older adults, which may suggest that broad-based public health campaigns have selective audiences. However, our previous detailed analyses of changes in mental health literacy demonstrated that most change had occurred between 1998 and 2004, and some negative changes had occurred between 2004 and 2008, including a reduction in confidence regarding the helpfulness of health professionals [21]. Indeed, it is possible that the services for the provision of mental health care in South Australia have not been able to implement treatment strategies that in rigorous research settings have been demonstrated to be effective, or at the very least, that the public perceive a deficiency in those services.
The inverse relationship between mental health literacy and major depression with those with poor/fair mental health literacy being 37% less likely to have been classified as having major depression raises the possibility that the effect of publicity aimed at increasing mental health literacy has been to create greater awareness of the classic symptoms of major depression, leading to an increase in acknowledgement of those symptoms which lead to the diagnosis of that condition. The evidence presented in Figure 2 is strongly supportive of this interpretation of the data. A concern, however, is with the apparent discrepancy between the gains in mental health literacy (Table 2) and the inverse relationship between mental health literacy and depression (Table 4). It is possible that the effect of increases in mental health literacy on the reporting of depressive symptoms are not constant across the lifespan, but a function of maturity and experience. If this hypothesis is true, it would be expected, for example, that small shifts in mental health literacy awareness in younger adults may result in larger reporting of symptoms when compared with older adults, because mental health is known to improve over the lifespan [31,32,34–39], perhaps due to a decrease in negative affect [41].
Our findings are not consistent with the results of the 2007 National Survey of Mental Health and Wellbeing, which showed that Australia-wide major depression prevalence declined from 5.1% in 1997 to 4.1% in 2007 [42,43]. It is, however, possible that this apparent decline in depression prevalence was a function of the different versions of the CIDI used in the two surveys: in 1997 the focus was on 12-month symptoms, whereas the 2007 ABS survey focused on lifetime symptoms from which 12-month prevalence rates were extracted. Our findings are also not consistent with those reported for the national Access to Allied Psychological Services project, which showed a range of beneficial outcomes [11]. It should be noted, however, that these outcomes were subject to a participation rate of 5%, which may have invalidated generalizability of the study findings.
The question must be posed as to whether these data for major depression are credible, and if so, what do they mean? It is fair to acknowledge that they are at the upper range of figures published for community-based studies, and there has been debate about the significance of such reports. For example, Mulder [44] has posed the question: ‘An epidemic of depression or the medicalization of unhappiness?’ and Parker [45] has referred to major depression as a ‘catch all’ diagnosis. In a similar way, Horwitz & Wakefield [46] have argued that depression delineated through standard checklists conflates the prevalence of depression rather than interpreting symptoms simply as a reflection of sadness. On the other hand, while acknowledging the need for new clinical models with staging perspectives to guide appropriate interventions, Hickie has argued that many with significant depressive conditions are still missing out on diagnosis and treatment [45].
Notwithstanding possible reasons for these results, they do not support the findings from a review of 69 primary prevention programmes from around the world aimed at reducing depression or depressive symptoms, i.e. that ‘an 11% improvement in depressive symptoms can be achieved through prevention programs’ [47]. It is fair to state that this conclusion was based on a meta-analysis of more focused small studies, rather than population data. However, the results are congruent with the comment of Whitty and Gilbody [48], who reviewed the UK National Institute for Clinical Excellence (NICE) depression guidelines and concluded that ‘the implication is clear for the NICE depression guidelines; local publicity and educational events, audit of the guidelines and review by the Healthcare Commission will not be enough to help more people with depression get better’. Indeed, the data from this study suggest that the net effect of an increase in mental health literacy may be to exacerbate the situation.
The present results are also congruent with the comments of Heath who referred to investment in health care producing a J-curve, where ‘for most of the curve, the more money spent, the better the health outcomes, but after a certain point, the more spending and the more emphasis on health at the expense of other areas of human activity and achievement, the worse overall health becomes’ [49]. This is also consistent with the acerbic comment of Sackett who, in another context, wrote of the ‘arrogance of preventive medicine’ in promulgating measures whose outcomes were not supported by rigorous scientific studies [50].
If in fact community and professional educational programmes have influenced the present results it is by no means clear whether the change can be considered beneficial to the community, or what was intended. Ideally, a public health initiative would result in a reduction in the number of cases, and an improvement in health. Neither appears to have occurred. Indeed, it may be timely to focus not only on the presence of symptoms, but also on their significance. Thus, it may be appropriate to inject an element of tolerance of symptoms of major depression as part of everyday existence, not only in individuals in the community, but also among clinicians using standard checklists for depression delineation [46].
In this regard it is pertinent to reflect that while the PRIME-MD instructions were for symptoms to only be acknowledged if experienced nearly every day for the last two weeks, the publicity given to such symptoms may well have resulted in an uncritically increased willingness of individuals in the community to endorse such symptoms without reflecting on broader issues of everyday problems of living. Indeed this may be why there has been an increase in people endorsing symptoms of major depression.
Conclusions
There is increasing interest in demonstrating the overall effectiveness of interventions for psychiatric illnesses [41,42]. However, Chisholm recently observed that ‘Remarkable as it may sound, no country to date has been able to clearly link mental health strategic policy or investment decisions to a credible, consistent and evidence-based assessment of what interventions actually work best and at what cost’ [51]. While it is reassuring that there are theoretical data derived from research settings that indicate that there should be improvements [4–7], whether such improvements can be translated to the community as a whole has yet to be demonstrated. At the very least, the present results fail to do so. Indeed, it is difficult to avoid the suggestion that as a public health initiative, the broad based programmes have been a failure in terms of the bottom-line outcome, even though the processes involved have received enthusiastic endorsement [52].
This research should not be utilized as a reason to discontinue recent initiatives to detect and treat major depression. However, it serves as a caution to any quick fix of the problem, and to well-meaning statements by advocates for improving the outcome of treatments for depressive conditions [52]. Furthermore, it presents a challenge to future similar surveys of major depression and its associated morbidity in the community. While there is debate about the value and potential yield from such surveys of mental health [53–55], we consider that it is important that further similar surveys are conducted in order to monitor changes [56], because it may only be that sustained improvement occurs with a generational 20-year shift in community and professional awareness and in administrative and clinical practices, rather than in the relatively short time period which was the focus of this study.
Footnotes
Acknowledgements