
Abstract
During the past 10 years numerous programmes have been implemented with the aim of raising awareness and reducing the stigma associated with mental illness. The Australian Government instituted a number of policies and projects under its National Mental Health Strategy, and most of them are ongoing [1]. Professional bodies such as the Royal Australian College of General Practitioners and the Royal Australian and New Zealand College of Psychiatrists, commercial organizations such as pharmaceutical companies, and charitable organizations such as the Mental Health Foundation have also contributed with information and education campaigns. Indeed, beyondblue[2], an independent, high-profile organization, has generated significant media exposure, as has Australian Rotary Health with a range of community and workplace forums and television service announcements [3]. An integral part of the programmes that have been developed has been to enhance mental health literacy, which is defined as the ‘knowledge and beliefs about mental disorders which aid their recognition, management or prevention’ [4].
It would be expected that such education programmes would have a cumulative influence, improving community knowledge about mental illness and treatment options, thereby reducing prevalence and severity within the population.
Although improvements in mental health literacy have been shown in Australian populations in the short-term [5–7], it remains to be seen whether improved levels are maintained [8].
The aim of the present study was to assess mental health literacy (specifically related to depression) in a South Australian population by examining levels across three points in time: 1998, 2004, and 2008. The relationships between literacy levels and demographic variables are also considered.
Method
Participants
Participants were those assessed in the South Australian Health Omnibus Survey (SAHOS) [9]; a multi-stage, systematic, clustered area sample of households, randomly selected from collection districts within the Adelaide metropolitan area and South Australian country towns with a population of 1000 people or more. SAHOS has been conducted annually since 1991 and data for the current analyses were collected in 1998, 2004, and 2008, all following the same method. Participants were selected if they were ≥15 years of age and the most recent household member to have had a birthday. Interviews were conducted in the home by trained interviewers and each dataset was weighted to provide population estimates across 5 year age groups, sex, area (metropolitan and rural), and household size to match the most recent Australian Bureau of Statistics Census or Estimated Residential Population data for South Australia. In 1998 the participant group was 48.7% male, 49.1% male in 2004, and 48.7% male in 2008. Participants’ ages ranged from 15 to 95 years in 1998 (mean = 43.86 years, SD = 18.59), 15 to 96 years in 2004 (mean = 45.29 years, SD = 18.87), and 15 to 94 years in 2008 (mean = 45.83 years, SD = 18.91).
Depression-related mental health literacy
Mental health literacy was assessed using the questionnaire devised by Jorm et al., which includes a vignette depicting either a woman (Mary) or a man (John) with classic features of depression [4]. Participants were initially asked two unprompted questions: what they thought was wrong with Mary/John, and how they thought Mary/John could best be helped. From responses to these questions, individual scores for overall depression-related mental health literacy were calculated using an algorithm described in detail elsewhere [10]. Scores ranged between 0 and 200, with higher scores representing stronger mental health literacy. Two t-tests were conducted to examine differences in the overall scores.
A series of prompted questions was also included, asking participants whether they thought various professional and pharmacological interventions would be helpful, harmful, or neither.
For each of the mental health literacy variables, differences between the weighted samples in 1998, 2004, and 2008 were compared using Pearson's χ2 test.
All analyses were conducted using SPSS version 15.0 (SPSS, Chicago, IL, USA).
Results
In 2008, 5000 households were selected for survey with 3034 participant interviews completed, resulting in a response rate of 62.8%. Sample losses were due to dwellings being vacant or business in nature (n = 170), refusal (n = 1110), contact not established (n = 407), English not spoken (n = 80), absence from the home (n = 64), illness or mental incapacity (n = 77), inability to gain access (n = 53), and ferocious dogs (n = 5). The population samples interviewed in 1998 and 2004 are described in detail elsewhere [5], but were generally comparable to the 2008 sample.
Overall depression-related mental health literacy was calculated from responses to the two unprompted questions. Comparisons showed that although there was a significant increase in overall scores between 1998 (mean = 130.78, SD = 62.70) and 2004 (mean = 150.27, SD = 57.06; t = − 12.61, p < 0.001), there was no significant difference between scores in 2004 and 2008 (mean = 151.08, SD = 61.15; t = − 0.54, p = 0.59).
Table 1 shows the extent to which respondents had experienced similar symptoms to those of John or Mary. Responses indicated that the 2008 participants, either through their own experience or the experience of a friend or family member, were significantly more likely to identify with John or Mary than were participants in 1998 and 2004. Specifically, they were significantly more likely to acknowledge having experienced similar problems to those portrayed in the vignette; to have had professional help for the problems; and to have taken, or be taking, antidepressants when compared to participants in 1998 and 2004.
Participant reports of symptom experience
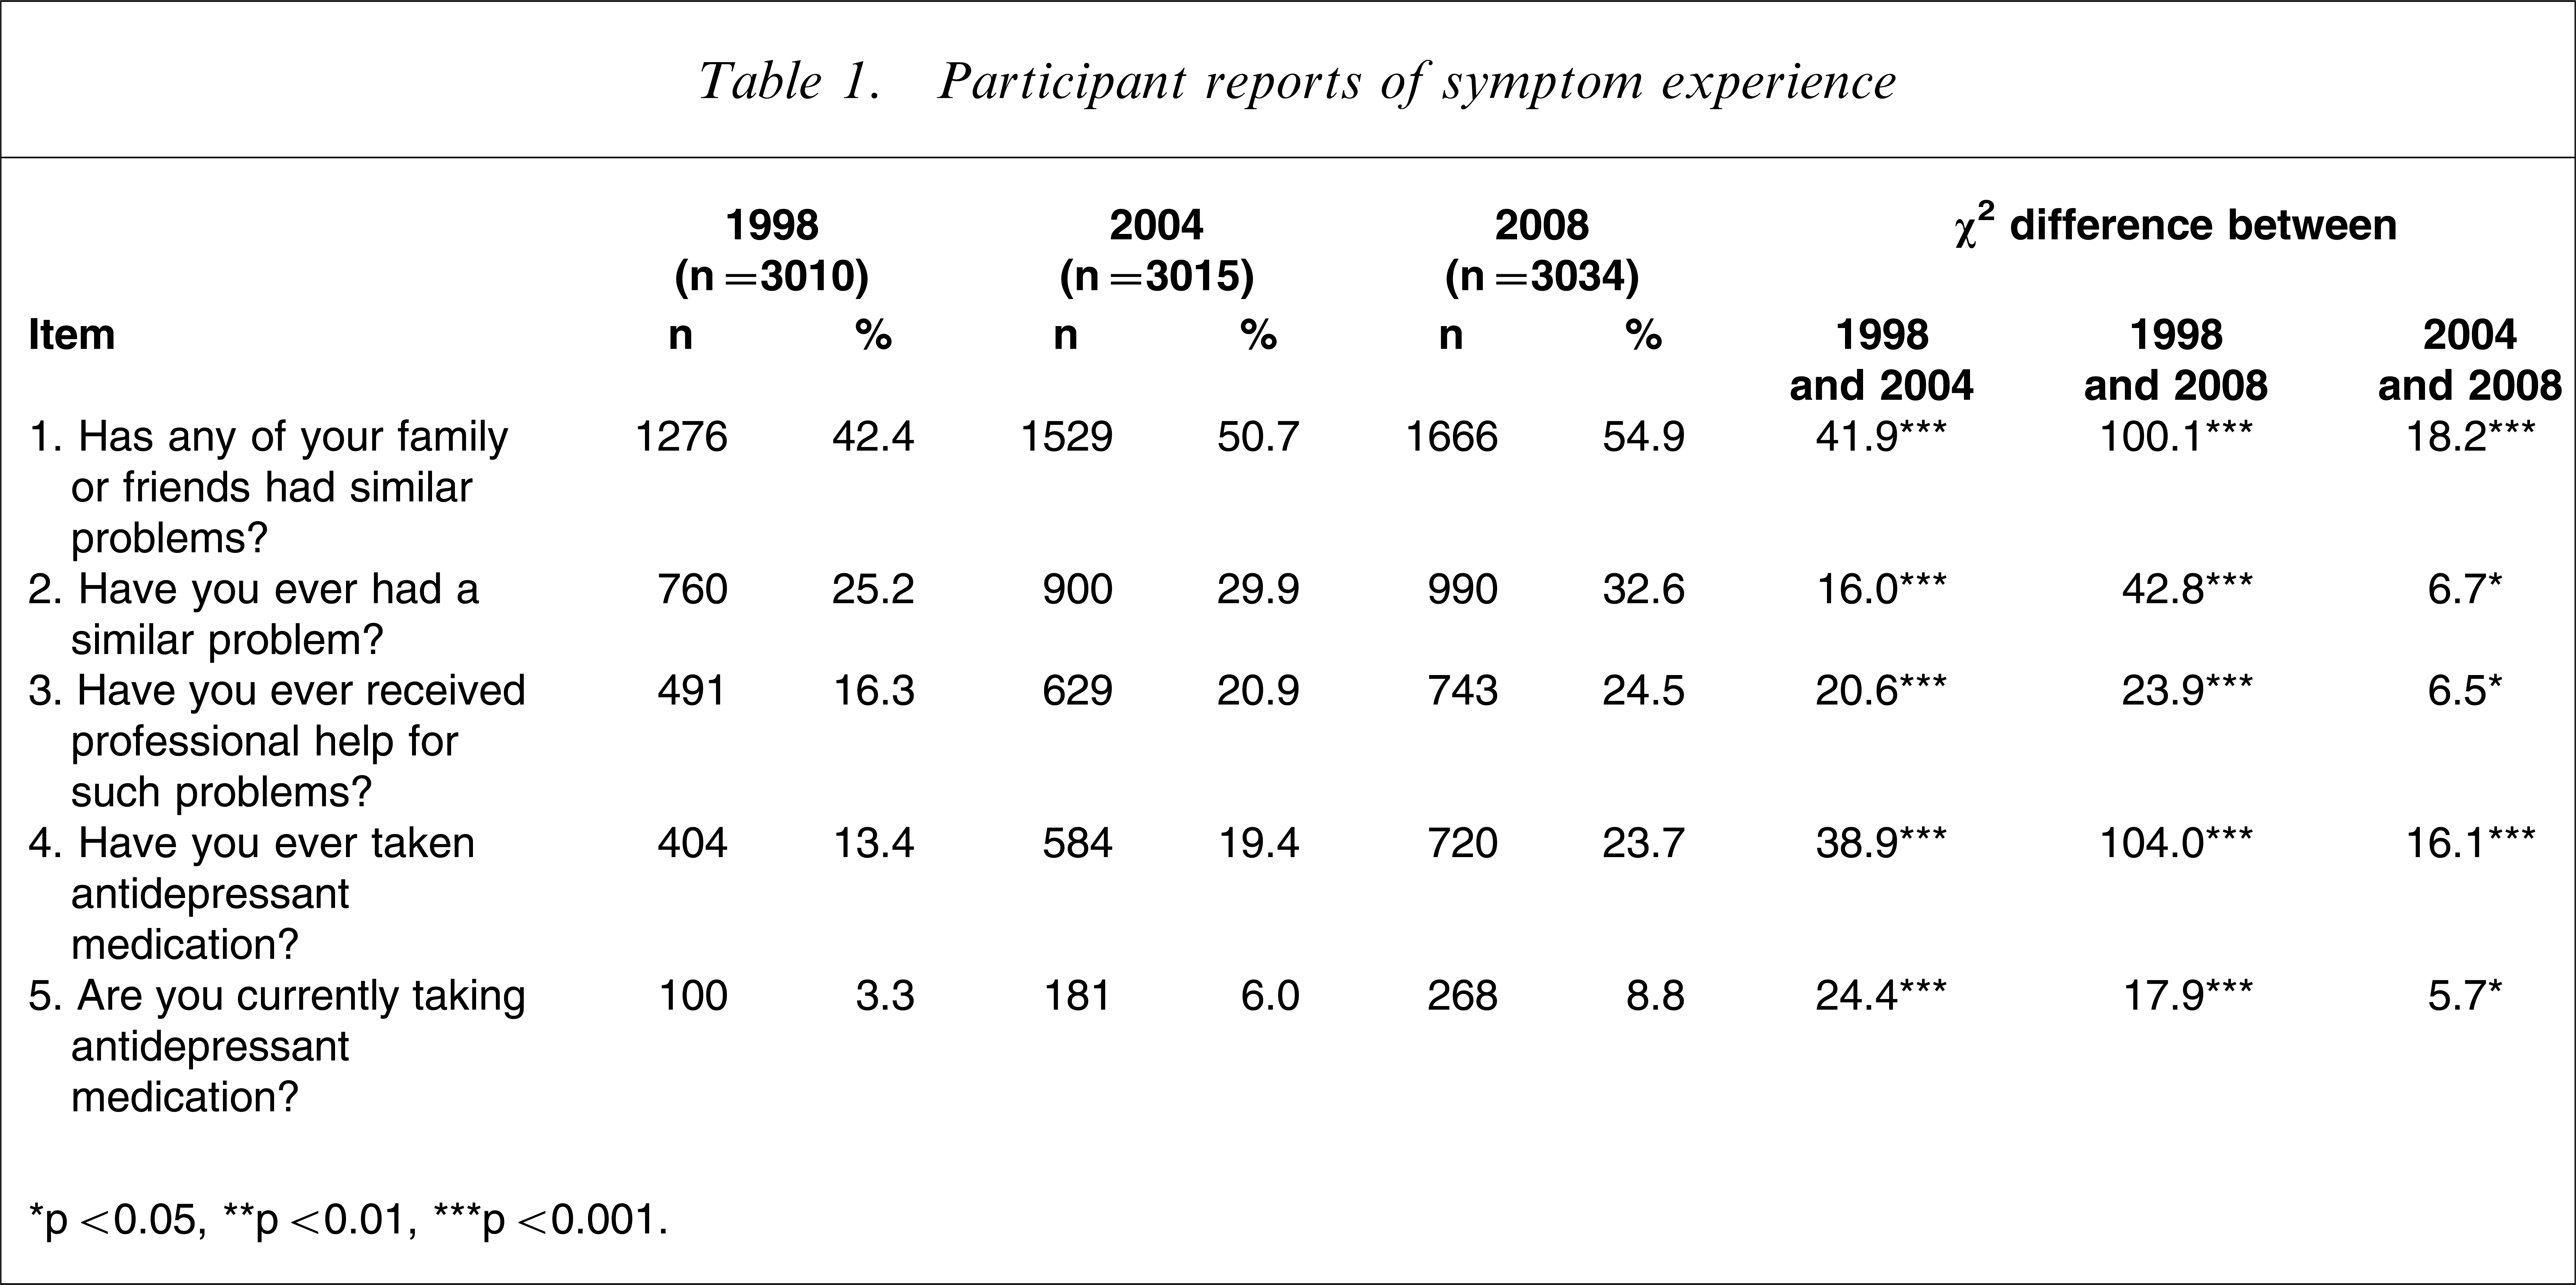
∗p < 0.05, ∗∗p < 0.01, ∗∗∗p < 0.001.
Overall perceptions of the problem described in the vignette are presented in Table 2. The results show a significant increase in the number of participants correctly describing the symptoms as those of depression. The improvement between 1998 and 2008 was large, although the trend has slowed more recently as shown by the modest, albeit statistically significant, improvement between 2004 and 2008. Other changes between 2004 and 2008 indicated that significantly more people in the latter sample believed that the symptoms could be attributed to either ‘stress’ or a ‘nervous breakdown’, although these explanations were most common in 1998. Between 1998 and 2008, significantly fewer people responded that they ‘didn't know’ what the vignette symptoms were likely to be.
Comparison of participant classifications of symptoms
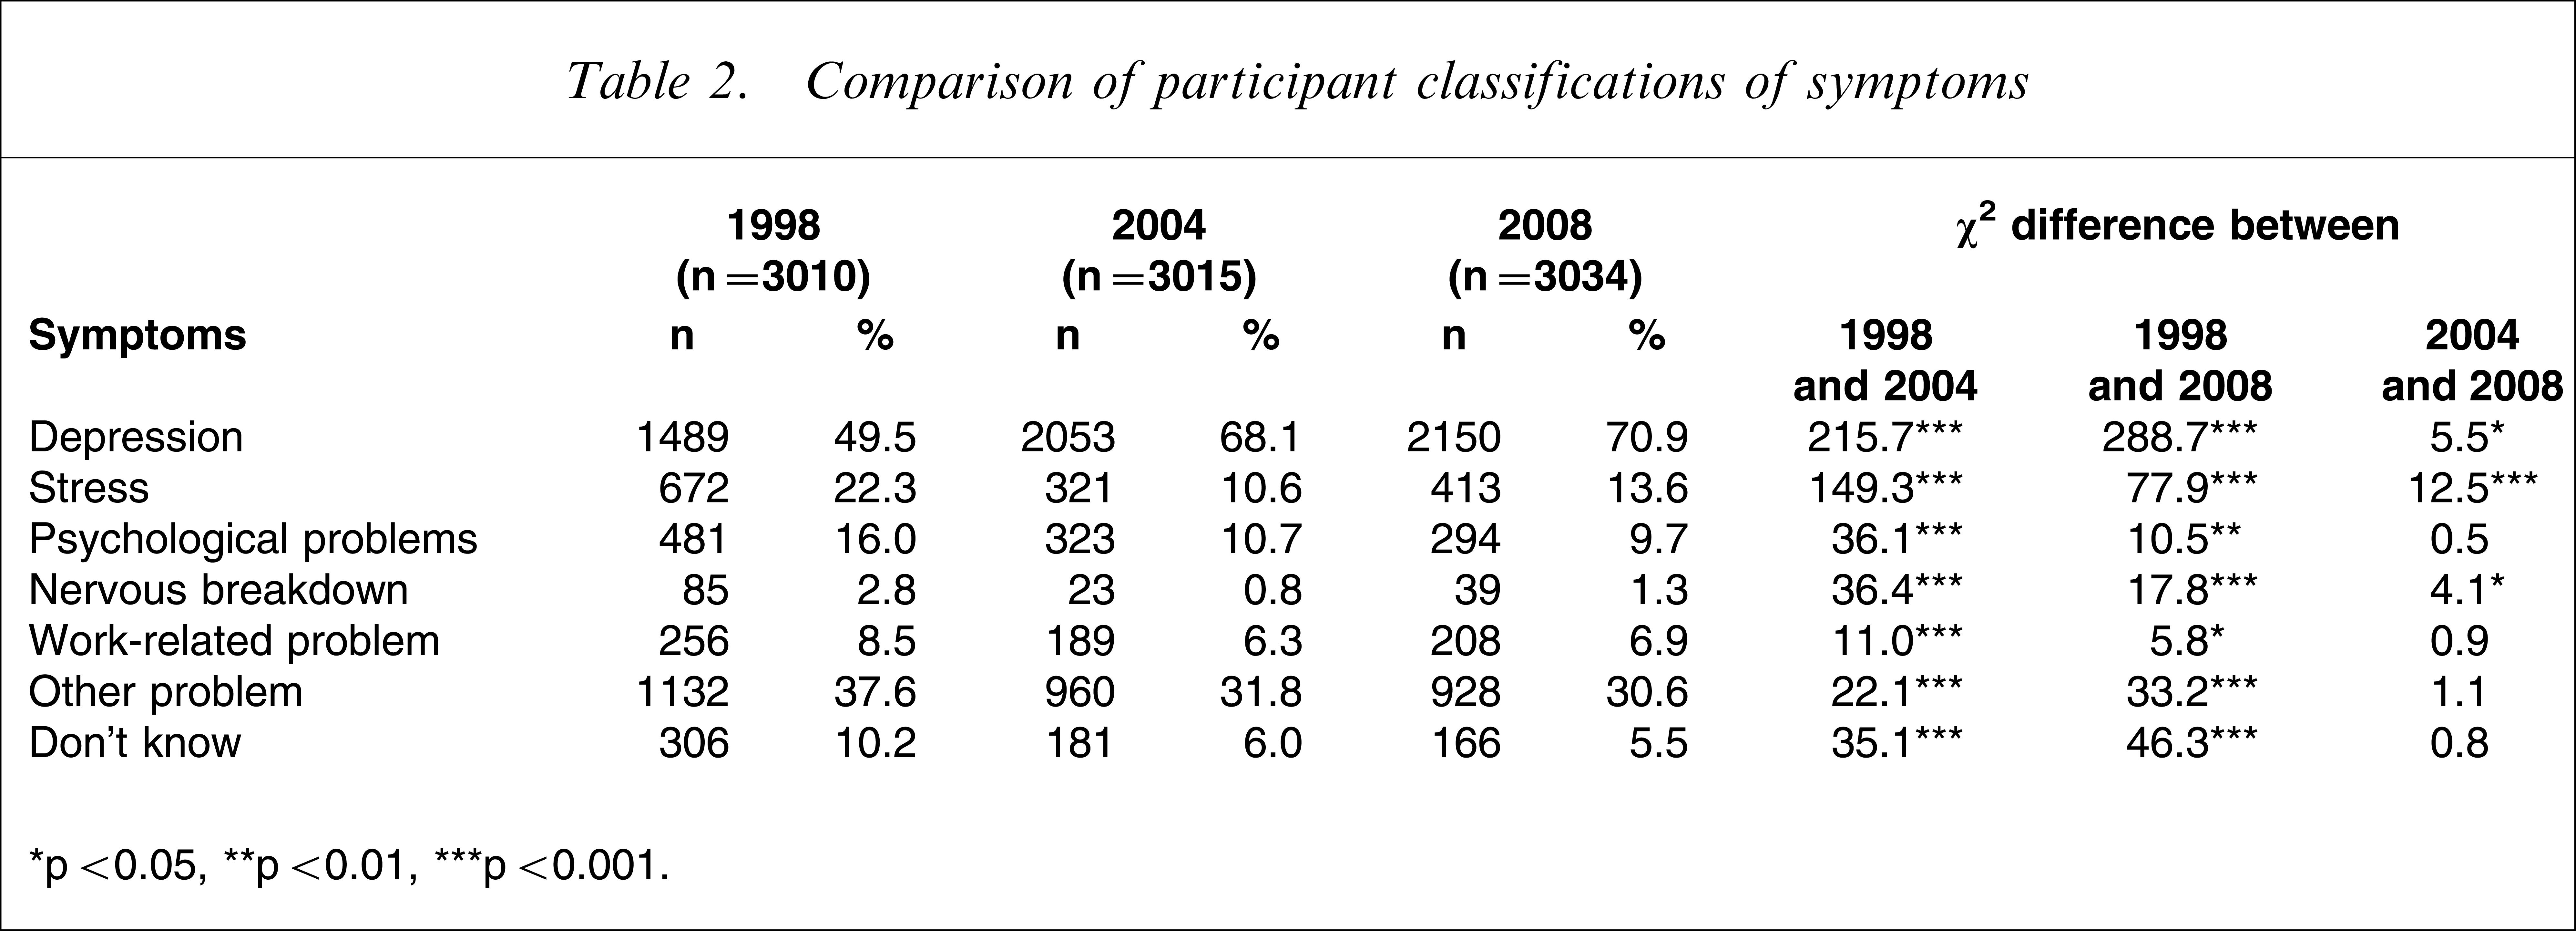
∗p < 0.05, ∗∗p < 0.01, ∗∗∗p < 0.001.
Table 3 presents participants’ beliefs, in context of the vignette, about whether assistance from various therapists would be potentially helpful or harmful. Whereas between 1998 and 2004 there was an increase in the perception of helpfulness across all therapists, the results show a reversing trend between 2004 and 2008, with significant falls in the perceived helpfulness of family doctors, chemists, counsellors or social workers, phone counselling, psychiatrists, family or friends, naturopaths, and clergy. There was also a reduction in the perceived helpfulness of psychologists, although this difference did not reach statistical significance. Participants in 2008 were significantly more likely to report that they believed counsellors or social workers, telephone counselling, psychiatrists, and psychologists to be helpful than were participants in 1998. The exceptions to this trend appeared in lowered perceptions of the potential helpfulness of family or friends, naturopaths, and clergy. Between 1998 and both 2004 and 2008, there was a significant reduction in the perception of harmfulness for counsellors or social workers, psychiatrists, and psychologists. Between 2004 and 2008, friends or family were less likely to be considered harmful, the only statistically significant change in perceptions of harmfulness for this period.
Comparison of participant classifications of potential assistance
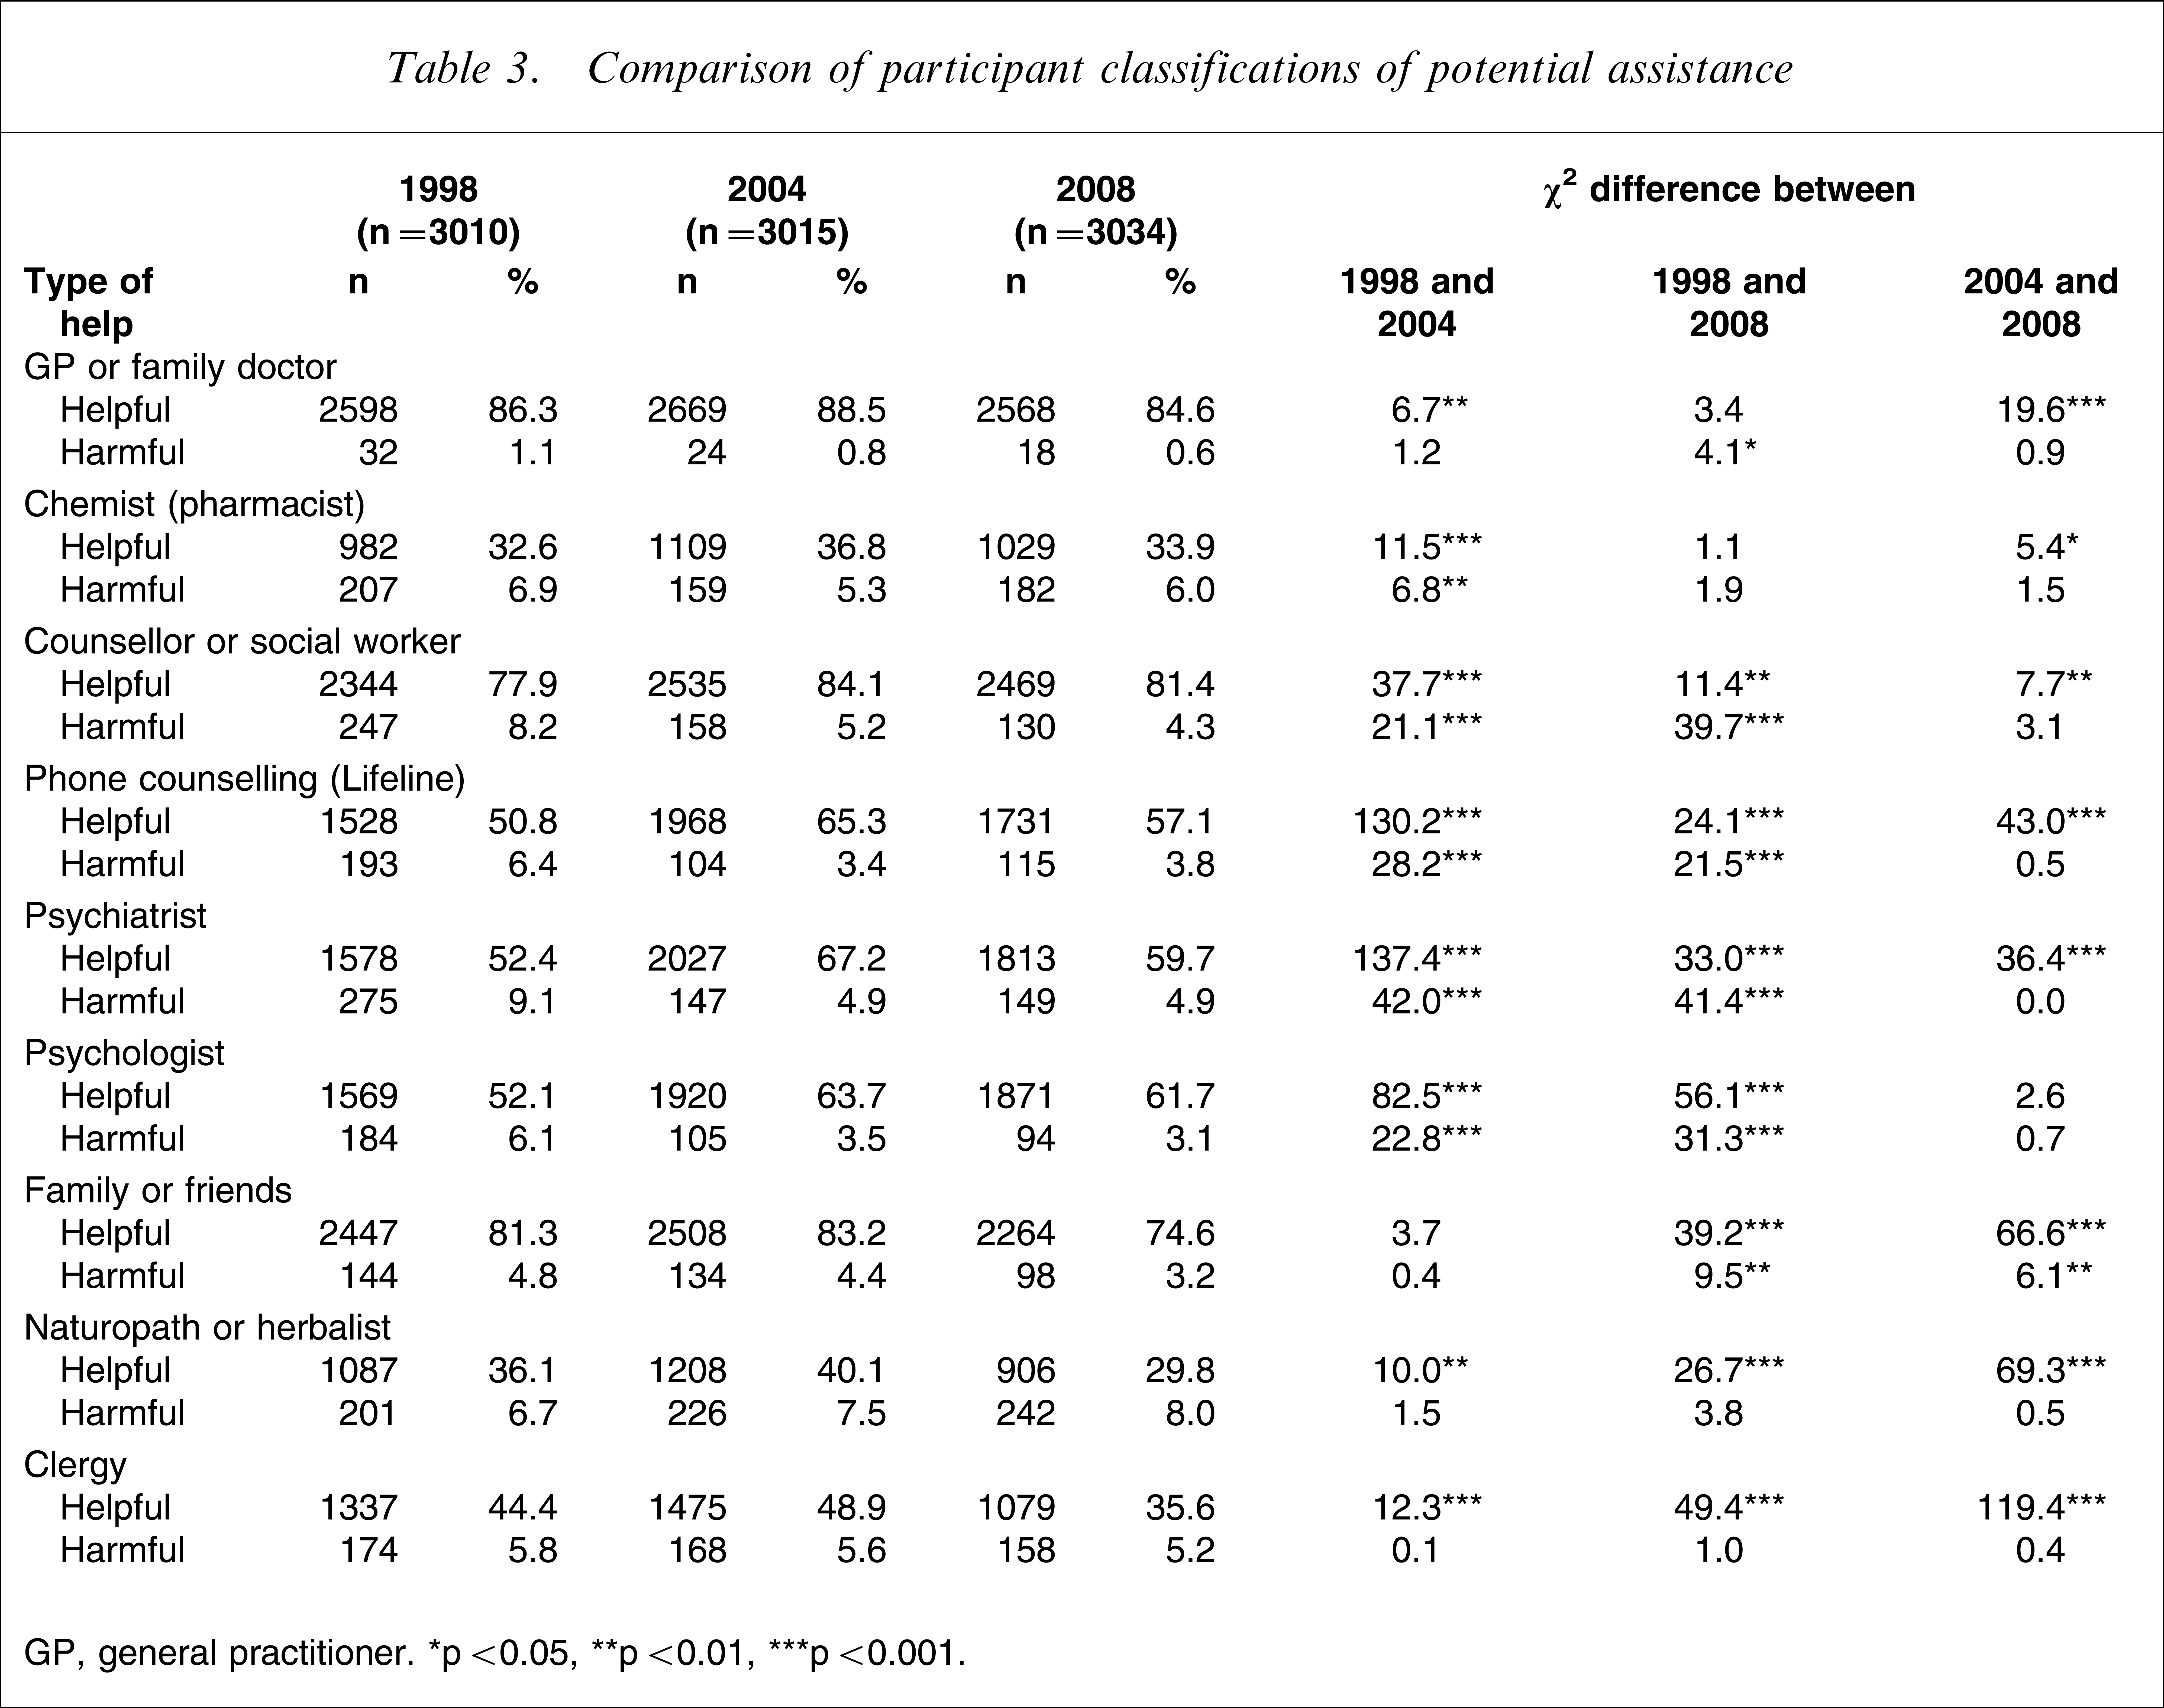
GP, general practitioner. ∗p < 0.05, ∗∗p < 0.01, ∗∗∗p < 0.001.
Some evidence of reductions in the public's confidence between 2004 and 2008 can be seen in Table 4, with significantly fewer participants considering pharmacological options as helpful across the entire spectrum. Not only were vitamins, minerals, tonics, and herbal medicines considered less helpful, but herbal medicines were also considered to be significantly more harmful. Although antidepressants were considered less helpful in 2008 than in 2004, they were also considered to be less harmful. A comparison of current beliefs about antidepressants with those in 1998, however, indicated that significantly more participants in 2008 considered them to be helpful and significantly fewer considered them to be harmful.
Comparison of participant classifications of pharmacological treatments
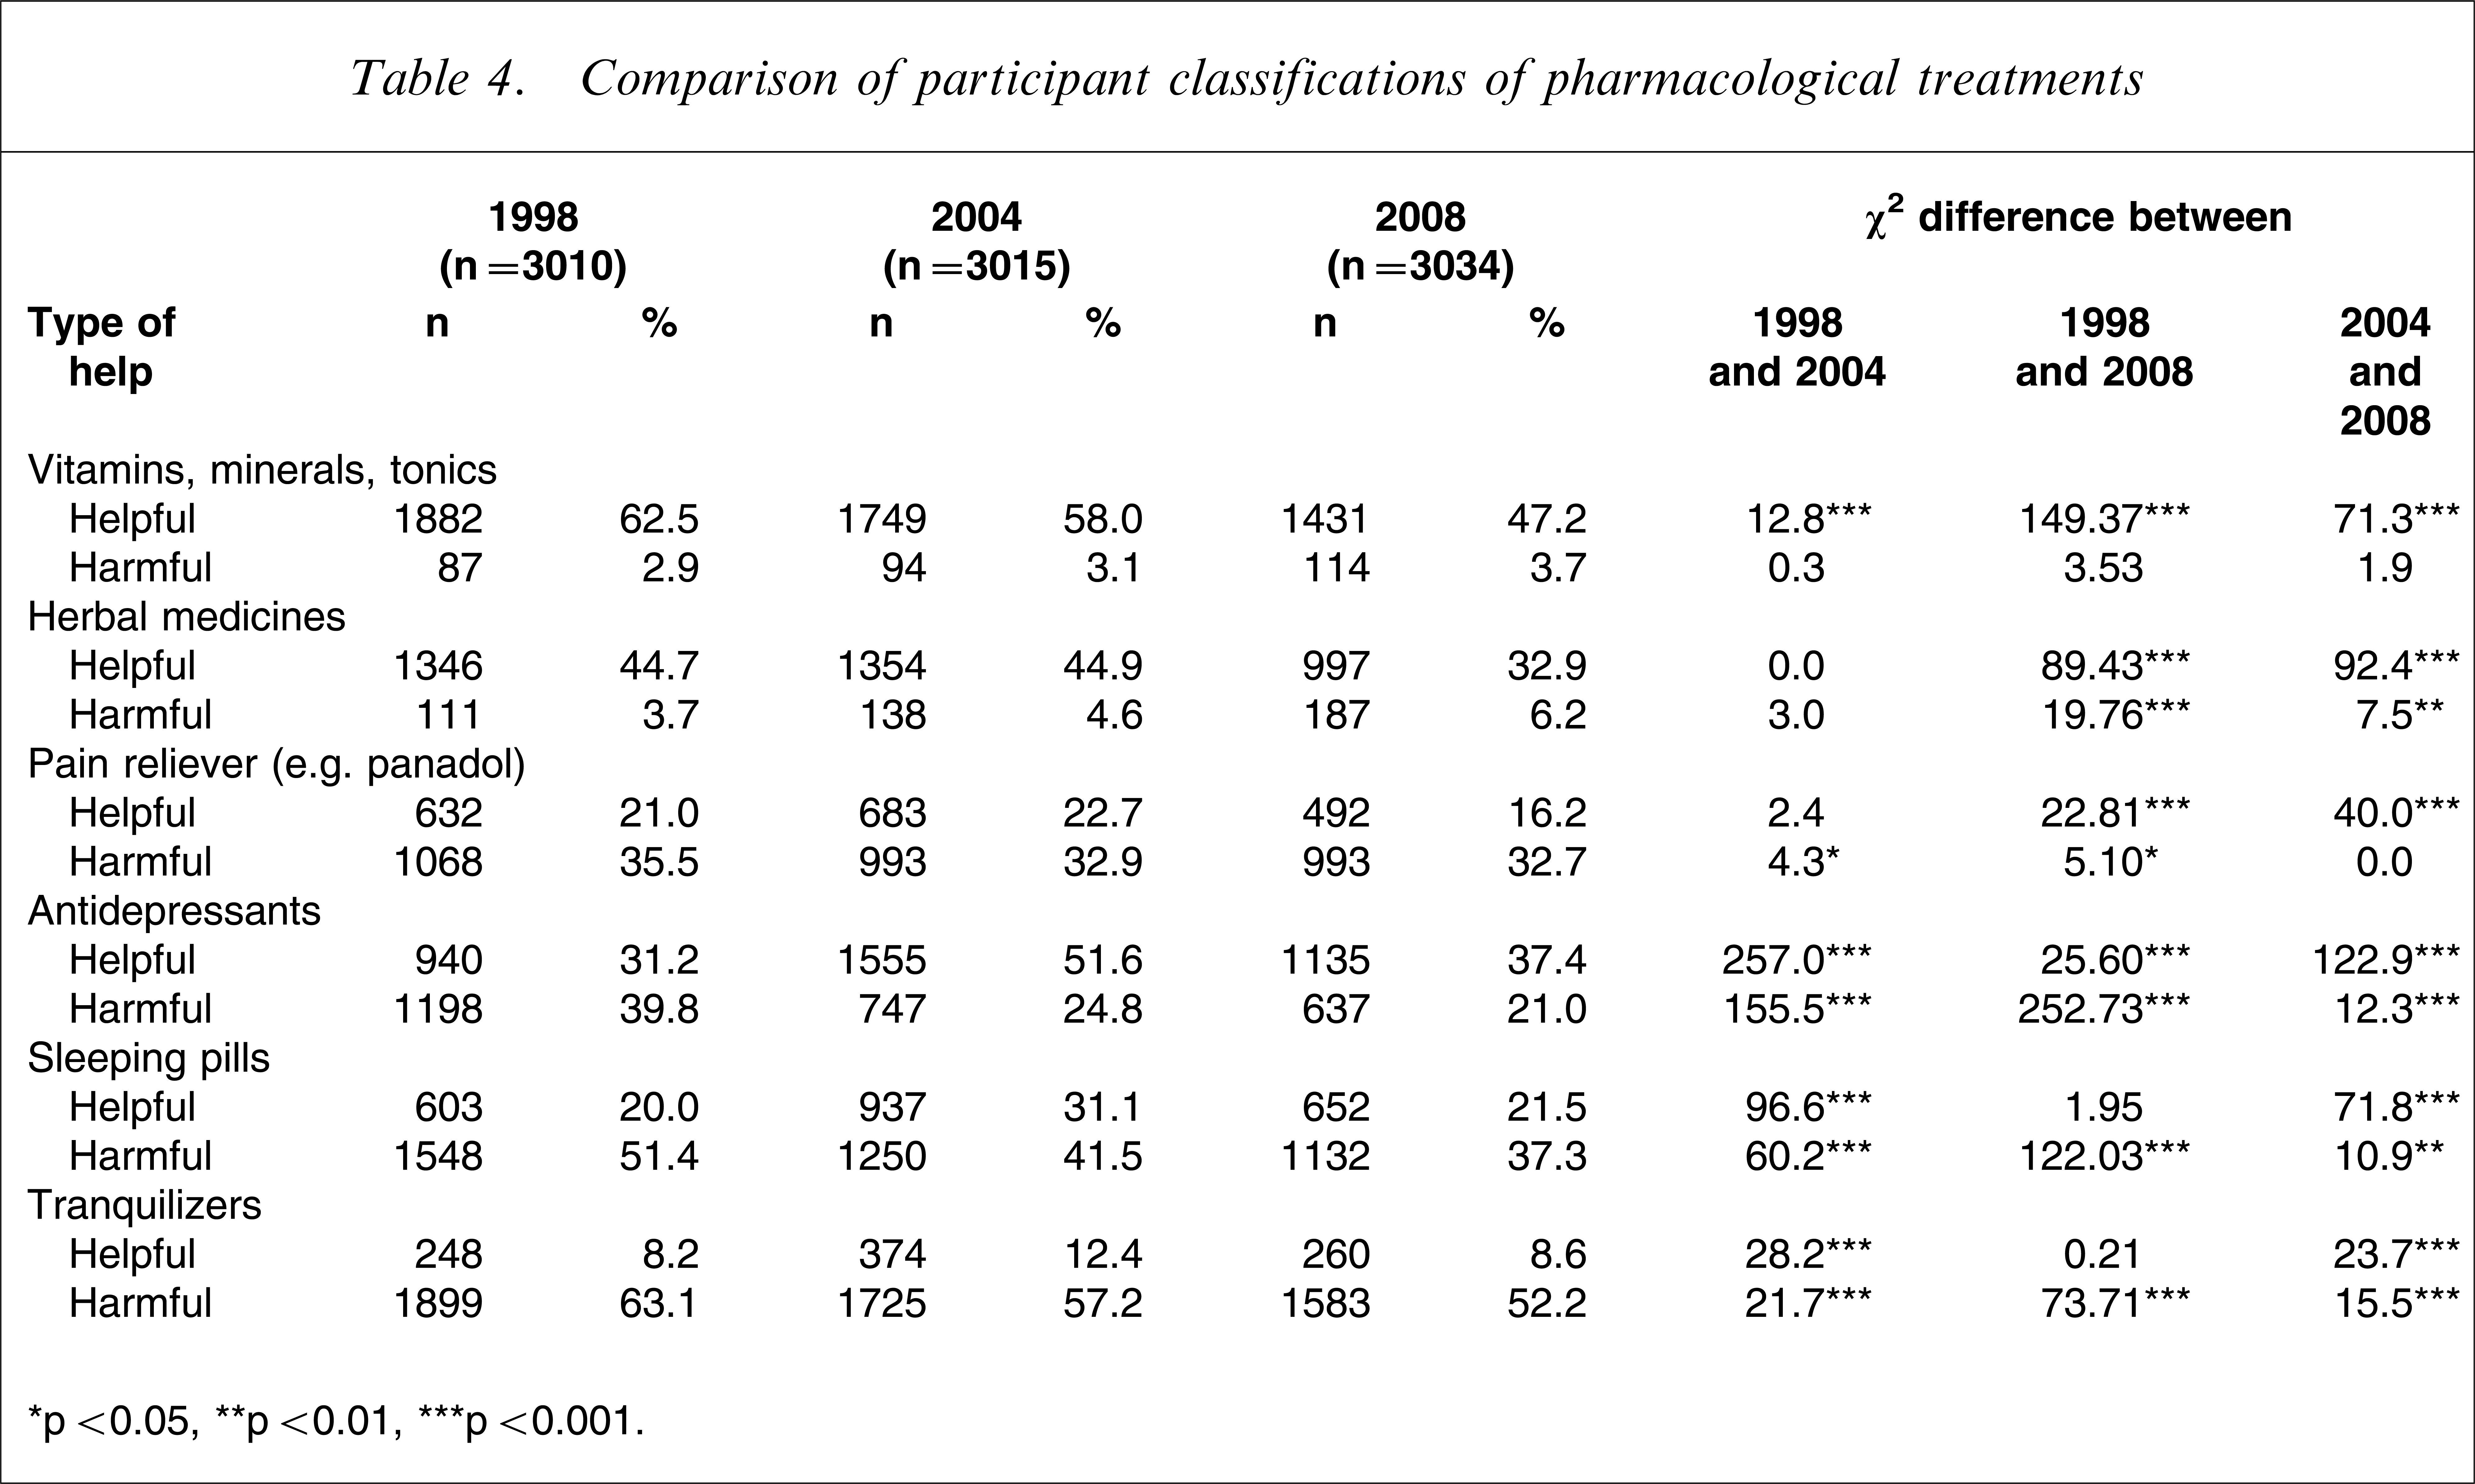
∗p < 0.05, ∗∗p < 0.01, ∗∗∗p < 0.001.
Analyses were conducted to examine levels of depression-related mental health literacy according to demographic variables, and Table 5 indicates that although there have been significant increases in mental health literacy between 1998 and 2008, the greatest increases were achieved before 2004. The results, however, demonstrate significant literacy gains in some demographic groups between 2004 and 2008: those living in rural areas, those with higher levels of income, those with a tertiary education, and those between 21 and 35 years of age.
Demographic associations with high depression-related mental health literacy (univariate)
CI, confidence interval; OR, odds ratio. ∗p < 0.05, ∗∗p < 0.01, ∗∗∗p < 0.001.
Analyses were also conducted to investigate the extent to which participant diagnoses of the vignette symptoms influenced beliefs about the likely helpfulness of mental health therapists. χ2 analyses indicated that those who believed that the symptoms reflected depression were significantly more likely to believe that a psychiatrist would be helpful than those who believed the symptoms reflected a ‘work’ or ‘other’ problem (χ2(1) = 6.40, p = 0.011). No significant differences were found for beliefs regarding the helpfulness of a psychologist (χ2(1) = 0.20, p = 0.652) or counsellor/counselling (χ2(1) = 1.05, p = 0.307).
Discussion
Consistent with the findings of other Australian research [5, 7, 11], these results indicate that overall levels of depression-related mental health literacy increased significantly between 1998 and 2004. The present findings also demonstrate that overall levels of depression-related mental health literacy have since consolidated, with no significant improvement between 2004 and 2008. It is possible that, in general terms, population levels of literacy have reached a ceiling point, and that expectations of further significant increases may be unrealistic.
Specific beliefs and attitudes towards depression
Notwithstanding this absence of change overall, examination of items on an individual basis indicated that there have been some discrete changes in recent years. Thus, participants in 2008 were more likely to acknowledge that they had experienced depressive symptoms depicted in the vignette, and they were significantly more likely to have had, or be having, treatment for those symptoms than were participants in 2004. Although these findings could be interpreted to suggest increases in the prevalence of depression, it might also be said that the consequences of personal exposure to depression are likely to result in a greater appreciation for the symptoms and experience of mental illness as well as capacity for empathy. Both understanding and empathy are important components of mental health literacy, and, although overall levels of literacy did not improve significantly between 2004 and 2008, it is possible that the stigma associated with mental illness may have been reduced through such improvements.
Researchers have reported that the belief that therapists can provide tangible help and support is a significant factor influencing decisions to utilize mental health services [12, 13]. Therefore it is of concern that, when asked to evaluate persons of potential assistance, participants in 2008 were significantly less likely than in 2004 to classify any of the professional interventions as ‘helpful’, although the apparent reduction in confidence was not statistically significant for psychologists. Similarly, the same participants were also significantly less likely to classify any pharmacological treatment as ‘helpful’, although it was of note that in 2008 antidepressants were considered ‘harmful’ significantly less frequently than in 2004. Significant increase in concern that a pharmacological product could be ‘harmful’ was confined to herbal medicines. The results also indicate that participants in 2008 perceived social networks to be less influential, because they were significantly less likely to report family and friends as either helpful or harmful.
Overall, despite participants in 2008 being more likely to report a close or personal experience with depression, they were significantly less likely to endorse therapists, pharmacological treatments, and social support networks. This is in contrast to the observation of Hickie made during debate, who suggested recently that ‘… willingness to respond positively to survey questions about … depression … is also likely to indicate an increased willingness to use either appropriate self-help or professional strategies to obtain better mental health’ [14]. Thus, although significantly more participants in 2008 reported that they had ever used, or were currently using antidepressant medication than in either 1998 or 2004, it seems that South Australians are shifting their preferences away from both professional therapists and self-help strategies. This may be related to the media highlighting the deficits in Australian and South Australian mental health care [15–17] and reporting negative effects of antidepressant medication [18, 19]. Future research might explore this further, because it is possible that although attempts to educate the community lead to improvements in mental health literacy, they might also be associated with increased scepticism due to greater awareness of issues regarding the mental health care system and pharmacological treatments.
Recognizing depression
In terms of labelling the vignette symptoms, Table 2 shows that there was a significant increase between 2004 and 2008 in the number of people recognizing ‘depression’, although the greatest increase was seen in the percentage of people labelling the symptoms as ‘stress’. It is possible that, rather than demonstrating an inability to recognize depression per se, these results reflect a preference for the term ‘stress’ as a more socially acceptable interpretation of the cause. It should also be noted that the number of people reporting that they thought John/Mary had ‘psychological problems’ or ‘other problems’, or that they ‘didn't know’ what was wrong dropped slightly between 2004 and 2008 and this may have contributed to a greater number of responses reflecting ‘stress’ in 2008. It is also worth considering the findings of Fuller et al., who conducted a qualitative analysis of attitudes towards mental health and found a ‘… reluctance to acknowledge distress as a mental health problem and so seek help’ [20]. It is possible that some participants interpreted the vignette symptoms as those of general distress rather than strictly depression or mental illness, hence their reticence to recommend a mental health therapist as ‘helpful’. Although findings from analyses conducted on the present data to explore this were mixed, there was some support for the suggestion. Thus, those who believed the symptoms reflected depression were significantly more likely to believe that a psychiatrist would be helpful than those who believed the symptoms reflected ‘work’ or ‘other’ problems.
Alternatively, it is possible that the measure devised by Jorm et al. [4] captures both knowledge as well as public confidence as functions of mental health literacy, and that these are two issues that should be considered separately. That is, although the majority of participants in 2008 appeared to appreciate the nature of depression, compared to 2004 they were significantly less likely to consider potential management strategies as helpful. Poor confidence in the usefulness of mental health services is likely to impact on help-seeking behaviour. Thus, although an individual might be classified as holding strong mental health literacy, this does not necessarily translate into congruent behaviour; just because an individual knows what they should do, they may not choose to do the same.
Demographic associations
Although there were few significant changes between 2004 and 2008 in the demographic distributions of high depression-related mental health literacy, it is of note that the greatest shift was that related to area of residence. That is, although people living in rural areas dropped slightly below the literacy levels of those in metropolitan areas in 2004, this difference was not significant. Rather, the percentage of people living in rural areas with high mental health literacy increased significantly between 1998 and 2004, and again in 2008. It has been suggested that the rural experience of mental health is different to that of the metropolitan experience [20, 21], both in terms of environmental and social triggers as well as availability of treatment. It is possible that recent Government initiatives have contributed to the increased awareness of both mental illness as well as treatment options in rural Australia, with media announcements in August 2007 regarding funding increases of $AUD2.2m to mental health services in central Australia and the Eyre Peninsula and $AUD10.1m in September 2007 to help people living in drought-affected communities to deal with drought-related emotional effects [22]. In addition to Government initiatives, in 2007 beyondblue launched a National Drought Campaign as well as rural workforce training to raise awareness of the symptoms of depression and the services available to people in rural areas [2]. Although the increase in rural mental health literacy is reassuring, it should be noted that recruitment for the present study was restricted to those living in towns with a population of ≥1000 and although geographically rural, it could be argued that these areas are not particularly remote.
Between 1998 and 2004 there were significant increases in depression-related mental health literacy in those over the age of 36, but this trend appears to have shifted, with the 2008 results reflecting a significant increase in literacy in those between 21 and 35 years of age. This is an important and positive finding, because young people form one of the major target groups in terms of education about depression, although it seems that more, or perhaps different, approaches are needed to capture the attention of those in their adolescent years.
Otherwise, results of demographic analyses showed levels had remained static between 2004 and 2008, with female subjects, those between 36 and 50 years of age, those with a tertiary education, those born in the UK or Ireland, and those within the middle or highest income brackets most likely to have high levels of depression-related mental health literacy.
Conclusion
Although overall levels of depression-related mental health literacy did not improve significantly between 2004 and 2008, some discrete, yet important changes were uncovered. Specifically, significantly more people in 2008 correctly classified the vignette symptoms as depression than in previous years. Between 2004 and 2008, however, the results also indicated a significant reduction in levels of confidence regarding the helpfulness of both therapists and pharmacological treatments, perhaps a reflection of recent negative media representation of the South Australian mental health system. There were also some changes in literacy across demographic groups, with important improvements in those living in rural areas and those between 21 and 35 years of age.