
Abstract
A national survey of Australian adults carried out in 1995 presented respondents with a vignette of a person with either depression or schizophrenia [1]. Respondents were asked what was wrong with the person and to rate whether a range of interventions were likely to be helpful or harmful. Although most recognized some sort of mental health problem in the vignette, only a minority used conventional psychiatric labels. Furthermore, some standard psychiatric treatments were more often rated as harmful than helpful. Later surveys of mental health professionals, using the same questions, confirmed that there were some major discrepancies between public and professional beliefs about mental disorders [2, 3].
The past few years have seen increased efforts to improve the mental health literacy of the Australian public. We therefore carried out a second national survey to assess whether there had been changes in recognition and treatment beliefs.
Method
The 1995 survey
The methods of the 1995 survey have been described previously [1]. Briefly, the Australian Bureau of Statistics carried out a household survey covering all private dwellings in urban and rural areas, excluding the sparsely populated areas, across all states and territories. Interviewers made at least five call-backs in urban areas and at least three in rural areas before a dwelling was classified as ‘non-contact’. Contact was made with 2531 households, with one person aged 18 years or over randomly sampled per household, and 2164 people (85%) agreed to participate. Because a pilot study had shown reduced comprehension of the interview in people aged more than 75 years, this age group was excluded, giving a sample of 2031 aged 18–74 years.
The interview was based on a vignette of a person with a mental disorder. On a random basis, respondents were shown a vignette of either a person with depression or one with schizophrenia. Respondents were also randomly assigned to receive either male (‘John’) or female (‘Mary’) versions of the vignette. After being presented with the vignette, respondentswere asked two open-ended questions: ‘Whatwould you say, if anything, is wrong with John/Mary?’ and ‘How do you think John/Mary could best be helped?’. Then followed a series of questions asking the respondent to rate the likely helpfulness of various interventions (rated as likely to be helpful, harmful or neither for the person in the vignette). The interventions were: a typical general practitioner (GP) or family doctor; a typical chemist (pharmacist); a counsellor; a social worker; a telephone counselling service, such as Lifeline; a psychiatrist; a psychologist; help from close family; help from close friends; a naturopath or a herbalist; the clergy, a minister or priest; John/Mary tried to deal with his/her problems on his/her own; vitamins and mineral, tonics or herbal medicines; pain relievers, such as aspirin, codeine or panadol; antidpressants; antibiotics; sleeping pills; antipsychotics; tranquillizers, such as valium; becoming physically more active, such as playing more sport, or doing a lot more walking or gardening; reading about people with similar problems and how they have dealt with them; getting out and about more; attending courses or relaxation, stress management, meditation or yoga; cutting out alcohol altogether; psychotherapy; hypnosis; being admitted to a psychiatric ward of a hospital; undergoing electroconvulsive therapy (ECT); having an occasional alcoholic drink to relax; and going on a special diet or avoiding certain foods. Next were questions asking about the likely result for the person in the vignette with and without ‘the sort of professional help you think is most appropriate’. The response options were: Full recovery with no further problems; Full recovery, but problems would probably re-occur; Partial recovery; Partial recovery, but problems would probably re-occur; No improvement; and Get worse.
The rest of the interview is not relevant to the analyses reported here; it involved questions on knowledge of causes and risk factors, beliefs associated with stigma and discrimination, contact with people like those in the vignette and the health of the respondent.
The 2003–2004 survey
This survey was carried out by the company AC Nielsen following as closely as possible the methodology of the earlier survey. Households were sampled from 250 census districts covering all states and territories and metropolitan and rural areas. Up to five call-backs were made to metropolitan selections and three to non-metropolitan selections. To achieve a target sample of 4000 interviews with adults aged 18 years or over, visits were made to 28 947 households. The outcome of these visits was: no contact after repeated visits 14 630, vacant house or lot 306, refused 7815, person sampled within household temporarily unavailable 1132, no suitable respondent in household 287, did not speak English 383, incapable of responding 213 and unavailable for the duration of the survey 181.
One difference between this and the earlier surveywas that it included all adults aged 18+, including those aged 75+. To make the samples more comparable, the latter age group was dropped from the analyses reported here. This left 910 people who received the depression vignette and 913 who received the schizophrenia vignette (total of 1823). The 2003–2004 survey incorporated all the questions of the earlier survey, but also had some additional questions. Furthermore, respondents were randomly assigned to receive one of four vignettes. Because the additional questions and vignettes were not used in the present analyses, they are not described here.
Statistical analysis
Data were pooled across male and female versions of the vignette, because analysis of the 1995 survey had shown that this variable made little difference to responses. Percentage responses for each vignette were calculated applying survey weights to give better population estimates. Standard errors of these percentages were estimated from the 2003–2004 data using the Complex Samples procedure in SPSS 12.0. This procedure takes account of sampling weights and geographic clustering in the sample. The standard errors from the 2003–2004 survey were used to calculate the significance of differences between the 1995 and 2003–2004 surveys. Only the 2003–2004 data were used for standard error estimation because better information was available on sample clustering than for the 1995 survey. Given the large sample size, most differences were found to be significant at the p<0.01 level. We have therefore focused the interpretation on effect sizes, focusing on those which equal or exceed Cohen's definition of a ‘small’ (h≥0.2) or ‘medium’ (i.e. h≥0.5) [4].
Results
The responses to the open-ended questions were classified according to whether or not there was mention of the conventional psychiatric labels ‘depression’, ‘schizophrenia’ or ‘psychosis’, or of other more general labels for mental disorders. Multiple categories were allowed for each respondent. Table 1 shows significant increases in the percentage of the population using the conventional psychiatric labels for the vignettes. Although the schizophrenia vignette also showed an increase in the label ‘depression’, there was an even greater increase in the correct label ‘schizophrenia/psychosis’.
Percentage of respondents mentioning each category to describe the problem shown in the vignette
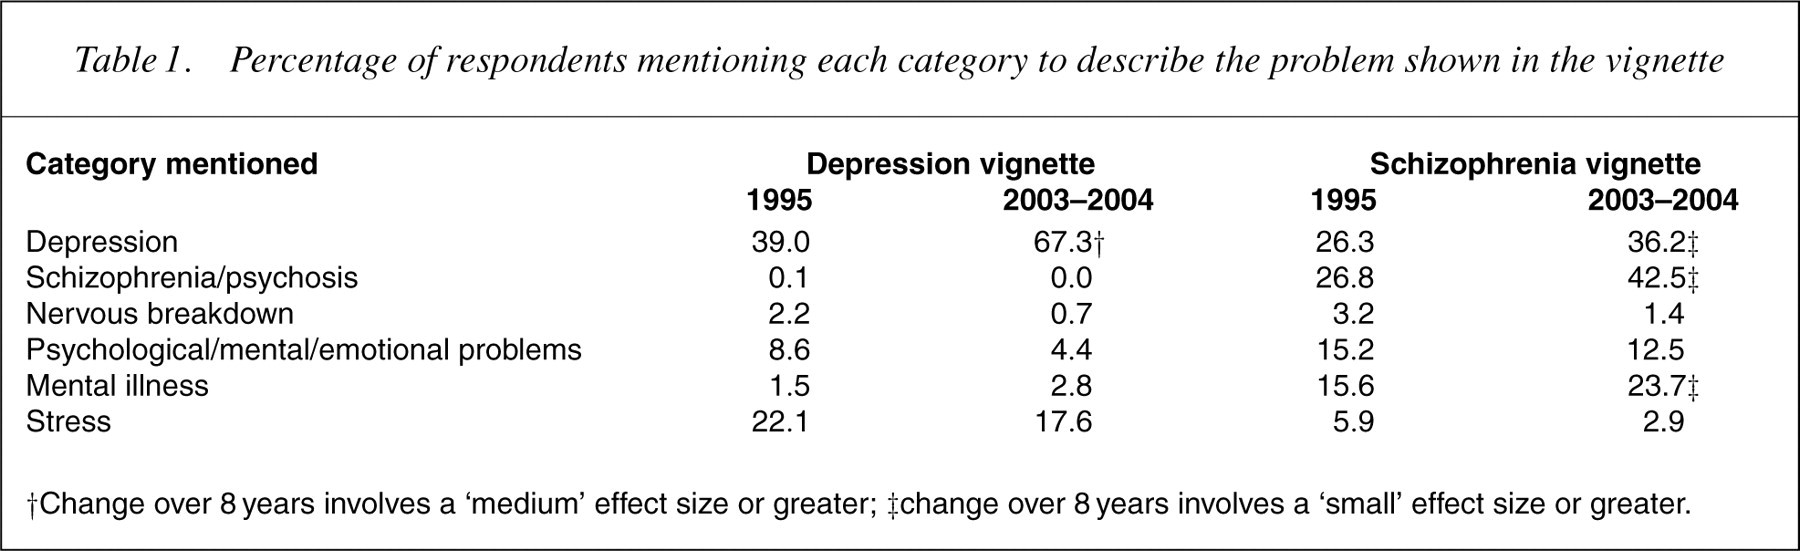
†Change over 8 years involves a ‘medium’ effect size or greater; ‡change over 8 years involves a ‘small’ effect size or greater.
Table 2 shows changes in the percentages mentioning various types of help in response to the open-ended question about how the person in the vignette could best be helped. There was an increased nomination of seeing a doctor as the best type of help for the depressed person. Table 3 shows the percentages of the population giving ratings of ‘helpful’ for the various interventions, while Table 4 shows the percentages giving ‘harmful’ ratings. For depression, the biggest changes were an increase in belief about the helpfulness of social workers, telephone counselling, psychiatrists, psychologists, antidepressants, antipsychotics, physical activity, reading about the problem, psychotherapy, admission to a psychiatric ward and a decrease in belief about the helpfulness of dealing with it alone. Conversely, there was an increased belief in the harmfulness of dealing with it alone and a decrease in the belief that antidepressants would be harmful (Table 3).
Percentage of respondents naming specific types of help as being the best for the person described in the vignette
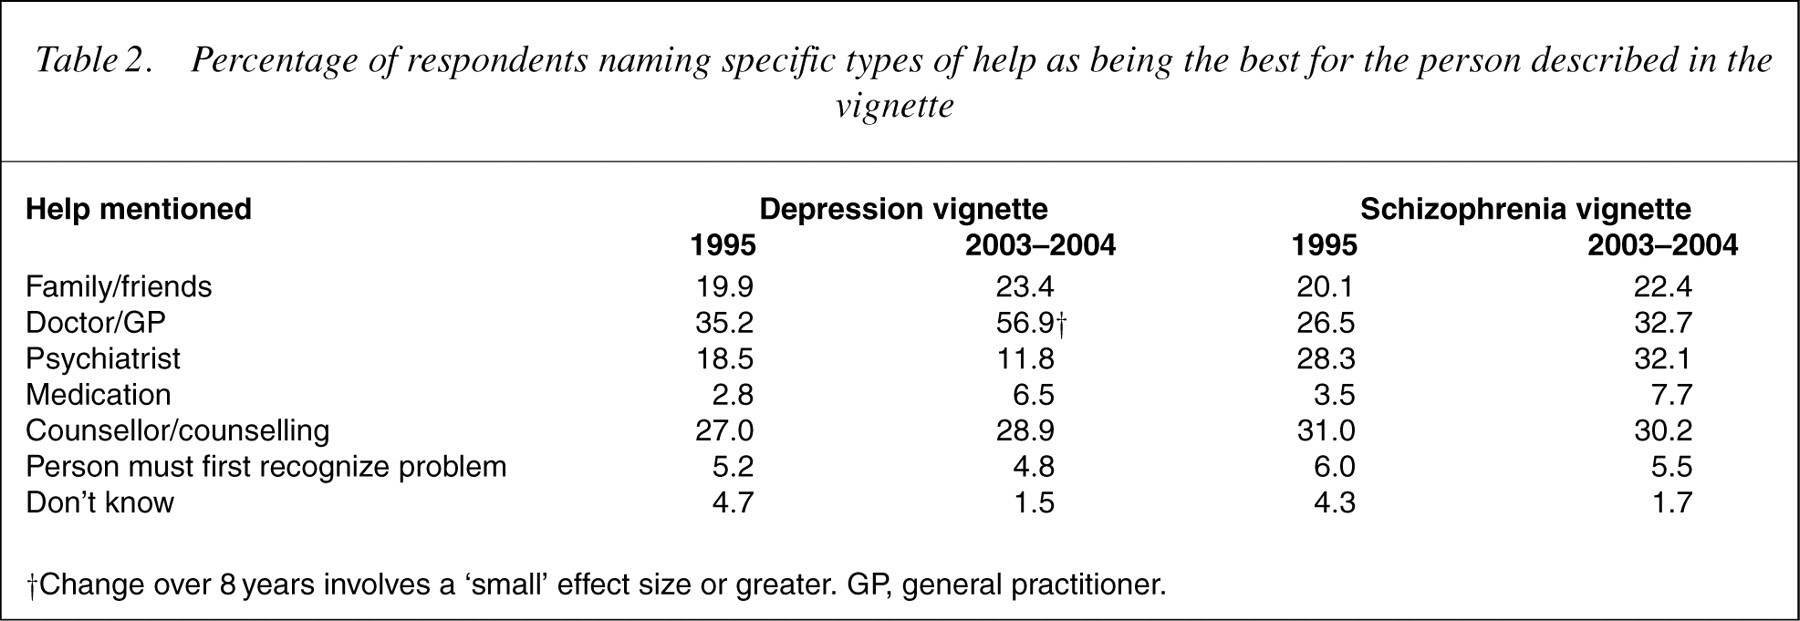
†Change over 8 years involves a ‘small’ effect size or greater. GP, general practitioner.
Percentage of respondents rating each intervention as helpful for the person described in the vignette
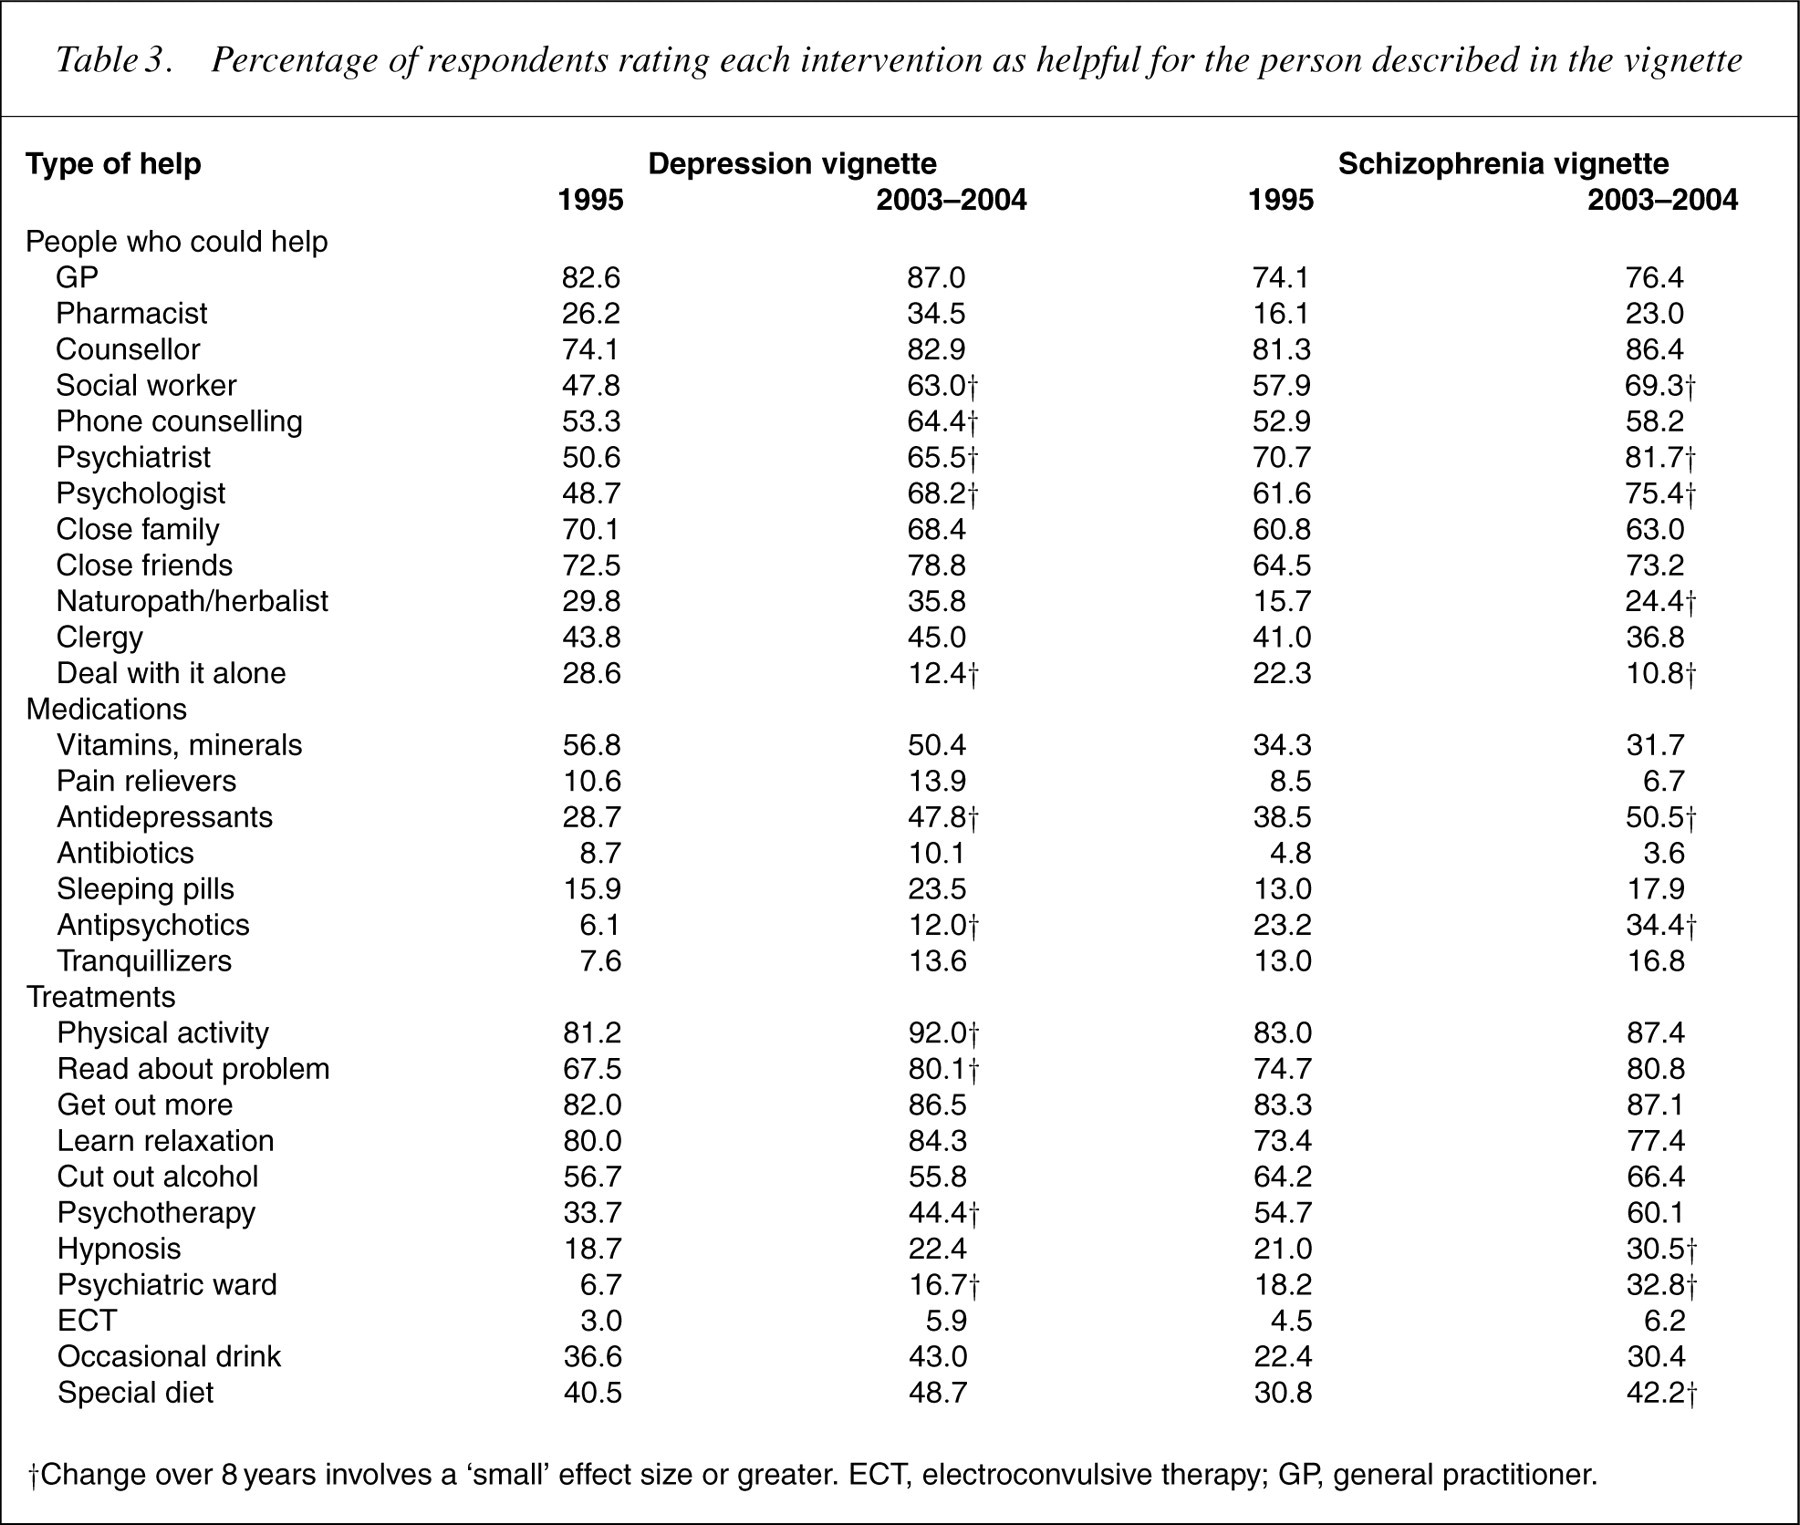
†Change over 8 years involves a ‘small’ effect size or greater. ECT, electroconvulsive therapy; GP, general practitioner.
Percentage of respondents rating each intervention as harmful for the person described in the vignette
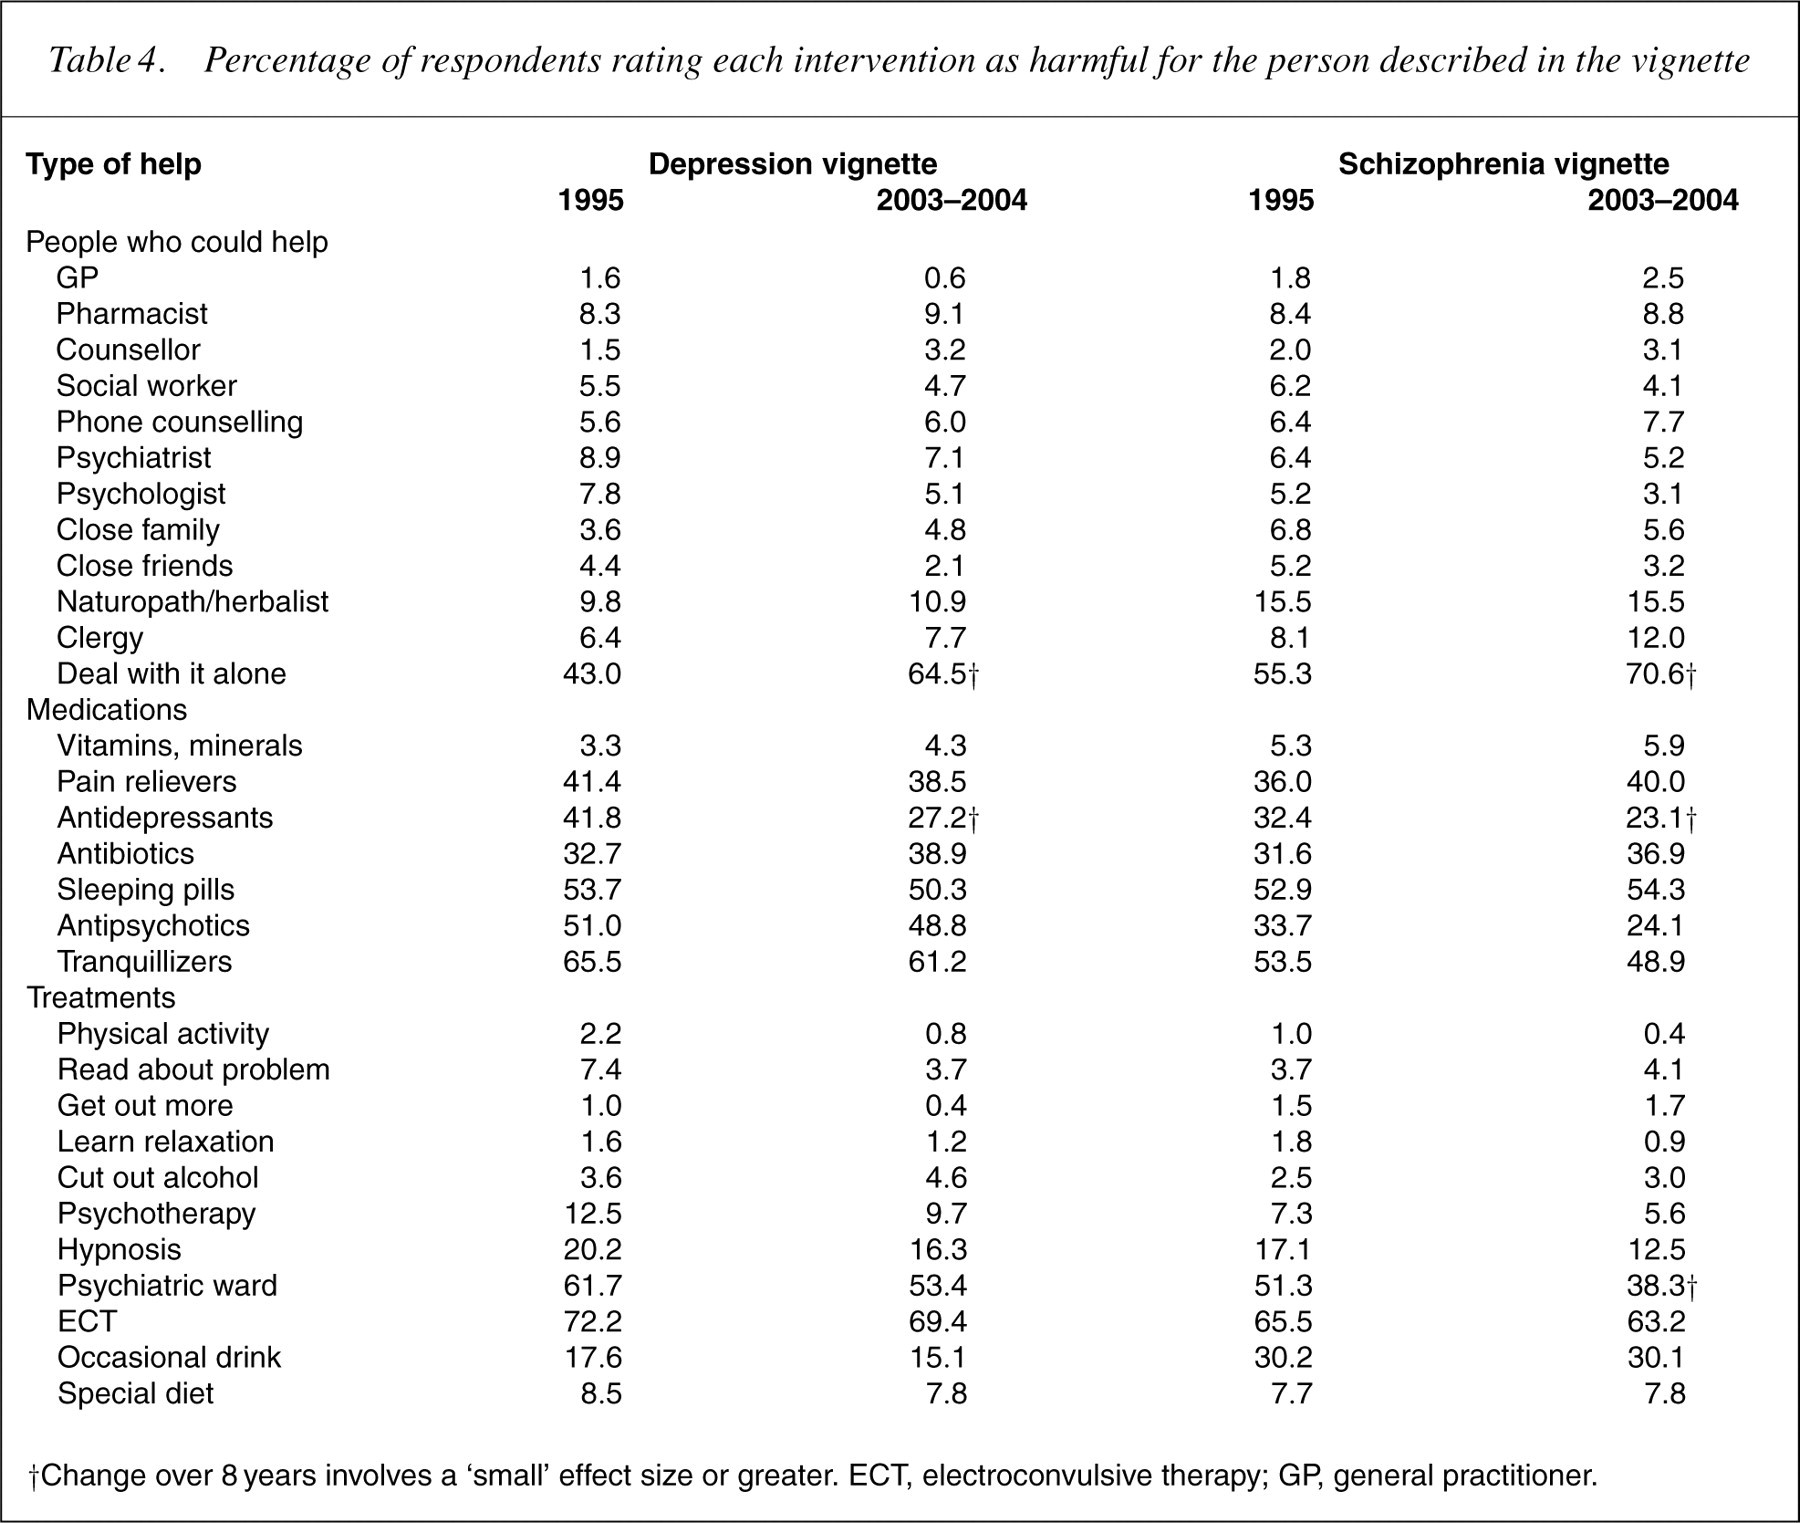
†Change over 8 years involves a ‘small’ effect size or greater. ECT, electroconvulsive therapy; GP, general practitioner.
For schizophrenia, there were similar changes. The biggest were increases in beliefs about the helpfulness of social workers, psychiatrists, psychologists, naturopaths/herbalists, antidepressants, antipsychotics, hypnosis, admission to a psychiatric ward, going on a special diet and decreases in the belief in dealing with it on your own. Conversely, there was an increase in the belief that it would be harmful to deal with it on your own, and a decrease in the belief that antidepressants and admission to a psychiatric ward would be harmful.
Table 5 shows the percentagses of the population giving various prognoses with andwithout professional help. Although therewere a number of significant changes, the only one to meet the criterion of being at least a small effect size was a decrease in ‘don't know’ responses where the depressed person did not receive professional help.
Percentage of respondents giving each outcome as likely for the person described in the vignette
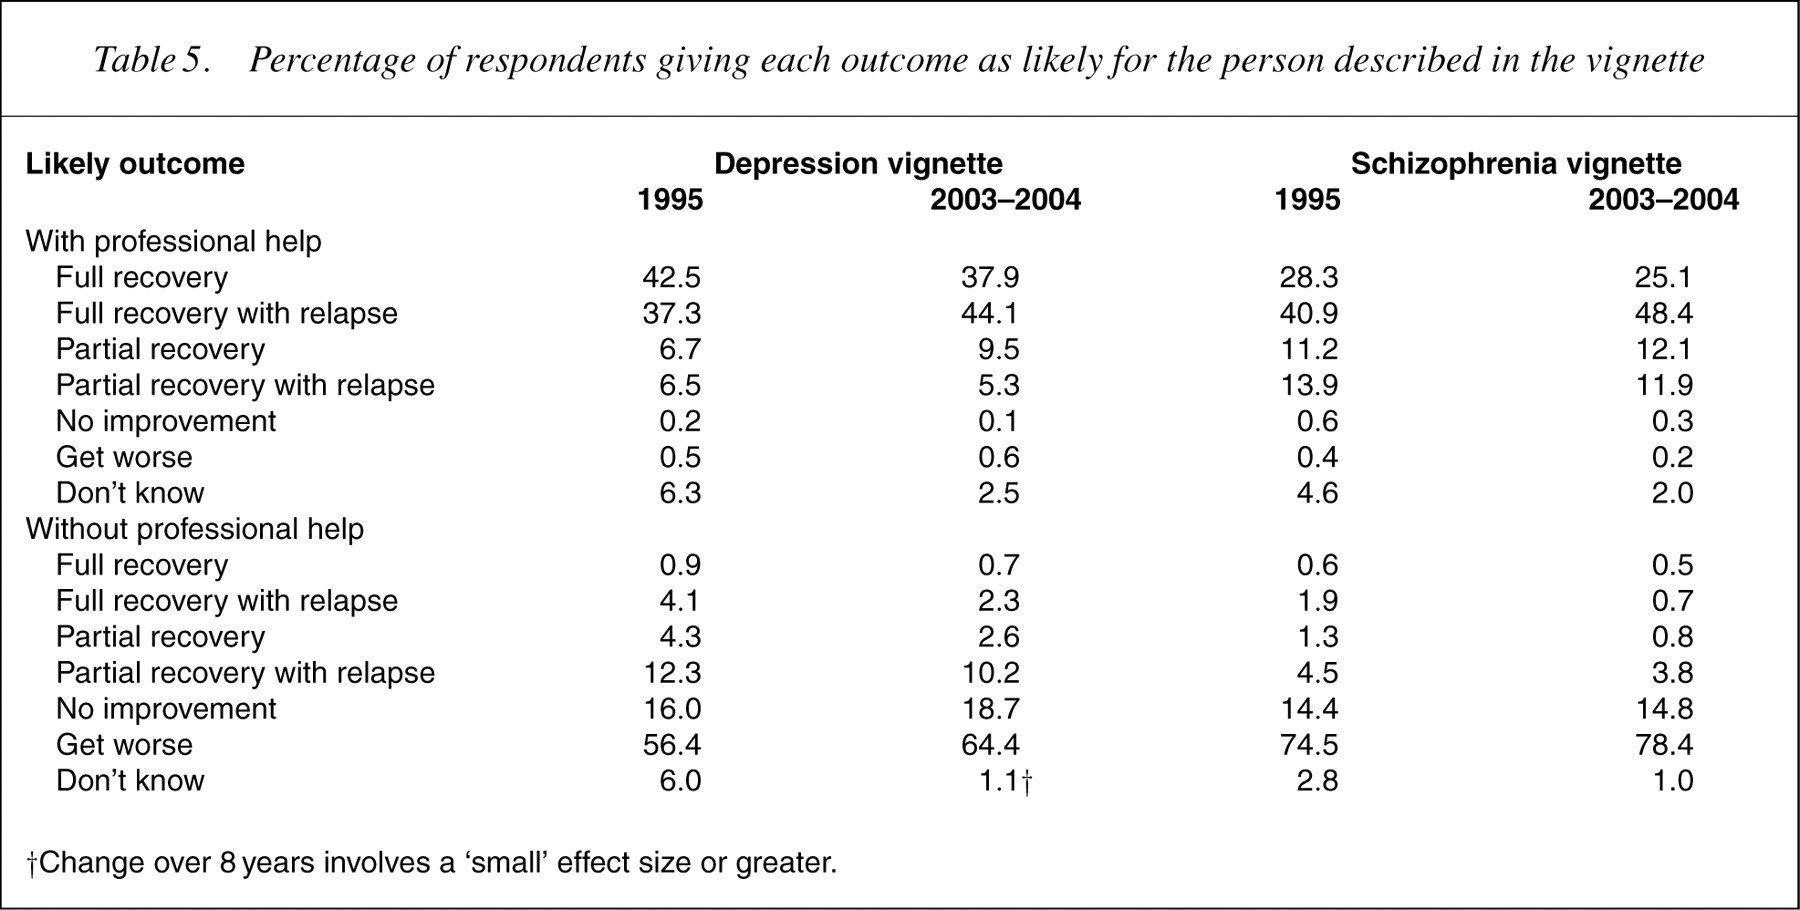
†Change over 8years involves a ‘small’ effect size or greater.
Discussion
We have found considerable changes in the knowledge and beliefs about mental disorders and their treatment among the Australian public over an 8-year period. These changes involve better recognition of the disorder in a vignette and more positive beliefs about the helpfulness of a range of interventions. In general, these changes involve the public becoming more similar to mental health professionals in their beliefs. We have previously reported that there is a professional consensus of GPs, psychiatrists and clinical psychologists that the person in the depression vignette would be helped by seeing a GP, psychiatrist or clinical psychologist, taking antidepressants and receiving cognitive behaviour therapy or counselling [5]. For the schizophrenia vignette, the professional consensus was that the person would be helped by seeing a GP, psychiatrist or clinical psychologist, taking antipsychotic medication and being admitted to a psychiatric ward [5]. The public showed increases in helpfulness ratings (small effect sizes or greater) for most of these interventions. The only interventions not to show such increases (GPs, counsellors) already had high ratings in the 1995 survey. Probably, the most dramatic change was in beliefs about antidepressants for depression. In 1995, more people gave ‘harmful’ ratings than ‘helpful’ ratings (42% vs 29%), whereas in 2003–2004 the reverse was true (27% vs 48%).
However, despite these positive changes, there are still some major discrepancies between public and professional beliefs, most notably in relation to admission to hospital, where ‘harmful’ ratings still outnumbered ‘helpful’ ratings. Also, the percentage believing in the helpfulness of antidepressants is still lower than for vitamins, minerals, tonics and herbal medicines.
Although the belief changes discussed earlier were the major ones we found, there were also increases in beliefs about the helpfulness ofmost interventions, together with a major decrease in the belief that it would be helpful to deal with a mental disorder alone. In other words, there has been a general change in the belief that it is necessary to get help and in the range of interventions seen as potentially helpful.
The survey results also indicate that there may have been some general effect of increased awareness of depression. There was a major increase in the use of the label ‘depression’ for the depression vignette, but also a similar but less marked increase in the use of this label for the schizophrenia vignette. Furthermore, the increase in helpfulness ratings for antidepressants was seen not only for the depression vignette, but also to a lesser extent for schizophrenia. The interesting issue is what led to these changes. We have previously shown that beyondblue: the national depression initiative played some role [6], but there are undoubtedly many other factors.
This study is the first step to monitoring Australia's mental health literacy in the long term. Although the present data apply to one particular country, the goal of raising mental health literacy is universally important. Poor mental health literacy limits the implementation of evidence-based care and the degree of community support for people affected by mental disorders [7]. Monitoring is a necessary component of national efforts to improve mental health literacy.
Footnotes
Acknowledgements
The 1995 survey was carried out with funding from a National Health and Medical Research Council Unit Grant. The 2003–2004 survey was carried out as part of the Australia–Japan Partnership, a cross-national study of mental health literacy in both countries. This survey was funded by the Australian Department of Health and Aging, a National Health and Medical Research Council Program Grant, and beyondblue: the national depression initiative. We wish to thank our colleagues who were involved in the 1995 survey and Kelly Blewitt for research assistance with the 2003–2004 survey.