
Abstract
When considering the health state of individuals and populations, it is often useful to have continuous measures of ill health or symptoms, as well as categories of disorder. This is for several related reasons. First, some types of health state are best thought of as points on a continuum, for instance, high blood pressure or high cholesterol. Second, for some disorders it is not possible to demonstrate a clear boundary between states of health or ill health [1,2]. Third, dichotomizing into case or non-cases, on the basis of a pre-determined cut-off, often leads to a loss of statistical information. Fourth, in population-based public health interventions, it is important to have information on the total distribution of symptoms because effective interventions may target the whole population, including individuals with mild and moderate levels of symptom, as well as individuals with severe symptom levels. A measure such as the Kessler 10-item scale (K10) allows identification of small but meaningful shifts, in the population distribution of psychological distress, which may not be detected if the focus is only on those at the severe end of the continuum [3].
Within psychiatric epidemiology a strong tradition exists of measuring psychological distress, especially anxiety and depressive symptoms, with questionnaires that produce scores on scales [4]. These dimensional measures may be used to assess current states of psychological distress or symptoms levels and changes in these over time. It is also possible to determine scores on these dimensional measures to predict the probability of individuals meeting criteria for disorder.
One aim of Te Rau Hinengaro: the New Zealand Mental Health Survey (NHMHS) was to trial a short instrument that could be used in repeated health surveys to monitor changes in the mental health status of the population. Given the complexity of the World Mental Health (WMH) Composite International Diagnostic Interview (CIDI 3.0) and the average time taken to complete the questionnaire, it is not a suitable instrument for such a task. For use as a health surveillance tool, an instrument needs to: be quick and simple to administer; have well-defined psychometric properties; and predict with acceptable accuracy the probability that a participant in a health survey has a mental disorder. The K10 is an instrument developed for this task. It is a short dimensional measure of non-specific psychological distress in the anxiety– depression spectrum, which was developed by Kessler and Mroczek. The K10 (and the shortened version known as the K6) were developed with support from the US government's National Center for Health Statistics for use in the redesigned US National Health Interview Survey [5]. The questionnaire takes a few minutes to complete, its psychometric properties are now well described and it is a very good predictor of the respondent meeting DSM-IV criteria for anxiety and mood disorders [6–9]. The K10 was included in the questionnaire of the US National Comorbidity Study Replication (NCS-R) [10] and the World Health Organization and Harvard University-sponsored WMH Surveys Initiative [11]. The instrument is now used in repeated health surveys in Australia [12], and it has been used in the 2006–2007 New Zealand Health Survey [13].
The K10 has been used to measure psychological distress over two time periods. In the Australian 1997 National Survey of Mental Health and Wellbeing participants were asked to rate their level of symptoms over the previous 30 days. In the WMH Survey Initiative (which includes the NCS-R) the participants were asked to rate their level of symptoms over the worst month in the preceding 12 months. When the New Zealand survey was developed no evidence existed about which of these two versions was to be preferred. It was also regarded as important that the New Zealand survey should try to retain comparability with both the Australian studies and WMH Survey Initiative. For these reasons both versions were used in the New Zealand survey, with participants being assigned randomly to receive either the ‘past month’ K10 or the ‘worst month in the past 12 months’ K10. Although the K10 is a measure of psychological distress in the depression–anxiety spectrum it was thought of interest to describe the relationship between the K10 and substance use disorders, to examine how well it did predict those disorders, even though that is not its primary purpose.
This paper presents the results for the two versions of the K10. Two sets of relationships are reported: the sociodemographic correlates of the K10; and the relationship between the K10, serious mental illness (SMI) and CIDI-diagnosed disorders.
Method
Sample
The NZMHS was a nationally representative household survey of people aged ≥ 16 years. Face-to-face interviews were carried out between October 2003 and December 2004. The survey was approved by all 14 regional health ethics committees, with the Auckland Y committee serving as the lead committee. Written informed consent was obtained from all respondents before the interview began. Mäori and Pacific people were oversampled. A detailed report of methods is given elsewhere [14,15]. The response rate was 73.3%. The interview consisted of two parts. Part 1 included core diagnostic sections and demographics and was administered to everyone (n = 12 992). Part 2 consisted of additional diagnostic sections and other measures of mental and physical health and was administered to a subsample (n = 7435), called the long form subsample.
Interview
The interview was based on version 15 of the WMH-CIDI [11], a fully structured lay interview. Version 20 is now known as the CIDI 3.0 (www.hcp.med.harvard.edu/wmh/).
Diagnoses
Although ICD-10 and DSM-IV diagnoses can both be made from the CIDI 3.0 [16,17], only DSM-IV diagnoses are reported here, using hierarchy rules.
Serious mental illness
SMI is defined in previous publications and incorporates criteria based on interference with life, bipolar I disorder and a suicide attempt in conjunction with a mental disorder [14,15,18]. Participants were classified as having SMI if any one of the following occurred in the past 12 months: an episode of bipolar I disorder, substance dependence with serious role impairment, a suicide attempt and any WMH-CIDI/ DSM-IV disorder, at least two areas of severe role impairment because of a mental disorder in the Sheehan Disability Scale domains [19,20], or overall functional impairment at a level found in the NCS-R to be consistent with a Global Assessment of Functioning (GAF) [21] score of <50 in conjunction with a WMH-CIDI/DSM-IV disorder.
Kessler Psychological Distress Scale
The Kessler Psychological Distress Scale can use 10 (K10 or the Kessler 10 Item Scale), six (K6), or five (K5) interview questions about the participant's feelings. In the NZMHS all 10 interview questions were asked and these questions were based on either the past month or the worst month in the past 12 months. Each question has five possible responses and these were: ‘all of the time’, ‘most of the time’, ‘some of the time’, ‘a little of the time’, or ‘none of the time’. The response to each question was recoded as follows: ‘all of the time’ was set to 4; ‘most of the time’ was set to 3; ‘some of the time’ was set to 2; ‘a little of the time’ was set to 1; ‘none of the time’ was set to 0; and all other values were set to missing. The possible range of scores is 0–40 with higher scores indicating higher psychological distress. The questionnaire is available upon request.
Sociodemographic correlates
Sociodemographic correlates include age at interview, sex, prioritized ethnicity, educational qualifications and equivalized household income. Multiple ethnicity was permitted. The standard New Zealand prioritization rule is to classify anyone who self-identifies as Mäori (either solely or in addition to other ethnicities) as Mäori, and anyone who self-identifies as any Pacific ethnic group, but not Mäori, as Pacific. Educational qualifications were assessed using 2001 census questions about school and post-school qualifications. A modification of the revised Jensen equivalence scale for household income was used to take account of the number of adults and the number of children in the household [22]. In the present survey the age of individual children was not known, only the number aged under 16 years, so an average age of 8 years was assumed.
Analyses
Data were weighted to account for different probabilities of selection that arose from oversampling Mäori and Pacific people and the selection of one person per household, differential non-response, and residual differences in age, sex and ethnicity between the sample and the 2001 census population. Additional weights were used to account for selection into the long-form sections of the interview.
Data manipulation and exploratory analyses were carried out using the SAS 9.1.3 software (SAS Institute, Cary, NC, USA), and analyses involving standard errors, confidence intervals and significance tests were carried out using SUDAAN 9.0.1 software (Research Triangle Institute, Research Triangle Park, NC, USA) to take account of the complex sample design. Taylor series linearization was used for variance estimation [23]. For prevalences with <30 events in the numerator, confidence intervals were calculated according to a method by Korn and Graubard [24,25]. Sociodemographic and geographic subgroups were compared using means. Although K10 distributions are skewed in general population samples, the central limit theorem ensures that the sampling distributions of the means are normally distributed in subgroup samples of the size obtained in the NZMHS, with hundreds or thousands of observations in each subgroup.
The cut-offs for the K10 were based on those used by the Australian Bureau of Statistics to report the 2001 Australian National Health Survey results [12]. These cut-offs are now almost universally used to present K10 and K6 results [26]. Scores of 0–5 are labelled as ‘none or low’; 6–11 as ‘moderate’; 12–19 as ‘high’ and 20–40 as ‘very high’.
For comparison of scores on the Kessler Psychological Distress Scales, CIDI diagnoses, and SMI, the receiver operating characteristic (ROC) curve and the area under the curve (AUC) was estimated using an SAS macro, %WTC [27]. Confidence intervals were calculated from a modification to the Hanley-McNeil approach [28], but using weighted estimates, and then inflated using the highest design effect for sensitivity or 1–specificity over all cut-offs.
Results
Kessler 10-item Scale scores and sociodemographic correlates
Table 1 presents the data on the K10 according to the sociodemo-graphic correlates of sex, age group, educational qualification and equivalized household income, each considered singly. The K10 scores are presented both for the past month and the worst month in the past 12 months. As expected, the mean scores for the past month are substantially and significantly lower than for the worst month overall (2.8 vs 4.3) and within each level of each sociodemographic variable.
Mean scores for K10 vs sociodemographic correlates
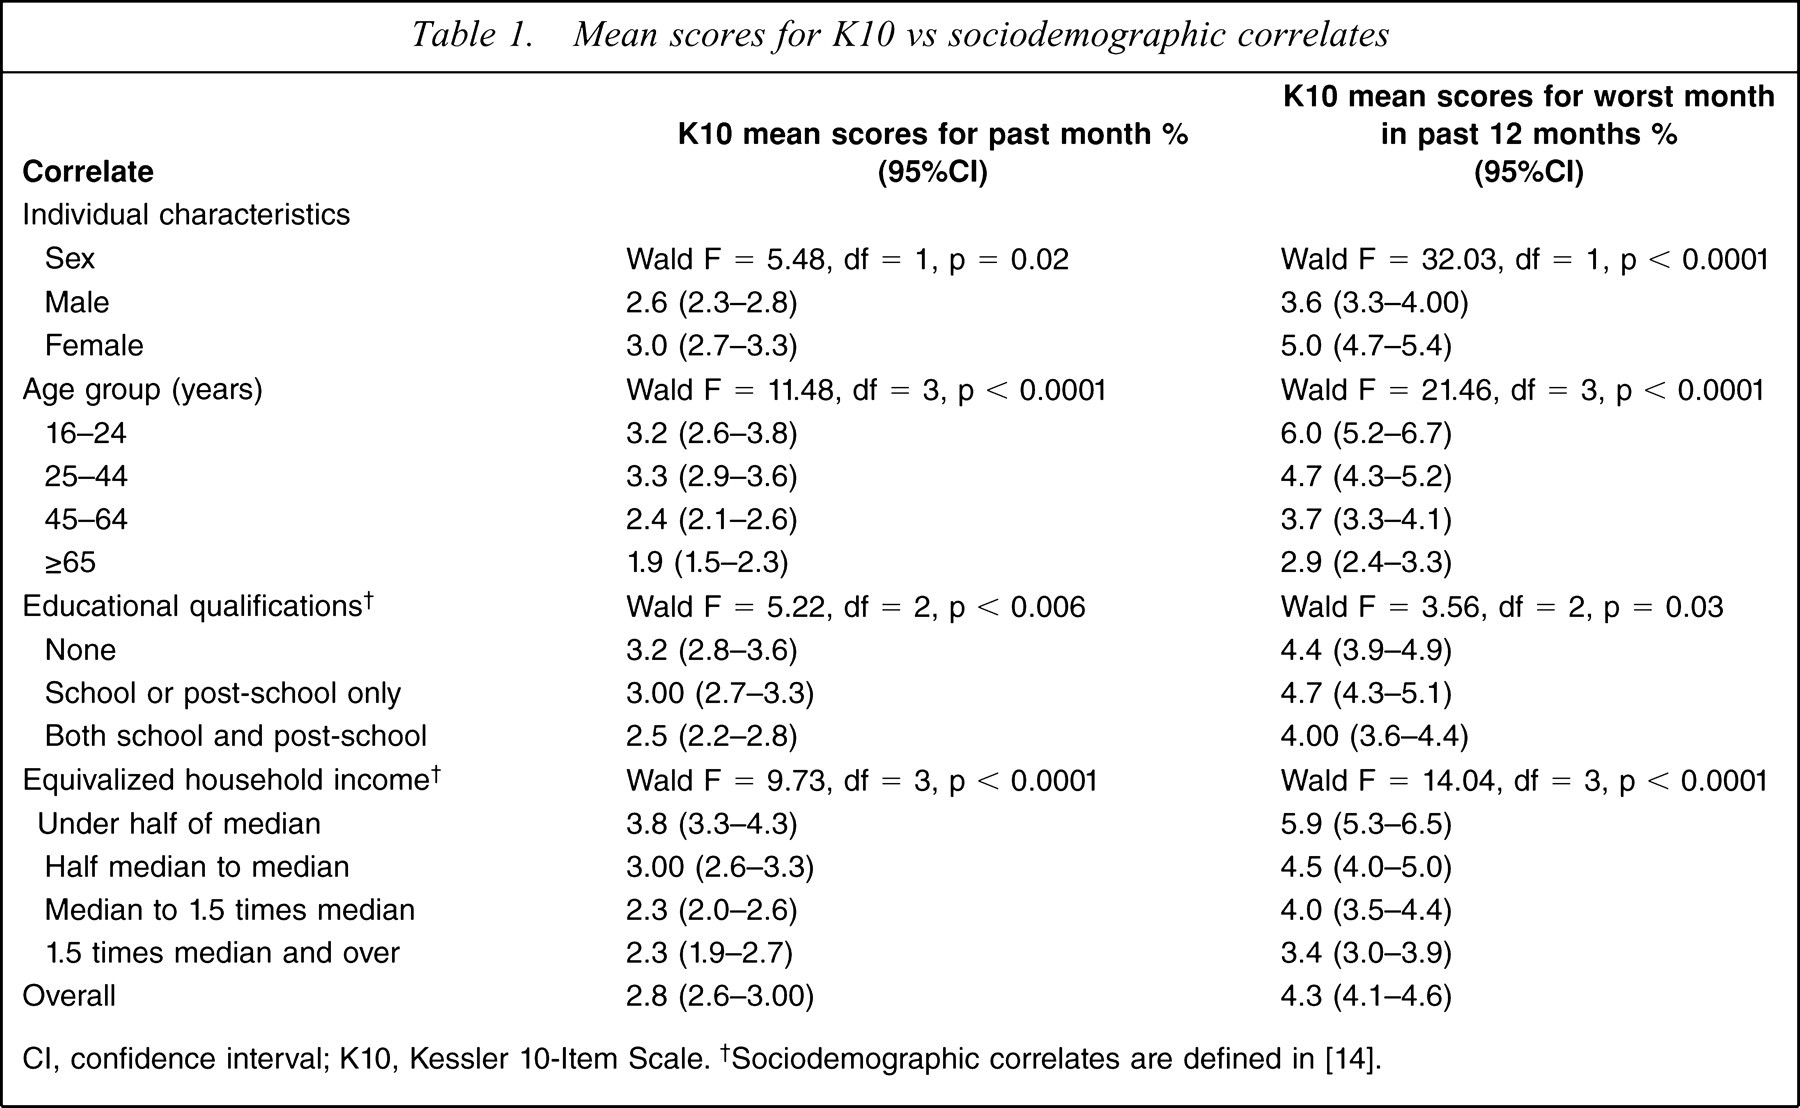
CI, confidence interval; K10, Kessler 10-Item Scale. †Sociodemographic correlates are defined in [14].
Female subjects had significantly higher mean K10 scores compared with male subjects for both the K10 past month and the K10 worst month in the past 12 months. For both versions of the K10, the K10 mean scores differed significantly by age group. For the worst month a clear age gradient existed, with the youngest age group having the highest mean level of distress, and a similar pattern existed for the past month except that the two youngest age groups were equivalent. For educational level there were also significant differences overall, with the most educated group having the lowest levels of distress. For equivalized household income mean levels of psychological distress declined as income increased.
Kessler 10-item Scale scores and ethnicity
The ethnicity results for the K10 are presented in Table 2 as unadjusted means and as means adjusted first for age and sex, then for age, sex and socioeconomic correlates. They are presented for the past month and for the worst month in the past 12 months.
Mean scores for the K10 vs ethnicity
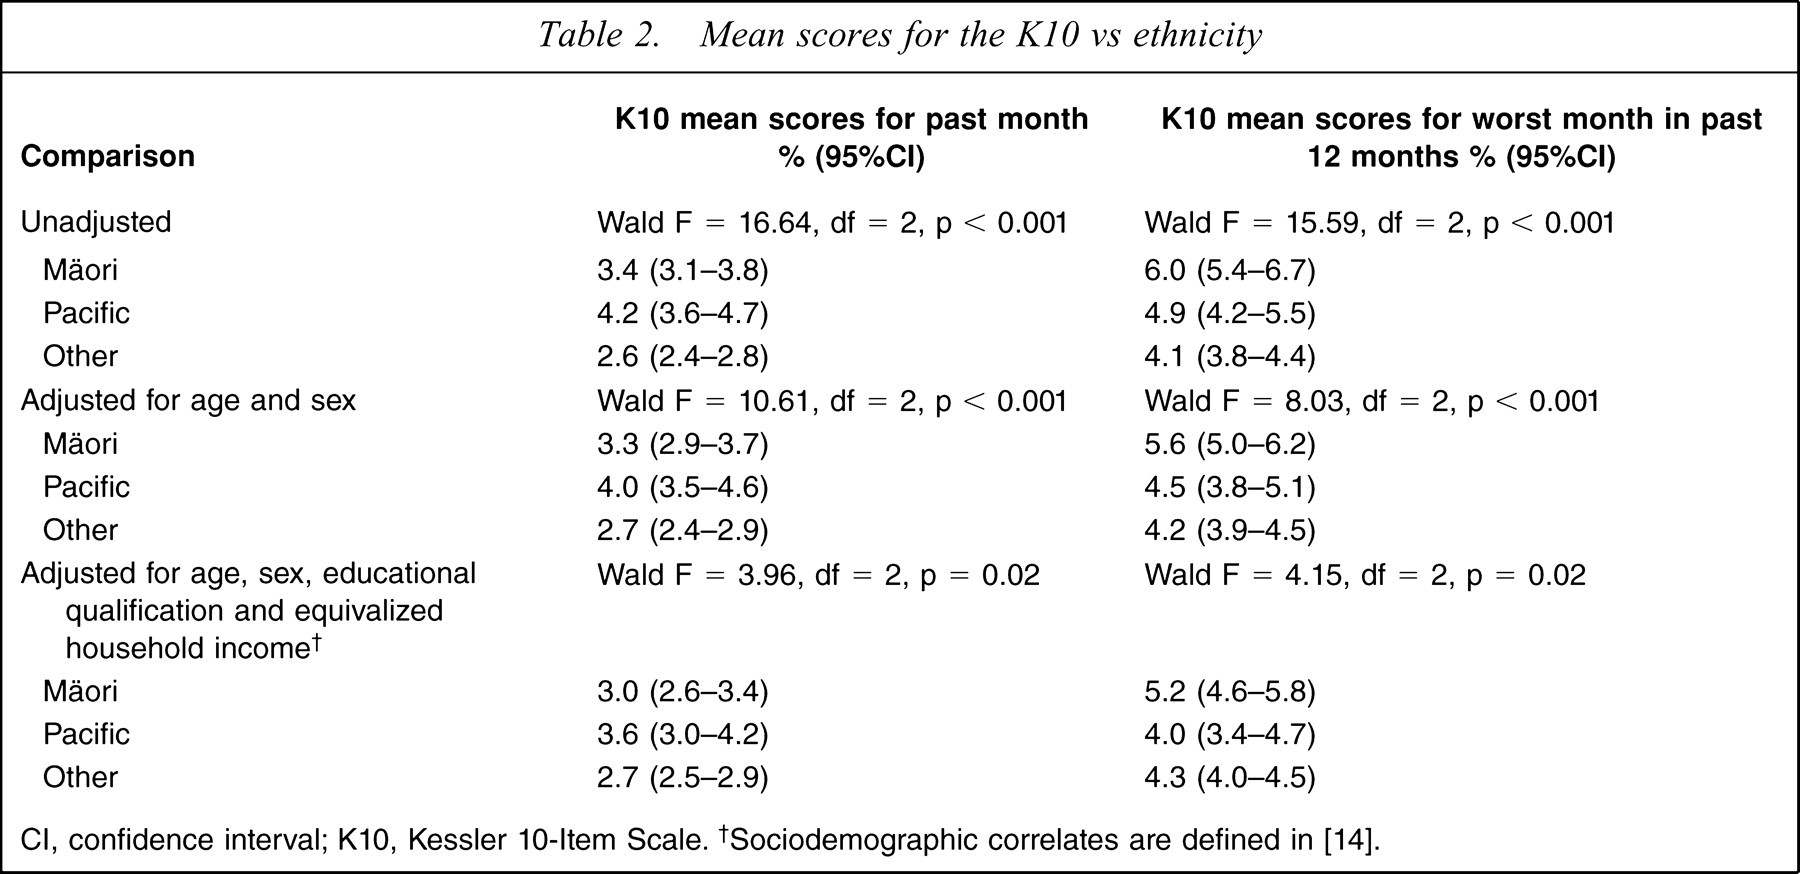
CI, confidence interval; K10, Kessler 10-Item Scale. †Sociodemographic correlates are defined in [14].
For the worst month there were significant ethnic differences for the unadjusted means and smaller but still significant differences after adjustment for age and sex, and still smaller differences after further adjustment for socioeconomic correlates. For unadjusted means Mäori subjects had the highest mean level of psychological distress with Pacific people intermediate between Mäori and the Other composite ethnic group. After adjustment Mäori levels remained elevated but Pacific people and Others had very similar levels. This pattern corresponds to that previously described in Wells et al. [29] and Baxter et al. [30] for the prevalence of any disorder in the past 12 months. For the past month differences between ethnic groups also decreased with adjustment, but still remained significant. For this time period, however, Pacific people had the highest mean score, which was significantly higher than that for the Other composite ethnic group.
K10 scores and area characteristics
The mean scores and standard errors for the past month and worst month in the past 12 months for the K10 are presented in Table 3 by region, urbanicity and the small area descriptor of socioeconomic adversity (the New Zealand Index of Deprivation, NZDep2001), each considered singly. The K10 mean scores do not significantly differ by region or urbanicity. The mean K10 scores for both versions of the questionnaire significantly differ by NZDep2001. There is a very clear gradient whereby mean levels of psychological distress are higher in areas with higher levels of deprivation, as measured by NZDep2001.
Mean scores for the K10 by area characteristics
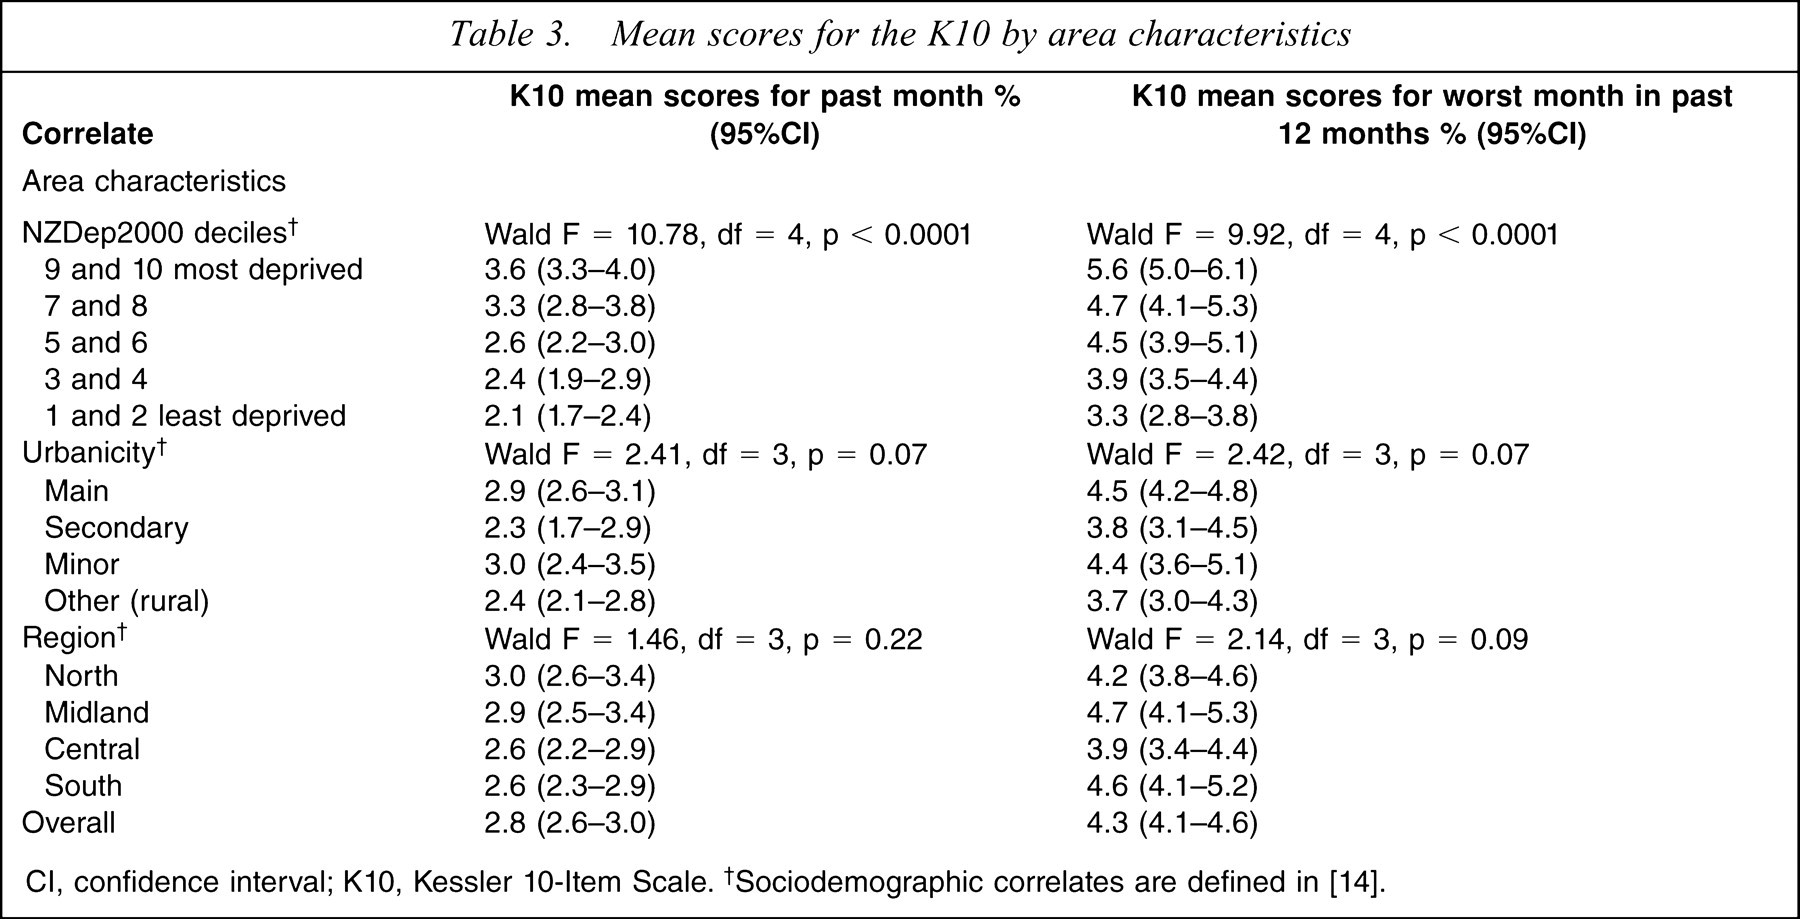
CI, confidence interval; K10, Kessler 10-Item Scale. †Sociodemographic correlates are defined in [14].
K10 scores and 1 month and 12 month mental disorders
Table 4 presents data on the K10 in the past month and the prevalence of any anxiety disorder, any mood disorder, any substance use disorder and any study disorder in that month. The K10 scores are grouped into four bands based on those used in previous Australian surveys [12,26]. Most participants (83.6%) have scores in the lowest (0–4) band, with decreasing percentages of participants in higher bands. The higher the K10 band the more likely the participant will have met criteria for anxiety and mood disorders, with this gradient continuing up to the top band of scores. The pattern for substance use disorder is less consistent: the percentage with substance disorder increases steadily up to the 12–19 category and then decreases slightly for the 20–40 band. For any disorder the percentage with disorder increases sharply up to the 12–19 score band but the increase to the final 20–40 band is small.
K10 scores and prevalence of 1 month mental disorder†
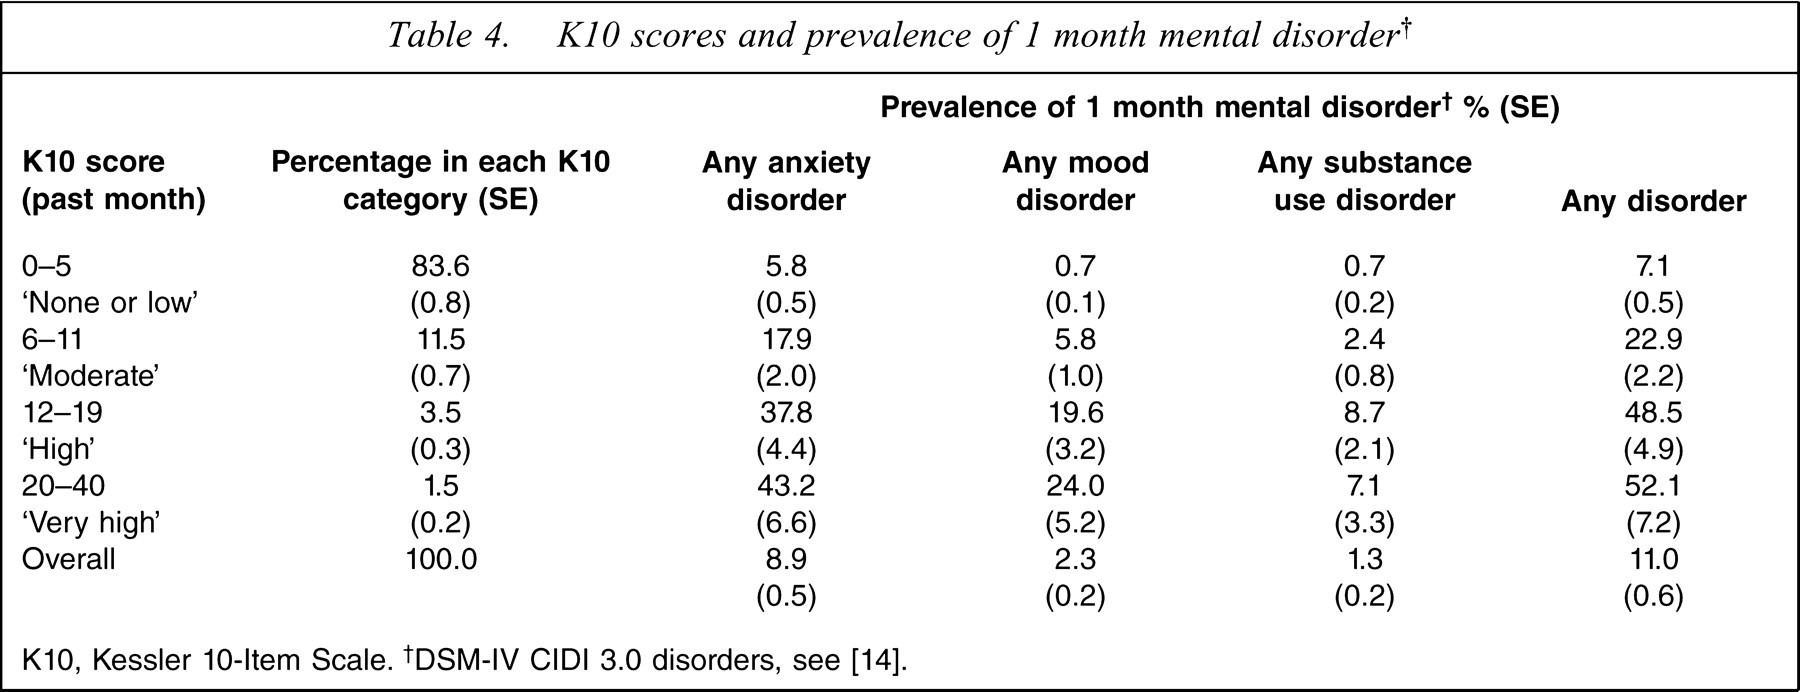
K10, Kessler 10-Item Scale. †DSM-IV CIDI 3.0 disorders, see [14].
Table 5 presents data on Kessler scale scores for the worst month in the past 12 months, and the prevalence of any anxiety disorder, any mood disorder, any substance use disorder and any study disorder within the past 12 months. In addition, data on the Kessler scale scores for the worst month in the past 12 months and the prevalence of any SMI are presented.
K10 scores and prevalence of 12 month mental disorder
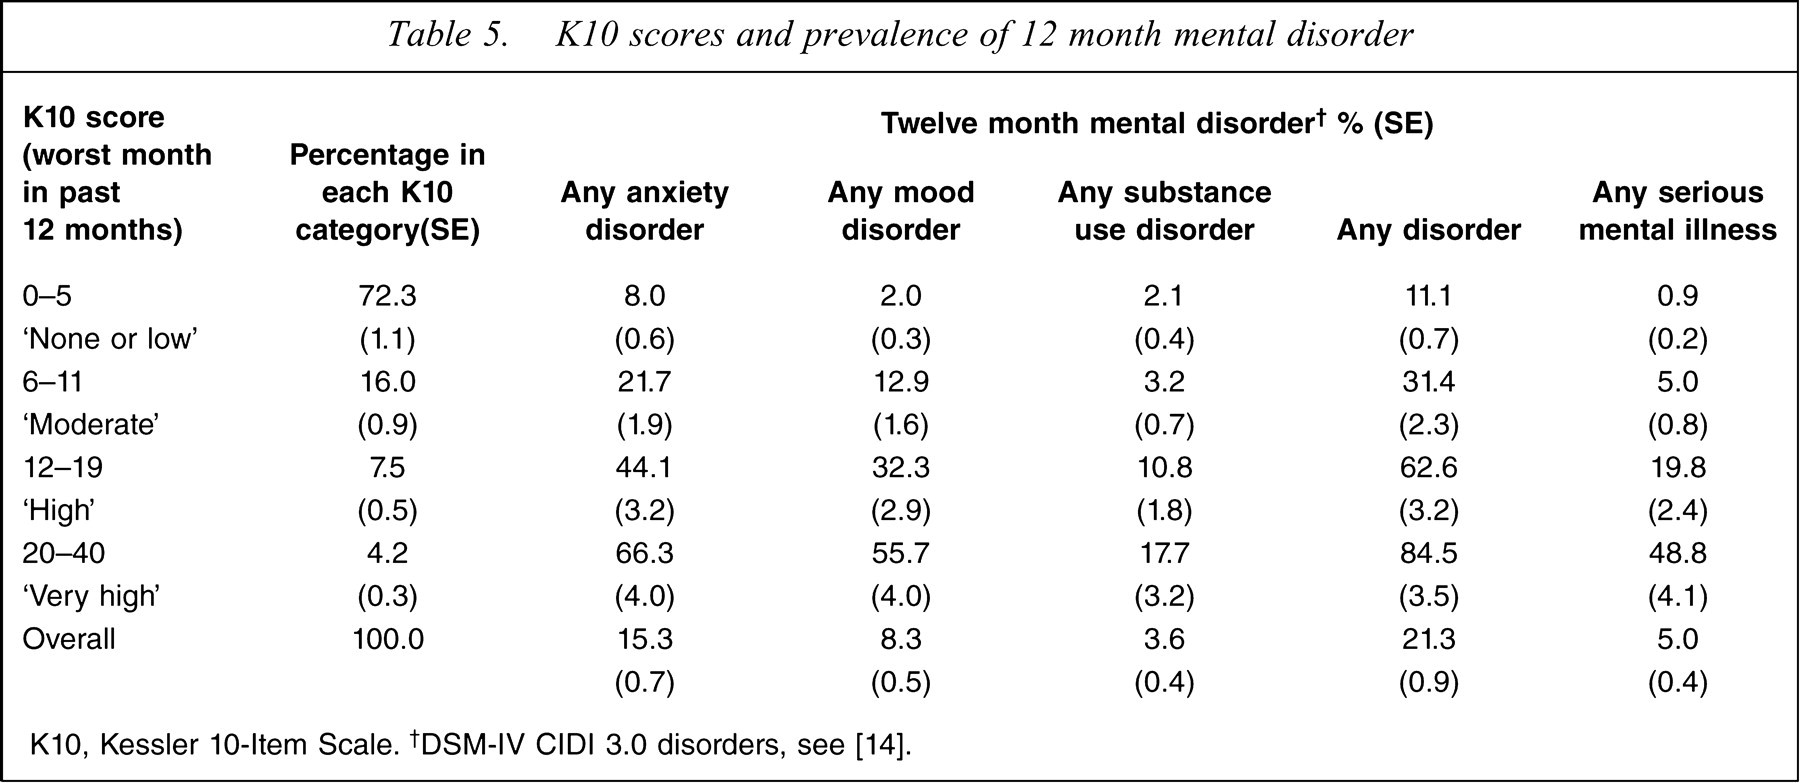
K10, Kessler 10-Item Scale. †DSM-IV CIDI 3.0 disorders, see [14].
As for Table 4, in Table 5 the worst month K10 scores are grouped into four bands. For the past month K10, 83.6% were in the lowest band with scores of 0–5, but for the worst month K10 only 72.3% had scores in this band. The percentages of participants in the higher bands decreased. The higher the score band the more likely that participants would meet criteria for any anxiety disorder, any mood disorder, any substance use disorder or any disorder. This pattern is also found for participants who were classified as having an SMI within the past 12 months.
Kessler Scale scores and receiver operator characteristic curves
Figure 1 shows the ROC curve for SMI in the past 12 months as predicted by the K10 scores for both the last month and worst month in the past 12 months. An ROC curve is a graphical presentation of the ability of a test to discriminate between people with the disorder and people without the disorder. If the test does not discriminate at all the curve is a diagonal from the bottom left to the top right of the graph, because for each value of the test both cases and non-cases are equally likely to score above the cut-off. The area under the curve (AUC) can be interpreted as the probability that a randomly chosen participant with a disorder and a randomly chosen participant without a disorder can be distinguished correctly based on their test scores. A test that does not discriminate at all has an AUC of 0.5. The tables of the sensitivity and non-specificity data for different cut-offs, used to construct the ROC curves for SMI in the last 12 months, are available upon request.
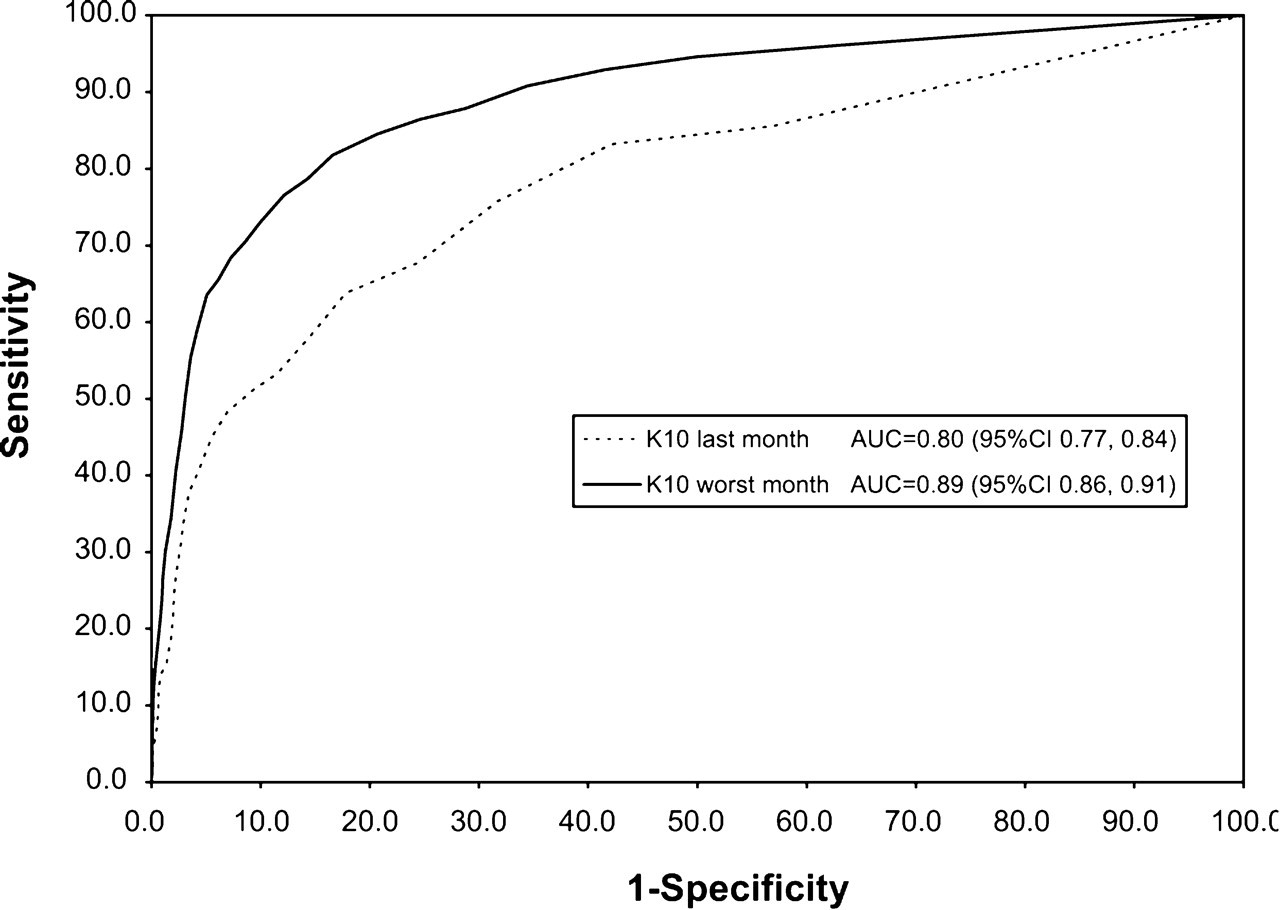
Receiver operator characteristic curves for serious mental illness in the past 12 months as predicted by Kessler 10-Item Scale (K10) scores for (—) the worst month in the past 12 months AUC= 0.89 (95%CI 0.86–0.91) or (—) the past month AUC= 0.80 (95%CI 0.77–0.84). AUC, area under he curve. Serious mental illness is defined in [14,15].
The K10 for the past month is an effective predictor of SMI in the past 12 months, with an AUC of 0.80. The K10 for the worst month in the past 12 months is marginally more effective as a predictor of SMI, with an AUC of 0.89. The difference between AUC estimates is 0.09 (95% confidence interval (95%CI) = 0.04–0.14, p = 0.0005).
Figure 2 shows the ROC curve for any CIDI 3.0 mental disorder in the past 12 months, as predicted by K10 scores for the worst month in the past 12 months or the past month. The tables of the sensitivity and non-specificity data for different cut-offs, used to construct the ROC curves for any CIDI 3.0 mental disorder in the last 12 months, are available upon request.
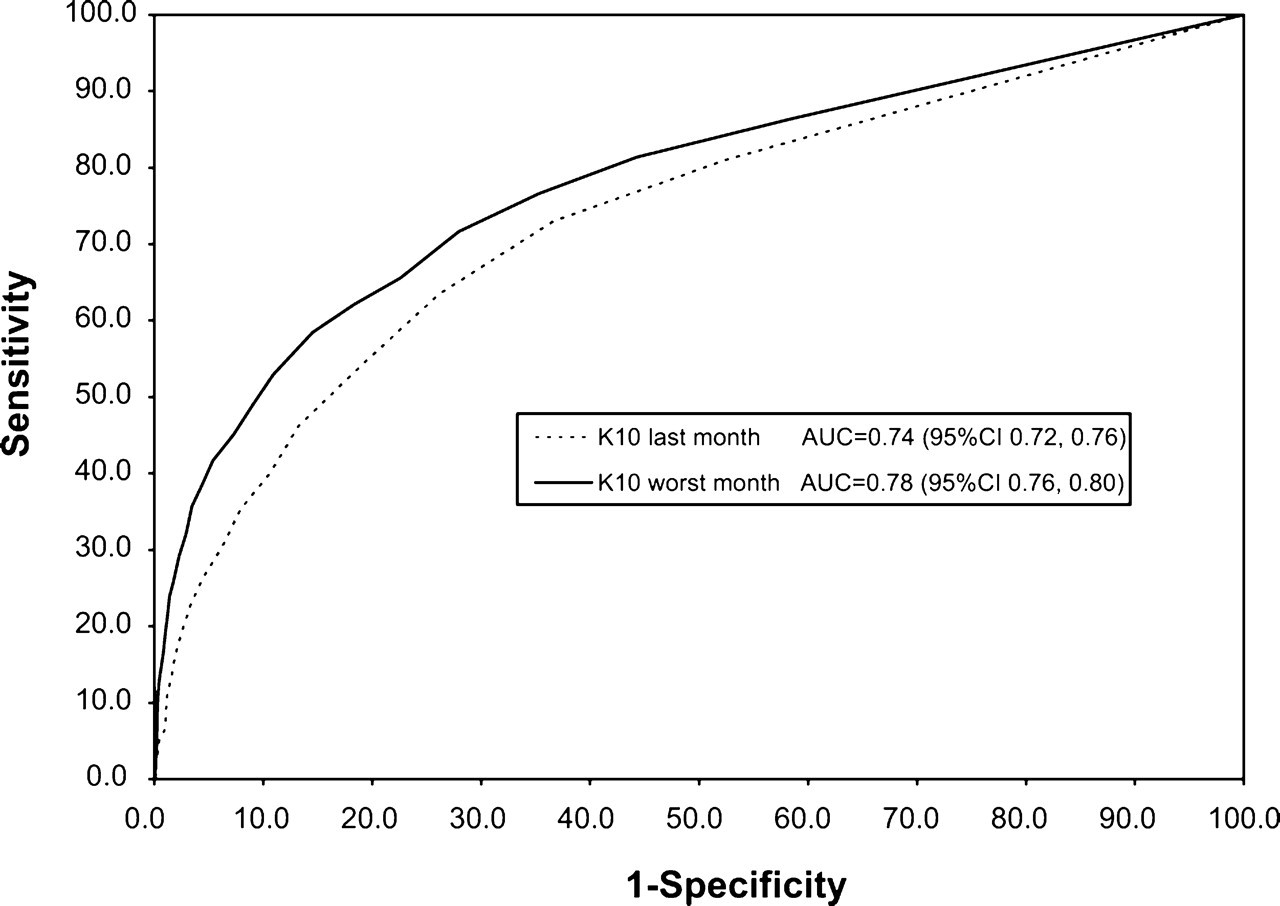
Receiver operator characteristic curves for any 12 month mental disorder as predicted by Kessler 10-Item Scale (K10) scores for(—) the worst month in the past 12 months AUC= 0.78 (95%CI 0.76–0.80) or (—) the past month AUC= 0.74 (95%CI 0.72–0.76). AUC, area under the curve. Mental disorder is defined as DSM-IV CIDI 3.0 disorder.
The K10 performs marginally less effectively as a predictor of any 12 month disorder than as a predictor of SMI. The K10 for the past month AUC for any 12 month disorder is 0.74. The K10 for the worst month in the past 12 months AUC for any 12 month disorder is 0.78. The difference between the AUC estimates is 0.05 (95%CI = 0.01–0.08, p = 0.01).
Discussion
In the NZMHS, scores on both versions of the K10 were higher for female subjects, younger people, people with fewer educational qualifications, people with lower household income and people resident in more socioeconomically deprived areas. These results are very similar to those found in the 2006–2007 New Zealand Health Survey (NZHS) [13]. In that survey the K10 (last month version) was used as a measure of psychological distress. The same cut-offs, as described in the present paper, were used to categorize scores into four groups of probability of anxiety or depressive disorders. In both surveys most adults were found to have no or very low psychological distress, with scores in the 0–5 band (83.6% in the NZMHS and 78.7% in the NZHS). ‘Moderate’ distress was found in 11.5% of adults in the NZMHS and 14.7% of adults in the NZHS. ‘High’ or ‘very high’ distress was found in 5.0% of adults in the NZMHS and 6.6% of adults in the NZHS. The same sociodemographic correlates of psychological distress as measured by the K10 were found in the NZHS as the NZMHS. Both surveys found that Pacific people, compared to other ethnic groups, had higher K10 scores in the last month. The NZMHS, however, did not find higher K10 scores for Pacific people for the worst month in the past 12.
Although the K10 results from the NZMHS are broadly consistent with those obtained in the Australian 1997 National Survey of Mental Health and Wellbeing [6,7] and studies undertaken in the USA [5,8], there are some notable differences. In the present New Zealand study, the K10 was scored as in the US studies (scores of 0–4 on each of 10 items), not as in the Australian study (scores of 1–5 on each of 10 items). Taking this different scoring method into account, the mean for the New Zealand study K10 (past month) of 2.8 (95%CI 2.6, 3.0) is lower than the mean of 4.2 for the Australian sample. In both samples the distribution of scores is highly skewed, with 83.6% scoring <5 in New Zealand, whereas 67.5% scored 0–5 in the Australian sample (10–14 using their scoring). The New Zealand median was 1, whereas the Australian median was 2. The same pattern is seen across the K10 (past month) score bands.
Surprisingly the New Zealand K10 distribution for the worst month is very similar to the Australian distribution for the past month. These results may reflect a real difference in the level of psychological distress in the two countries. They may also have been affected by some methodological differences between the surveys. Two questions had a minor change of order and in Australia the word ‘sad’ was used instead of ‘depressed’ in one question. In the Australian 1997 National Survey of Mental Health and Wellbeing the K10 was given early in the interview, whereas in New Zealand it was given late, after most of the diagnostic sections, the suicidal behaviour section and the health services section. The placement of the K10 late in the interview may lead participants to assess their distress as less than they would have if the K10 was placed earlier in the interview, as a consequence of their responding in the negative to questions in the earlier sections on depression, mania, anxiety, suicide, and health services. The 2001 Australian health survey found results for the past month that were more like the New Zealand results for the past month, but different from those found in the 1997 Australian National Survey of Mental Health and Wellbeing. In comparing results from different studies it may be important to consider possible context effects due to the position of the K10 within the interview. It may be that where the K10 is placed in a survey can produce different responses [12,31].
The NZMHS is unique among community mental health surveys that have included the K10 in that the participants were randomly assigned to two versions of the instrument. Both versions of the K10 were found to be effective in discriminating between CIDI 3.0 cases and non-cases for anxiety disorder, mood disorders and any study disorder. The worst month in the past 12 months K10 is a more effective predictor than the past 1 month K10 of SMI in the last 12 months. In a US study SMI was defined as the presence of at least one DSM-IV diagnosis, other than substance use disorder, and having a GAF score of <60 [5]. In that study the AUC for the K10 (worst month in the past 12 months) as a predictor of SMI was 0.85, which is very close to the AUC of 0.89 estimated in the present study, despite the different definition of SMI.
These results suggest that it is feasible to use appropriately selected cut-off scores on the K10, or the distribution of K10 scores, to obtain estimates of rates of SMI, anxiety disorders and mood disorders from community health surveys.
Footnotes
Acknowledgements
Te Rau Hinengaro: the New Zealand Mental Health Survey was funded by the Ministry of Health, Alcohol Advisory Council of New Zealand and Health Research Council of New Zealand. The survey was carried out in conjunction with the World Health Organization WMH Survey Initiative. We thank the WMH staff for assistance with instrumentation, fieldwork and data analysis. These activities were supported by the US National Institute of Mental Health (R01MH070884), the John D and Catherine T. MacArthur Foundation, the Pfizer Foundation, the US Public Health Service (R13-MH066849, R01-MH069864, and R01 DA016558), the Fogarty International Center (FIRCA R01-TW006481), the Pan American Health Organization, Eli Lilly, Ortho-McNeil Pharmaceutical, GlaxoSmithKline, and Bristol-Myers Squibb. WMH publications are listed at ![]() Other members of the NZMHS Research Team are J. Baxter, T.K. Kingi, R. Tapsell, S. Foliaki, J. Kokaua, D. Schaaf, M.H. Durie, C. Tukuitonga and C. Gale. We thank Gavin Stewart (Coordinator, AMHAT Project, Aboriginal Health and Medical Research Council of New South Wales, Sydney, Australia) who provided technical advice on the scoring and cutoffs for the K10. We thank the Kaitiaki Group and Pacific Advisory Group for their input and support for this survey and we thank all the participants.
Other members of the NZMHS Research Team are J. Baxter, T.K. Kingi, R. Tapsell, S. Foliaki, J. Kokaua, D. Schaaf, M.H. Durie, C. Tukuitonga and C. Gale. We thank Gavin Stewart (Coordinator, AMHAT Project, Aboriginal Health and Medical Research Council of New South Wales, Sydney, Australia) who provided technical advice on the scoring and cutoffs for the K10. We thank the Kaitiaki Group and Pacific Advisory Group for their input and support for this survey and we thank all the participants.