
Abstract
One previous community survey in New Zealand, the Christchurch Psychiatric Epidemiology Study, has provided information about the lifetime prevalence of specific mental disorders among adults [1]. That survey was undertaken in 1986 in the Christchurch urban area and the sampling frame was a non-institutional household sample of people aged 18–64 years. The diagnostic instrument used (the Diagnostic Interview Schedule) [2] was based on the DSM-III diagnostic system, which has been superseded by the DSM-IV. The Christchurch Psychiatric Epidemiology Study did not provide information about lifetime prevalence in Māori or Pacific people and it is doubtful whether the results can be generalized to the national population. It is also possible that, with the passage of time, prevalences of disorders may have changed. The birth cohort studies in Dunedin (http://dunedinstudy.otago.ac.nz/) and Christchurch (http://www.chmeds.ac.nz/research/chds) have included repeated estimates of prevalences of mental disorders at specific ages, but their participants were last interviewed in their mid-20s or early 30s so these studies could not provide prevalences that can be generalized to the national adult population. The Australian National Survey of Mental Health and Well-being [3, 4]; was a nationally representative household survey completed in 1997. The sample included people aged 18 years and over. The survey instrument was the Composite International Diagnostic Interview (CIDI) version 2.1 and this generated DSM-IV diagnoses, but only for disorders present in the 12 months before interview. Lifetime prevalences were not obtained. After the Australian survey was completed, the New Zealand Ministry of Health decided a national study was required in New Zealand to inform policy. The Ministry of Health specified that one of the main objectives for the New Zealand survey (Te Rau Hinengaro: The New Zealand Mental Health Survey) was to describe, for the total New Zealand, Māori and Pacific populations living in New Zealand, ‘the lifetime prevalence rates of major mental disorders among people aged 16 years and over living in private dwellings, by sociodemographic variables’ [5, 6].
Lifetime prevalence estimates are based on those people who, at the time of the interview, had ever met criteria for a disorder. In contrast, estimated lifetime risk is a projected estimate of the proportion of people in the population who would ever have experienced a disorder by the end of their lifetime [7] or by a specified age such as 75 years. Lifetime risk is useful when considering the burden of disease in a population and for service planning purposes. It is not possible to obtain the actual lifetime risk from cross-sectional surveys, as at the time of the interview many people will not yet have experienced disorders that will occur for them later. However, if the age of onset of disorder data is obtained, it is possible to estimate the lifetime risk using survival analysis. This has seldom been done in psychiatric surveys, in part because the techniques have not been available for complex survey data. This paper reports on: (i) lifetime prevalence; (ii) the distribution of the age of onset for each individual disorder and disorder group; (iii) separate lifetime risk estimates for each birth cohort to explore whether lifetime risk is highest for those born more recently; and (iv) the relationship between lifetime risk of mental disorder and age, sex, socioeconomic correlates and ethnicity. Lifetime prevalence is reported here for the whole New Zealand population; detailed lifetime prevalences for the Māori and Pacific populations are reported in separate papers [8,9].
Method
Sample
The New Zealand Mental Health Survey (NZMHS) was a nationally representative household survey of people aged 16 years and over. Face-to-face interviews were carried out between October 2003 and December 2004. The survey was approved by all 14 regional health ethics committees, with the Auckland Y committee serving as the lead committee. Written informed consent was obtained from all respondents before the interview began. Māori and Pacific people were oversampled. A detailed report of methods is given elsewhere [5, 10]. The response rate was 73.3%. The interview consisted of two parts. Part 1 included core diagnostic sections and demographics and was administered to everyone (n = 12 992). Part 2 consisted of additional diagnostic sections and other measures of mental and physical health and was administered to a subsample (n = 7435), called the long-form subsample.
Interview
The interview was based on version 15 of the World Mental Health (WMH) CIDI [11], a fully structured lay interview. Version 20 is now known as the CIDI 3.0 (http://www.hcp.med.harvard.edu/wmh/).
Diagnoses
Although ICD-10 [12] and DSM-IV [13] diagnoses can both be made from the CIDI 3.0, only DSM-IV diagnoses are reported here, using hierarchy rules. Onset for bipolar disorder was the first episode of mania or hypomania.
Sociodemographic correlates
Sociodemographic correlates include age at interview (which for some analyses is categorized into age groups and these are equivalent to birth cohorts), sex, prioritized ethnicity, educational qualifications and equivalized household income. Multiple ethnicity was permitted. The Statistics New Zealand prioritization rule for ethnicity assignment was followed. This rule classifies those who identify solely as Māori and those who identify Māori as one of their ethnic groups (when there are more than one) as Māori. Those who self-identify as any Pacific ethnic group, but not Māori, are defined as Pacific. Those who were not Māori and not Pacific were included in a composite ‘Other’ ethnic group. There were 2595 Māori and 2236 Pacific people.
The interview does not permit temporal sequencing of educational achievements or income history with respect to onset and recency of disorder. In this paper, educational qualifications and equivalized household income are used as proxy measures of socioeconomic status at the time of onset of disorder. Educational qualifications were assessed using 2001 census questions about school and post-school qualifications. Household income was missing for 13.0% of respondents and was imputed by linear regression. A modification of the revised Jensen equivalence scale for household income [14] was used to take account of the number of adults and the number of children in the household.
Analyses
Data were weighted to account for different probabilities of selection that arose from oversampling Māori and Pacific people and the selection of one person per household, differential non-response, and residual differences in age, sex and ethnicity between the sample and the 2001 census population. Additional weights were used to account for selection into the short- and long-form sections of the interview. Analyses were carried out in SUDAAN 9.0.1. Taylor series linearization [15] was used to approximate the variance of estimates. For prevalences with less than 30 events in the numerator, confidence intervals were calculated according to a method by Korn and Graubard [16, 17].
Survival analysis was used to estimate projected lifetime risk at age 75 years on the basis of age of onset data. As participants reported age of onset in whole years, discrete time proportional hazards analyses were carried out with 1 year intervals. The median onset age is obtained by recalibrating the onset curve to be 100% at the largest observed value [18], which could be greater than 75 years. Other percentiles of the onset curves are calculated similarly.
For ethnicity comparisons a series of survival analyses were carried out. First results are presented for the three ethnic groups, then they are adjusted for age and sex, and finally they are adjusted for age, sex, and socioeconomic correlates (educational qualification and equivalized household income) [5, 10].
Results
Lifetime prevalence
The lifetime prevalence estimates for individual DSM-IV disorders are presented in Table 1, overall and by age and sex. The experience of a mental disorder is relatively common, with a substantial minority of the sample (39.5%) meeting criteria for a disorder at some time before the interview. Although most people experienced only one disorder (20.0%), comorbid mental disorders were common, with a minority experiencing two mental disorders (9.9%) or three or more mental disorders (9.7%).
Lifetime prevalence of mental disorders, †by age and sex
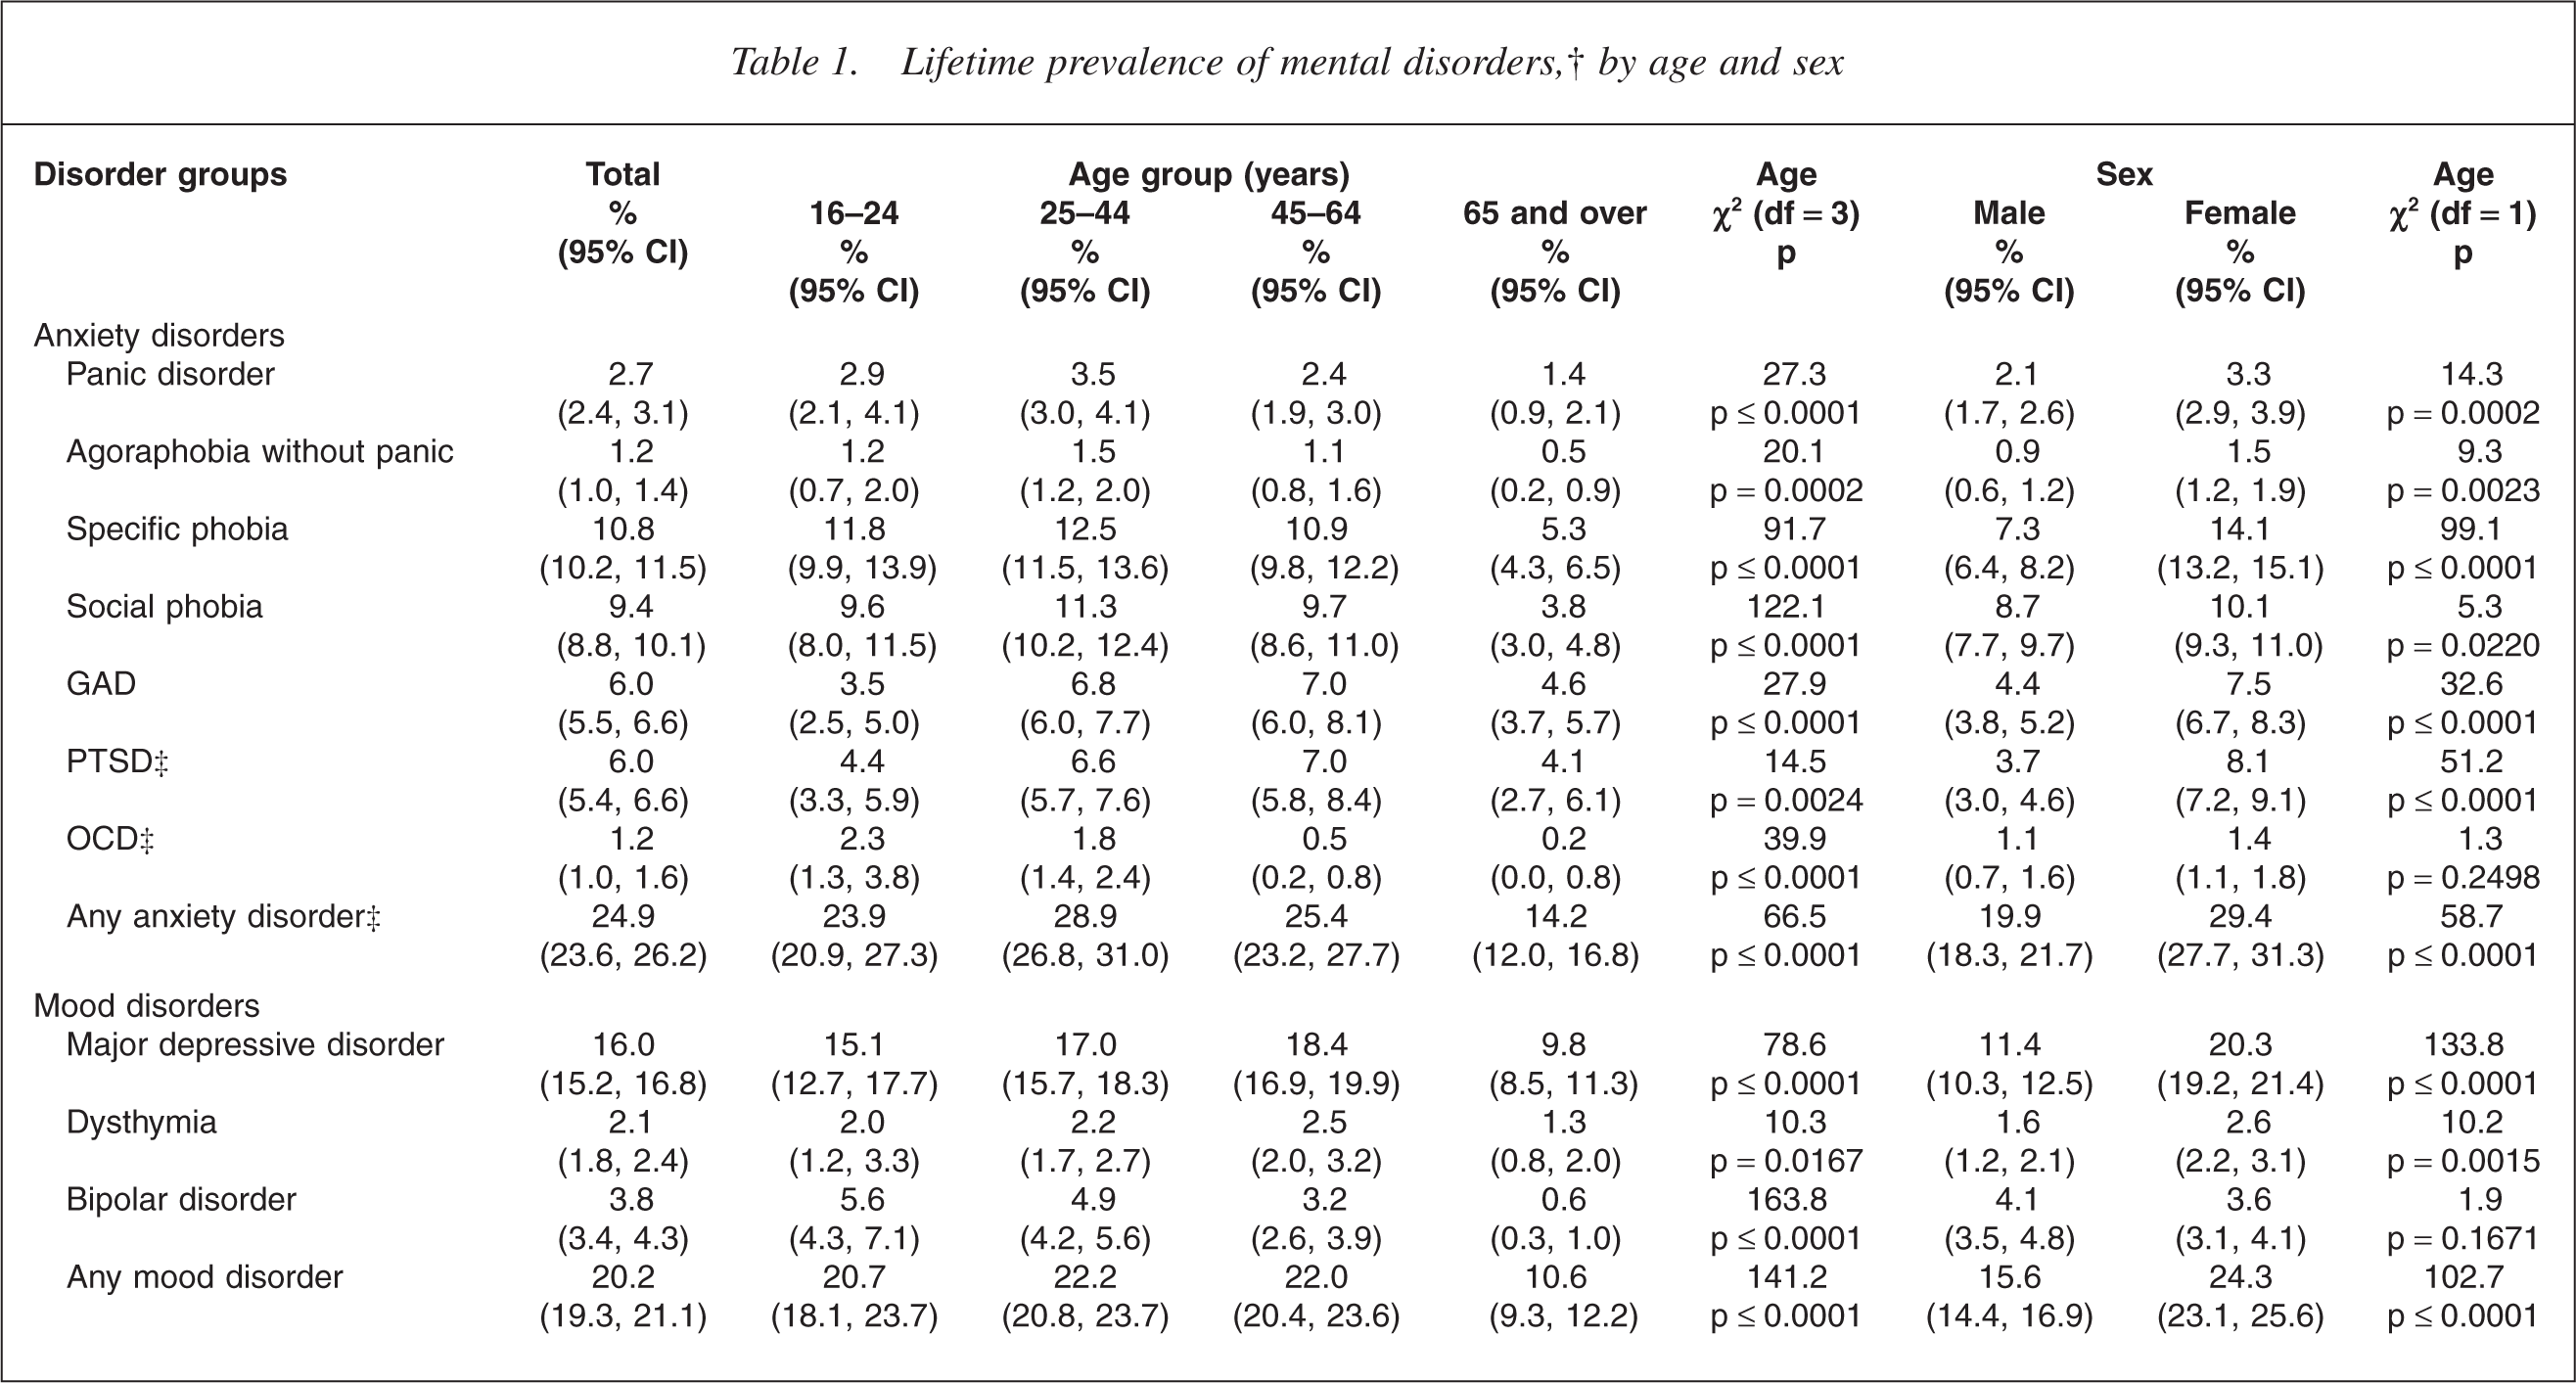
†DSM-IV CIDI 3.0 disorders with hierarchy (except for substance use disorders where abuse is reported whether or not there is dependence); ‡Assessed in the subsample who did the long-form interview. CI, confidence interval; GAD, generalized anxiety disorder; OCD, obsessive–compulsive disorder; PTSD, posttraumatic stress disorder.
Overall lifetime prevalences
Of the diagnostic groups, anxiety disorders were the most prevalent (24.9%) followed by mood disorders (20.2%), substance use disorders (12.3%) and eating disorders (1.7%).
Within the anxiety disorders, specific phobia is the most prevalent disorder (10.8%), followed by social phobia (9.4%), generalized anxiety disorder (6.0%), posttraumatic stress disorder (6.0%), panic disorder (2.7%), agoraphobia without panic disorder (1.2%) and obsessive–compulsive disorder (1.2%).
Within the mood disorders, major depressive episode is the most prevalent disorder with an overall lifetime prevalence rate of 16.0%. The overall lifetime rate for dysthymia is 2.1% and for bipolar disorder is 3.8%. Within bipolar disorder 1.0% (0.8, 1.2) met criteria for bipolar I disorder, 0.7% (0.6, 0.9) met criteria for bipolar II disorder and 2.1% (1.8, 2.4) met criteria for subthreshold bipolar disorder.
Of the substance use disorders, alcohol abuse (with or without dependence) is the most prevalent disorder with a lifetime prevalence of 11.4%. Drug abuse is the second most prevalent disorder (5.3%), followed by alcohol dependence (4.0%) and drug dependence (2.2%).
Anorexia is an uncommon disorder with an overall lifetime prevalence rate of 0.6%. The overall lifetime prevalence rate for bulimia is 1.3%.
Lifetime prevalences by age
The highest prevalence of any disorders is found in the group aged 25–44 years (45.1%), while the lowest prevalences (22.4%) are found in the oldest age group (65 years and over) (p ≤ 0.0001).
Anxiety disorders are most prevalent in the group aged 25–44 years and least prevalent in the oldest age group (14.2%; p ≤ 0.0001), although, as Table 1 shows, this pattern varies by individual anxiety disorder.
For any mood disorders, the prevalence rate pattern across age groups is the same as for anxiety disorders, and of the individual mood disorders, major depressive disorder and dysthymia are consistent with this pattern. Bipolar disorder departs from this pattern with its prevalence highest in the youngest age group. Substance use disorders are also most prevalent in the youngest age group and are relatively uncommon (4.0%) in the oldest age group (p ≤ 0.0001).
Eating disorders are uncommon across all four age groups, but they follow the pattern of anxiety and mood disorders with the highest prevalences found in the group aged 25–44 years.
Lifetime prevalence by sex
Females have higher (p = 0.0003) overall prevalences of any disorder (42.3%) than males (36.5%), but this is not consistent across disorders.
Females have higher prevalence of anxiety disorders (29.4%) than males (19.9%) (p ≤ 0.0001) and this pattern is seen for all individual disorders (p ≤ 0.02) except obsessive–compulsive disorder (p = 0.3). Females also have higher prevalences of mood disorders than males (24.3% vs 15.6%; p ≤ 0.0001). Females have higher prevalences than males for major depressive disorder (20.3% vs 11.4%; p ≤ 0.0001) and dysthymia (2.6% vs 1.6%; p ≤ 0.002). The prevalences of bipolar disorder for females and males are very similar and not statistically significantly different (3.6% vs 4.1%; p = 0.2). Males have higher prevalences of substance use disorders than females (17.3% vs 7.7%; p ≤ 0.0001). Males have higher prevalences than females of alcohol abuse (16.3% vs 6.9%; p ≤ 0.0001), alcohol dependence (5.6% vs 2.6%; p ≤ 0.0001), drug abuse (7.3% vs 3.5%; p ≤ 0.0001) and drug dependence (2.9% vs 1.5%; p ≤ 0.0001).
Females have higher prevalences than males for both anorexia (1.0% vs 0.1%; p ≤ 0.0001) and bulimia (2.0% vs 0.5%; p ≤ 0.0001).
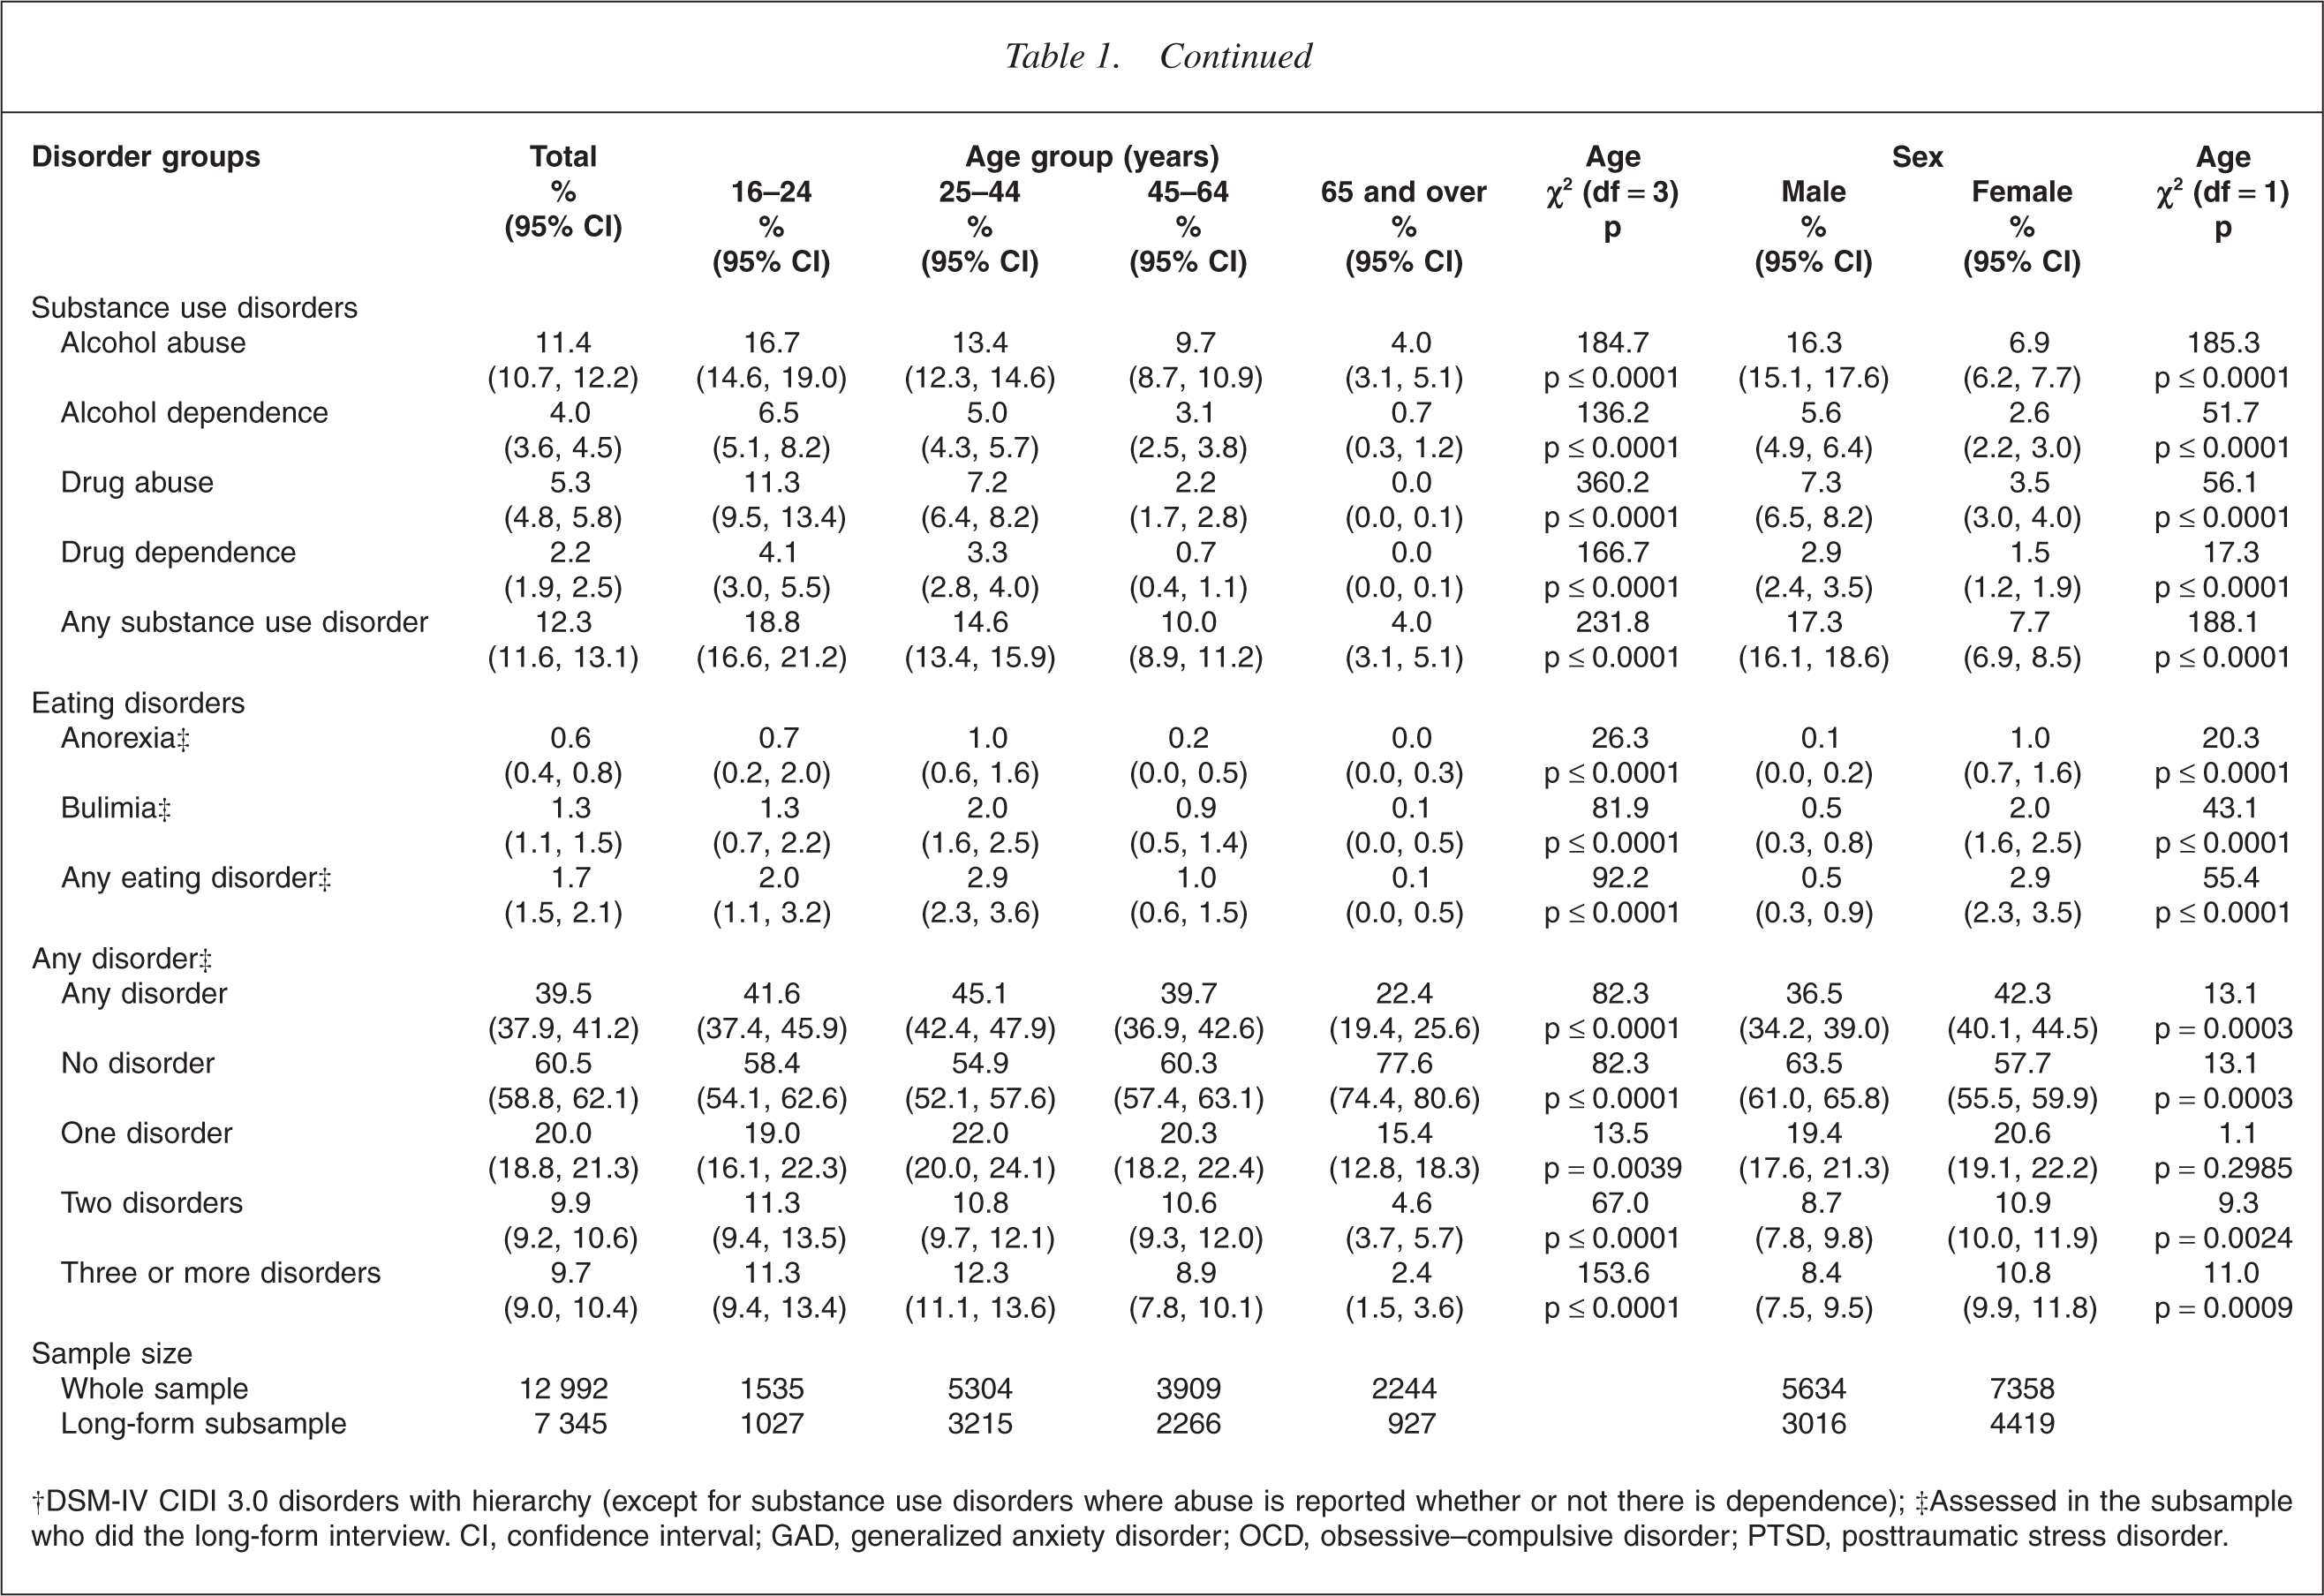
Projected lifetime risk and age of onset of disorder
Table 2 shows the projected lifetime risk at age 75 years by disorder group and individual disorders. The ages at selected percentiles on the age of onset distributions of disorders are also presented.
Projected lifetime risk at age 75 years and age at selected percentiles on the age of onset distributions of mental disorders
Most people experience onset of their disorders early in their lives. For example, for panic disorder 5% of all cases will have experienced panic disorder by age 7 years, 25% by age 17 years, 50% by age 30 years, 75% by age 56 years and 99% by age 86 years. Specific phobia has the earliest onset (50% by age 7 years) and generalized anxiety disorder and major depressive disorder have the highest median onset ages (32 years). Half of all people who will develop any disorder have experienced disorder by age 18 years and three quarters by age 34 years. Median age of onset is 13 years for anxiety disorders, 32 years for mood disorders, 18 years for substance use disorders and 17 years for eating disorders.
The gap between the lifetime prevalence estimates and the projected lifetime risk estimates varies by disorder: for those disorders that typically have onset early in life, the gap is small, whereas for disorders that have onset through middle or late adulthood, the gap is larger. For instance, social phobia tends to begin early in life with the median age of onset being 12 years with three quarters developing the disorder before age 16 years. For social phobia, the lifetime prevalence is 9.4% and the lifetime risk is 10.0%, a gap of only 0.6%. This suggests only a very small number of participants, who had not experienced social phobia ever in their lives at the time of the survey interview, can be expected to develop social phobia at some time before they reach 75 years. In contrast, major depressive disorder tends to have onset through the lifespan: the median age of onset is 32 years and three quarters will experience an episode by age 49 years. Consequently, for major depressive disorder, the gap between the lifetime prevalence estimates (16.0%) and the lifetime risk estimates (25.7%) is larger (approximately 10%). The estimates for lifetime risk, for any disorder, by age 75 years, for the total sample is 46.6%. This is approximately 7% more than the lifetime prevalence of 39.5%.
Lifetime risk across different birth cohorts
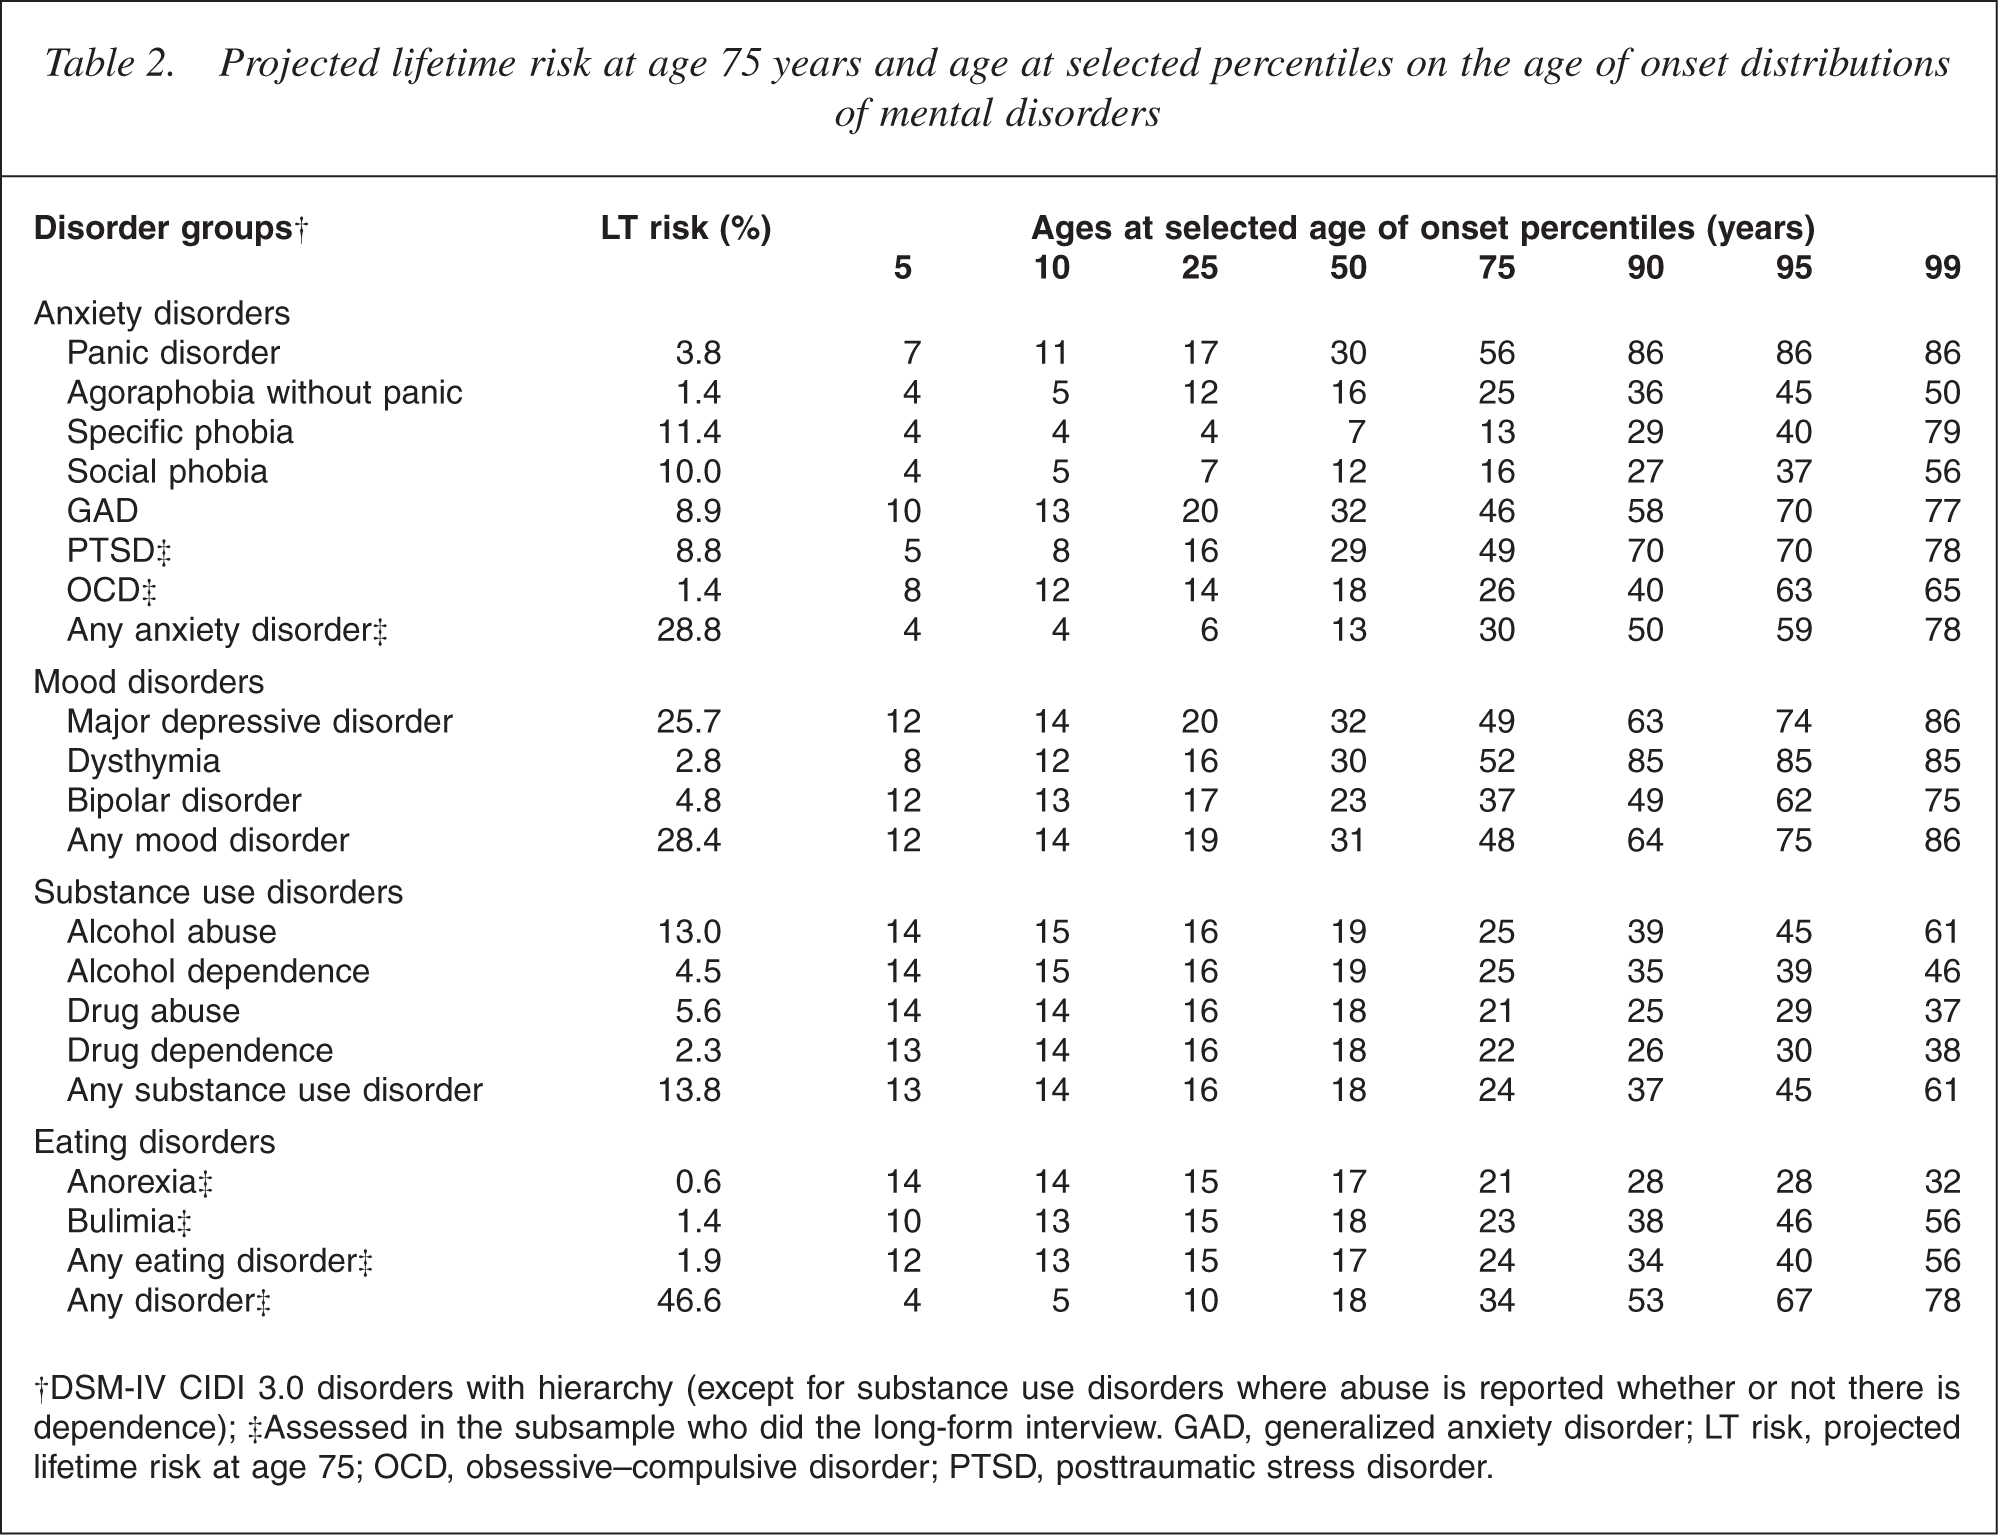
Cumulative lifetime risk curves for the onset of any mental disorder are presented in Fig. 1. Separate onset curves are provided for the groups aged 16–24 years, 25–44 years, 45–64 years, and 65 years and over at the time of the interview. These groups represent different birth cohorts with the youngest group having been born between 1978 and 1987 and the oldest age group before 1939. At the time of interview, the median age of participants was 42 years (inter-quartile range 30–56 years) and the mean age was 44 years (SEM 15.5 years).
Onset of any disorder (DSM-IV CIDI 3.0 disorders with hierarchy) by age group (birth cohort). (————) 16–24 years, (·············) 25–44 years, (— · — ·—) 45–64 years, (– – – – – – –) 65+ years.
The onset curves show that younger age groups have higher probabilities of disorder at any particular age compared with older age groups. For example, the percentages of people who have experienced any disorder by age 21 years are: 43% for the group aged 16–24 years; 33% for the group aged 25–44 years; 23% for the group aged 45–64 years; and 9% for the group aged 65 years and over. These results may be subject to bias and should be interpreted with caution (see Discussion); nevertheless, they show that birth cohort must be taken into account when comparing the risks of disorder across socioeconomic correlates.
Age, sex, ethnicity, educational level and equivalized household income as predictors of lifetime risk
In this section sociodemographic correlates are considered as predictors of lifetime risk of any anxiety disorder, mood disorder, substance use disorder, eating disorder and any disorder. The sociodemographic correlates considered are age (birth cohort), sex, ethnicity, educational level and equivalized household income. Birth cohort, sex and ethnicity do not vary during life and are not affected by mental disorders. Therefore, they are appropriate as predictors. Education and income are not like that as they may be outcomes of disorder as well as predictors. However, as reports of education and income throughout life are not available, current education and income are used as proxies for conditions occurring earlier. Because of their dual status as outcomes as well as predictors, including them in models would be expected to exaggerate their effects. Furthermore, adjusting for education and income should overcorrect for their effects. Therefore, if ethnic differences remain after such adjustment it should be appropriate to conclude that these differences are real and are not the result of socioeconomic confounding. Because of the different status of the predictors, models were fitted with age, sex and ethnicity and then with education and income.
Table 3 also shows hazard ratios (HRs) by age group (birth cohort) and sex, adjusted for ethnicity. Compared with the group aged 65 years and over, the other age groups have significantly higher HRs for any disorder and anxiety, mood, substance use and eating disorders (p λτ 0.0001 for all comparisons). There is a gradient across the age groups, with younger groups having higher HRs than older groups; a gradient that is extreme for eating disorders and minimal for anxiety disorders.
Hazard ratios for estimated projected lifetime risk for disorder groups, †by age group (birth cohort) and sex, adjusted for ethnicity
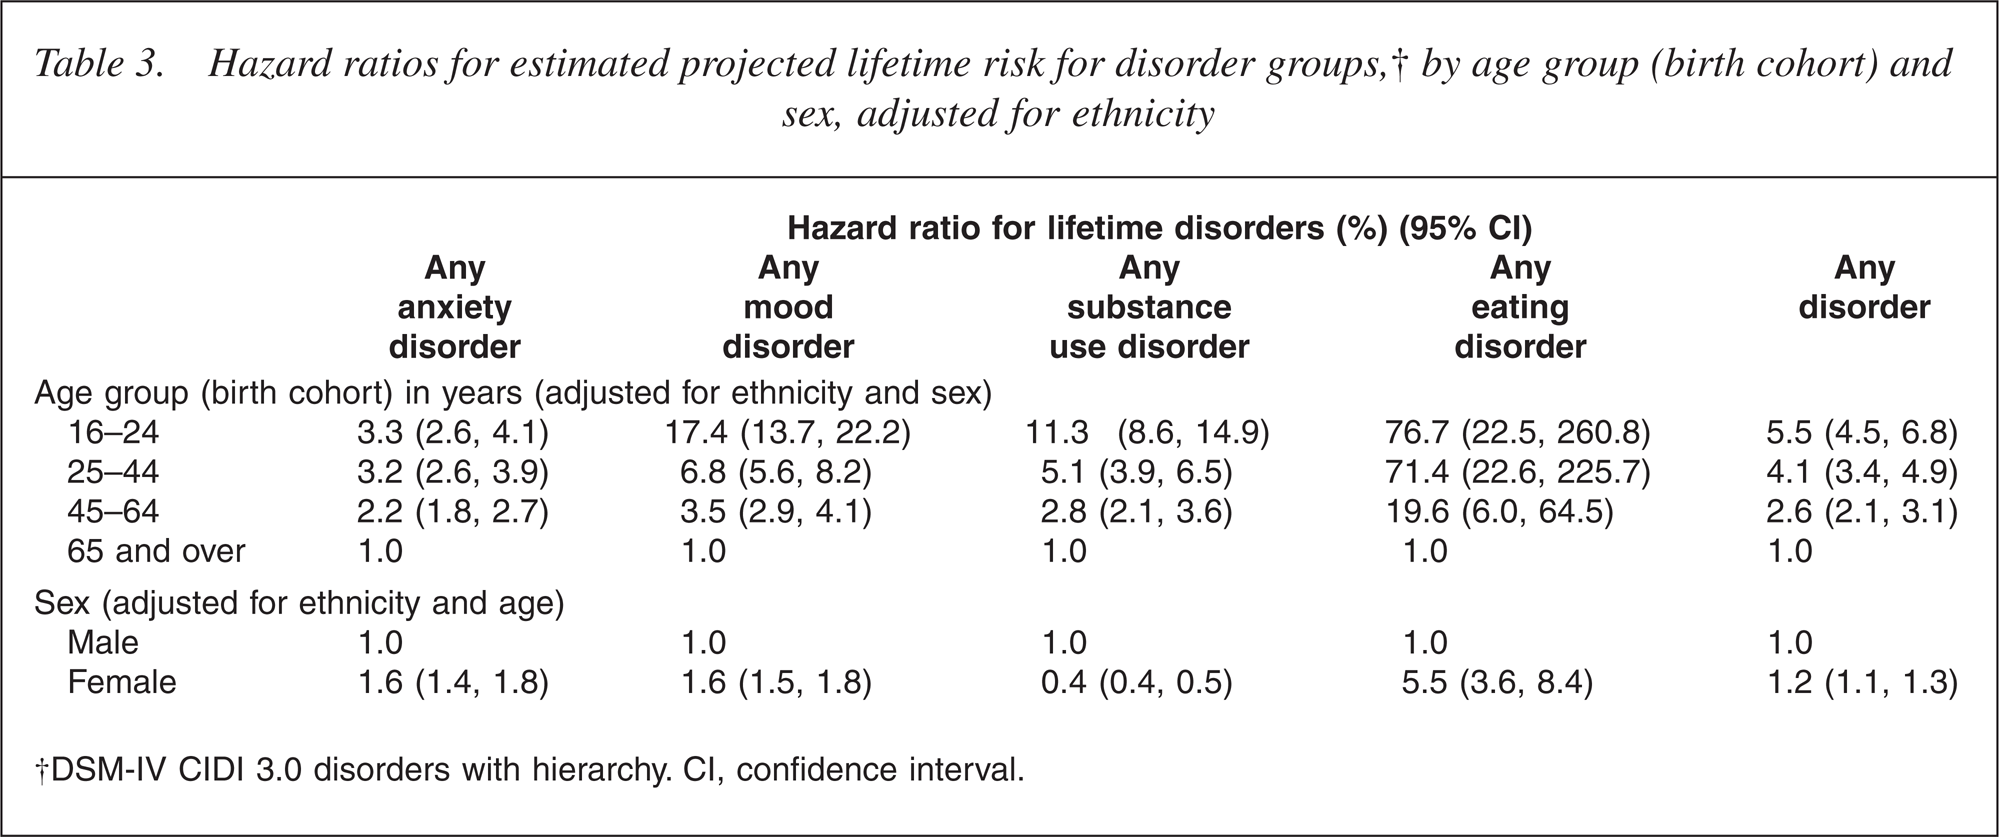
Females have higher HRs than males for any disorder (p = 0.0003). For the disorder groups, females have higher HRs than males for any anxiety, mood, or eating disorder, but lower HRs for substance use disorder (p λτ 0.0001 for all comparisons).
Table 4 shows a sequence of ethnic comparisons unadjusted, adjusted for age group and sex, then adjusted for socioeconomic correlates (educational level and equivalized household income).
Hazard ratios for estimated projected lifetime risk for disorder groups, by age group (birth cohort), sex and ethnicity (unadjusted and adjusted for the influence of age group, sex and socioeconomic correlates)
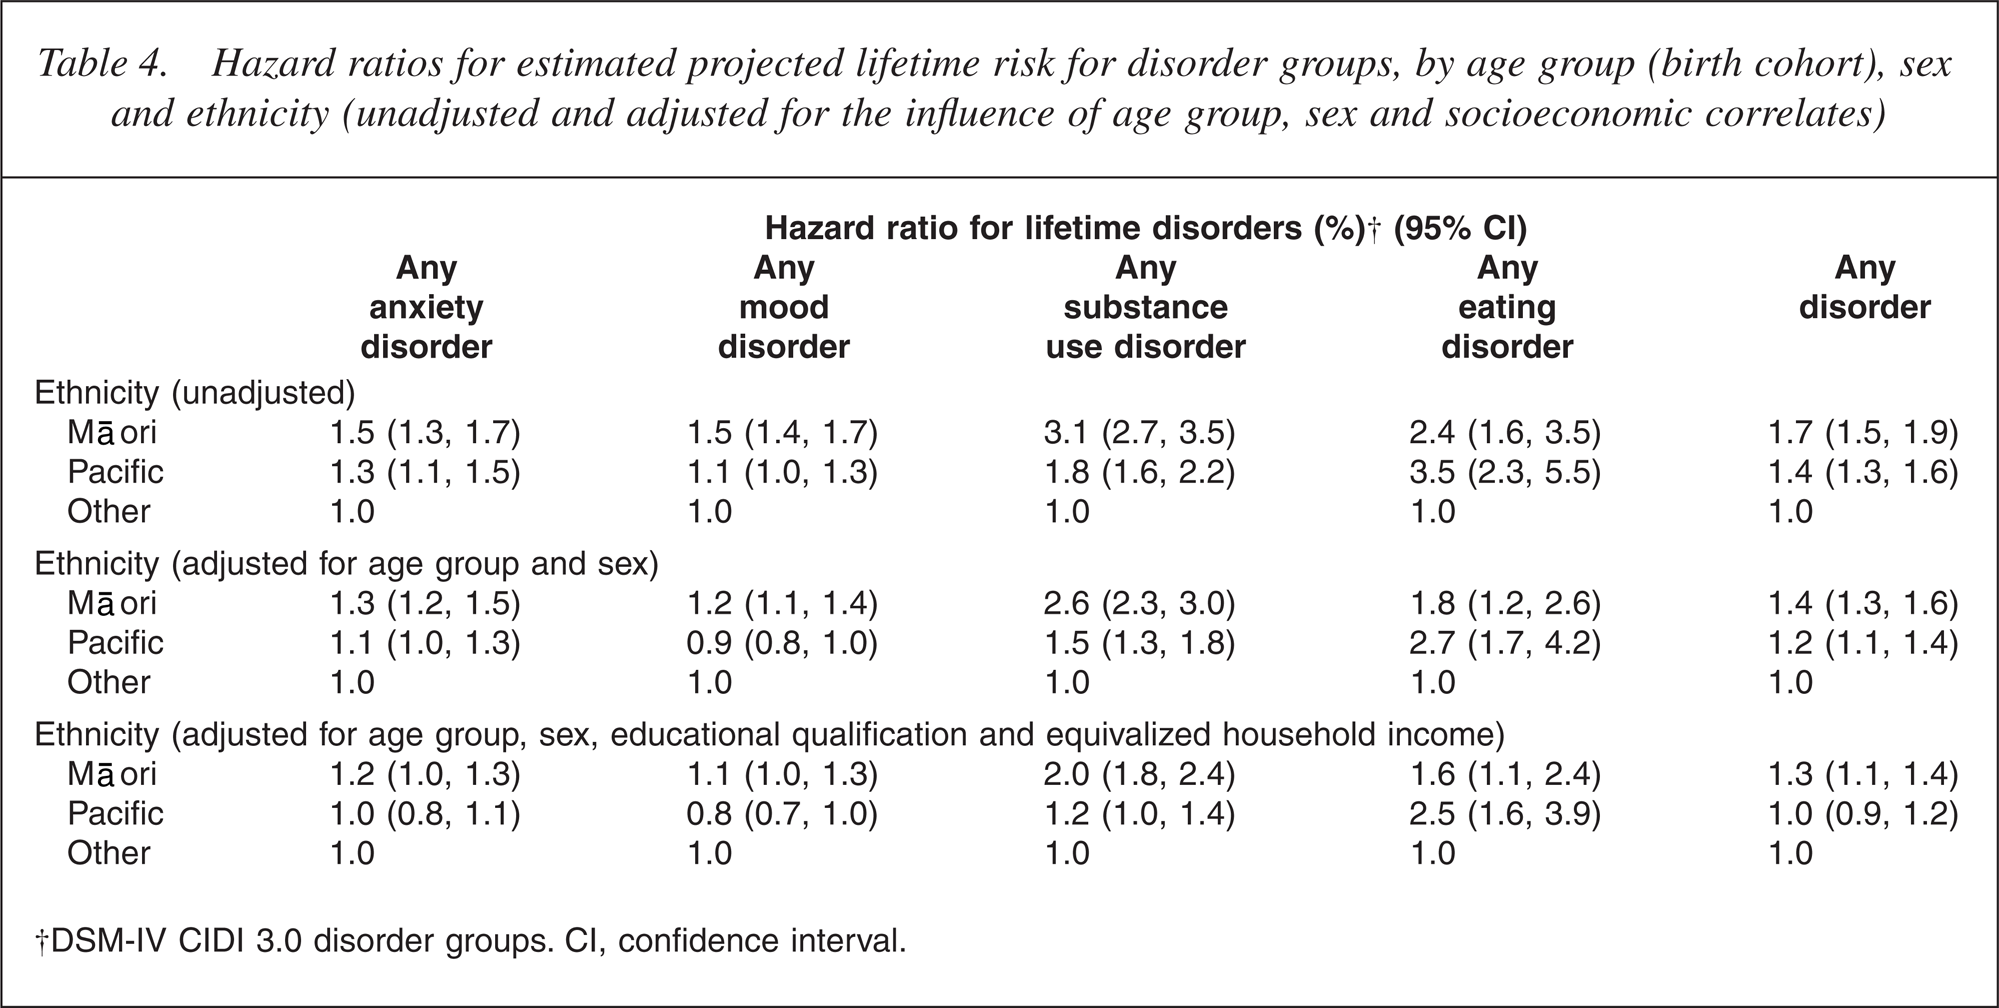
Unadjusted HRs for ethnic comparisons with the reference Other group were higher for Māori than for Pacific people for all disorder groups except the uncommon eating disorders. Adjustment reduced HRs but even after full adjustment all comparisons between Māori and Other remained significant. Nonetheless, HRs were close to 1 except for substance use disorders: anxiety, HR = 1.2 (p = 0.04); mood, HR = 1.1 (p = 0.03); substance use disorders, HR = 2.0 (p ≤ 0.0001) and eating disorders, HR = 1.6 (p = 0.01). For Pacific people, after adjustment the remaining significant or marginally significant hazard ratios were: slightly elevated substance use disorder, HR = 1.2 (p = 0.07); more markedly elevated eating disorder, HR = 2.5 (p λτ 0.0001) and reduced HR for mood disorder, HR = 0.8 (p = 0.01).
To put these HRs for ethnicity in context it is useful to compare them with those for age group (cohort) and sex in Table 3. They are much smaller than those seen for age group and generally smaller than those for sex.
Discussion
These results confirm those of other studies: mental disorders are relatively common and tend to have early onset. In the NZMHS, as in past community studies, females have higher lifetime prevalence estimates and HRs for lifetime disorder for anxiety, mood and eating disorders than males. This study is unique in that it provides prevalence rates [8, 9] and HRs for lifetime risk of disorder for Māori and Pacific people. The HRs for lifetime disorder for Māori suggest this population has an excess burden of lifetime mental disorder compared with other ethnic groups, even when adjustment is made for their different population structure and socioeconomic position.
The findings from the NZMHS may be compared with those from other surveys, which use the same interview and similar survey design. A consortium of 28 countries has undertaken national and regional mental health surveys under the auspices of the World Mental Health Survey Initiative [19]. Several nations have published results from their national surveys, including the European sites (the European Study of the Epidemiology of Mental Disorders (ESEMeD)) and the US (the National Comorbidity Survey Replication (NCS-R)). These two surveys were based on nationally representative noninstitutional samples of adults. The NCS-R and ESEMeD used the same diagnostic interview as used in the NZMHS, the CIDI 3.0 [11]. However, the surveys differed in the types of specific disorder covered, questionnaire content, and age range of participants (18 years and over in the ESEMeD and NCS-R; 16 years and over in the NZMHS).
In the ESEMeD [20–22];, 13.6% reported a lifetime history of any anxiety disorder, 14.0% reported any mood disorder, and 5.2% reported any alcohol disorder [23]. In the NCS-R [24, 25], the lifetime prevalences by groups of disorder were: anxiety disorders, 28.8%; mood disorders, 20.8%; and substance use disorders, 14.6% [7]. The New Zealand lifetime prevalences are higher than the aggregated ESEMeD lifetime prevalences but very similar to those from the NCS-R.
The estimates of lifetime risk for the New Zealand population are also similar to the estimates of projected lifetime risk obtained from the NCS-R. By disorder groups these estimates were: anxiety disorder, NCS-R 31.5% versus NZMHS 28.8%; mood disorder, NCS-R 28.0% versus NZMHS 28.4%; and substance use disorder, NCS-R 16.3% versus NZMHS 13.8%. Considerable evidence now exists that estimates of lifetime prevalence rates are biased by inaccurate recall of past episodes (‘recall bias’) [26–28];. Put simply, when asked about past episodes of illness or disorder people forget episodes or tend to bring them forward to a time closer to the interview. This recall bias, along with the ‘telescoping’ of episodes in time, results in lifetime prevalence rates being underestimated, especially for older age groups. However, it is important to emphasize that the bias results in an underestimation of lifetime rates, not an overestimation of rates, so the lifetime prevalences presented in this report are conservative estimates of the ‘true’ rates.
This study, along with other cross-sectional studies, has shown an apparent cohort effect: younger age groups have higher rates of disorder than older age groups or older age groups have lower than expected (based on projections from incidence studies) rates of disorder. It is possible that recall bias and differential mortality in the elderly account, in part, for this effect [27]. The recall bias explanation does not challenge the high rates of depressive, anxiety and substance use disorder in younger age groups, but it does call into question the observed low lifetime rates of these disorders in the elderly. The projected lifetime risk data should be interpreted with caution, because of the presence of this cohort effect. The estimate of lifetime risk is a composite estimate derived from estimates of lifetime risk for different cohorts, and assuming each cohort has an equal risk.
Despite these caveats, the NZMHS does provide previously unavailable national information about the lifetime pattern of onset of mental disorders, which will be useful in informing the development of mental health policy and service planning. It is noteworthy that the New Zealand lifetime prevalences are relatively high compared with other developed countries, although the reason for this is not apparent. However, this finding does re-emphasize the importance of mental disorders as contributors to the burden of disease in New Zealand.
Footnotes
Acknowledgements
Te Rau Hinengaro: The New Zealand Mental Health Survey (NZMHS) was funded by the Ministry of Health, Alcohol Advisory Council of New Zealand and Health Research Council of New Zealand. The survey was carried out in conjunction with the World Health Organization WMH Survey Initiative. We thank the WMH staff for assistance with instrumentation, fieldwork and data analysis. These activities were supported by the US National Institute of Mental Health (R01MH070884), the John D and Catherine T MacArthur Foundation, the Pfizer Foundation, the US Public Health Service (R13- MH066849, R01-MH069864, and R01 DA016558), the Fogarty International Center (FIRCA R01-TW006481), the Pan American Health Organization, Eli Lilly and Company, Ortho-McNeil Pharmaceutical, Inc, Glaxo- SmithKline, and Bristol-Myers Squibb. WMH publications are listed at ![]()
Other members of the NZMHS Research Team are J Baxter, TK Kingi, R Tapsell, S Foliaki, J Kokaua, D Schaaf, MH Durie, C Tukuitonga and C Gale.
We thank the Kaitiaki Group and Pacific Advisory Group for their input and support for this survey and we thank all the participants.