
Abstract
The first Global Burden of Disease study [1] demonstrated the large burden of morbidity due to neuropsychiatric conditions. However, many of these initial estimates were based on expert opinion, not on empirically derived national figures. Surveys in different countries were mostly regional, not national [2, 3]. Even when the surveys were national [4], the countries were almost all developed countries, so it was not possible to see how variable the findings were across a range of cultures and economies. Furthermore, the surveys using the Diagnostic Interview Schedule [2, 3] and the Composite International Diagnostic Interview (CIDI) [4] were designed to measure prevalence, not severity. These limitations led the World Health Organization to establish the World Mental Health (WMH) Survey Consortium. The Consortium was able to set up national surveys using a version of the CIDI that was expanded to include additional questions about impairment as a result of disorder [5]. From these data a severity classification was derived. The WMH surveys have now been completed in about 20 sites and cross-national publications have begun to appear [6, 7].
In New Zealand, there has been no previous national survey of mental disorders in the community. Two regional surveys were conducted in the 1980s: a survey of rural and urban women living in the province of Otago [8, 9] and a survey of adults aged 18–64 years living in the Christchurch urban region [10, 11]. Birth cohort studies in Dunedin (http://dunedinstudy.otago.ac.nz/) and Christchurch (http://www.chmeds.ac.nz/research/chds) have measured mental disorders, but because of the young age of these cohorts, now in their 20s and early 30s, these studies have not been able to present a comprehensive picture spanning adult age groups.
In 1997, the Australian National Mental Health Survey was carried out [12], using a version of the CIDI which focused on the past 12 months. This survey was at that time the largest such survey, the first to make DSM-IV diagnoses, and also a survey which attempted to measure disability in addition to disorder.
The New Zealand Ministry of Health decided that a national study was required in New Zealand to inform policy. A tender for a pilot study was let in 1999 and was won by the present research team which carried out consultation, a literature review and trial interviews. To meet the New Zealand need for national data, the research team joined the WMH Consortium (http://www.hcp.med.harvard.edu/wmh/), becoming one of the countries in this international survey program. This enabled access to the revised CIDI and considerable support and advice on quality control, design and analysis.
Because of concerns about mental health in Māori, and also in Pacific people, the Ministry of Health wanted estimates for these ethnic groups as well as national estimates. Māori are the indigenous people of New Zealand. Within New Zealand, the term ‘Pacific’ is used to refer to people whose ethnicity is that of the indigenous inhabitants of Pacific Islands such as Samoa, Tonga, the Cook Islands and Fiji. The objectives for the New Zealand survey as specified by the Ministry of Health were, for the total New Zealand, Māori and Pacific populations living in New Zealand, to:
describe the 1 month, 12 month and lifetime prevalence rates of major mental disorders among people aged 16 years and over living in private dwellings, by sociodemographic variables; describe patterns of and barriers to health service use for people with mental disorders; describe the level of disability associated with mental disorder; provide baseline data and calibrate brief instruments measuring mental disorders and psychological distress to inform the use of these instruments in future national health surveys.
All of these objectives were met within Te Rau Hinengaro (‘the many minds’): The New Zealand Mental Health Survey. This summary paper reports the methods of the survey, period prevalences for disorder groups, the distribution of severity in the past 12 months, and sociodemographic correlates of any 12 month disorder, serious disorder and any mental health visit to the healthcare sector.
Method
This survey was approved by all 14 regional health ethics committees with the Auckland Y committee serving as the lead committee.
Written informed consent was obtained from all participants before the interview began. More detail is available in the methods chapter in the report to the Ministry of Health from this study [13].
Consultation and involvement
Before the survey was carried out, meetings were held with the Ministry of Health and hui and fono (meetings) with Māori and Pacific people from the mental health sector and academia. The research team included a Māori team led by Professor Mason Durie and a Pacific team led by Colin Tukuitonga. A kaitiaki (guardianship) group from the Māori community has supported the research team and overseen Māori cultural aspects of the study. A Pacific advisory group has carried out a similar role for the Pacific communities.
A consumer perspective was provided during the study and as the main results were compiled.
Sample
The target population was people aged 16 years and over living in private dwellings in New Zealand. Participants were selected through a multistage area probability sample of the population living in permanent private dwellings in the North Island, the South Island and Waiheke Island. This region includes 99.99% of the New Zealand population. Small area data collected by Statistics New Zealand from the 2001 Census of Population and Dwellings were used to select the sample. These small areas are called meshblocks and consist of around 40–70 dwellings.
The survey was required to produce at least 12 000 interviews with 2500 people of Māori ethnicity and 2500 people of Pacific ethnicity. This required doubling the number of Māori and quadrupling the number of Pacific people relative to the numbers expected from their proportions in the population. To achieve this oversampling, targeting and screening were used. Pacific people were targeted by having a High Pacific Stratum consisting of meshblocks with 55% or more Pacific people at the 2001 census; these meshblocks were selected with much higher probability than meshblocks in the General Stratum. In the General Stratum, there were three subsamples: within each meshblock, there were 11 households in the main sample for which everyone was eligible, 16 households where only Māori and Pacific people were eligible, and about 30 households where only Pacific people were eligible. The High Pacific Stratum and the three subsamples within the General Stratum made up the four design cells of the survey.
Within strata, meshblocks were listed within District Health Boards and then systematically selected throughout New Zealand with probability proportional to size. Therefore, there was implicit stratification by District Health Board. The meshblocks were the primary sampling units, so there was no clustering above this level. Households were systematically selected within meshblocks. One person was selected from each dwelling using a Kish grid modified for up to eight eligible people [14].
Fieldwork, quality control and editing
The fieldwork was carried out between October 2003 and December 2004 by the National Research Bureau (NRB), a company specializing in face-to-face interviews. The interview training course material was provided by the staff of the Institute of Social Research, University of Michigan. These staff had provided training for all other sites involved in the WMH Survey Initiative. Additional material relating to cultural empathy and safety was developed in New Zealand.
Interviewers were paid by hour and by kilometre travelled rather than by interview to minimize incentives to recruit only easy-to-reach participants. A supervisor checked with participants for 10% of interviews to ensure they had occurred.
The Blaise software (http://blaise.sourceforge.net/) used for the interview had many internal checks for inconsistency and wild codes. In addition, NRB developed additional checks. After the first round of cleaning by NRB, data were sent to the WMH Surveys Data Coordinating Center at Harvard University to be run through cleaning programs until WMH requirements were met. Occasionally, these cleaning checks required re-contacting participants.
Little item non-response occurred. No data were missing for age, sex or ethnicity. Household income was missing for 13.0%: 11.2% reported they did not know it and 1.8% refused to answer. These missing values were imputed by multiple regression with weights using age, sex, education, marital status, employment status, current or last job held, time since last employed, the number in the household, and the New Zealand Index of Deprivation 2001 [15, 16].
Interview
The interview used was based on version 15 of the WMH Survey Initiative version of the WHO CIDI (referred to as the WMH-CIDI) [5] (http://www.hcp.med.harvard.edu/wmhcidi/). Version 20 is now known as the CIDI 3.0.
In New Zealand, participants were not remunerated. To reduce response burden and to try to ensure a reasonable response rate, the interview length was cut by deleting childhood disorders and several other disorders that were not part of the core set of disorders. The remaining sections are shown in Fig. 1 along with two additional sections for Māori. The demographic section was modified to include standard New Zealand census questions. In the drug section, if participants who had used marijuana and other drugs reported a symptom, then they were asked if that symptom occurred with marijuana.
New Zealand interview: long-form and shortform logic and sections. †(@) everyone got it; ($) screened in. †Long-form subsample: participants who had ever met certain criteria for depression, mania or the anxiety disorders in the first part of the interview, or who had ever had a suicide plan or suicide attempt, or who had ever been hospitalized for psychiatric problems all went on to the long-form sections. Others were randomly selected in with the probability of selection increasing with the number of eligibles in the household. There were two sets of selection probabilities: participants with some evidence of psychiatric problems had selection rates of 27–100%, whereas those with no evidence had selection rates of 9–45%. ‡ All entered section: 50% did Composite International Diagnostic Interview 3.0 consumption questions and 50% did the Alcohol Use Disorders Identification Test. Screened into symptom questions. §Plus Māori health services. ¶World Mental Health Survey Initiative version of the World Health Organization Disability Assessment Scale (WHO-DAS). ††Kessler 10-item scale (K-10): 50% did K-10 for the worst month in the past 12 months and 50% did K-10 for the past month.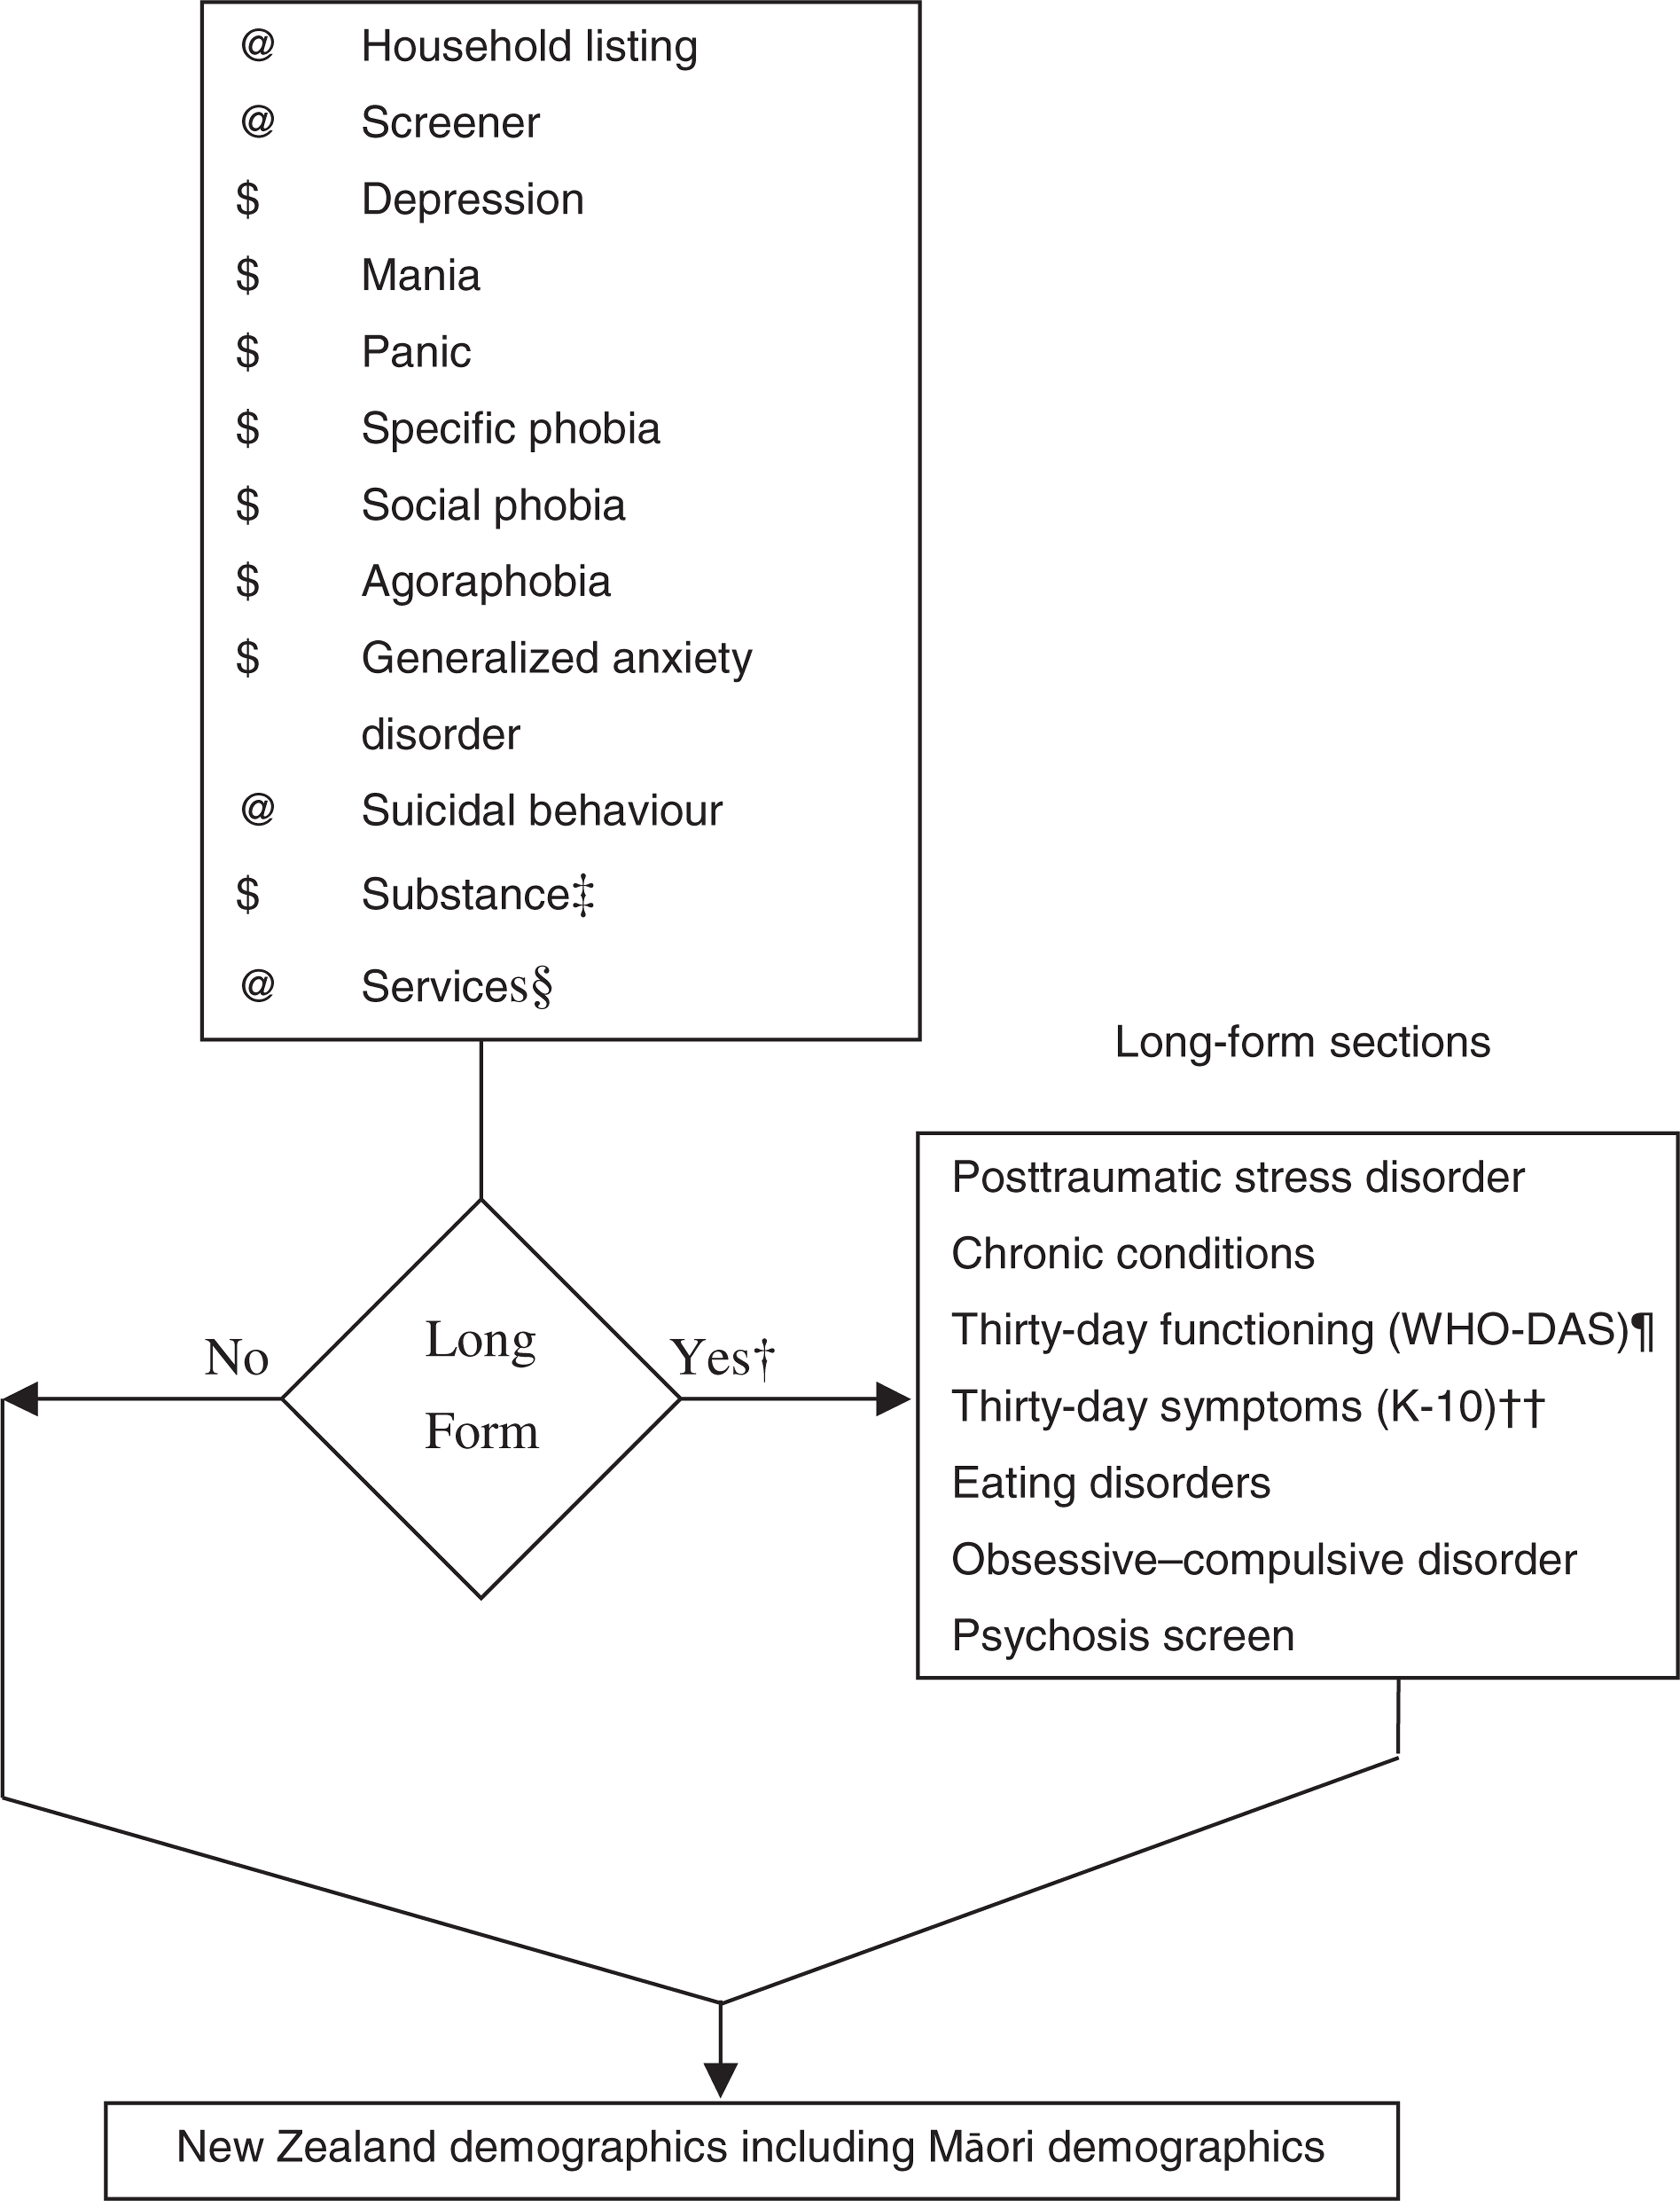
Figure 1 also shows the pathway through the interview and the sections available to the whole sample and those given only in the longform subsample. Long and short forms were used to reduce the average respondent burden.
The interview was available only in English although some interviewers were able to assist in other languages. It was administered by interviewers from a laptop, as a Computer Assisted Personal Interview, using Blaise software that controlled all skip logic.
Diagnoses
Although ICD-10 [17] and DSM-IV [18] diagnoses can be made from the interview, only DSM-IV diagnoses are reported here, using hierarchy rules. The only exception is that substance abuse is reported without hierarchy to show the prevalence of such behaviour, regardless of whether substance dependence was present. Nonetheless, for disorder counts, abuse plus dependence counted as only one disorder for alcohol and for drugs. Participants without any symptom ever of substance abuse (alcohol or drugs) skipped the associated dependence section, so dependence is really dependence with abuse at some time.
Organic exclusions were applied after a psychiatrist coded text responses.
The WMH algorithms current in January 2006 were used to produce diagnoses. A minor modification was required for agoraphobia because separation anxiety was not assessed. The marijuana algorithms were written in New Zealand using the WMH drug abuse algorithms as a model.
The psychosis section was just a screening section, not a diagnostic section, so results are not reported here.
The diagnoses covered were:
Anxiety disorders: panic disorder, agoraphobia without panic, specific phobia, social phobia, generalized anxiety disorder, posttraumatic stress disorder and obsessive–compulsive disorder
Mood disorders: major depressive disorder, dysthymia and bipolar disorder (I, II and any with mania or hypomania)
Substance disorders: alcohol abuse, alcohol dependence, drug abuse, drug dependence and, within drug disorders, marijuana abuse and marijuana dependence
Eating disorders: anorexia and bulimia
Severity
Severity for a case in the past 12 months was based on all disorders for which symptoms or episodes were experienced in that period, given that criteria had been met for lifetime disorder. Definitions used in New Zealand were those developed for the first WMH cross-national paper [7] except for substance dependence for which the more stringent National Comorbidity Survey Replication (NCS-R) [19] definition was used. The NCS-R definition required substantial impairment in the past 12 months, not just physiological symptoms ever. In New Zealand, this modification reduced the proportion whose substance dependence was classified as serious from 90.4% to 25.7%, leaving the remainder with dependence classified as moderate. Participants were classified with serious disorder if any one of the following occurred in the past 12 months: an episode of bipolar I disorder, substance dependence with serious role impairment (two effects experienced ‘a lot’), a suicide attempt and any WMH-CIDI/DSM-IV disorder, at least two areas of severe role impairment because of a mental disorder in the Sheehan Disability Scale domains [20, 21], or overall functional impairment at a level found in the NCS-R to be consistent with a Global Assessment of Functioning [22] score of 50 or less in conjunction with a WMHCIDI/ DSM-IV disorder. Participants with disorder who were not classified as serious were classified as moderate if interference was reported as at least moderate in any Sheehan Disability Scale domain or if they had substance dependence without substantial impairment. All other participants with disorder were classified as mild. This classification is inevitably somewhat arbitrary, but some such classification is required to investigate the relationship between severity and other outcomes such as disability and treatment contact.
Days out of role
For each disorder, other than alcohol and drug disorders, individuals with disorder were asked how many days out of 365 in the past 12 months they were totally unable to carry out their normal daily activities because of that disorder. A conservative overall estimate for individuals with more than one disorder was obtained by using the highest number of days out of role reported for any single disorder.
Mental health visits
A mental health visit was defined as a visit to a professional ‘for help with problems about emotions, nerves, mental health or use of alcohol or drugs’. It was a visit for a mental health problem, not just a visit to a mental health professional. Mental health visits within the past 12 months were asked about within each disorder section and in the services section of the interview. The list of professionals provided to participants included mental health professionals (e.g. psychiatrist, psychologist, other mental health worker), general medical professionals (e.g. general practitioner, other doctor, general nurse, physiotherapist), religious counsellors (e.g. minister, tohunga) and traditional and alternative healers (e.g. herbalist, homeopath). Here mental health visits are reported only for the health-care sector (mental health specialty or general medical). Oakley Browne et al. provide a breakdown across all sectors [23].
Sociodemographic correlates
Sociodemographic correlates include age at interview, sex, prioritized ethnicity, educational qualifications and equivalized household income. Multiple ethnicity was permitted. The standard New Zealand prioritization rule is to classify anyone who self-identifies as Māori (either solely or in addition to other ethnicities) as Māori, and anyone who self-identifies as any Pacific ethnic group, but not Māori, as Pacific. Educational qualifications were assessed using 2001 census questions about school and post-school qualifications. A modification of the revised Jensen equivalence scale for household income [24] was used to take account of the number of adults and the number of children in the household. In this survey, the age of individual children was not known, just the number aged under 16 years, so an average age of 8 years was assumed.
Response rate
The unweighted response rate was calculated from four aggregated categories: eligibles interviewed (complete interviews), eligibles not interviewed, non-eligibles and those of unknown eligibility. The proportion of those of unknown eligibility who were eligible was estimated separately for the four design cells of the survey: the High Pacific Stratum and within the General Stratum, the main sample, the Māori and Pacific sample and the Pacific-only sample. This was done because the proportion eligible differed markedly, from 98.7% for the main sample to 2.7% for the Pacific-only sample.
Weights
Weights for each participant in the whole sample were created in four stages: (i) the probability of selection of a participant, taking account of the probability of selection of a meshblock within a stratum, the selection of a dwelling within a meshblock and the selection of one person per dwelling, including minor trimming of extremely high weights arising from very small meshblocks; (ii) adjustment for oversampling of Māori and Pacific through screening [25]; (iii) adjustment for non-response; and (iv) post-stratification. Non-response was modelled separately within each of the four design cells of the survey using meshblock data from the 2001 census. Post-stratification was to the 2001 census using age, sex and ethnicity jointly.
For the long-form subsample, two additional stages were weighting by the inverse of the probability of selection into the long form and a second post-stratification.
Analyses
Because of the unequal weights and the complex sample design, data were analysed in SUDAAN 9.0.1 with two strata (High Pacific and General) and census meshblocks as the primary sampling units. There were 150 meshblocks in the High Pacific Stratum and 1170 in the General Stratum. Taylor Series Linearization was used for variance estimation.
Simple prevalences show the burden of disorder for each group. Logistic regression models were used to investigate whether differences between groups remained when other correlates were included. Predictive margins [26], also called adjusted percents [27], are used to present results from models. These show the percent with an outcome which would be seen if each group had the same distribution of covariates.
For prevalences with less than 30 events in the numerator, confidence intervals were calculated according to a method by Korn and Graubard [26, 28].
Results
Response rate and demographic distributions
The overall response rate was 73.3% and the overall average interview time was 73 minutes: 46 minutes for the short form of the interview and 92 minutes for the long form.
Table 1 shows the sex, age and ethnicity of the whole sample and the long-form subsample, unweighted and weighted. The sample size was 12 992 with 2595 reporting Māori ethnicity and 2374 reporting Pacific ethnicity. The 138 who reported both Māori and Pacific ethnicity were, under prioritization rules, counted as Māori. As a result of oversampling, Māori were 20.0% of the sample and Pacific people were 17.2%; but after weighting, they were 11.2% and 4.5%, as in the population aged 16 years and over in the 2001 census. Because of weighting, estimates for the New Zealand population are not biased by oversampling. However, the precision of estimates for Māori and Pacific people is improved by their larger sample sizes.
Sex, age and ethnicity in Te Rau Hinengaro: The New Zealand Mental Health Survey
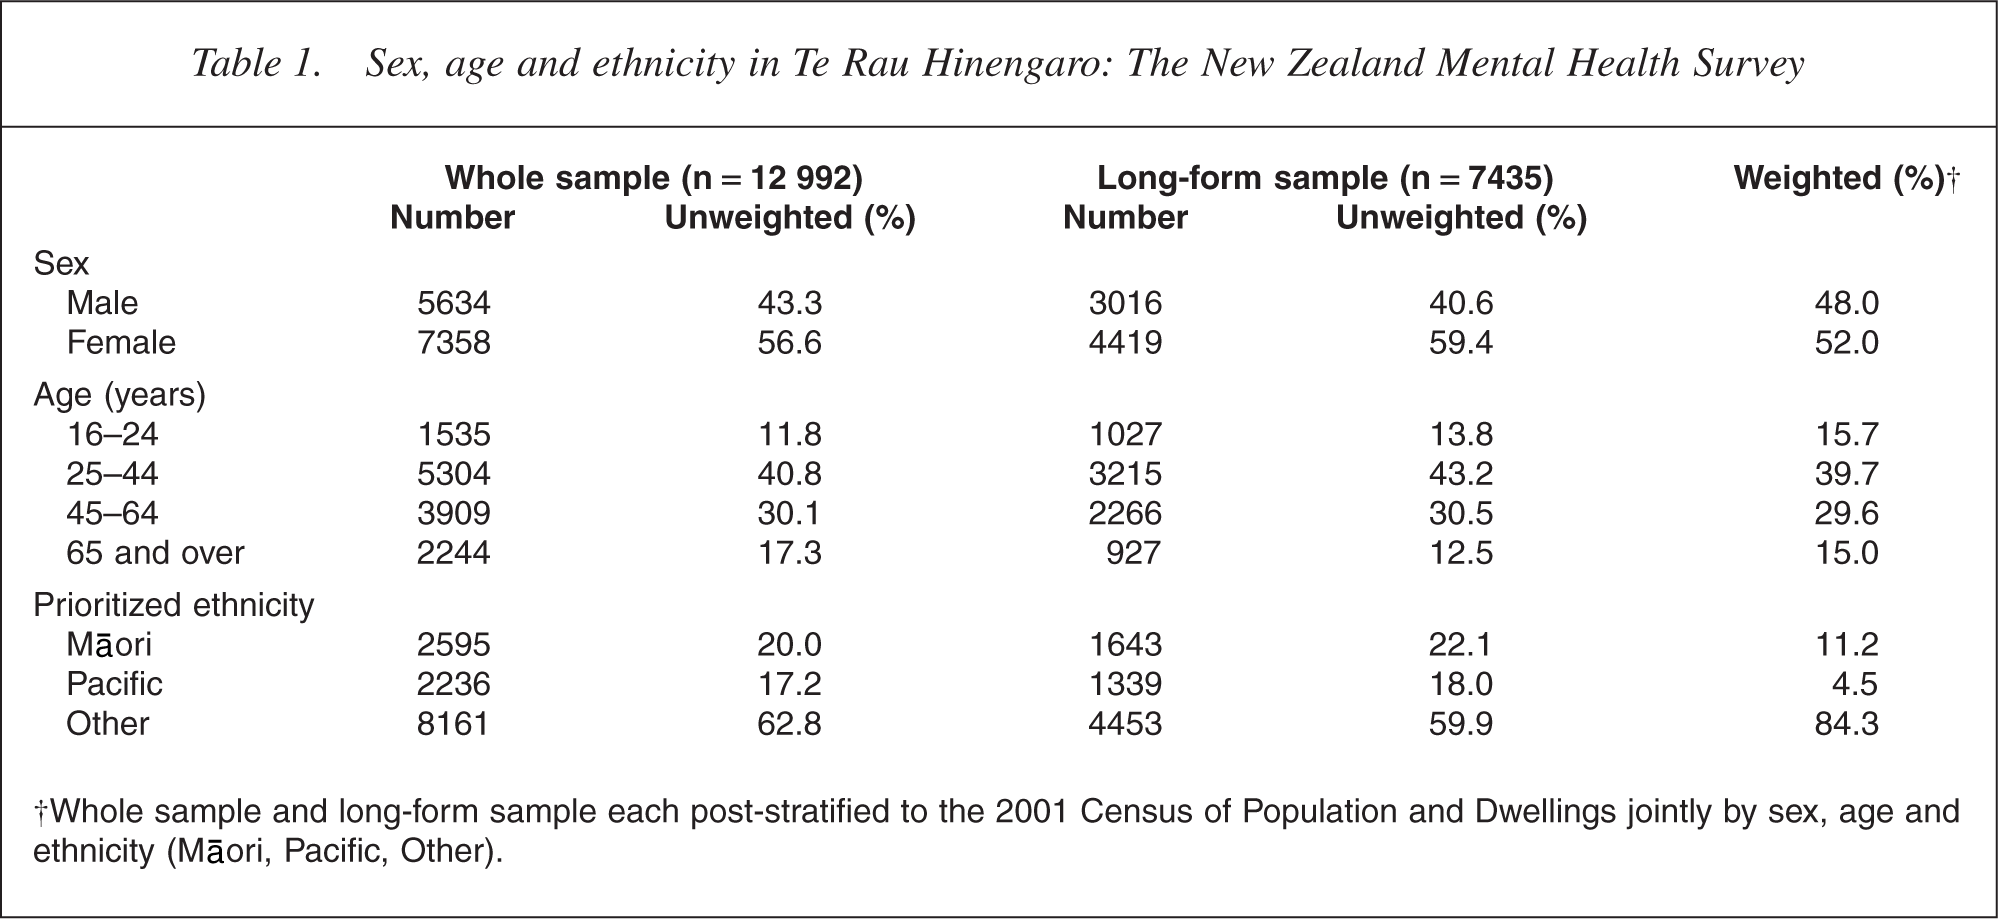
†Whole sample and long-form sample each post-stratified to the 2001 Census of Population and Dwellings jointly by sex, age and ethnicity (Māori, Pacific, Other).
The period prevalences in Table 2 are based on ever meeting criteria for disorder (lifetime prevalence) and having symptoms or an episode within the relevant period. The number of disorders is a count of individual disorders, not disorder groups. Table 2 shows how common it is for New Zealanders to experience mental disorder: 39.5% reported sufficient symptoms to meet criteria for at least one disorder at some time in their lives before interview. It is likely that some episodes, particularly those that were mild or occurred a long time ago, may have been completely or partially forgotten, as Wells and Horwood [29] and Andrews et al. [30] have shown for depression. Therefore, the lifetime prevalences in Table 2 will, to some extent, be underestimated. This may also have affected other prevalences; participants who had previously met criteria, but who were not diagnosed because they had failed to recall enough symptoms, would not have been counted for other period prevalences even though they reported some symptoms.
Lifetime, 12 month and 1 month prevalences of mental disorders†
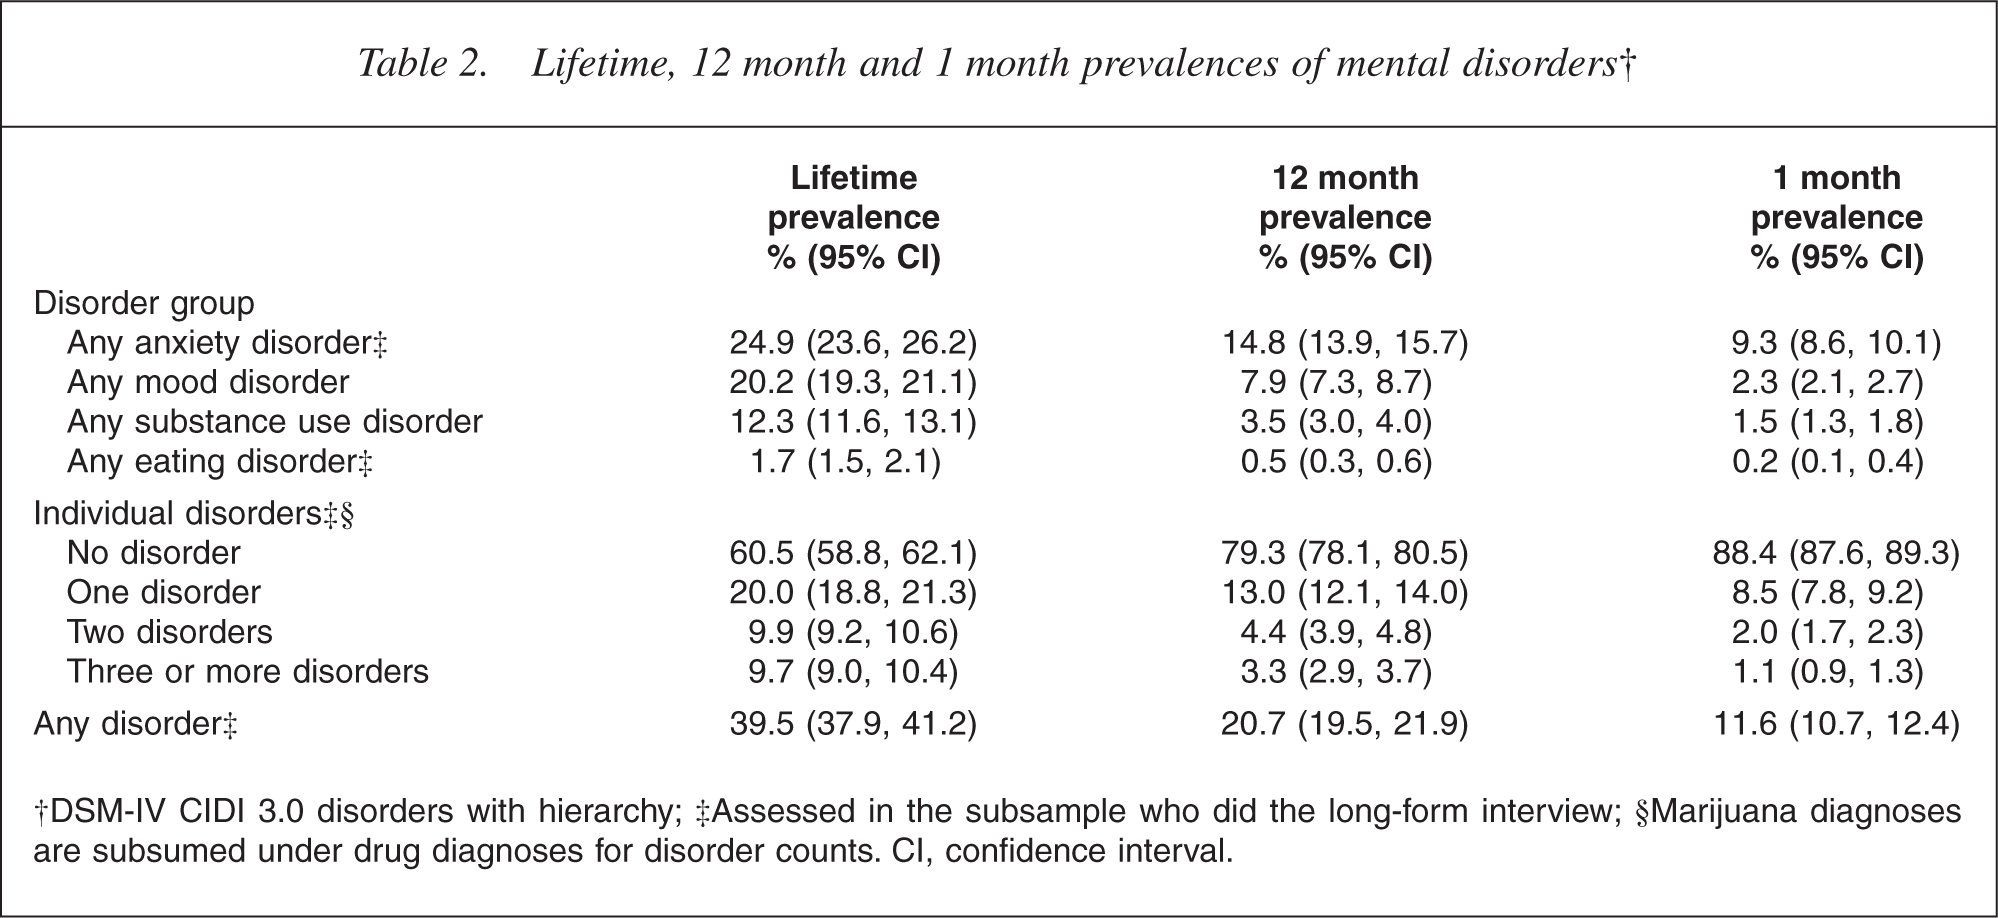
†DSM-IV CIDI 3.0 disorders with hierarchy; ‡Assessed in the subsample who did the long-form interview; §Marijuana diagnoses are subsumed under drug diagnoses for disorder counts. CI, confidence interval.
The 12 month prevalence of any disorder was 20.7%, which implies that about half of those who had ever experienced disorder no longer had disorder in the past 12 months. Sometimes the ratio of 12 month to lifetime prevalence is called the non-recovery rate [10]. By this measure, anxiety disorders, with a non-recovery rate of 59.4%, are seen to be more persistent than mood or substance disorders (39.1% and 28.5%).
Overall, the 1 month prevalence of any disorder was 11.6%. Comparison of 1 month and 12 month prevalences shows the highest ratio for anxiety disorders, which again implies greater chronicity for these disorders than for mood disorders, which are mostly episodic, or for substance disorders. The 1 month prevalence is the closest estimate of point prevalence, although it must be remembered that participants can delay interviews and may do so until they feel better. In addition, refusal rates may be higher in those with current disorder.
Comorbidity was also common. Of those who had ever experienced disorder, 49.4% had met criteria for more than one disorder at some time before interview. Even in the past 12 months, 37.1% of those with disorder had more than one disorder. Scott et al. report more extensively on comorbidity between mental disorders [31].
Severity, days out of role and mental health visits in the past 12 months
Table 3 shows, for the past 12 months, the prevalence of each level of severity, aggregated across all disorders, the mean days out of role because of disorder and the percentage with a mental health visit in the health-care sector.
Severity, days out of role and percentage with a mental health visit in the past 12 months†
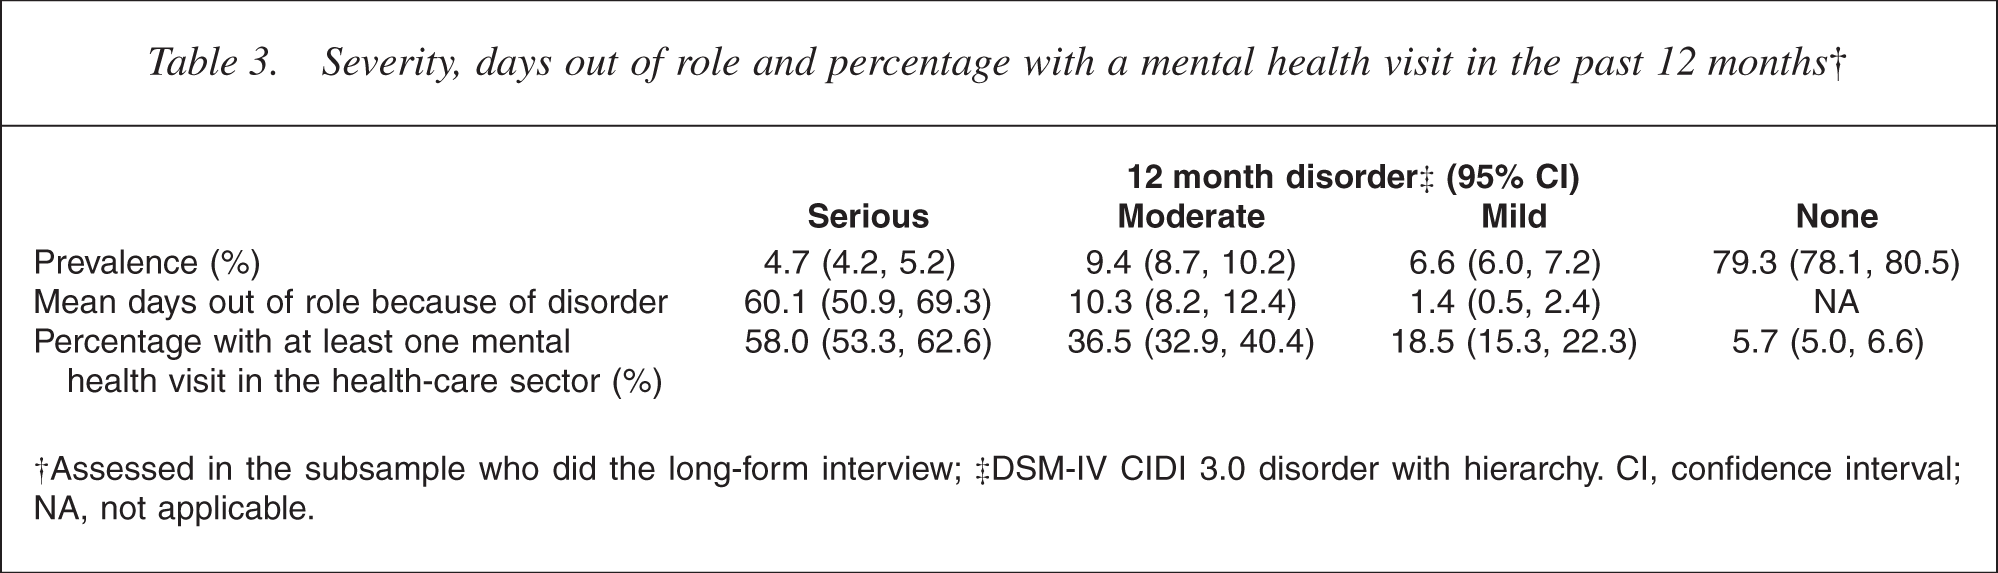
†Assessed in the subsample who did the long-form interview; ‡DSM-IV CIDI 3.0 disorder with hierarchy. CI, confidence interval; NA, not applicable.
Of those with disorder in the past 12 months, 22.7% were classified as serious, 45.6% as moderate and 31.7% as mild. Therefore, the prevalences of serious, moderate and mild disorder were 4.7%, 9.4% and 6.6%, respectively. As expected, severity was strongly related to days out of role. Those with serious disorder on average reported nearly 2 months completely out of role in the past 12 months (60.1 days), whereas those with mild disorder were seldom totally unable to carry out their normal activities (1.4 days).
Overall, 37.5% of those with disorder in the past 12 months made a mental health visit to the health-care sector. This percentage varied appropriately with severity from 58.0% for those classified as serious, to 36.5% for those classified as moderate, 18.5% for those classified as mild, and 5.7% for those without disorder in the past 12 months. Nonetheless, 42.0% of those with serious disorder did not make any mental health visits to the health sector.
While only a small proportion of those without disorder made mental health visits to the health sector (5.7%), because 79.3% of the population were without diagnosed disorder, they constituted 38.2% of those reaching this sector for help with mental health problems.
Correlates of disorder, severity and treatment visits in the past 12 months
To allocate resources in relation to need, it is necessary to know which groups within New Zealand experience higher or lower rates of disorder and which groups are reaching treatment, taking account of disorder severity. Table 4 reports 12 month prevalence, the prevalence of serious disorder and the percentage with a mental health visit in the health-care sector after adjustment for severity, for five correlates considered separately.
Sociodemographic correlates and 12 month prevalence of any disorder, severity and mental health visits
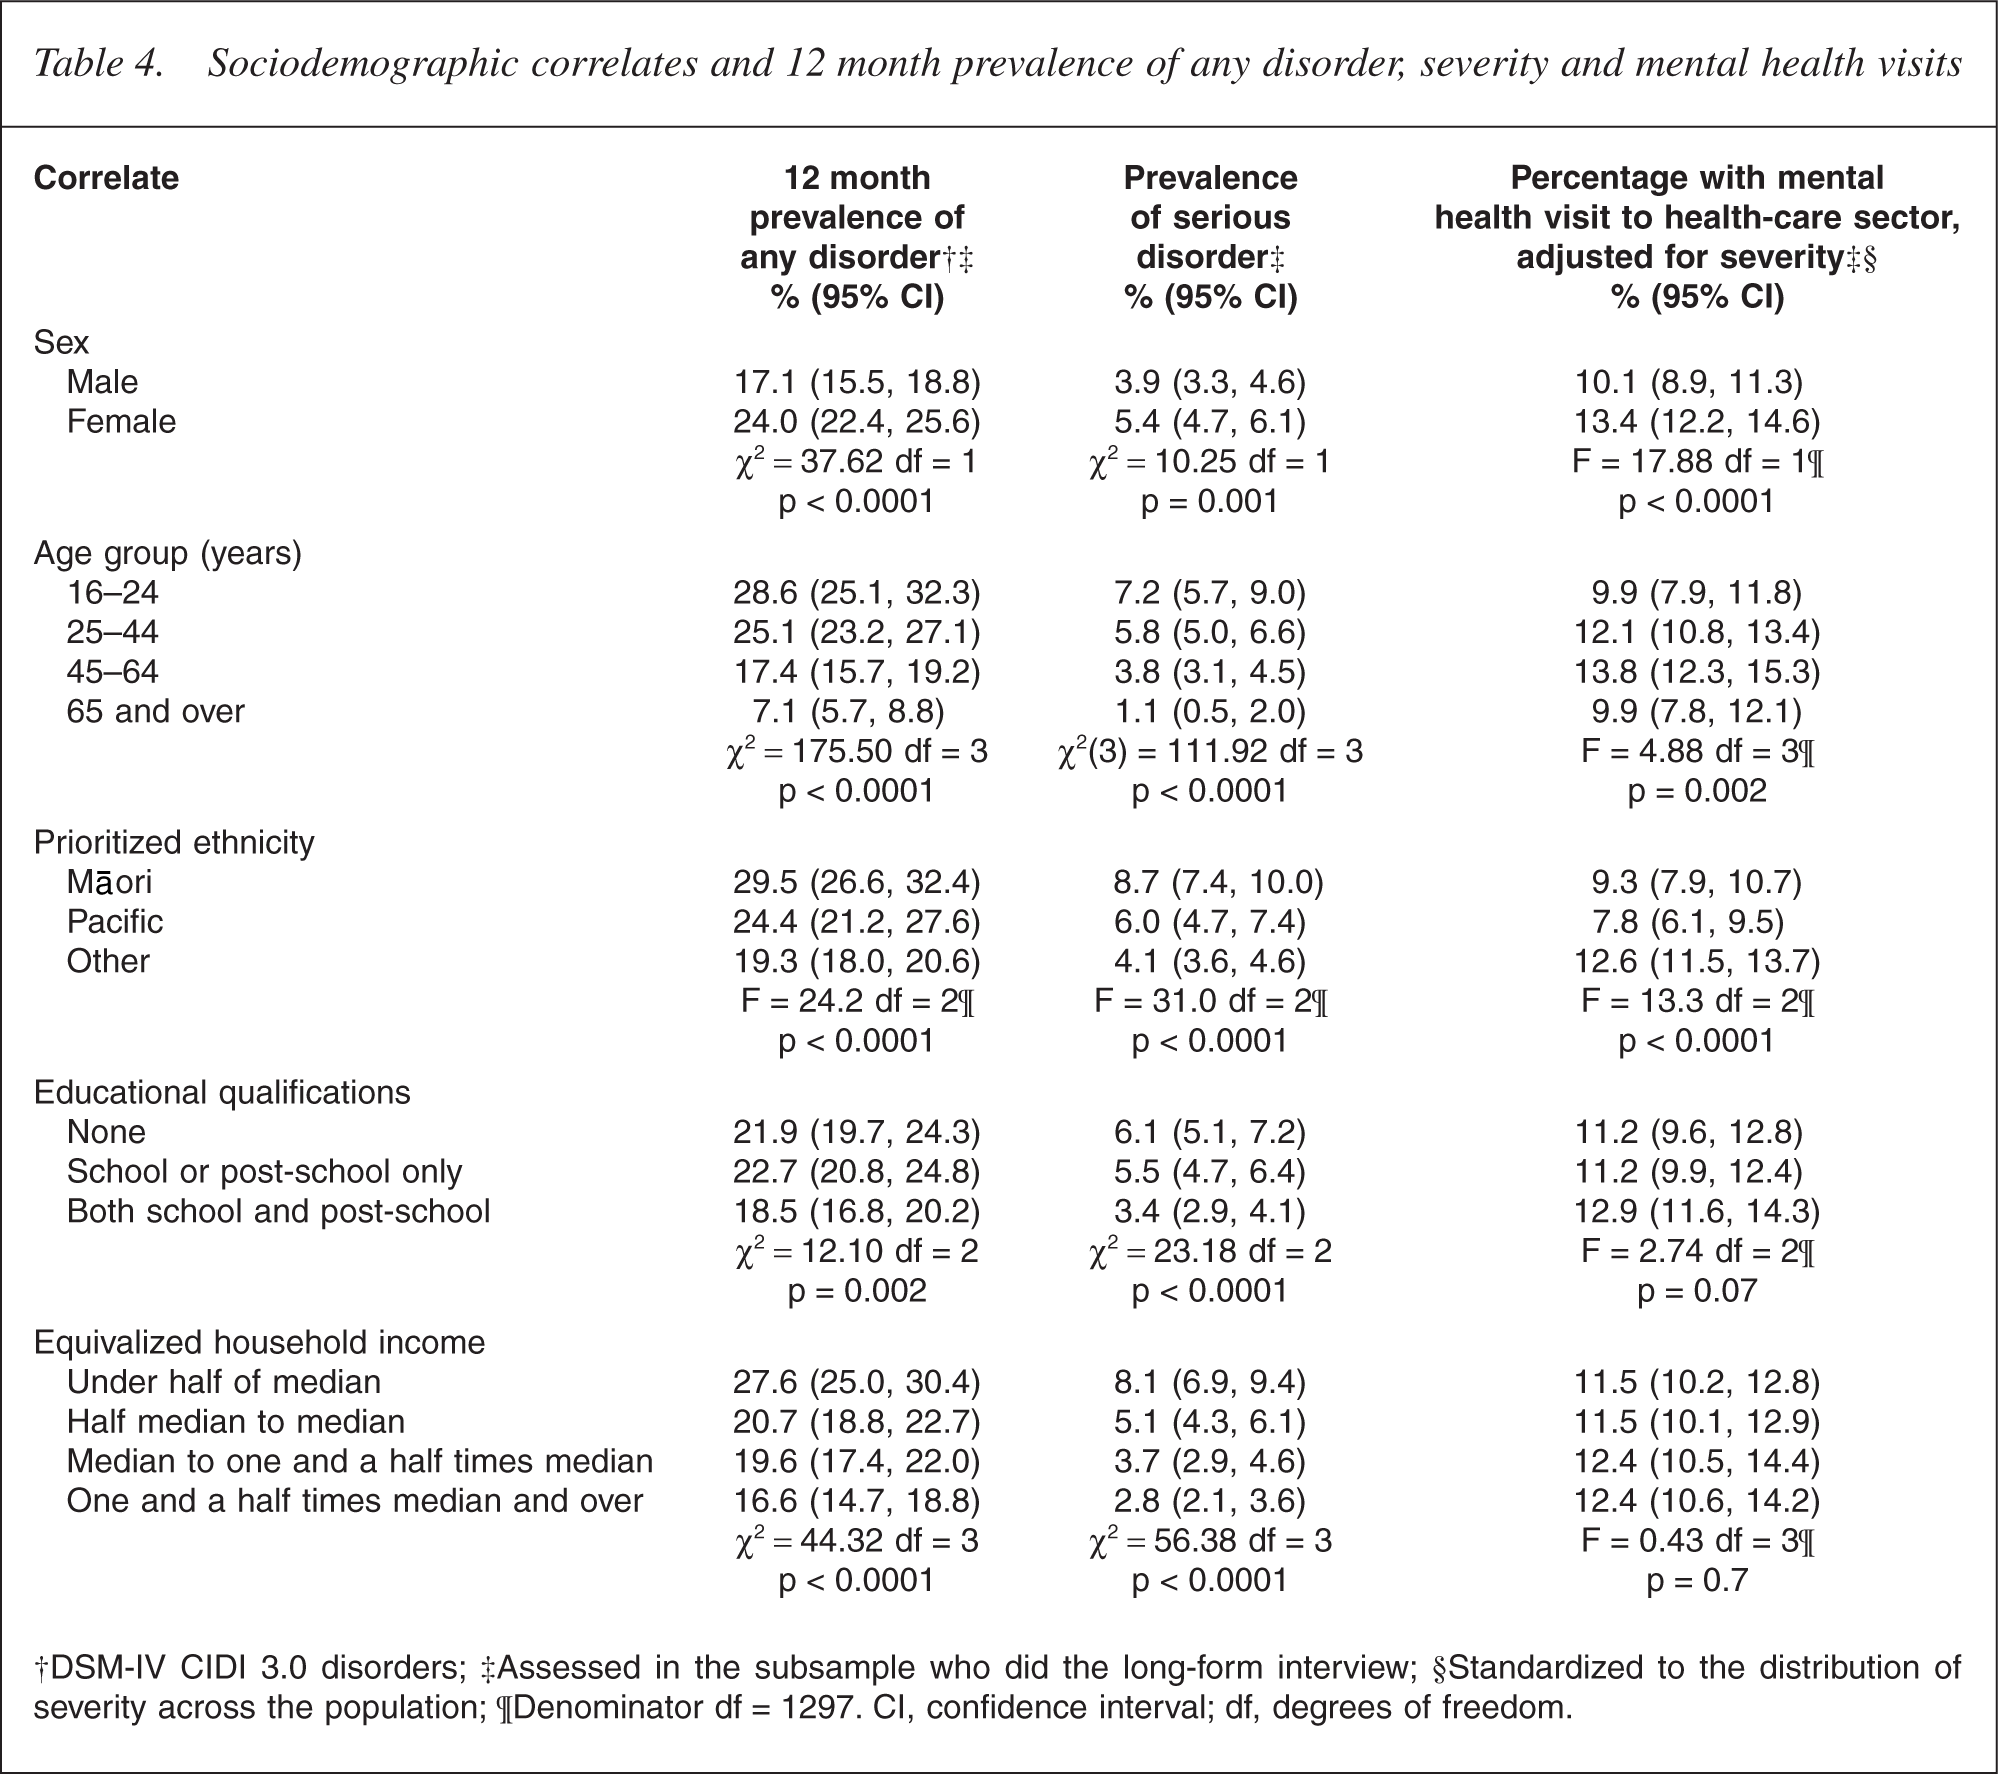
†DSM-IV CIDI 3.0 disorders; ‡Assessed in the subsample who did the long-form interview; §Standardized to the distribution of severity across the population; ¶Denominator df = 1297. CI, confidence interval; df, degrees of freedom.
Prevalence of any disorder and serious disorder
Sex, age, educational qualifications, equivalized household income and ethnicity were all significantly associated with 12 month disorder (p ≤ 0.002) and serious disorder (p ≤ 0.001). Females were more likely than males to experience any 12 month disorder (24.0% vs 17.1%), and had a higher prevalence of serious disorder (5.4% vs 3.9%), but this was not consistent across disorder groups. Females had higher prevalences of anxiety and mood disorders but a lower prevalence of substance use disorder [32]. There was a clear gradient for age from the group aged 16–24 years who had the highest prevalences of any disorder and serious disorder down to the oldest age group (aged 65 years and over) who had the lowest prevalences. People with the highest level of educational qualification had slightly lower prevalences of disorder. Twelve-month disorder and serious disorder were more common in lower-income groups. Prevalences were highest for Māori, intermediate for Pacific people and lowest for Others (i.e. non-Māori, non- Pacific people).
Joint models with all five correlates showed patterns for sex, age and income similar to those shown for each correlate individually. For educational qualifications, a steady though small gradient was shown across the three levels in joint models (p ≤ 0.01). Ethnic differences were much reduced. Although Māori prevalences were still signifi- cantly higher than those of Others, Pacific people had prevalences nonsignificantly lower than those of Others. For any disorder, the adjusted prevalences were 23.9% (Māori), 19.2% (Pacific) and 20.3% (Others). For serious disorder, the adjusted prevalences were 6.1%, 4.1% and 4.5% [33].
Mental health visits in the health-care sector
The percentage with a mental health visit in the health-care sector in the past 12 months is reported for the whole population in Table 4, adjusted for severity across the full range of serious, moderate, mild and no disorder. Adjustment is used to ensure that comparisons are made across comparable levels of need. The advantage of including the whole population is that it includes those apparently without disorder who reported a mental health visit (Table 3). However, because 79.3% did not have disorder, and just 5.7% of these contacted treatment, only small differences in the percentage of making a mental health visit can be seen for sociodemographic correlates across the whole population.
Nonetheless, the pattern seen after adjustment for severity is often different from that for prevalence. The youngest and oldest age groups were equally likely to make a mental health visit, in contrast to the large differences in prevalences for these two age groups, whereas the group aged 45–64 years had the highest percentage of making a mental health visit (p = 0.002 overall). Those with the highest level of educational qualifications were only slightly and non-significantly more likely to make a mental health visit (p = 0.07 overall). Similarly, those with more income were not significantly more likely to make a mental health visit (p = 0.7). Both these trends disappeared in a joint model (p = 0.4 for education and p = 0.9 for income). Māori and Pacific people were less likely than Others to make a mental health visit to the health-care sector and adjustment for the other sociodemographic correlates did not remove these differences [33].
Discussion
Mental disorder is common in New Zealand with 39.5% of the population having experienced disorder at some time and 20.7% in the past 12 months, with 4.7% classified as serious, 9.4% as moderate and 6.5% as mild.
The most comparable results come from the first crossnational comparison paper from the WMH Survey Initiative [7], which reported 12 month prevalence and severity of mental disorders in the first 15 surveys. There were very marked differences in prevalence across countries, differences in the distribution of severity and very marked differences in the percentage treated. Nonetheless, in all countries surveyed, as in New Zealand, more severe disorder was more likely to be treated.
However, even with these surveys that used the CIDI 3.0, it is difficult to compare the prevalence of any disorder and the distribution of severity across countries, because not all disorders were assessed in every country. Disorder-specific prevalences are more comparable than the prevalence of any disorder [32]. Nonetheless, New Zealand appears to be a high-prevalence country, even among developed countries. Only the US had a higher prevalence of any disorder (26.3%; 24.6, 27.9) with prevalences of serious, moderate and mild disorder of 7.7%, 9.4% and 9.2%, respectively. Columbia, Lebanon and Japan, like New Zealand, had a higher prevalence of moderate disorder than mild disorder, with serious disorder the least common. In contrast, the surveys in Europe reported high proportions of mild cases. This may be accounted for by programming problems in these surveys, the first to be carried out; they were not able to produce diagnoses of bipolar disorder or drug disorder.
The New Zealand results are broadly similar to those for other developed countries for the percentage of those with serious disorder making a mental health visit (49.7% to 64.5%, New Zealand 58.0%) and for the percentage of those with no disorder making a mental health visit (2.4% to 8.1%, New Zealand 5.7%). People with serious disorder often do not make treatment contact, whereas many apparently without disorder do so. Some of these may have been subthreshold, had residual symptoms or were symptom-free while on prophylactic treatment such as a mood stabilizer for bipolar disorder or antidepressants for recurrent depression. A few may have experienced serious but uncommon disorders such as psychosis.
Comparison with results from the Australian National Mental Health Survey [12] is affected by the different versions of the CIDI used. In Australia, version 2.1 was used, in which only the past 12 months was asked about and full criteria had to be met within that period. In contrast, in other CIDI versions, participants are asked ‘have you ever’ questions followed by questions about onset and recency. Full criteria are not necessarily met within any particular period. Not surprisingly, the estimated prevalence of any DSM-IV disorder in the past 12 months was lower in Australia than in New Zealand (15.5% vs 20.7%), over a fairly comparable range of disorders, except that specific phobia was not assessed in Australia. A comparison across individual disorders is given by Wells et al. [32].
The correlates of disorder in New Zealand are those commonly reported in the literature [34]. Younger people and those with more disadvantages are more likely to experience disorder. However, the pattern for service use is quite different from that for prevalence. Differences in the percentage of making a mental health visit are small after severity is accounted for. This suggests fairly equitable access across different socioeconomic groups, although women and the middle aged are more likely to seek help.
Māori and Pacific people had higher prevalences of disorder and serious disorder in the past 12 months than Others, but much of this was accounted for by sociodemographic differences, particularly for Pacific people. When the need for treatment was taken into account, Māori and Pacific people were less likely to make a mental health visit for their mental health problems. Health sector contact for mental health problems varied by ethnicity but not across socioeconomic groups.
Acknowledgements
Te Rau Hinengaro: The New Zealand Mental Health Survey (NZMHS) was funded by the Ministry of Health, Alcohol Advisory Council and Health Research Council of New Zealand. The survey was carried out in conjunction with the World Health Organization World Mental Health (WMH) Survey Initiative. We thank the WMH staff for assistance with instrumentation, fieldwork and data analysis. These activities were supported by the US National Institute of Mental Health (R01MH070884), the John D and Catherine T MacArthur Foundation, the Pfizer Foundation, the US Public Health Service (R13- MH066849, R01-MH069864, and R01 DA016558), the Fogarty International Center (FIRCA R01-TW006481), the Pan American Health Organization, Eli Lilly and Company, Ortho-McNeil Pharmaceutical, Inc, Glaxo- SmithKline, and Bristol-Myers Squibb. The WMH publications are listed at http://www.hcp.med.harvard.edu/wmh/
Other members of the NZMHS Research Team are TK Kingi, R Tapsell, S Foliaki, D Schaaf, MH Durie, C Tukuitonga and C Gale.
We thank the Kaitiaki Group and Pacific Advisory Group for their input and support for this survey and we thank all the participants.