
Abstract
The period prevalence most commonly reported for individual disorders in community surveys is 12 month prevalence [1–4]. It provides a reasonable balance between recall requirements and the precision of prevalence estimates. This is particularly important for estimating the prevalence of individual disorders, some of which are uncommon. Nonetheless, there have been criticisms that 12 month prevalences on their own are inadequate for evaluating the need for treatment, leading Regier et al. to argue for the assessment of severity and impairment as well as diagnostic criteria [5].
For the World Mental Health (WMH) Survey Initiative, the Composite International Diagnostic Interview (CIDI) was modified by the inclusion of scales in each disorder section to measure impact in the past 12 months [6]. A composite measure of severity was developed to take account of all disorders experienced in that period. Severity is defined for an individual, not a disorder. When severity is reported for a particular disorder it shows the levels of overall severity of people with that disorder, including the impact of comorbid disorders. It indicates the severity of the ‘cases’, not the severity of the disorder. In contrast, interference with life is reported for the particular disorder itself and is the result of answers to questions about interference with home responsibilities, work or study, close relationships and social life.
Assessment of severity in the past 12 months is particularly important for interview schedules that determine 12 month prevalence from lifetime prevalence plus response to a recency question. For such interviews 12 month prevalence is the percentage who have ever met criteria for disorder and who have reported an episode or symptoms in the past 12 months. Full criteria for disorder may not have been met within that period. Most versions of the CIDI are like this, including the version developed for the WMH Survey Initiative (http://www.hcp.med.harvard.edu/wmh/).
Te Rau Hinengaro: The New Zealand Mental Health Survey (NZMHS) was one of the surveys within the WMH Survey Initiative. Background to the survey is in Wells et al. [7] and Oakley Browne et al. [8]. This paper reports 12 month prevalence, interference with life and severity for the disorders assessed in New Zealand.
Method
Sample
The NZMHS was a nationally representative household survey of people aged 16 years and over. Face-to-face interviews were carried out by professional interviewers from the National Research Bureau between October 2003 and December 2004. The survey was approved by all 14 regional health ethics committees, with the Auckland Y committee serving as the lead committee. Written informed consent was obtained from all respondents before the interview began. M5ori and Pacific people were oversampled. A detailed report of methods is given elsewhere [7, 9]. The response rate was 73.3%. The interview consisted of two parts. Part 1 included core diagnostic sections, suicidal behaviours, service use and demographics and was administered to everyone (n = 12 992). Part 2 consisted of additional diagnostic sections and other measures of mental and physical health and was administered to a subsample (n = 7435), called the long-form subsample. All participants who met certain criteria in the Part 1 diagnostic sections received the long form of the interview. A probability subsample of other participants also received the long form [7], figure 1].
Interview
The interview was based on version 15 of the WMH-CIDI [6], a fully structured lay interview. Version 20 is now known as the CIDI 3.0 (http://www.hcp.med.harvard.edu/wmh/). In New Zealand the interview length was cut by deleting childhood disorders and other disorders that were not part of the core set. However, there was widespread debate about marijuana in New Zealand when the interview was being finalized. Therefore, in the drug section, if participants who had used marijuana and other drugs reported a symptom they were then asked if that symptom occurred with marijuana. This enabled marijuana use disorders to be diagnosed as a subset of drug use disorders.
Diagnoses
Although ICD-10 [10] and DSM-IV [11] diagnoses can both be made from the CIDI 3.0, only DSM-IV diagnoses are reported here, using hierarchy rules, except for substance abuse, which is reported whether or not there was lifetime dependence. Participants without any symptom ever of substance abuse (alcohol or drugs) skipped the associated dependence section, so dependence is really dependence with abuse at some time. A broad definition of bipolar disorder was used that included mania (bipolar I), hypomania plus an episode of major depression (bipolar II) or hypomania (subthreshold bipolar disorder). Organic exclusions were applied after a psychiatrist coded text responses. The WMH Survey Initiative algorithms as in January 2006 were used to produce diagnoses. A minor modification was required for agoraphobia because separation anxiety was not assessed. The marijuana algorithms were written in New Zealand using the WMH drug disorder algorithms as a model.
Interference with life and severity
Interference with life in the past 12 months was reported for each disorder (except for substance use disorders) at the end of each disorder section, using the Sheehan Disability Scale [12, 13], which assessed impairment in household maintenance, work or study, intimate relationships and social life for the worst month in that period. For each domain there was a 0–10 visual analogue scale with verbal descriptors of: none, 0; mild, 1–3; moderate, 4–6, severe, 7–9; and very severe, 10. If a domain was not applicable, the mean for a participant was the mean across all applicable domains.
For alcohol dependence and separately for drug dependence participants reported how much, in the past 12 months, they had experienced each of the following because of their substance use: harm to physical health, hurt to family, impulsive actions later regretted, failure to do what was expected and unhappiness. Responses were: a lot, some, a little, not at all.
Severity for a case was based on all disorders experienced in the past 12 months. Definitions used in New Zealand were those developed for the first WMH cross-national paper [2] except for substance dependence for which the National Comorbidity Survey Replication [14] definition was used [7]. Participants were classified with serious disorder if any one of the following occurred in the past 12 months: an episode of bipolar I disorder; substance dependence with serious role impairment (two effects experienced ‘a lot’); a suicide attempt and any WMH-CIDI/DSM-IV disorder; at least two areas of severe role impairment owing to a mental disorder in the Sheehan Disability Scale domains; overall functional impairment at a level found in the National Comorbidity Survey Replication to be consistent with a Global Assessment of Functioning [15] score of 50 or less in conjunction with a WMH-CIDI/DSM-IV disorder. Participants with disorder who were not classified as serious were classified as moderate if interference was reported as at least moderate in any Sheehan Disability Scale domain or if they had substance dependence without substantial impairment. All other participants with disorder were classified as mild.
Analyses
Data were weighted to account for the different probabilities of selection that arose from oversampling M5ori and Pacific people and the selection of one person per household, differential non-response, and residual differences in age, sex and ethnicity between the sample and the 2001 census population. Additional weights were used to account for selection into the long-form sections of the interview. Analyses were carried out in SUDAAN 9.0.1 to take account of the complex survey design [7]. Taylor Series Linearization was used for variance estimation. For prevalences with less than 30 events in the numerator, confidence intervals were calculated according to a method by Korn and Graubard [16, 17].
Results
Prevalence
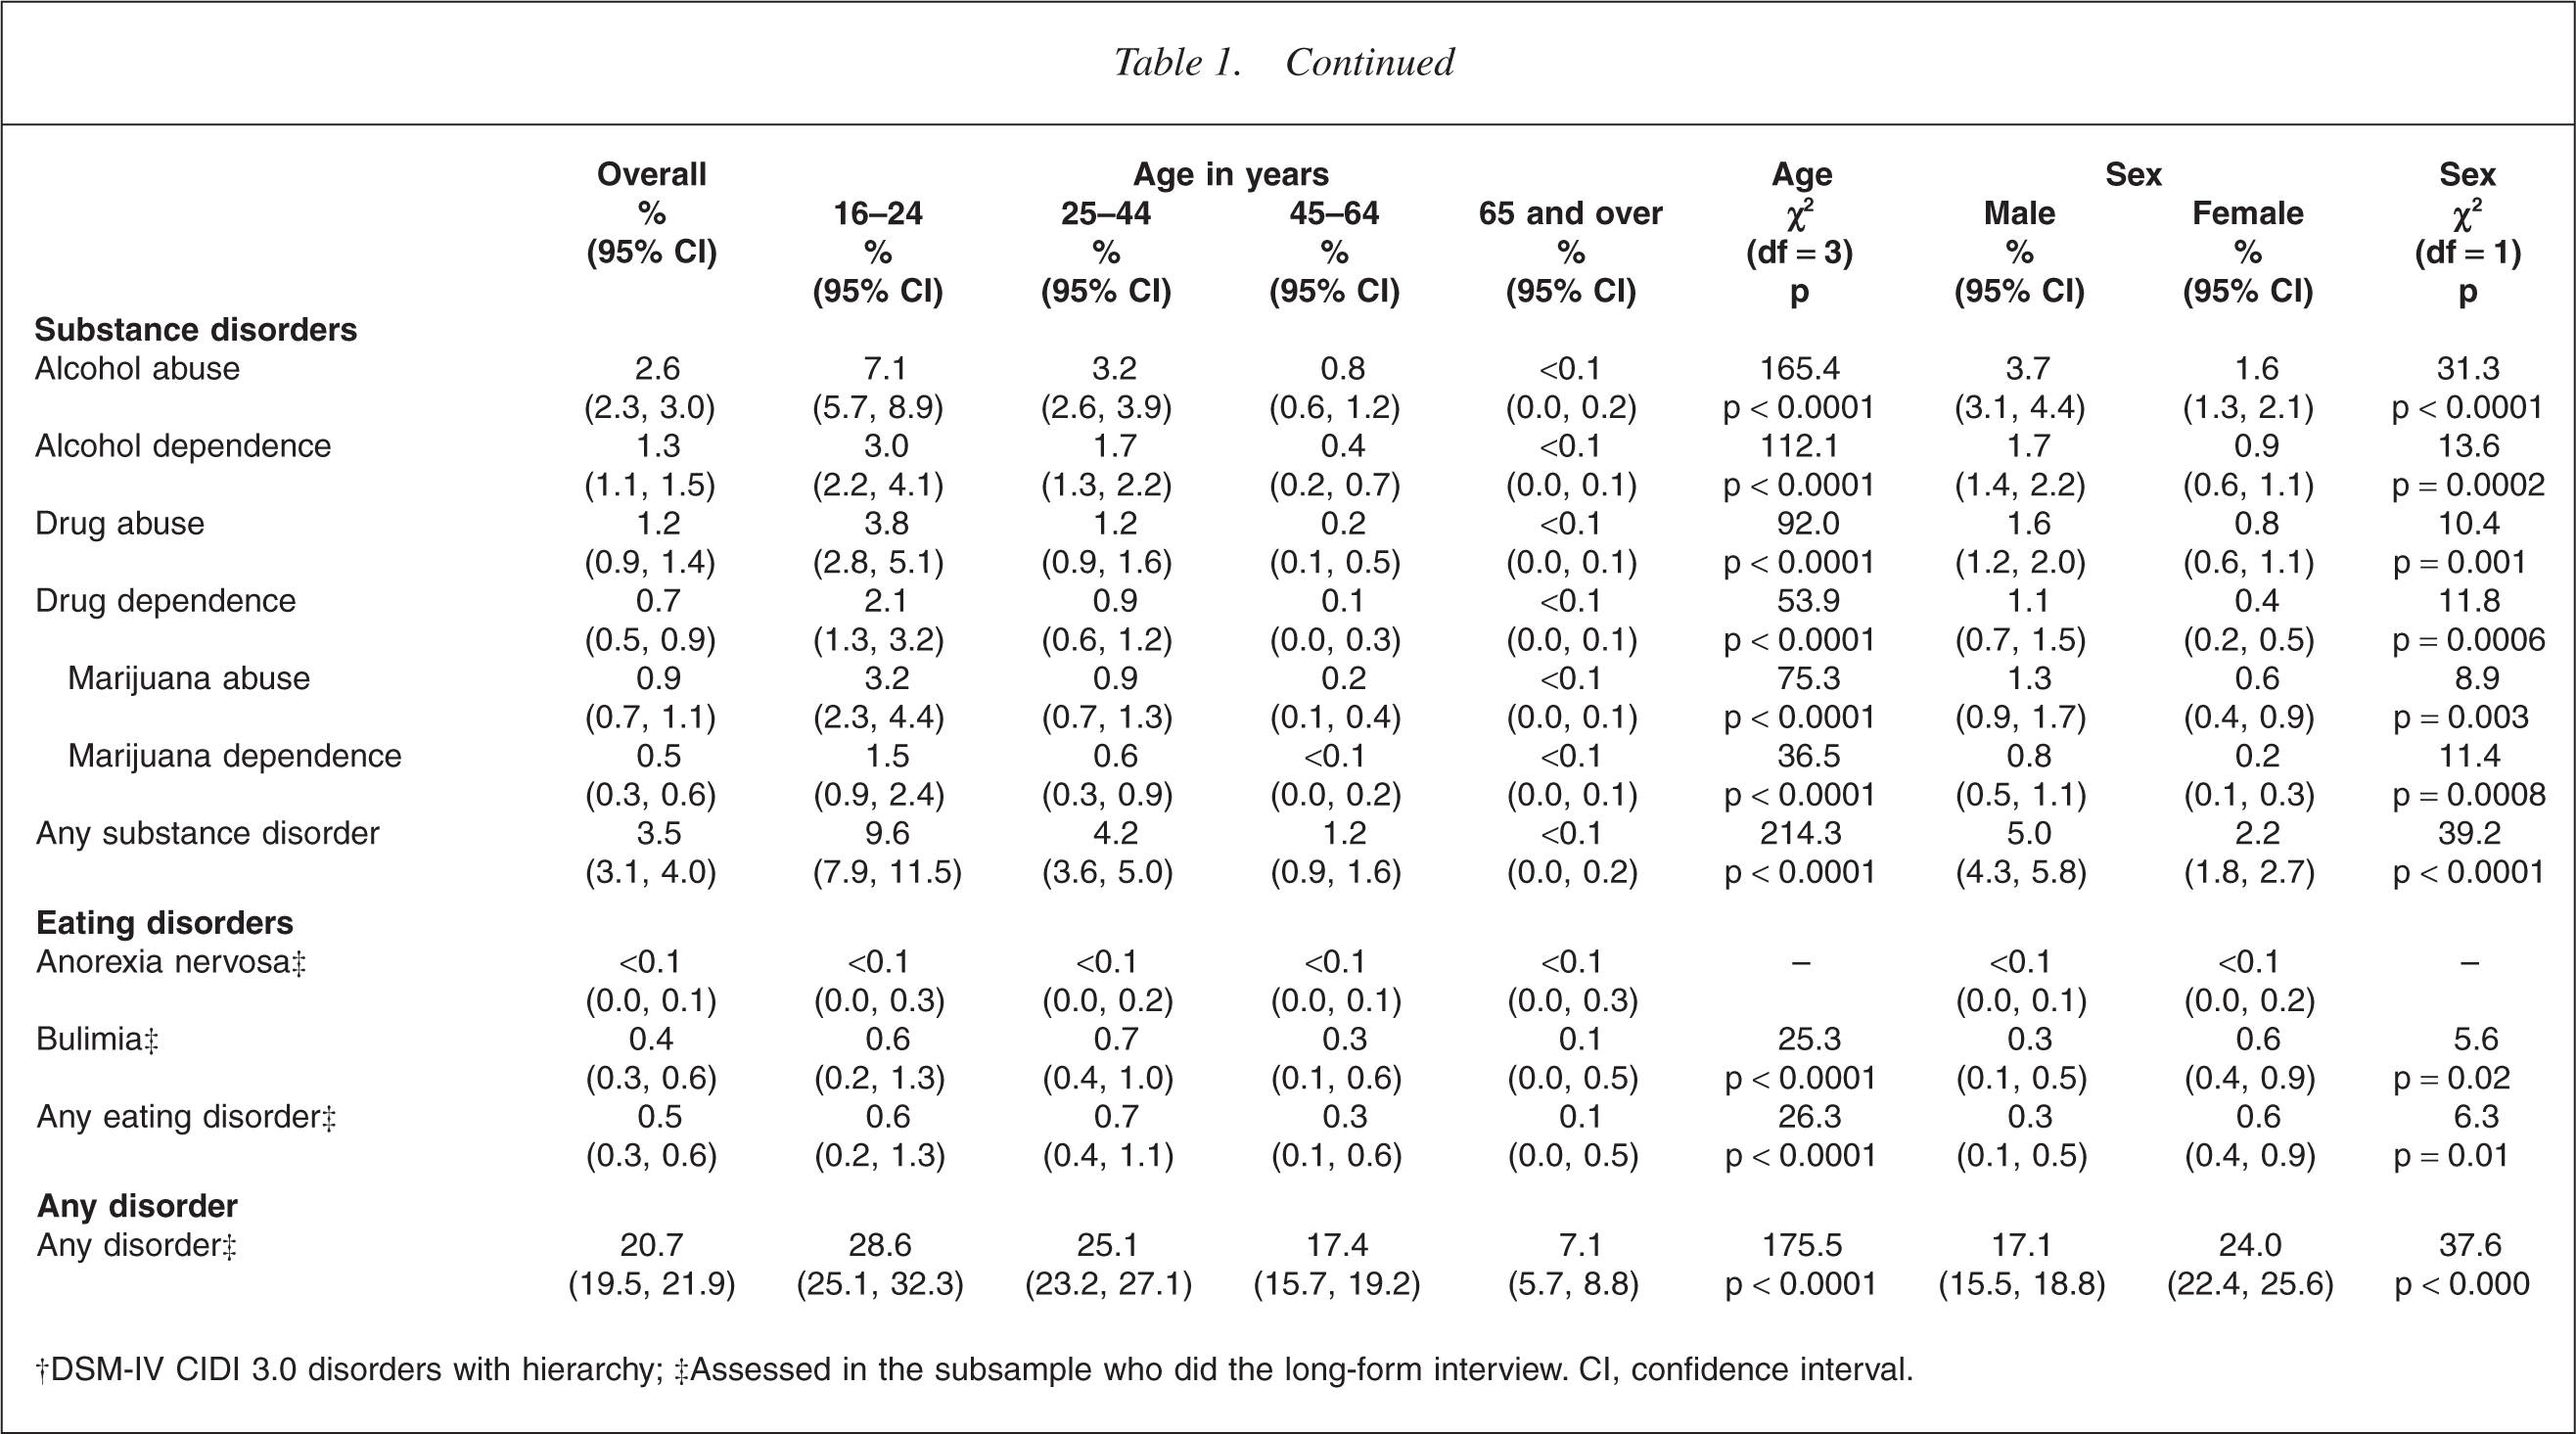
Table 1 shows that anxiety disorders (14.8%) were the most common disorder group, followed by mood disorders (7.9%) and substance use disorders (3.5%), with a low prevalence of eating disorders (0.5%). The prevalence of individual disorders ranged from 7.3% for specific phobia, 5.7% for major depressive disorder and 5.1% for social phobia to less than 0.1% for anorexia. The prevalence of bipolar disorder of 2.2% can be subdivided into bipolar I (0.6%; 0.5, 0.8), bipolar II (0.4%, 0.3, 0.6), and subthreshold (1.1%, 0.9, 1.4). The prevalence of some disorders may have been underestimated. For alcohol and separately for drugs, participants who did not report ever experiencing any symptom of abuse were not asked dependence questions. Hasin and Grant's work [18] suggests this will have resulted in underestimation. In 2005 the CIDI 3.0 was revised because of concern about underestimation of obsessive–compulsive disorder (OCD) (WMH, personal communication, 2006). The New Zealand interview was before this revision. The observed prevalence of anorexia may have been particularly affected by refusal to participate or disclose. In addition, the recency questions asked about when the participant was last at their lowest weight and had problems. Someone currently at low weight with problems, but not at their lowest weight, would not have been counted for 12 month prevalence.
Twelve-month prevalence of mental disorders† overall and by age and by sex
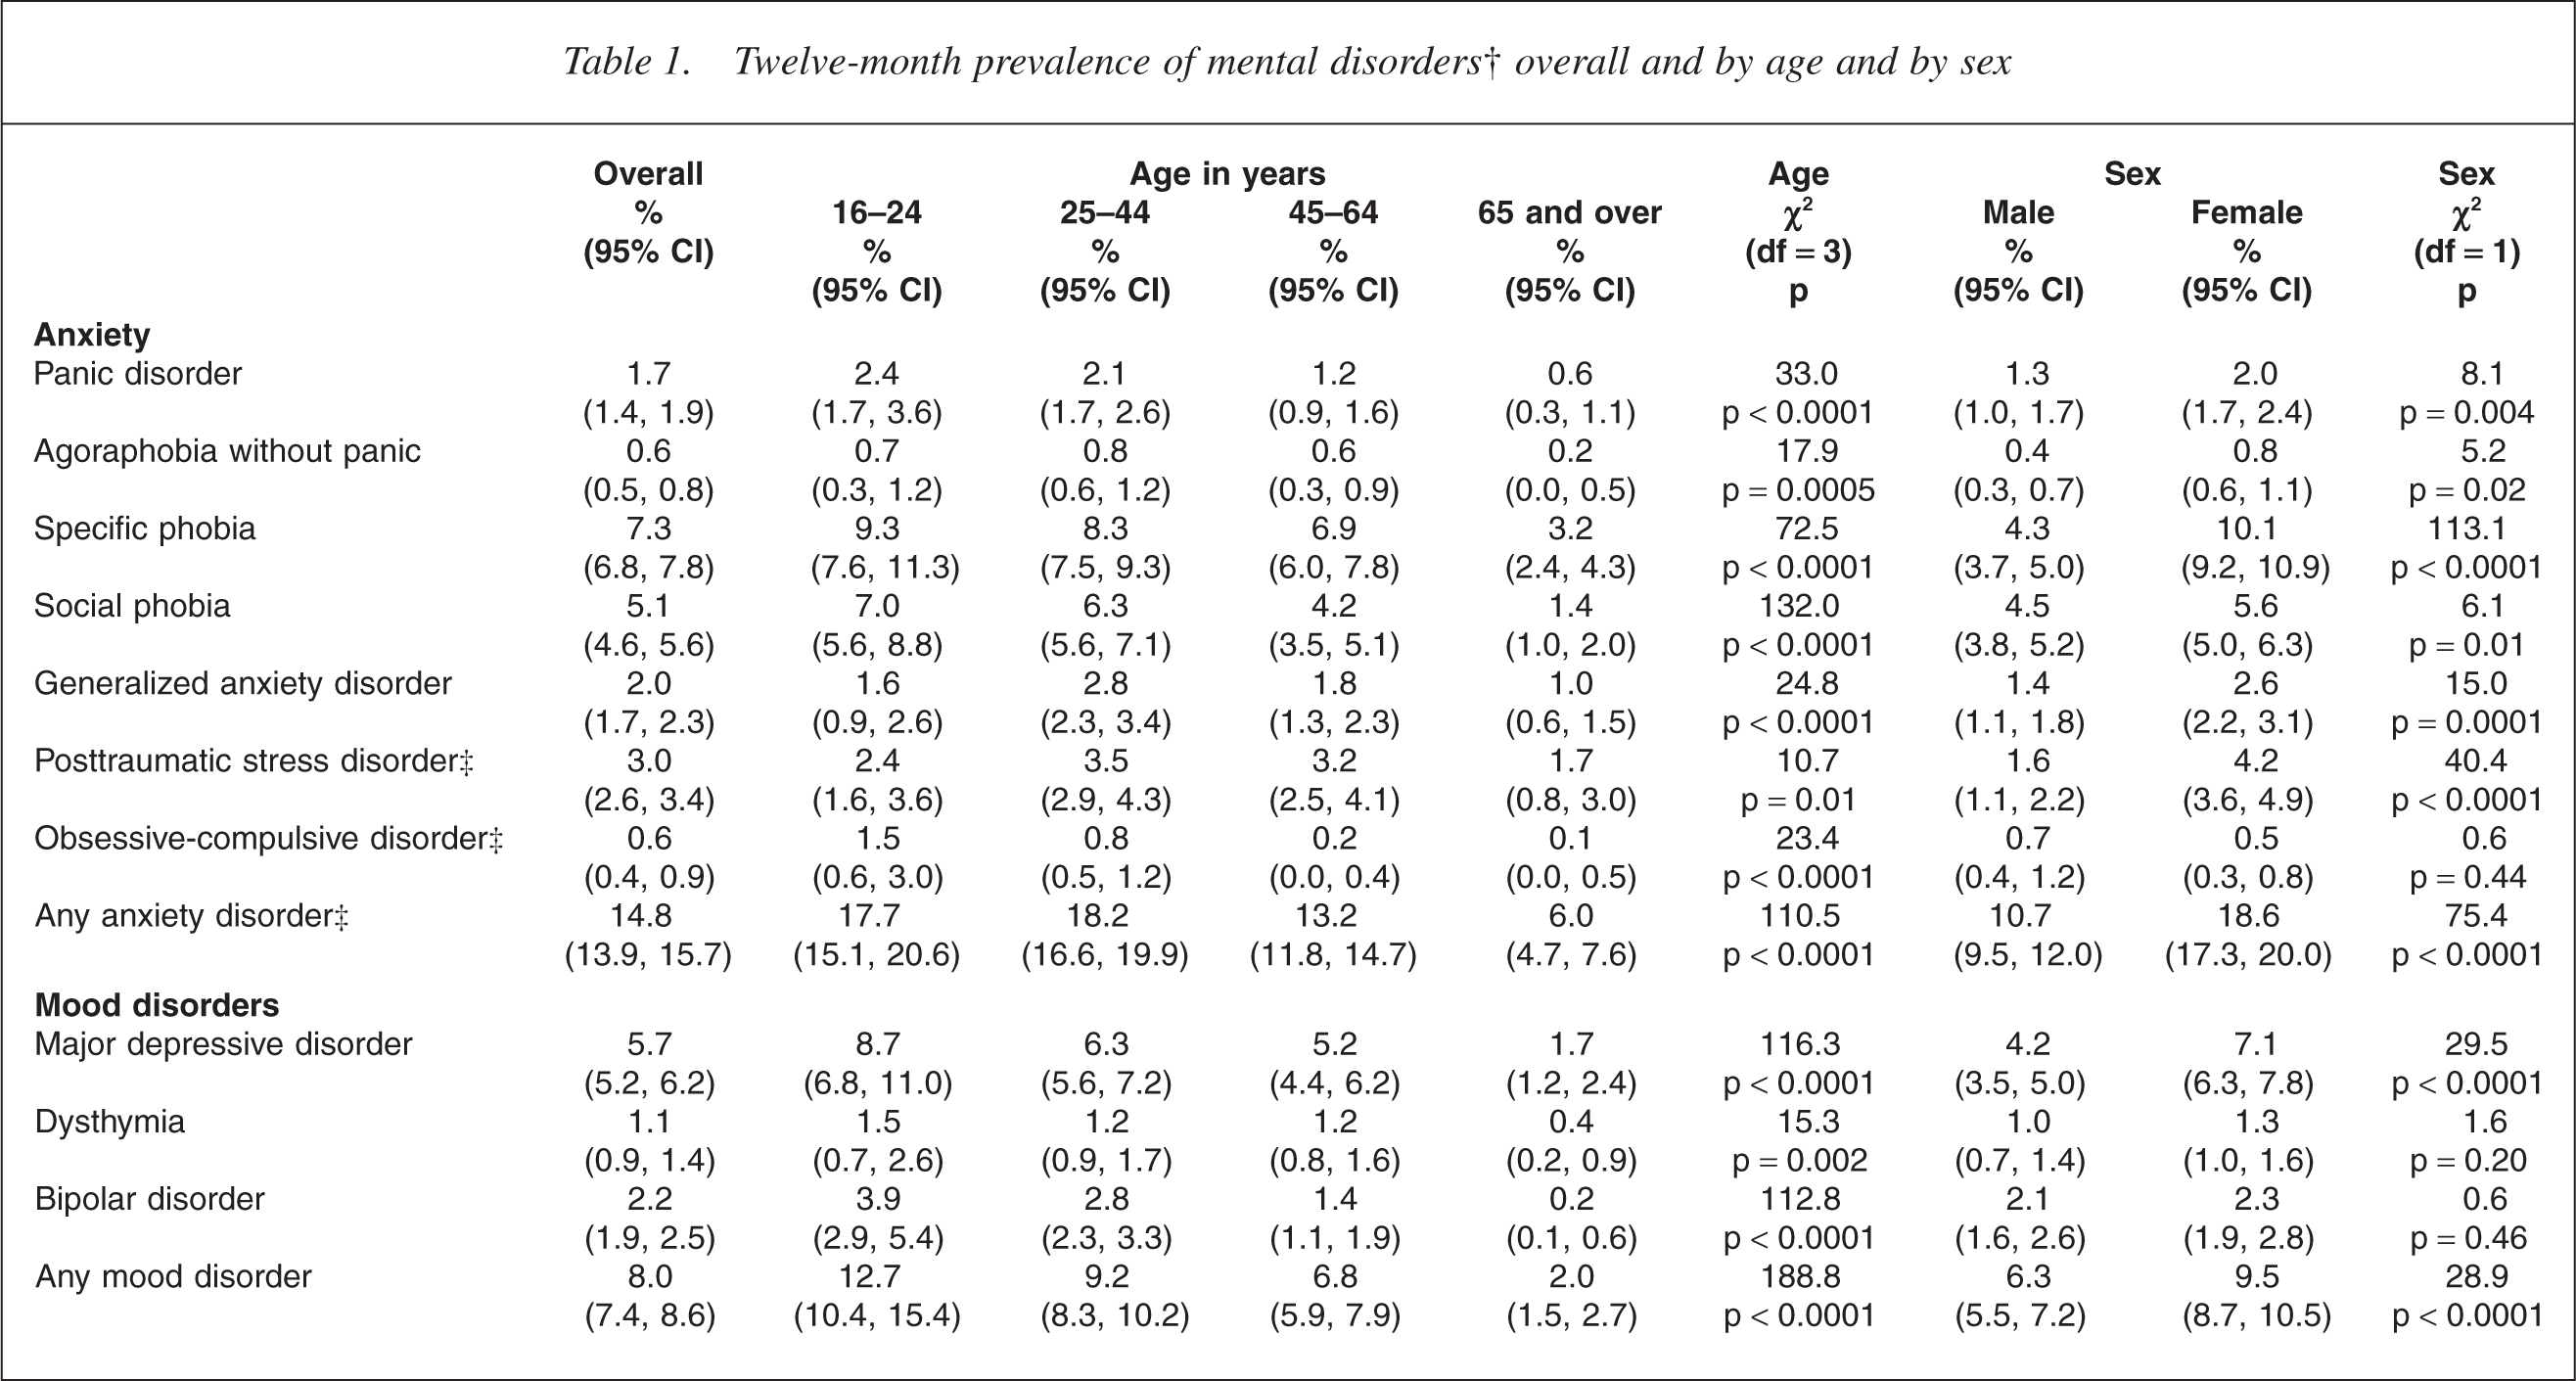
†DSM-IV CIDI 3.0 disorders with hierarchy; ‡Assessed in the subsample who did the long-form interview. CI, confidence interval.
The prevalence of any disorder declined with age [7]. This monotonic pattern was seen for most individual disorders (p < 0.002) and was particularly marked for substance use disorders. The exceptions were generalized anxiety disorder (GAD), posttraumatic stress disorder (PTSD) and agoraphobia for which prevalence was higher in the 25– 44 year age group than in the 16–24 year age group, although this was significant only for GAD (p < 0.02). For all disorders the lowest prevalence was in the oldest age group.
Sex differences varied across disorders. For anxiety disorders (apart from OCD), major depressive disorder and bulimia, females had higher prevalences than males (p ≤ 0.02) with the largest differences seen for specific phobia (10.1% vs 4.3%, p < 0.0001) and PTSD (4.2% vs 1.6%, p < 0.0001). There were no significant differences for OCD, dysthymia or bipolar disorder (p > 0.20). For alcohol and drugs, males had prevalences around double those for females (p < 0.0001).
Interference with life
Interference with life for the worst month in the past 12 months is reported in Table 2 for individual disorders, for each of four domains and for the mean across all domains. Interference occurs across all domains, generally at similar levels for a given disorder, although for social phobia the home maintenance domain mean was only 2.0 (mild) whereas it was 5.1 (moderate) for the social life domain.
Interference with life from 12 month mental disorders†
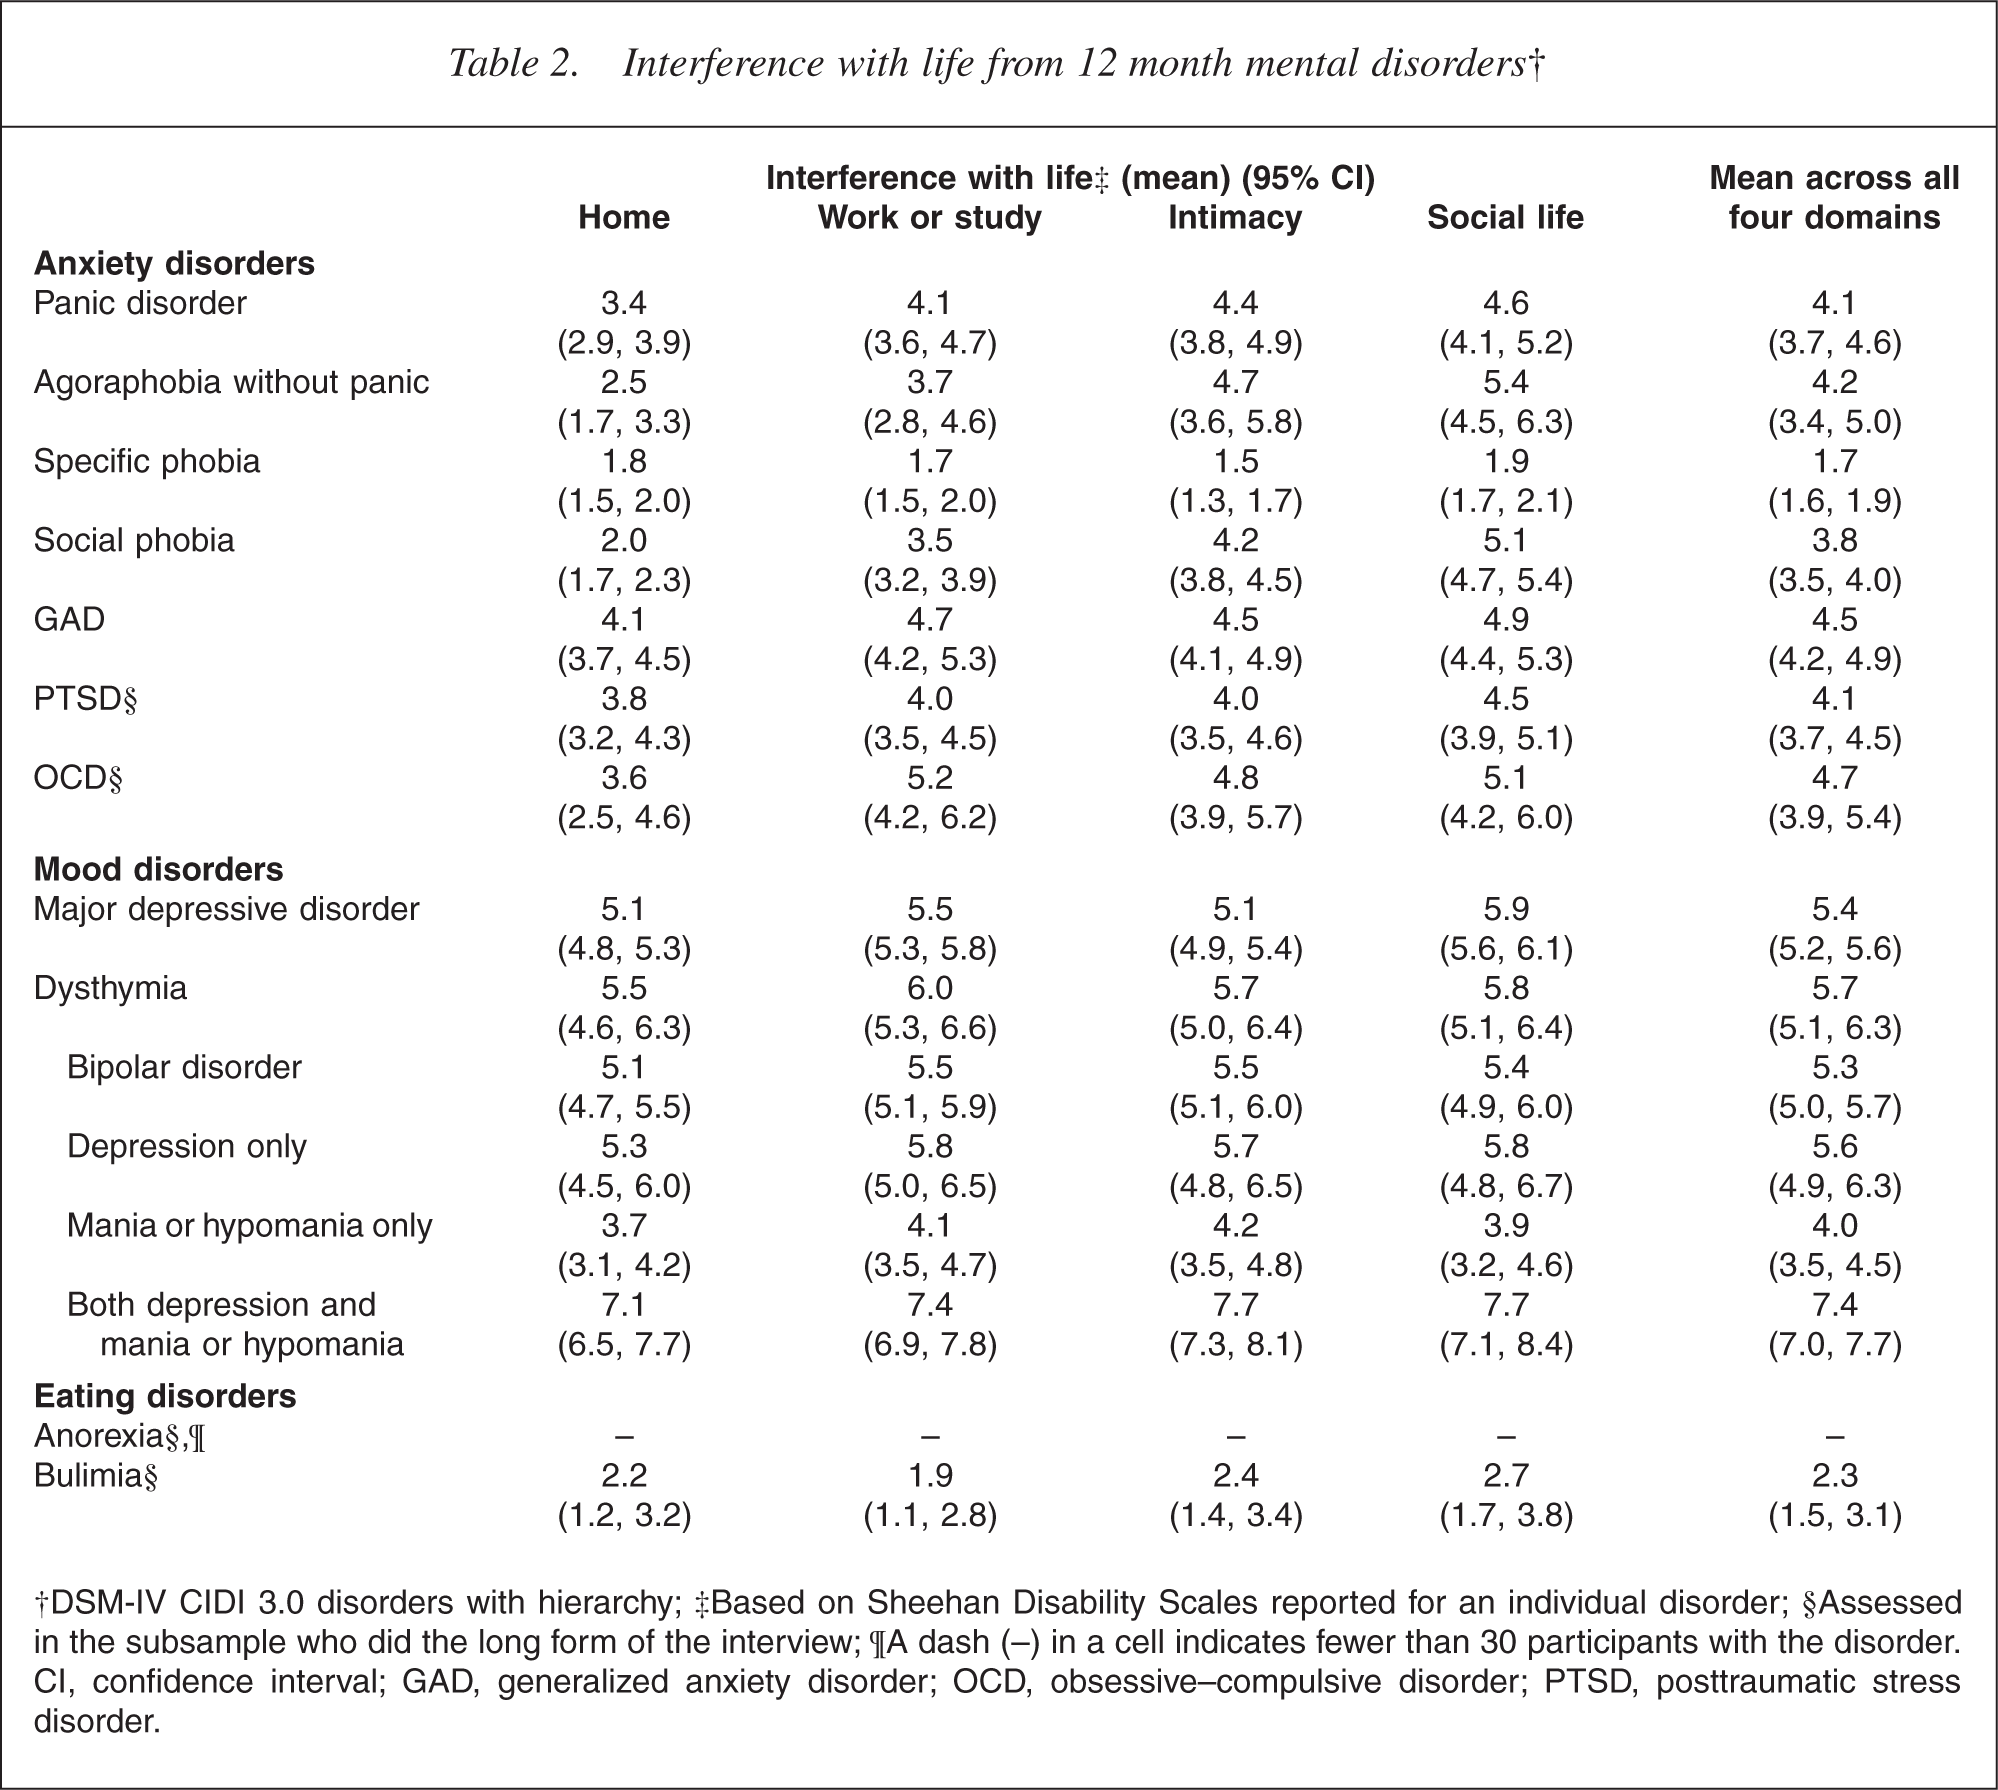
†DSM-IV CIDI 3.0 disorders with hierarchy; ‡Based on Sheehan Disability Scales reported for an individual disorder; §Assessed in the subsample who did the long form of the interview; ¶A dash (–) in a cell indicates fewer than 30 participants with the disorder. CI, confidence interval; GAD, generalized anxiety disorder; OCD, obsessive–compulsive disorder; PTSD, posttraumatic stress disorder.
For anxiety disorders mean interference was in the moderate range (4–6) except for specific phobia (1.7). All mood disorders had at least moderate mean interference with severe interference with life seen in those with bipolar disorder who experienced both highs and lows in the past 12 months (7.4). The unexpectedly high impact of dysthymia arose because it was not possible to separate out major depression and dysthymia in the past 12 months in people who had met lifetime criteria for both; 89.7% of those with 12 month dysthymia had met lifetime criteria for major depressive disorder. Those with dysthymia and major depressive disorder ever had a mean interference with life of 5.9 (5.3, 6.5) whereas those who had only ever had dysthymia had mean interference of 4.2 (3.0, 5.4).
In the version of the interview used in New Zealand the Sheehan Disability Scales were not used in the substance section, although they have since been added. The impact of substance dependence was assessed separately for alcohol and for drugs, and is reported in Table 3. Participants with alcohol dependence in the past 12 months were consistently less likely than those with drug dependence to report each consequence of their substance use. Of those with drug dependence, 29.4% were marijuana dependent and had used only marijuana in the past 12 months. This marijuana-only group experienced less impact from their drug dependence than those who used other drugs either with or instead of marijuana. The difference was particularly clear for the health impact of drug use (9.8% for the marijuana group, 37.2% for the whole drug dependence group).
Effects on life in the past 12 months from alcohol dependence and drug dependence
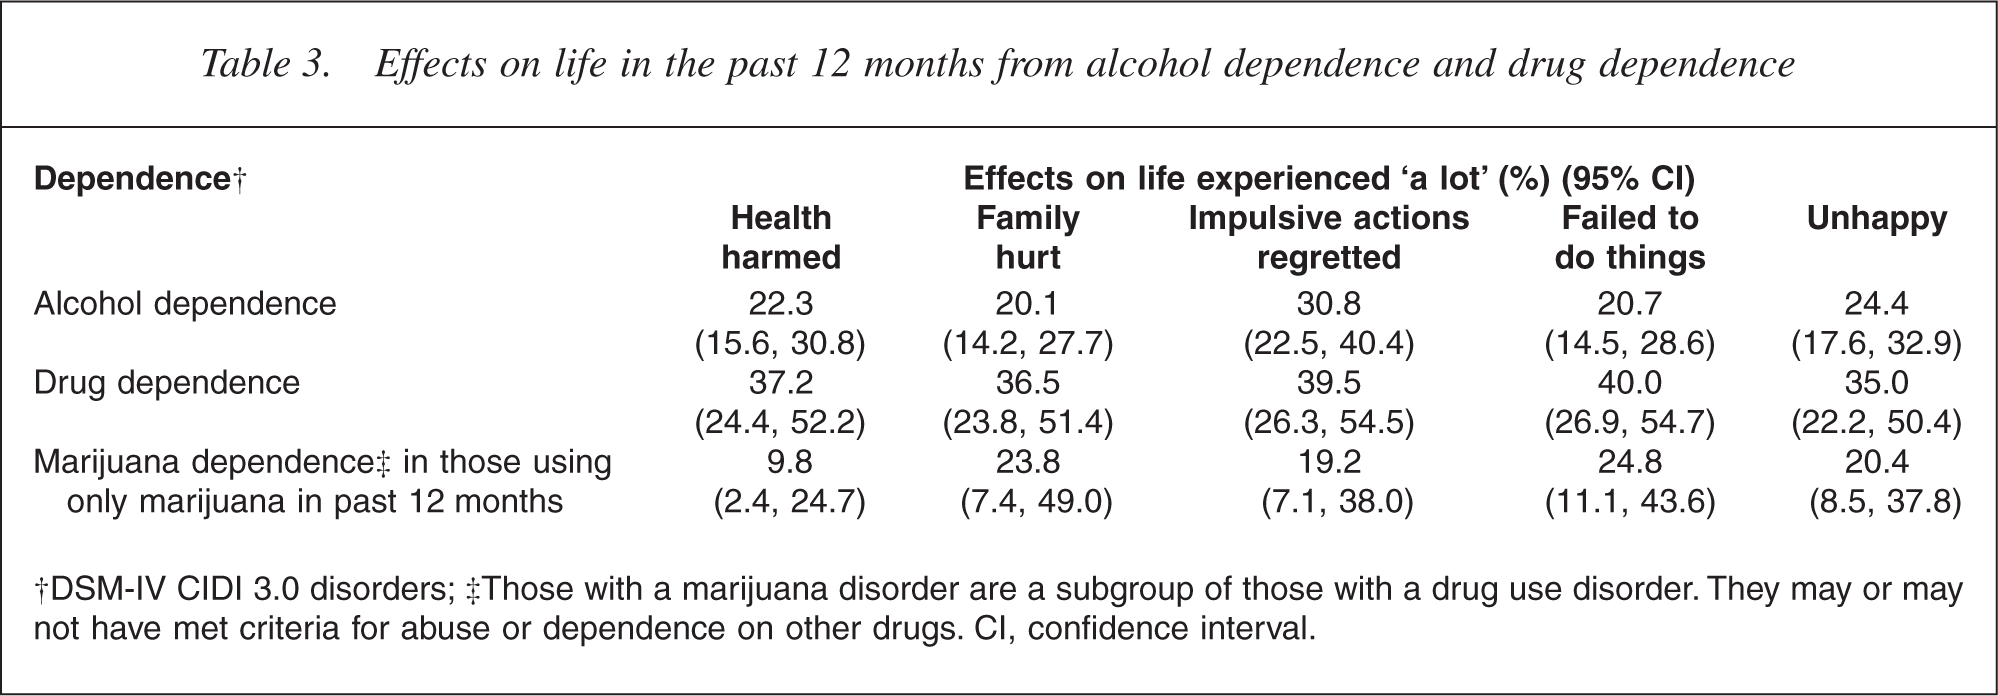
†DSM-IV CIDI 3.0 disorders; ‡Those with a marijuana disorder are a subgroup of those with a drug use disorder. They may or may not have met criteria for abuse or dependence on other drugs. CI, confidence interval.
Severity
Interference with life was specific to a particular disorder, in as much as people were able to separate out the impact of a single disorder on their lives. In contrast, severity was aggregated across the disorders a person experienced in the past 12 months, so incorporated comorbidity. Severity classified cases results are shown in Table 4.
The severity of mental disorders† in the past 12 months
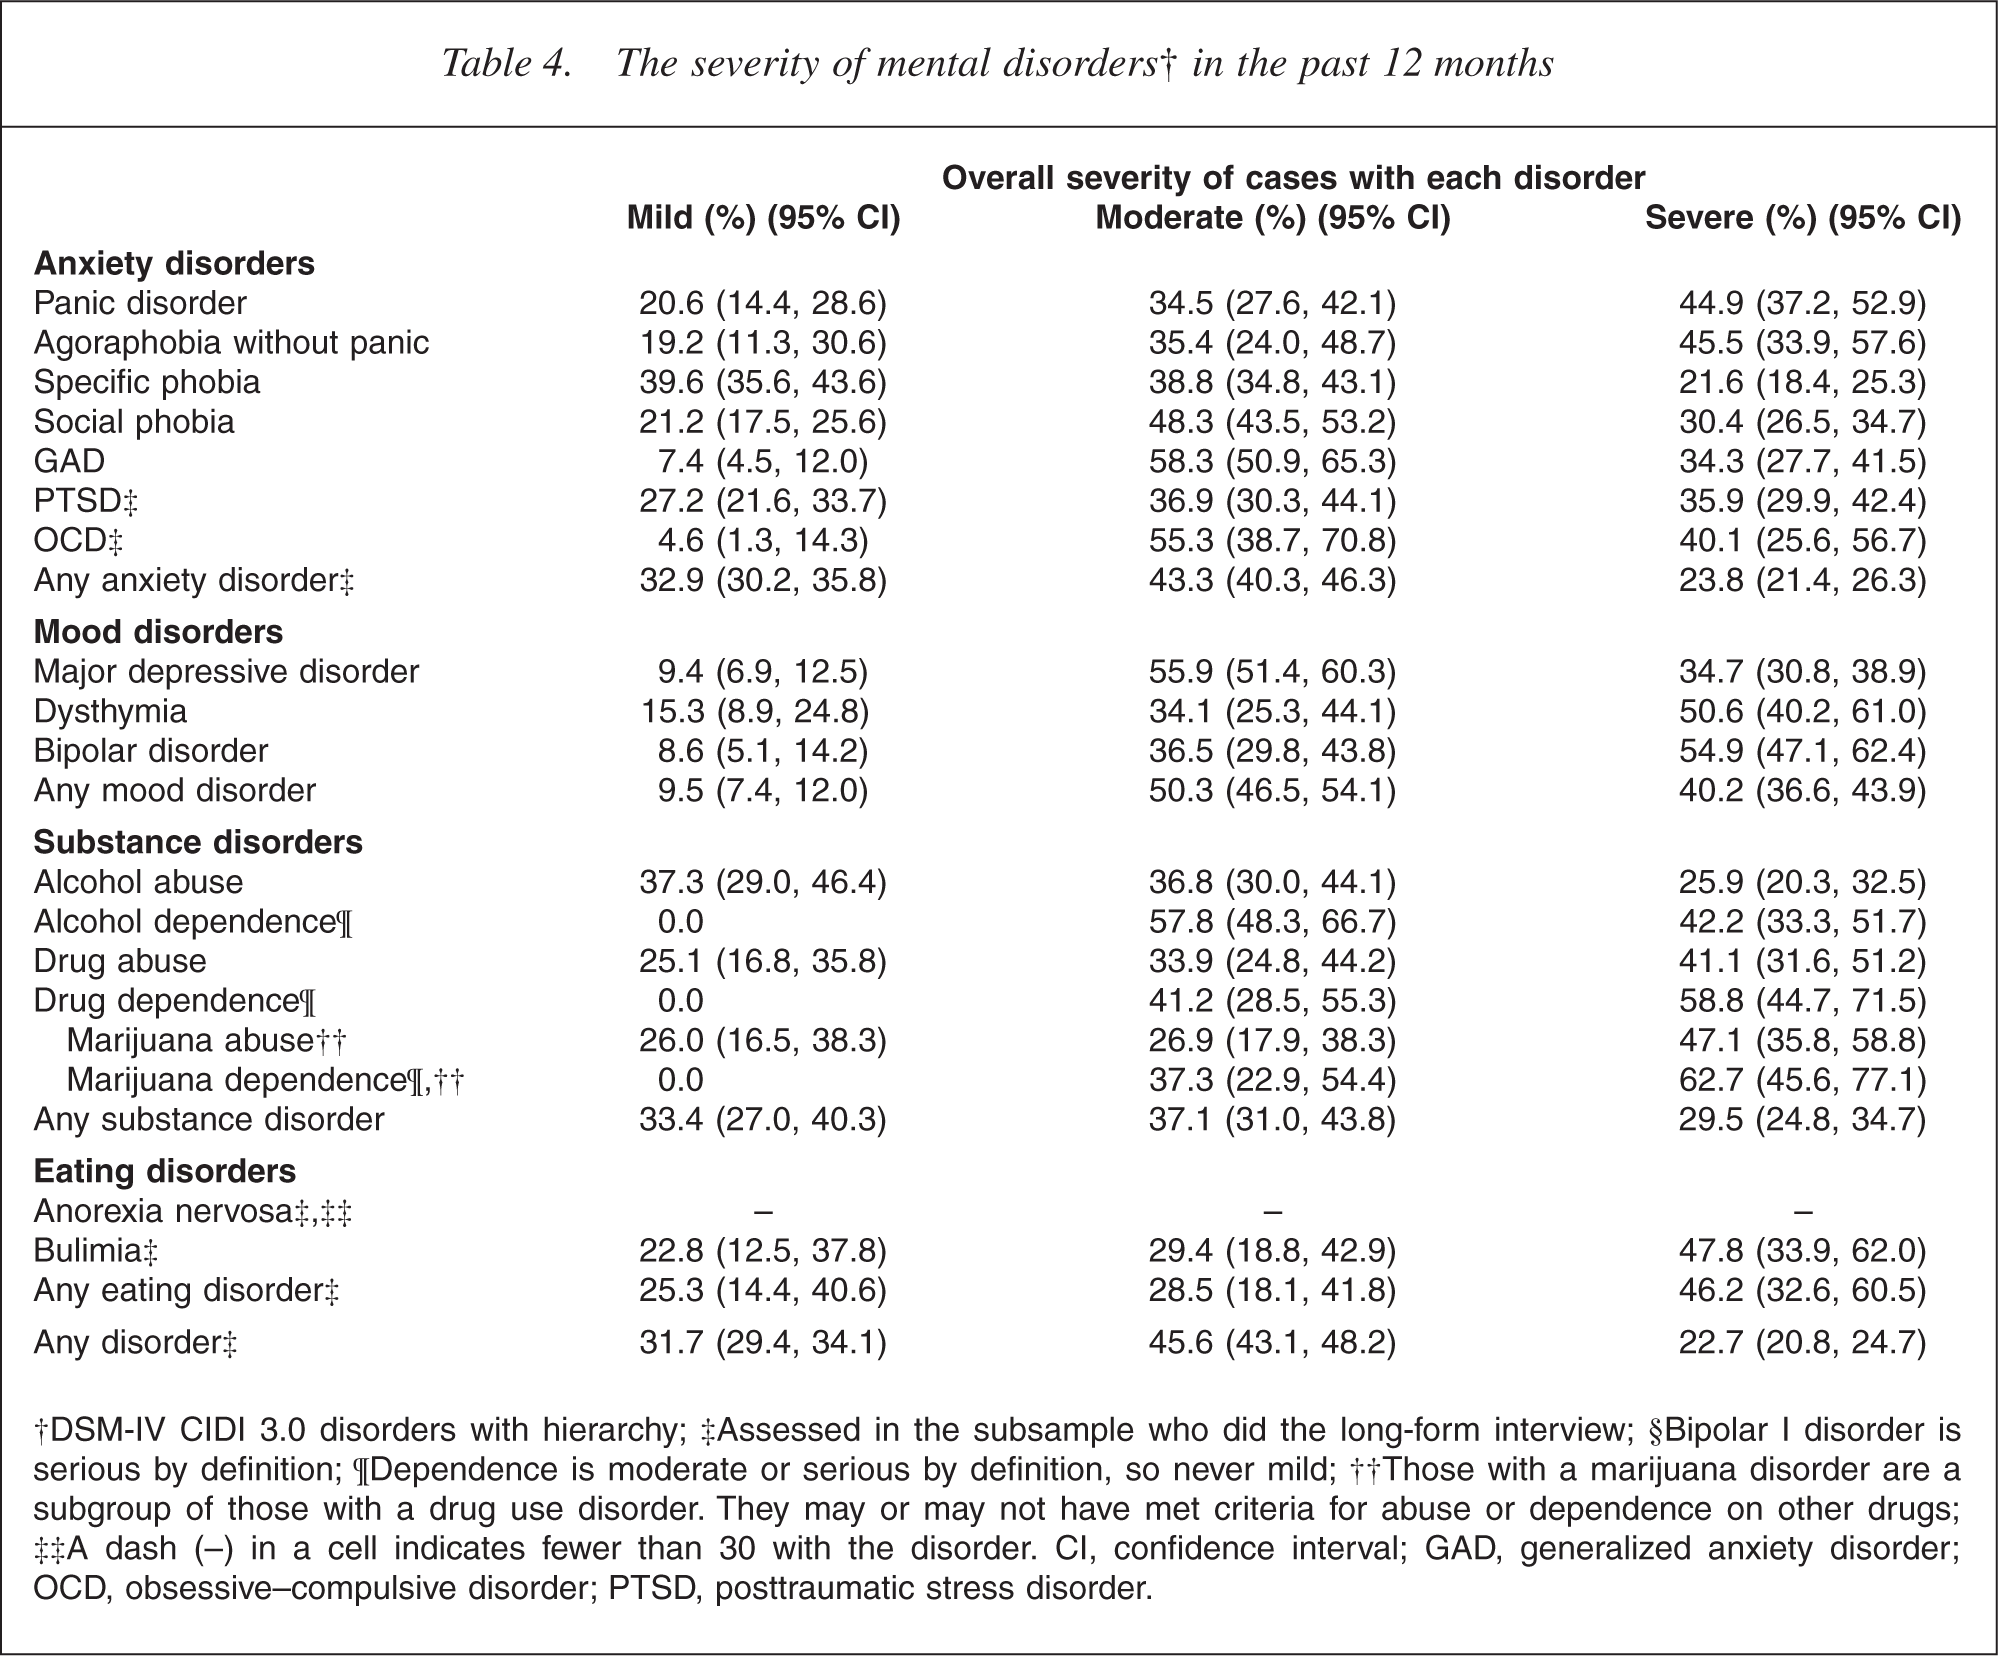
†DSM-IV CIDI 3.0 disorders with hierarchy; ‡Assessed in the subsample who did the long-form interview; §Bipolar I disorder is serious by definition; ¶Dependence is moderate or serious by definition, so never mild; ††Those with a marijuana disorder are a subgroup of those with a drug use disorder. They may or may not have met criteria for abuse or dependence on other drugs; ‡‡A dash (–) in a cell indicates fewer than 30 with the disorder. CI, confidence interval; GAD, generalized anxiety disorder; OCD, obsessive–compulsive disorder; PTSD, posttraumatic stress disorder.
Drug dependence and bipolar disorder had the highest percentages of serious cases, followed by dysthymia, agoraphobia without panic, and panic disorder. The severity of bipolar disorder was not due just to the definition of bipolar I as serious, as shown by the results for bipolar II and for subthreshold bipolar. Substance use dependence was at least moderate by definition but the per cent classified as serious reflected reports of the impact of dependence and other comorbid disorders. Even specific phobia had over 20% with serious disorder, because nearly half were comorbid (48.5%). Mild disorder was the most common classification for only specific phobia and alcohol abuse. Less than 10% of cases for GAD, OCD, major depressive disorder and bipolar disorder were classified as mild.
Discussion
The prevalence of any mental disorder reported from a survey depends on the definition used for the disorder, the instrument used to measure it, and the response rate, as well on the level of morbidity in the population. Therefore, comparisons of prevalences from various surveys must be made with due consideration of all these factors.
Results from other WMH Survey Initiative countries are the most comparable with those from New Zealand, as they used the same interview (CIDI 3.0), the same DSM-IV criteria and the same algorithms to calculate diagnoses. New Zealand has high 12 month prevalences of anxiety, mood and substance use disorders relative to the 15 sites reported in 2004 [2]. For anxiety, New Zealand was second to the US (14.7% vs 18.2%), whereas for mood disorders the US, the Ukraine and France had higher prevalences (9.6% for the US; 9.1% for the Ukraine without bipolar disorder; 8.5% for France without bipolar disorder; 7.7% for New Zealand). For substance use disorder, the Ukraine, which did not assess drug disorder, still had a substantially higher prevalence (6.4%) than New Zealand (3.5%), with the US (3.8%) non-significantly higher than New Zealand.
Prevalences for individual disorders are available for the US [14] and for the six European sites in the European Study of the Epidemiology of Mental Disorders (ESEMeD) combined [19]. New Zealand had a slightly lower prevalence than the US for all disorders except for alcohol dependence (1.3% at both sites) and drug dependence (0.7% vs 0.4%, p ≈ 0.05). Comparisons with the ESEMeD results show that New Zealand had higher prevalences for major depressive disorder (5.7% vs 3.9%), GAD (2.0% vs 1.0%), social phobia (5.1% vs 1.2%), specific phobia (7.3% vs 3.5%), panic disorder (1.4% vs 0.8%), alcohol abuse (2.6% vs 0.7%) and alcohol dependence (1.3% vs 0.3%). However, given the variation in prevalence for disorder groups across the ESEMeD countries [2], it is not straightforward to interpret the prevalences for individual disorders that have been combined across countries. Also, the response rates in the ESEMeD countries varied from 46% in France to 79% in Spain. The response rates for New Zealand and the US were 73% and 71%.
The 1997 Australian National Mental Health Survey [4] used a variant form of the CIDI interview (CIDI 2.1) that asked only about the past 12 months and required that all criteria were met within that period. Therefore, the New Zealand and Australian 12 month prevalences were ascertained in different ways. Nonetheless, the 12 month prevalences were very similar for many disorders. However, social phobia and PTSD were more common in New Zealand than in Australia (5.1% vs 1.3% for social phobia; 3.0% vs 1.3% for PTSD). It is likely that these differences reflect changes made to these sections in the interview, particularly to the PTSD section, as well as the need to meet full criteria in the past 12 months in Australia. The prevalence of DSM-IV alcohol dependence was 4.1% in the Australian study, but only 1.3% in the New Zealand study. As Australia and New Zealand have similar per capita consumption and patterns of drinking [20], table 12.3, [21] this difference is surprising. In the version of the CIDI used in New Zealand dependence questions were not asked unless a participant had reported abuse at any time. However, this skip pattern could not account for the difference in prevalence between Australia and New Zealand; Hasin and Grant [18] using the AUDADIS-IV interview found that 13.9% of those with lifetime dependence did not ever have abuse. The lifetime prevalence of alcohol dependence in New Zealand was 4.0% [22]. Correcting according to Hasin and Grant's findings would raise this to 4.6%. Assuming unrealistically that all those ever dependent without abuse were still dependent in the past 12 months would still raise the New Zealand prevalence from 1.3% to only 1.9%. Both the AUDADIS-IV and the CIDI 2.1 asked more specific questions, which may have lead to their higher estimates of 3.8% and 4.1%.
The only previous New Zealand community-wide survey was the Christchurch Psychiatric Epidemiology Study [23, 24], which interviewed people aged 18– 64 years in 1986, using the Diagnostic Interview Schedule [25]. At that time DSM-III criteria were used for diagnosis and there are many differences between DSMIII and DSM-IV diagnoses. One consistent difference is that DSM-IV has a requirement for ‘substantial impairment’ in many diagnoses. Therefore, this could reduce prevalence, as appears to have happened for GAD (12.7% vs 2.0%).
Diagnostic changes are particularly marked for substance abuse and dependence. In DSM-III, abuse was much closer to a lay concept of abuse. Dependence has been broadened as a concept [26], but now requires that at least three symptoms must have occurred within 1 year. The 12 month prevalence of alcohol abuse or dependence was 9.3% in the Christchurch Psychiatric Epidemiology Study and 3.4% in the present survey for the group aged 18–64 years. In spite of the technical reasons for an apparent decline in prevalence, a real decline may have occurred. In 1986 per capita alcohol consumption for those aged 15 years and over was 11.3 L per year. In 2004 it was 18% lower at 9.2 L per year, having declined fairly steadily throughout the 1980s and 1990s (http://www.stats.govt.nz/).
The NZMHS has shown that mental disorder is common in the past 12 months with 20.7% experiencing at least one of the disorders assessed. This estimate should be regarded as conservative. Some disorders were not assessed although, because of comorbidity, including them might not have increased prevalence by much [14]. People with disorder might have been more reluctant than others to participate or they might have been reluctant to report what they regarded as embarrassing behaviours. Interference with life was higher for mood disorders than for anxiety disorders. Most people with disorder diagnosed in this period were classified as serious (22.7%) or moderate (45.6%) rather than mild (31.7%). Prevalences are high even for a developed country and the impact of disorder is often substantial.
Footnotes
Acknowledgements
Te Rau Hinengaro: The New Zealand Mental Health Survey was funded by the Ministry of Health, Alcohol Advisory Council of New Zealand and Health Research Council of New Zealand. The survey was carried out in conjunction with the World Health Organization WMH Survey Initiative. We thank the WMH staff for assistance with instrumentation, fieldwork and data analysis. These activities were supported by the US National Institute of Mental Health (R01MH070884), the John D and Catherine T MacArthur Foundation, the Pfizer Foundation, the US Public Health Service (R13-MH066849, R01-MH069864 and R01 DA016558), the Fogarty International Center (FIRCA R01-TW006481), the Pan American Health Organization, Eli Lilly and Company, Ortho-McNeil Pharmaceutical, Inc., GlaxoSmithKline, and Bristol-Myers Squibb. WMH publications are listed at ![]() .
.
Other members of the NZMHS research team are TK Kingi, R Tapsell, S Foliaki, D Schaaf, MH Durie, C Tukuitonga and C Gale.
We thank the Kaitiaki Group and Pacific Advisory Group for their input and support for this survey and we thank all the participants.