
Abstract
Te Rau Hinengaro: The New Zealand Mental Health Survey (NZMHS) is the first survey to measure the prevalence of mental disorders in a nationally representative sample that includes Māori and Pacific populations. The survey provides an opportunity to describe ethnic differences in the prevalence and pattern of mental disorder and in the level and pattern of contact with health services for mental health needs.
The ethnic groups described are Māori, Pacific and Other. Based on the 2001 census, Māori, the indigenous people of New Zealand, make up 15% of the New Zealand population and Pacific people (those who identify as belonging to an ethnic group from any Pacific Island) make up 6%. The Other ethnic group is a composite group of all those who did not identify as Māori or Pacific; this group makes up 78% of the population and the majority are of New Zealand European ethnicity. Also included within the Other group are Asian populations, which comprise 7% of the total population.
Ethnic differences in mental health occur within a context of known ethnic differences across health indicators in New Zealand including mortality [1, 2] and morbidity [3, 4] and a health policy context that emphasizes a need to reduce inequalities in health outcomes [5]. Disparities exist in risks for ill health because of the different distribution of the determinants of health including access to social, economic and cultural resources [1]. Social statistics in New Zealand show that people of European ethnicity are on average relatively advantaged in socioeconomic and health terms compared with Māori or Pacific people [1, 6]. The international context is one where ethnicity differences in mental health outcomes are recognized both between and within countries [7, 8].
Māori mental health has been identified as a priority area [2, 9, 10]. Concerns are in part based on observations of increasing Māori hospitalization rates for psychiatric disorders over recent decades [10] and by increases in suicide rates, particularly among young Māori [11, 12].
Previous analyses showed relatively low rates of hospitalization for mental disorder among Pacific people [13]. A more recent report showed low rates of mental health service use overall. However, Pacific people's use of forensic services and inpatient length of stay were high [14]. Thus, mental health policy has been developed amid concern for growing patterns of mental health service use mixed with a belief that the prevalence of mental illness is generally low among Pacific people [14].
This paper first compares the 12 month prevalence of any mental disorder, serious disorder and disorder groups within the NZMHS by ethnicity. Second, the paper presents ethnic comparisons for the percentages making any visit for a mental health problem in the past 12 months, among those with disorder in that period.
For each outcome, a sequence of comparisons is presented. The first comparison is unadjusted. For prevalence, this shows the actual situation or burden experienced by each ethnic group. For visits, it shows the percentage making any contact with services. The second comparison adjusts for age and sex. The third comparison further adjusts for socioeconomic correlates. Adjustment investigates the question, ‘Would there be differences in outcomes between Other, Pacific and Māori, if the ethnic groups had the same age, sex, education and income distributions?’.
Method
Sample
The NZMHS was a nationally representative household survey of people aged 16 years and over using face-to-face interviews undertaken between October 2003 and December 2004. Ethnicity was determined using the ethnicity question from the 2001 census. This question asks respondents to identify the ethnic group(s) they belong to, allowing multiple ethnicities to be reported. The Statistics New Zealand prioritization rule for ethnicity assignment was followed. This rule classifies those who identify solely as Māori and those who identify Māori as one of their ethnic groups (when there are more than one) as Māori. Those who self-identify as any Pacific Island group, but not Māori, are defined as Pacific. Those who are not Māori nor Pacific are combined into a composite Other group.
In 2001, Māori were 11.2%, Pacific people 4.5% and non-Māori non-Pacific people 84.3% of the New Zealand population aged 16 years and over. To achieve precise estimates, the Māori and Pacific populations were oversampled relative to their proportions within the population using a mixture of targeting and screening. This doubled the number of Māori and quadrupled the number of Pacific people. The total sample consisted of 12 992 completed interviews: 2595 (20.0%) Māori, 2236 (17.2%) Pacific (138 reported both Māori and Pacific ethnicity and were counted as Māori under prioritization rules) and 8161 (62.8%) Other.
The overall response rate was 73.3%. There is no straightforward way to calculate an ethnic specific response rate. Although ethnicity was known for everyone interviewed, ethnicity was not known for nonparticipants in the High Pacific Stratum or the General Stratum main sample. Even in screened households in the General Stratum, ethnicity was not known if there was no contact with a household. Therefore, while the numerator for ethnic specific response rates was known, the denominator was not known.
The interview consisted of two parts. Part 1 included core diagnostic sections and sections on suicidal behaviour, health services use and demographics and was administered to everyone (n = 12 992). Part 2 consisted of additional diagnostic sections and other measures of mental and physical health and was administered to a subsample (n = 7435). All participants who met certain criteria in the Part 1 diagnostic sections received the long form of the interview. A probability subsample of other participants also received the long form [15, figure 1]. Survey methods are detailed elsewhere [15, 16].
Diagnostic assessment
The interview included diagnostic sections from version 15 of the World Mental Health (WMH) Survey Initiative version of the Composite International Diagnostic Interview (WMH-CIDI) [17], the CIDI 3.0. This is a fully structured lay interview that generates diagnoses according to ICD-10 [18] and DSM-IV [19]. Only DSM-IV diagnoses are reported here. The CIDI 3.0 asks if symptoms have ever occurred and then asks about recency. Twelve-month disorder is diagnosed if full criteria for disorder have ever been met and there have been symptoms or an episode in the past 12 months. Full criteria may not have been met in the past 12 months.
The disorders groups measured include:
Anxiety disorders: panic disorder, agoraphobia without panic, specific phobia, social phobia, generalized anxiety disorder, posttraumatic stress disorder, obsessive-compulsive disorder
Mood disorders: major depressive disorder, dysthymia, bipolar disorder (I, II, and any with mania or hypomania)
Substance use disorders: alcohol abuse, alcohol dependence, drug abuse, drug dependence, and within drug disorders
Eating disorders: anorexia, bulimia
Severity
Severity for a case was based on all disorders experienced in the past 12 months. Definitions used in New Zealand were those developed for the first WMH cross-national paper [20] except for substance dependence for which the National Comorbidity Survey Replication [21] definition was used [15]. Participants were classified with serious disorder if one of the following occurred in the past 12 months: an episode of bipolar I disorder, substance dependence with serious role impairment (two effects experienced ‘a lot’), a suicide attempt and any WMHCIDI/ DSM-IV disorder, at least two areas of severe role impairment because of a mental disorder in the Sheehan Disability Scale domains, overall functional impairment at a level found in the National Comorbidity Survey Replication to be consistent with a Global Assessment of Functioning [22] score of 50 or less in conjunction with a WMHCIDI/ DSM-IV disorder. Participants with disorder who were not classified as serious were classified as moderate if interference was reported as at least moderate in any Sheehan Disability Scale domain or if they had substance dependence without substantial impairment. All other participants with disorder were classified as mild.
Health sectors
In the health services section, participants were asked if they had ever seen any of the listed professionals for a mental health reason (‘for help with your emotions, nerves, mental health, or problems with alcohol or drugs’) or had sought help in other ways such as through helplines or self-help groups. At the end of each diagnostic section, participants were also asked about treatment contact. For this paper, services sectors were placed in three nested categories:
Mental health specialist sector: psychiatrist, psychologist or other non-psychiatrist mental health professional; social worker or counsellor in a mental health specialty setting; helpline; or overnight admissions for mental health or drug or alcohol problems
Health sector: the mental health specialist sector plus the general medical sector (general practitioner, other medical doctor, general nurse, occupational therapist or any health-care professional)
Total services sector: the health sector plus the non-health sector, which included the human services sector (religious or spiritual advisor or social worker or counsellor in any setting other than a specialty mental health setting) and the complementary or alternative medicine sector (any other type of healer such as a herbalist or homeopath, participation in an Internet support group or participation in a self-help group)
Reports of visits for mental health problems in the past 12 months were classified as any mental health sector visit, any health sector visit and any visit.
Correlates
Sociodemographic correlates include age at interview, sex, prioritized ethnicity, educational qualifications and equivalized household income. Educational qualifications were assessed using 2001 census questions about school and post-school qualifications. Household income was missing for 13.0% of respondents and was imputed by linear regression. A modification of the revised Jensen equivalence scale for household income [23] was used to take account of the number of adults and the number of children in the household.
Analyses
Data were weighted to account for different probabilities of selection that arose from oversampling Māori and Pacific people and the selection of one person per household, differential non-response, and residual differences in age, sex and ethnicity between the sample and the 2001 census population. Additional weights were used to account for selection into the long-form sections of the interview. Logistic regression analyses were carried out in SUDAAN 9.0.1, which takes account of the complex sample design.
Ethnic comparisons are reported in tables as predictive margins [24, 25]. Predictive margins [25], also called adjusted percents [26], are used to present results from models.
Results
Sociodemographic correlates
The distribution of sociodemographic correlates within each ethnic group is shown in Table 1.
Sociodemographic distributions within each prioritized ethnic group (%)
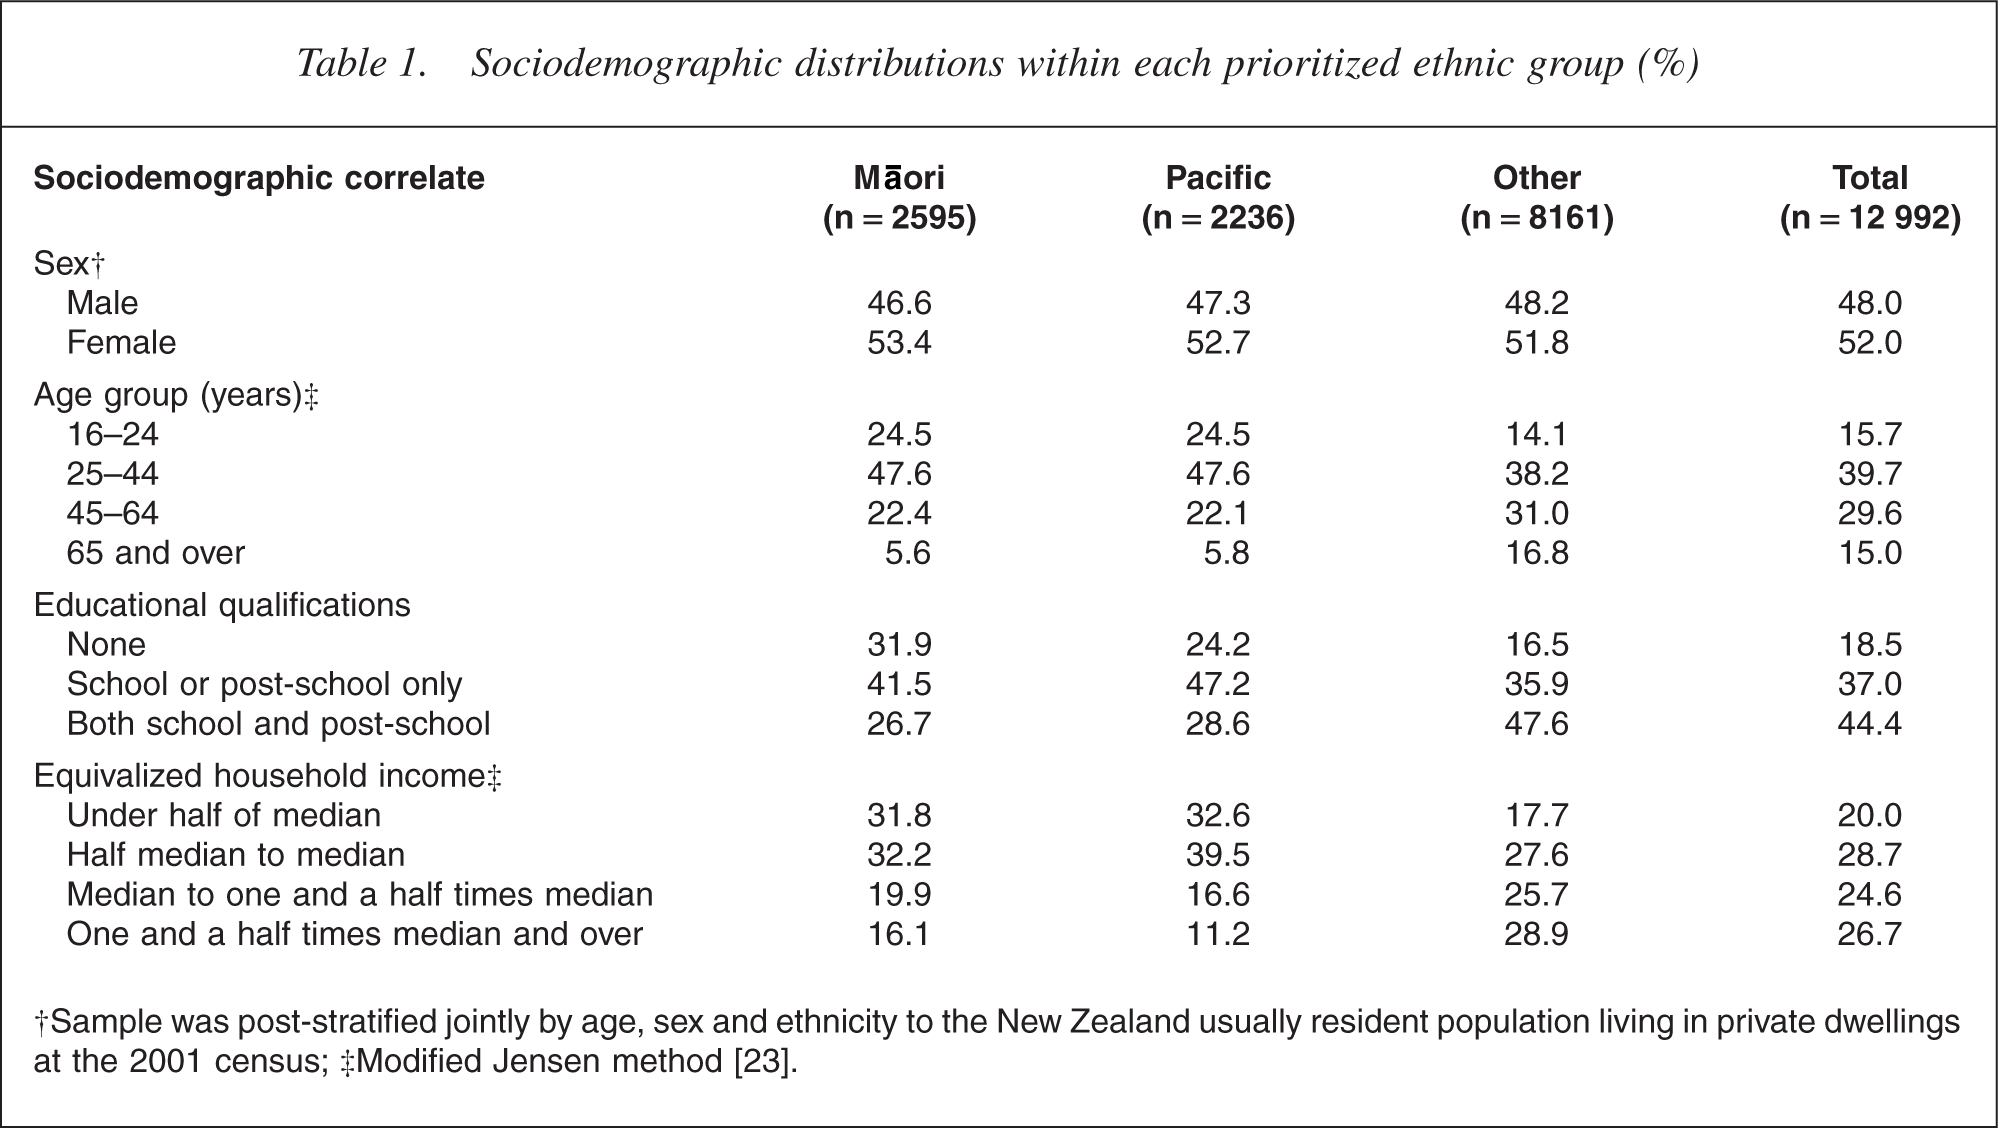
†Sample was post-stratified jointly by age, sex and ethnicity to the New Zealand usually resident population living in private dwellings at the 2001 census; ‡Modified Jensen method [23].
The proportion of females was similar across the three ethnic groups. However, ethnic groups differed in age, education and income. Māori and Pacific people tended to be younger than the Other group, who were more likely to have educational qualifications and higher equivalized household incomes.
Prevalence of 12 month disorder and serious disorder
To determine how much ethnic differences in sociodemographic population characteristics contribute to ethnic differences in the prevalence of disorder, adjustment was carried out for age, sex and some socioeconomic correlates. Table 2 (any 12 month disorder and any serious disorder) and Table 3 (disorder groups and specific disorders) present ethnic comparisons of 12 month prevalence.
Prioritized ethnicity and 12 month prevalence of any disorder and serious disorder†
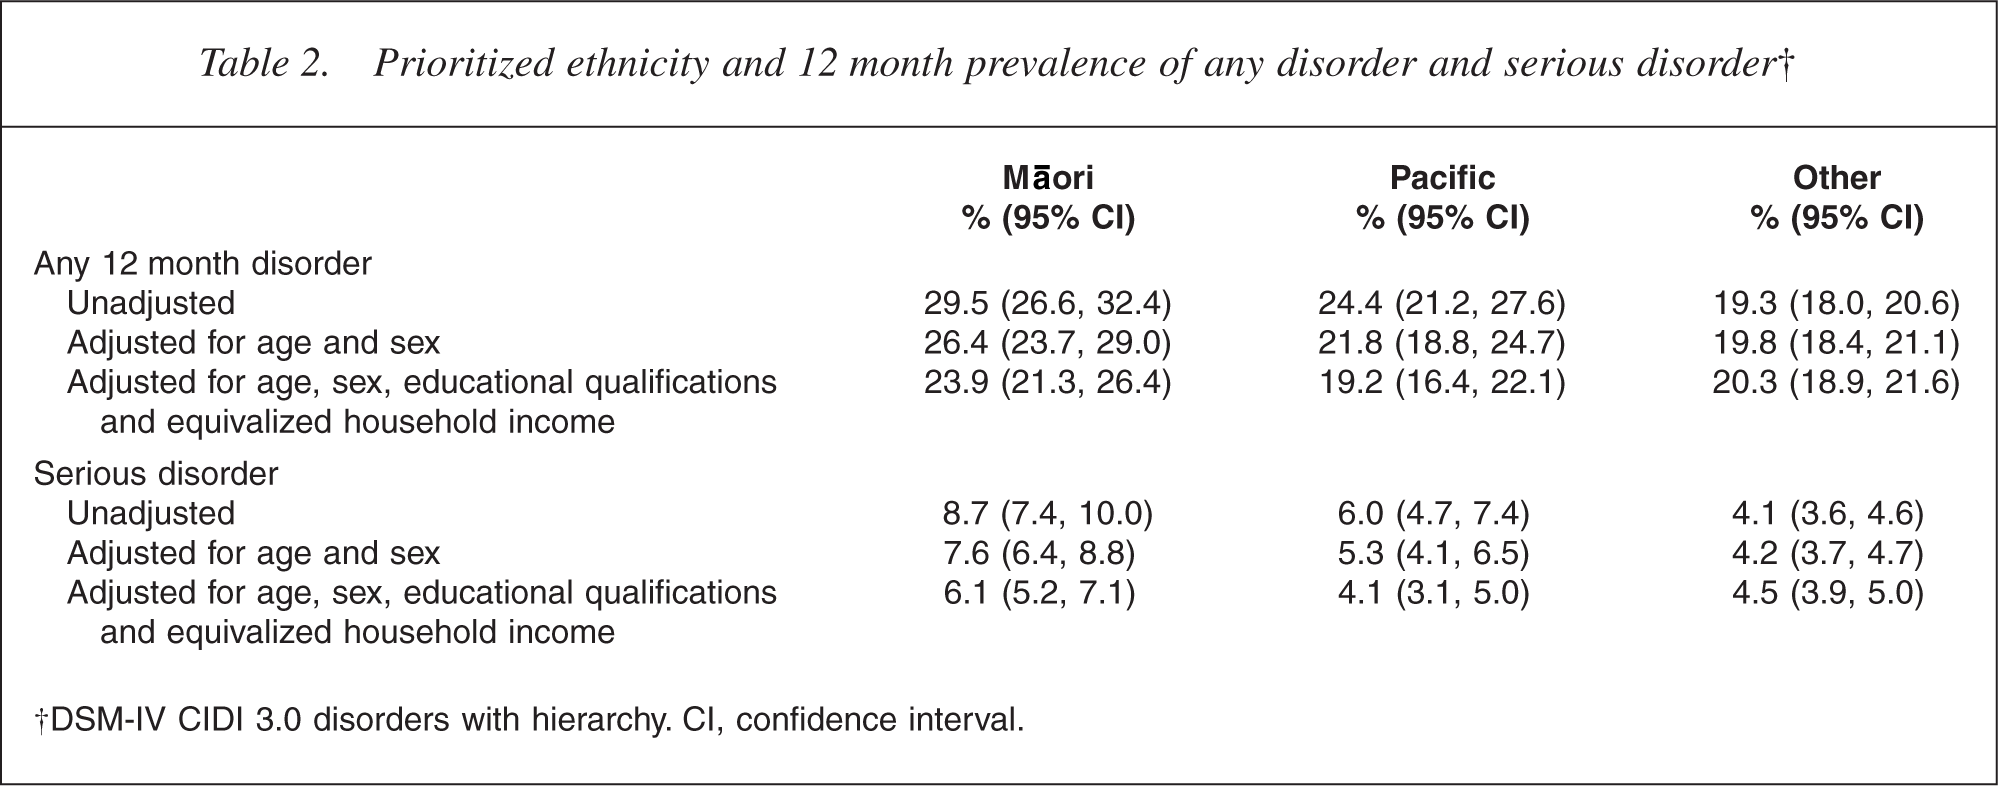
†DSM-IV CIDI 3.0 disorders with hierarchy. CI, confidence interval.
Prioritized ethnicity and 12 month prevalence of specific disorders or disorder groups†
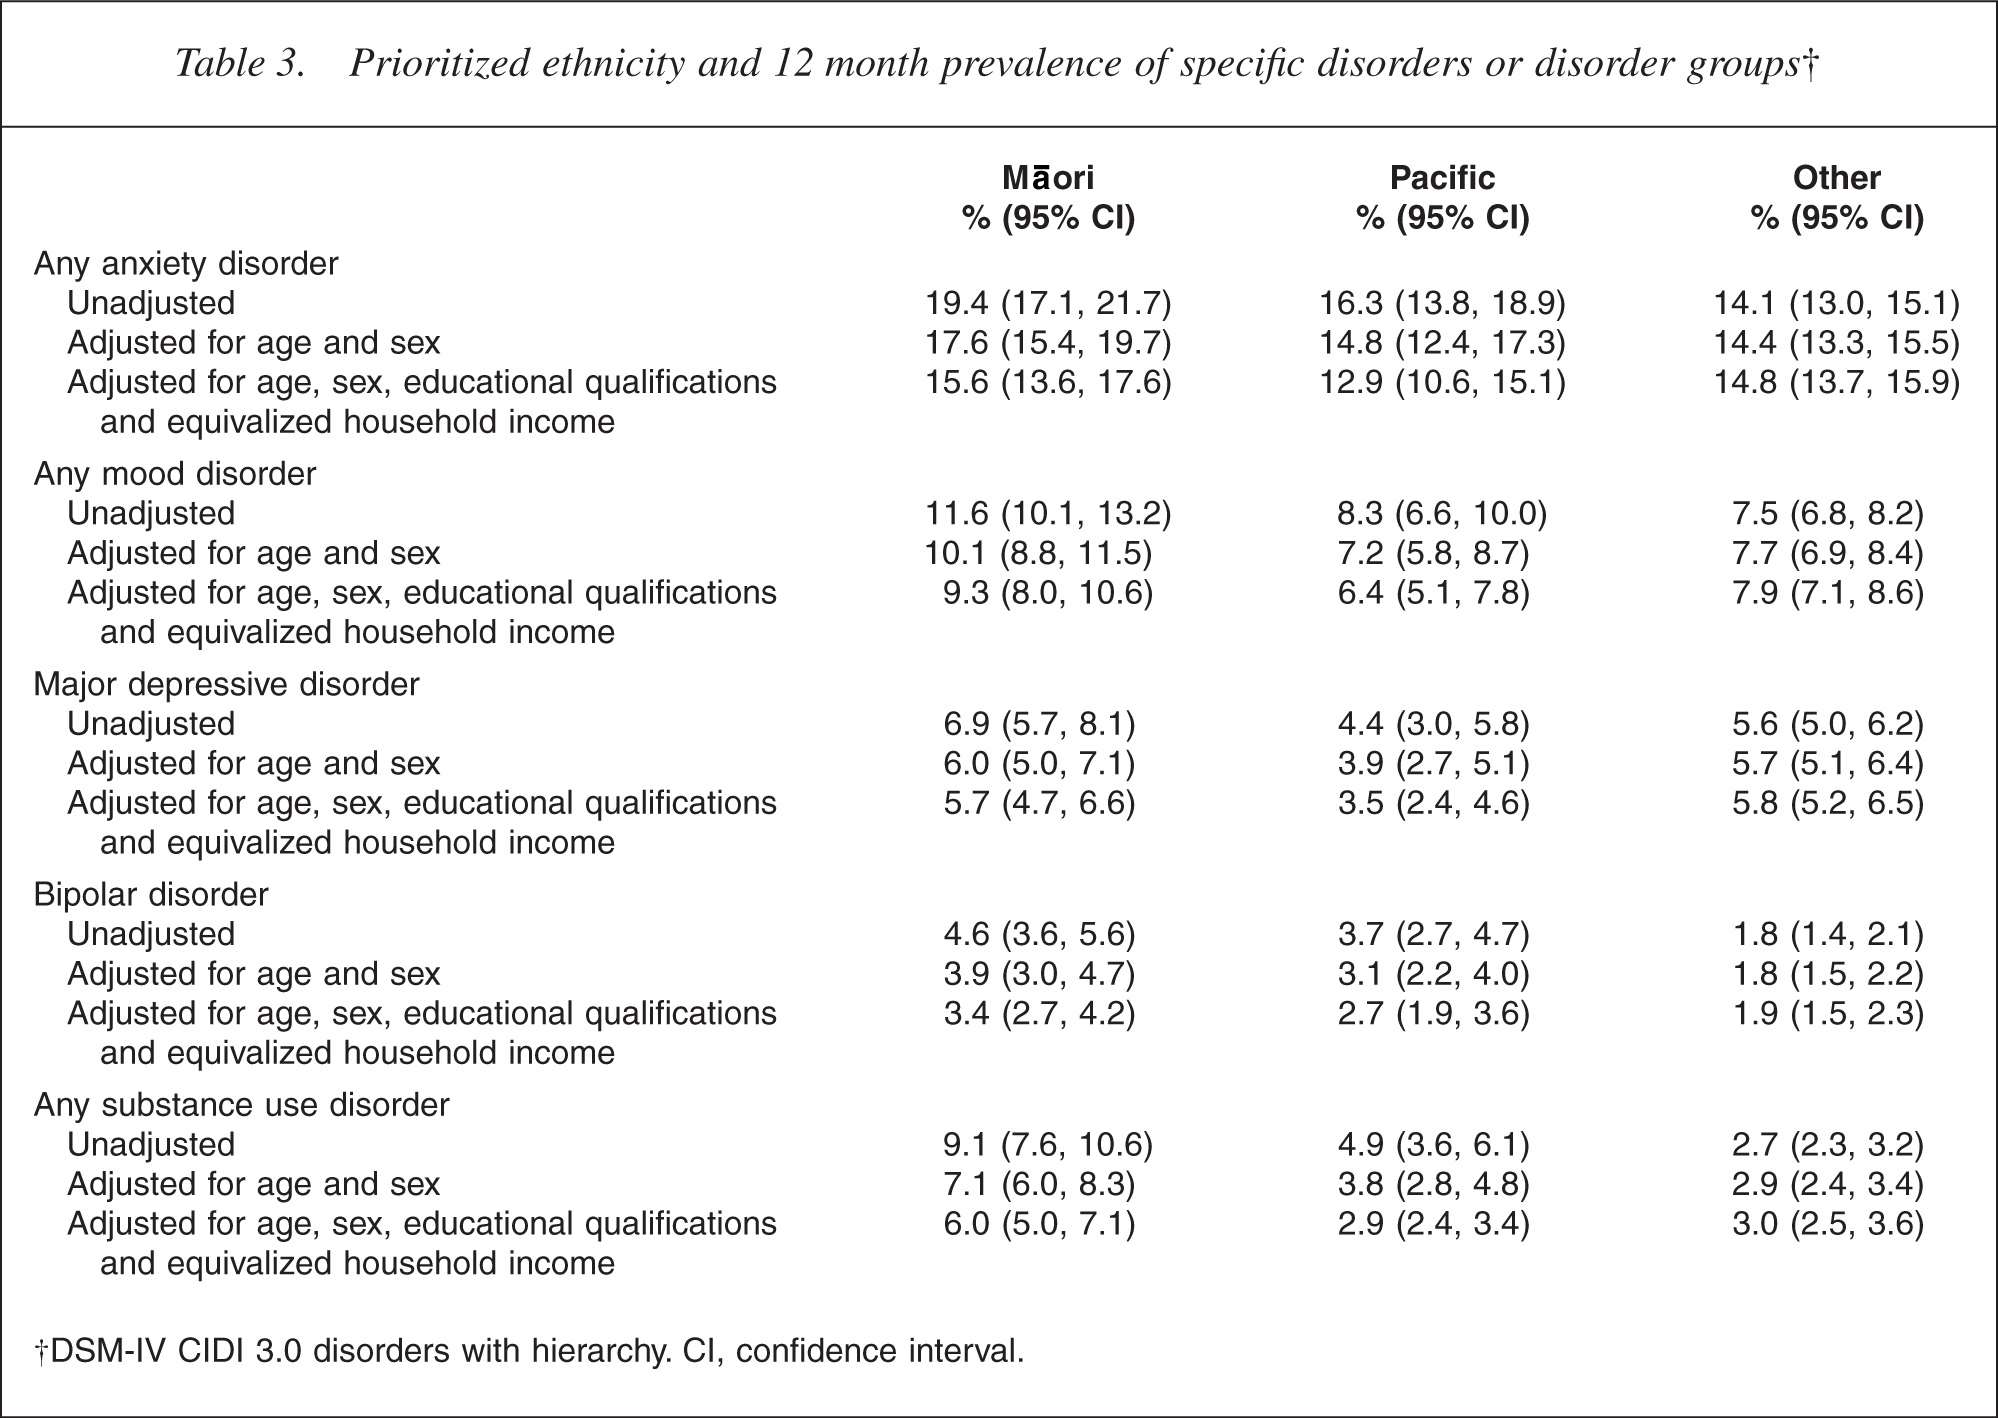
†DSM-IV CIDI 3.0 disorders with hierarchy. CI, confidence interval.
Unadjusted, the prevalence of any 12 month disorder was highest for Māori (29.5%), followed by the Pacific (24.4%) and Other (19.3%) groups. For serious disorder, the prevalence was highest among Māori (8.7%), then Pacific (6.0%) and Other (4.1%). Adjustment of both 12 month prevalence and serious disorder for age, sex, education and household income reduced the differences between ethnic groups, although differences remained significant for Māori compared with Others for any disorder (23.9% vs 20.3%%, p = 0.003) and any serious disorder (6.1% vs 4.5%, p = 0.003).
Pacific people had a higher prevalence of any disorder (24.4% vs 19.3%, p = 0.0004) and serious disorder (5.3% vs 4.2%, p = 0.007) compared with Others. Adjustment for age and sex alone reduced all differences to non-significance and after further adjustment for education and income, the prevalence for Pacific people was nonsignificantly lower than that for Others.
For all disorder groups presented in Table 3, the pattern for unadjusted prevalences was for Māori to have the highest prevalence, for Pacific people to have intermediate prevalence and for the Other group to have the lowest prevalence. For disorder groups, the increased prevalence of disorder for Māori, compared with Others, ranged from a threefold higher prevalence for substance use disorders (9.1% vs 2.7%, p < 0.0001) to a 38% higher prevalence of anxiety disorder (19.4% vs 14.1% (p < 0.0001). Eating disorders are not presented because the prevalence (0.5%) of this disorder group was too low for the sequence of adjustments.
When comparing Māori and Other group, adjustment for age and sex reduced differences. However, higher Māori rates for substance use disorder (7.1% vs 2.9%, p < 0.0001) and anxiety disorder (17.6% vs 14.4%, p = 0.009) remained. Additional adjustment for educational qualifications and equivalized household income further reduced the prevalences. However, a twofold higher prevalence of substance disorders (6.0% vs 3.0%, p < 0.0001) among Māori remained. Difference in mood disorders was only marginally significant (9.3% vs 7.9%, p = 0.06) and that for anxiety disorder was a non-significant 5% increase (15.6% vs 14.8%, p = 0.48).
Pacific and Other differences were not significant for anxiety disorders (p = 0.12) or mood (p = 0.37), although the prevalence of substance disorder was 82% higher (4.9% vs 2.7%, p = 0.003). Adjustment for age and sex alone reduced all differences between Pacific and Other to non-significance. After further adjustment for education and income, the prevalence for Pacific people was non-significantly lower than that for Others for anxiety disorder (12.9% vs 14.8%, p = 0.14) and marginally lower for mood disorder (6.4% vs 7.9%, p = 0.06).
The comparisons for mood disorders combined concealed quite different patterns for bipolar disorder and major depressive disorder. Table 3 shows that for major depressive disorder Māori had marginally higher unadjusted prevalence than Others (6.9% vs 5.6%, p = 0.06), with the same prevalence after adjustment (5.7% vs 5.8%, p = 0.75). Pacific people had a non-significantly lower prevalence of disorder than Others (4.4% vs 5.6%, p = 0.11), but had a significantly lower prevalence (3.5% vs 5.8%, p = 0.0001) after adjustment. In contrast, the pattern for bipolar disorder was for Māori to have the highest prevalence, for Pacific people to have an intermediate prevalence and for Others to have the lowest prevalence. This pattern was present unadjusted and adjusted (Pacific compared with Others, p = 0.06; Māori compared with Others, p = 0.0006).
For Māori-Pacific comparisons across measures in Tables 2 and 3, Māori had higher prevalence. Findings were not significant for bipolar disorder (p ≥ 0.20) and were not quite significant for anxiety disorders (p ≤ 0.08), but were most marked for substance disorders (p < 0.0001). The magnitude of the differences between Māori and Pacific people was little affected by adjustment as the populations were similar on sociodemographic correlates.
Twelve-month mental health visits
A mental health visit is a visit for mental health problems (as described in the Method section). It is defined by the reason for the visit, not the sector visited. Table 4 presents a sequence of conditional percents, that is, for those with a 12 month disorder: (i) the percentage making any mental health visit; (ii) the percentage of those who made any mental health visit who made a health sector visit; and (iii) the percentage of those who made a health sector visit who made a mental health sector visit.
Prioritized ethnicity and 12 month service use in people with 12 month disorder†
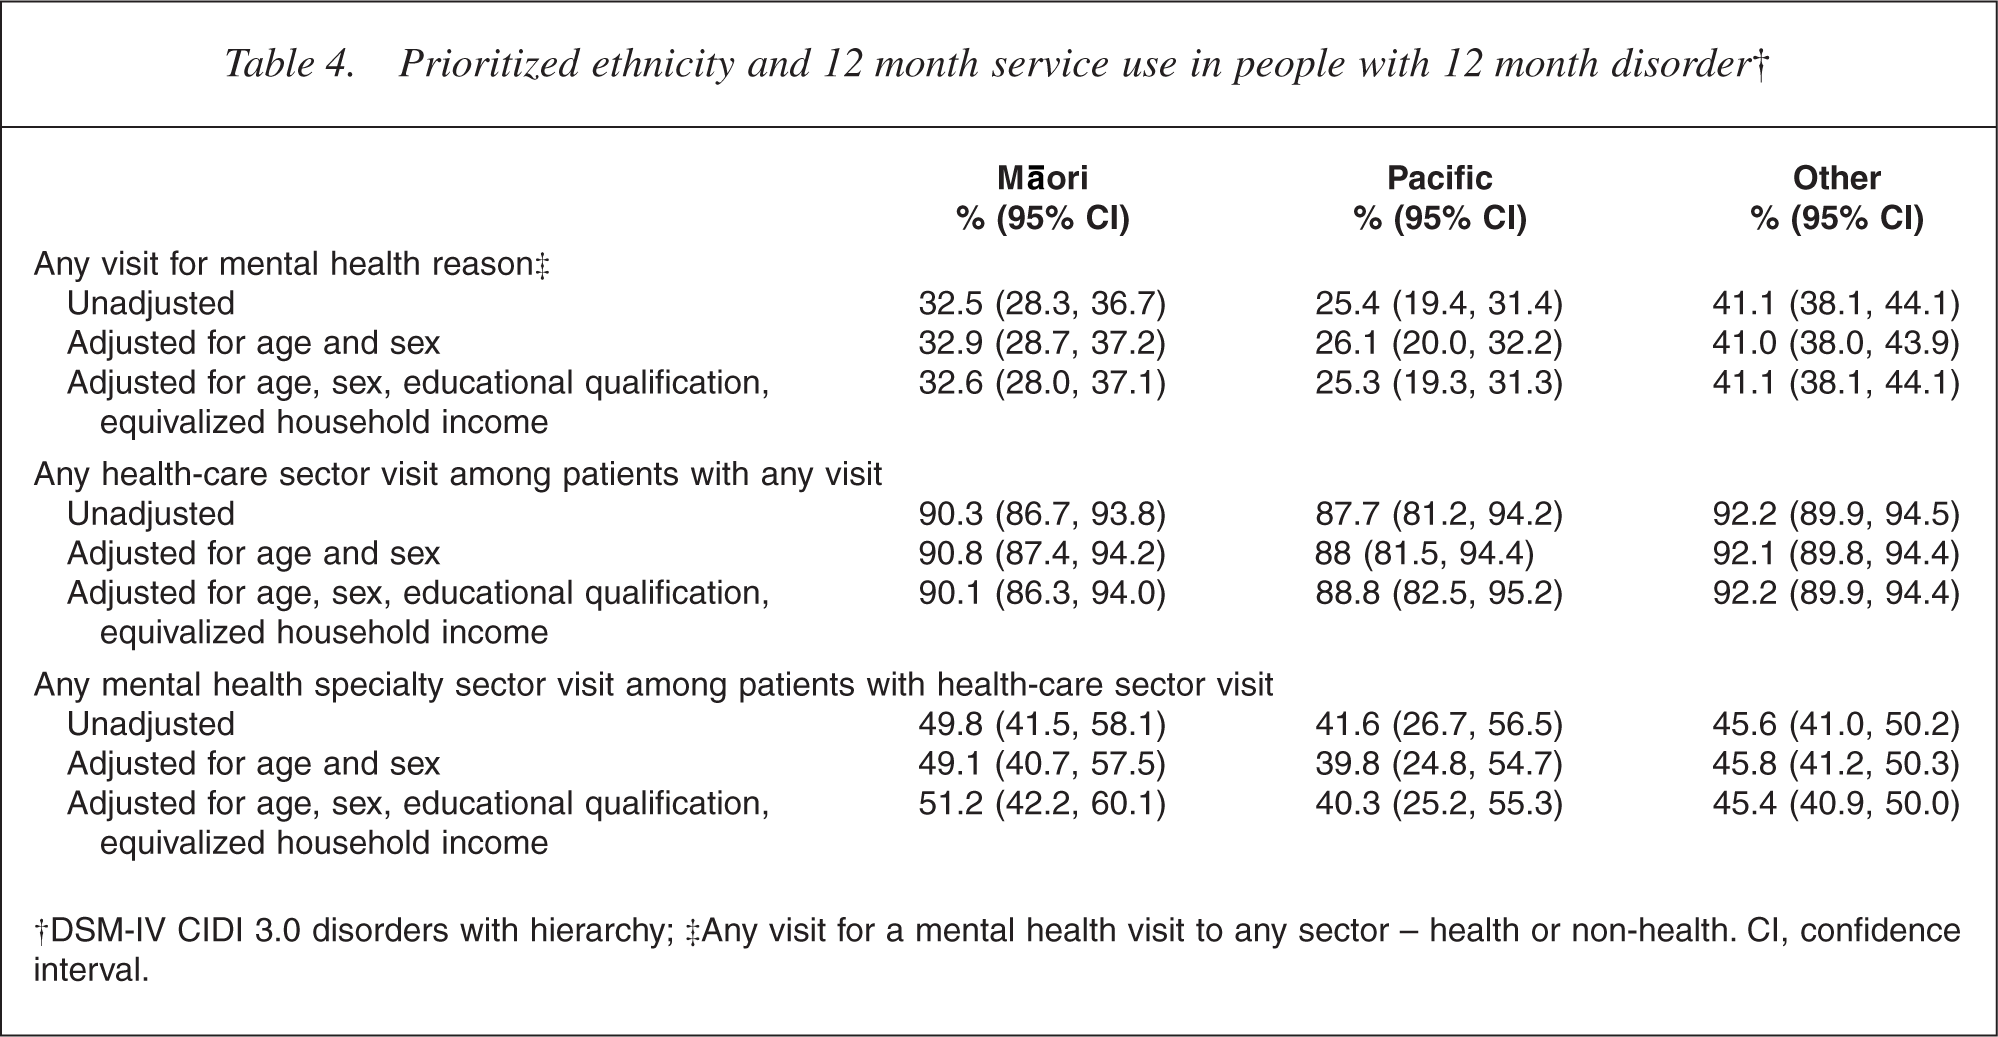
†DSM-IV CIDI 3.0 disorders with hierarchy; ‡Any visit for a mental health visit to any sector – health or non-health. CI, confidence interval.
For any visit for a mental health reason (among those with a 12 month disorder), there were differences across the three ethnic groups (p < 0.0001 overall). Without adjustment, 25.4% of Pacific people with a 12 month disorder made any mental health visit compared with 32.5% of Māori and 41.1% of the Other ethnic group. Both Māori and Pacific people had lower percentages with visits than Others (p < 0.0009) and, while Pacific people had lower percentages of visits than Māori, this difference was not quite significant (p = 0.06). Adjustment by age and sex, or by age, sex, educational qualification and equivalized household income, leads to minimal change in these percentages and the significance of the difference between them.
Among those who made any visit for a mental health reason, no significant ethnic differences existed in the percentage with a health sector visit (Māori 90.3%, Pacific 87.7%, Other 92.2%; p ≥ 0.31), nor in the percentage with a mental health speciality visit among those with a health-care visit (Māori 49.8%, Pacific 41.6%, Other 45.6%; p ≥ 0.38). This indicates that comparatively smaller proportions of Māori or Pacific people are making any visits for mental health reasons. However, there are no ethnic differences in where visits are made.
Severity of disorder and service contact
It is of particular concern if someone with serious disorder does not receive effective assessment and treatment. Table 5 presents ethnic comparisons for any mental health visit by severity of disorder in the past 12 months. At each level of severity, those in the composite Other group are more likely to have a mental health visit than Māori or Pacific people. For Māori relative to Others, the magnitude of the absolute difference is largest for serious disorder and small and non-significant for those with no disorder. However, the relative proportion is around 75% at each level and there are no interactions in the logistic regression model (p ≥ 0.24). Pacific people with no disorder or mild or moderate disorder are very similar to Māori, but for serious disorder Pacific people are less likely than Māori (30.3% vs 51.5%) and less than half as likely as Others (66.1%) to have a health sector visit. This departure from the pattern at other levels of severity is large enough to produce a significant overall interaction between ethnicity and severity (p = 0.03) and is very significant for the specific term for Pacific people with serious disorder (p = 0.0007). Māori and Pacific people are less likely than Others to make a mental health visit, but this is particularly so for Pacific people with serious disorder.
Prioritized ethnicity and percentage making a mental health visit in the past 12 months by severity
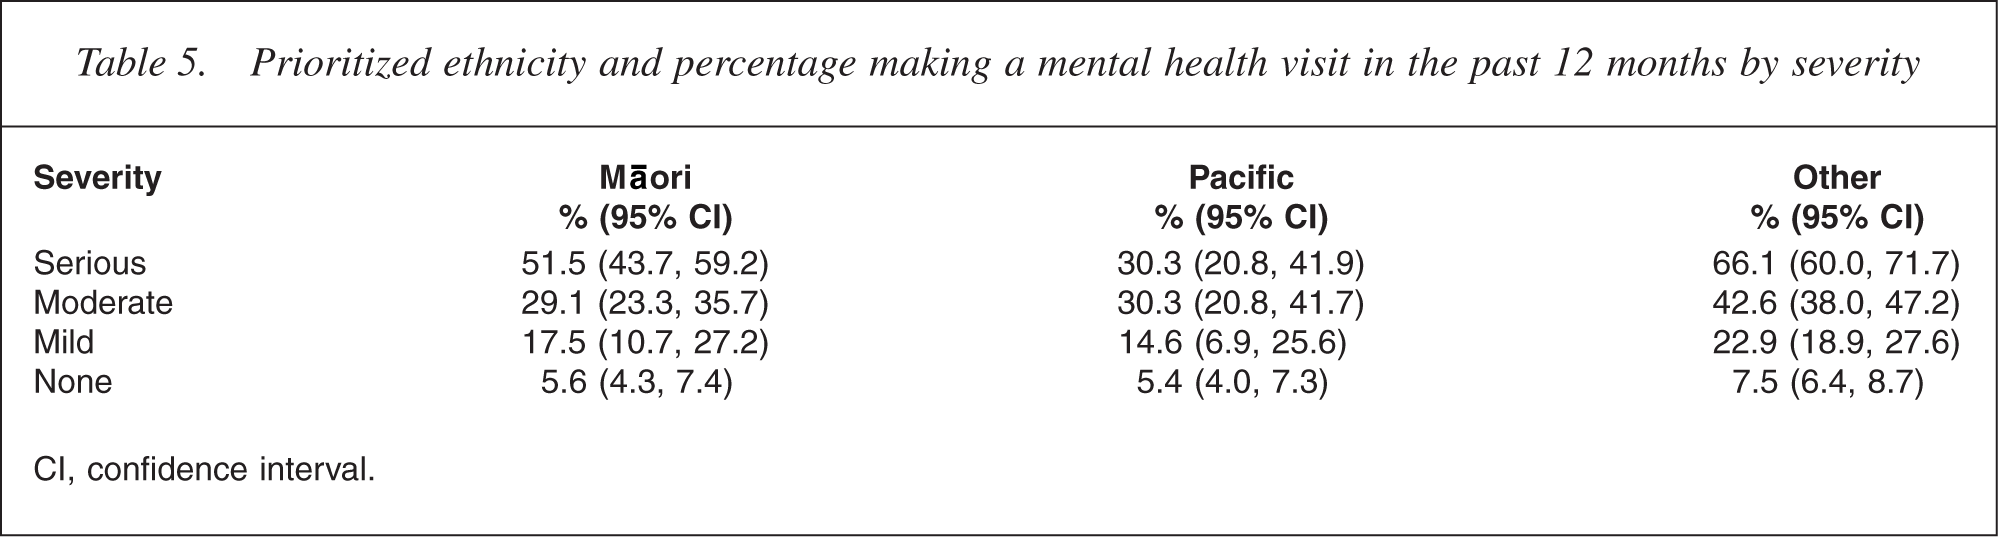
CI, confidence interval.
Discussion
The NZMHS is the first New Zealand survey to measure the prevalence of mental disorders in representative populations of Māori and Pacific adults. Ensuring suffi-cient numbers of Māori and Pacific participants has been important in achieving reasonably precise estimates.
Findings are consistent with concerns about ethnic differences in mental health. Unadjusted findings for 12 month prevalence and for serious disorder show Māori with the highest prevalence followed by Pacific, then Other ethnic group. Unadjusted findings highlight the extent to which mental health impacts on each population group. The NZMHS findings suggest that a higher health burden as a result of mental disorder is experienced by Māori, followed by Pacific, then Others.
Adjustment for age and sex partially explained some differences, and education and household income further reduced differences overall and within specific disorders, reducing all and eliminating some ethnic differences. These findings indicate that demographic and economic factors contribute strongly to ethnicity differences. Adjustment accounts for most differences between Pacific people and Others, except for bipolar disorder, where Pacific rates are higher, and major depressive disorder where Pacific rates are lower. For Māori, compared with Others, differences in the prevalences of substance disorders and bipolar disorder in particular remained following adjustment, as did small but significant differences for any 12 month disorder and serious disorder. No significant differences existed after adjustment for anxiety disorders.
These findings have some consistency with findings for differences in mortality found between Māori and non-Māori non-Pacific people [27]. Research into ethnic mortality differences from 1981 to 1999 found socioeconomic factors explained around half of the overall mortality difference between Māori and non-Māori non-Pacific populations [27]. Possible explanations for ethnic mortality differences, in addition to socioeconomic factors, included bluntness in measures used to adjust for socioeconomic status, ethnic differences in access to and quality of health services (both preventive and treatment), lifestyle risks, psychosocial stress and the impact of racial discrimination [27]. Research in the UK investigating the relationship between the risk of psychosis, common mental disorder and indicators of racism among ethnic minority groups found that experience of racism and perceiving racism in the wider society had effects on the risk of common mental disorders and psychosis, after controlling for age, gender and socioeconomic status [28]. As yet, there is little information on how these factors may impact on mental health in New Zealand and further research is required to further understand reasons for ethnic differences in mental health.
Findings for service visits for mental health reasons in those with disorder indicate comparatively smaller proportions of Pacific people and, to a lesser extent, Māori making visits to any service for mental health reasons compared with Others. These findings were not changed by adjustment for sociodemographic correlates. In addition, lower rates were experienced within each level of severity, suggesting higher levels of unmet need among Pacific people and Māori compared with Others. Again, these differences are not explained by the sociodemographic correlates adjusted for in this study.
Reduced access to and utilization of services, especially by those Māori and Pacific people with serious mental disorders, have significant implications for the health and mental health sector. Pacific people's use of mental health services has been documented as being low and many have assumed this to be a result of low prevalence of mental illness among Pacific people [14]. The NZMHS has shown that this is not the case. While the higher prevalence of mental disorders among Pacific people is largely explained by demographic and economic factors, underutilization of health services by Pacific people remains, particularly by those with serious mental disorders. Further analyses will investigate the reasons given by Pacific people for not making visits to services to address mental health problems. This will inform planning for health services and strategies for increasing access to and use of services.
There are some limitations in this study for undertaking ethnicity comparisons. Among cultural psychiatry and psychology literature, the use of standardized diagnostic measures across differing cultures has been critiqued, with some challenging the capacity for such measures to meaningfully measure mental disorders among different cultural groups [29]. Others have argued that tools may be meaningfully used across cultural groups [30]. Māori and Pacific research teams have worked alongside the total research team to maintain the cultural integrity of the processes of the research and the impact of specific issues such as language.
Overall, these findings have implications for mental health policy-makers, service planners and providers, spanning mental health promotion, prevention, and the primary and secondary care sectors. Improved knowledge of ethnic differences in the prevalence and pattern of mental disorders provides a foundation on which to address ethnic disparities and meet mental health needs. Many questions remain about the reasons for ethnic disparities in prevalence, severity and service contact. Further investigation into appropriate and effective intervention strategies and practices for increasing access to, and the utilization and effectiveness of services for Māori and Pacific people with mental health needs is required.
Footnotes
Acknowledgements
Te Rau Hinengaro: The New Zealand Mental Health Survey was funded by the Ministry of Health, Alcohol Advisory Council and Health Research Council of New Zealand. The survey was carried out in conjunction with the World Health Organization World Mental Health (WMH) Survey Initiative. We thank the WMH staff for assistance with instrumentation, fieldwork and data analysis. These activities were supported by the US National Institute of Mental Health (R01MH070884), the John D and Catherine T MacArthur Foundation, the Pfizer Foundation, the US Public Health Service (R13-MH066849, R01-MH069864, and R01 DA016558), the Fogarty International Center (FIRCA R01-TW006481), the Pan American Health Organization, Eli Lilly and Company, Ortho-McNeil Pharmaceutical, Inc, GlaxoSmithKline, and Bristol-Myers Squibb. The WMH publications are listed at ![]() .
.
Other members of the NZMHS Research Team are KM Scott, TK Kingi, R Tapsell, S Foliaki, D Schaaf, MH Durie, C Tukuitonga and C Gale.
We thank the Kaitiaki Group and Pacific Advisory Group for their input and support for this survey and we thank all the participants.