
Abstract
Background:
Brain-computer interfaces (BCIs) have gained considerable attention for their potential in assisting individuals who have motor impairments with communication and rehabilitation. Among BCIs, steady-state visual evoked potential (SSVEP)-based systems have demonstrated high efficiency in interactive applications. However, ergonomic design challenges have limited their practical implementation in industrial settings. Issues such as visual and mental fatigue caused by flickering stimuli and the time-consuming preparation process hinder user adoption of such systems.
Methods:
To evaluate these BCI solutions, we introduced an open database comprising Electroencephalogram (EEG) data collected from 59 healthy volunteers using ergonomically designed semi-dry electrodes and grid stimuli. The database was acquired without electromagnetic shielding, and the preparation time for each participant was <5 min. A 40-target SSVEP speller system with cues was used in the experiment.
Results:
We validate the database by temporal and spectral analyzing methods. To further investigate the database, filter bank canonical correlation analysis (FBCCA), ensemble task-related component analysis (e-TRCA) and multi-stimulus task-related component analysis (msTRCA) were used for classification. The database can be downloaded from the following link: https://drive.google.com/drive/folders/1TXuxU863nZoniZRgNWZy0PRuL8lhBuP4?usp=sharing.
Conclusions:
This research contributes to enhancing the use of SSVEP-based BCIs in practical settings by addressing user experience and system design challenges. The proposed user-friendly visual stimuli and ergonomic electrode design improve comfort and usability. The open dataset serves as a valuable resource for future studies, enabling the development of robust and efficient SSVEP- BCI systems suitable for industrial applications.
Keywords
1 Introduction
In recent years, brain-computer interfaces (BCIs) have attracted considerable attention, with potential in rehabilitation applications. They provide an alternative method for older or physically disabled individuals to restore parts of communication and motor abilities [1]. BCIs may be the only solution for complete locked-in syndrome [2]. Among various BCI paradigms, steady-state visual evoked potential (SSVEP)-based BCIs have the highest efficiency in interactive systems because of their characteristics. Based on the improved frequency recognition methods, the information transfer rate (ITR) of SSVEP- BCIs has remarkably increased to 330.4 ± 45.4 bits/min [3]. Although these SSVEP-BCI systems can achieve good performance with high accuracy and short gazing time, numerous issues outside laboratories limit their practical application in the general population. A major challenge is the ergonomic design of BCI solutions [4]. User preference is influenced by the ease of use, including the user-friendly interface and preparation time before usage. Reactive BCI paradigms such as P300 and SSVEP can cause visual and mental fatigue, especially when the stimuli tends to flicker at high contrast and intensity. Conversely, preparation before using a BCI system and the removal of conductive substances after use are crucial procedures for end users. The preparation time should be substantially reduced, and users should be able to wear BCI headsets themselves.
Visual fatigue may result from a visible flicker stimulus below the critical flicker frequency. A high-frequency flicker (>30 Hz) can be relatively imperceptible and thus may reduce discomfort when users gaze at the stimulus [5]. Chen et al. [6] described an SSVEP-BCI with four commands tagged with frequencies of >30 Hz. The online results indicated an accuracy of 97.75% with a stimulation duration of 2.25 s. Sakurada et al. [7] compared the performance of different stimuli ranging from 30 to 70 Hz and demonstrated that the amplitudes of SSVEPs elicited by higher frequencies decreased markedly. Although the accuracy of the high-frequency condition was 88%, the classification accuracy of the low-frequency condition was significantly higher than that of the high-frequency condition [7]. A high-frequency stimulus also requires a monitor with a high refresh rate or additional device (e.g., LED panel). Another solution to visual fatigue is the attenuation of flicker perception. Zhao et al. [8] presented a new stimulation paradigm known as steady-state peripheral visual evoked potential, which aimed to make full use of peripheral vision and contribute to a comfortable BCI system. Furthermore, reversal checkerboard stimuli showed a decreased flicker perception [9]. A recent study designed a grid stimulus with low and negative contrast, demonstrating comparable performance to the traditional flicker stimulus [10].
Traditionally, EEG is acquired by Ag/AgCl electrodes using conductive gels, and deploying electrodes usually requires professional operation and a long time to clear up after usage. To simplify the preparation process of the BCI system, semi-dry or dry electrodes have been developed. Most dry electrodes adopt a comb or claw structure to penetrate the hair and make contact with the scalp [11–13]. However, the contact impedance of dry electrodes is generally higher than that of wet electrodes, and dry electrodes often cause discomfort due to their pressure on the scalp. A semi-dry electrode combines the advantages of both wet and dry electrodes and often acts as a porous reservoir containing a small amount of electrolyte fluid [14]. Pei et al. [15] designed a PreG electrode composed of a hydrogel material, which was easy to prepare before the experiments. PreG electrodes have been proven to be excellent substitutes for wet electrodes [15].
To date, substantial research has focused on the performance of SSVEP-BCIs outside laboratory conditions. Zhu et al. [16] introduced an open database of SSVEP-BCI with different types of electrodes. Liu et al. [17] introduced a benchmark database obtained from an older population. In this study, we introduced an open database with ergonomically designed semi-dry electrodes and grid stimuli. The database was acquired without electromagnetic shielding, and the preparation time for each participant was <5 min. The EEG data from 60 participants were recorded. However, data collected from one patient were contaminated and thus excluded from the database. The participants performed the experimental task of character spelling using a 40-target SSVEP-BCI speller with cues, which was introduced by Ming et al. [10]. We aimed to explore a practical BCI system that might provide a satisfying experience for BCI users and present a database of adolescents using a standard experimental protocol.
2 Methods
2.1 Participants
In total, 59 healthy volunteers (38 males and 21 females) participated in the Suzhou Junior Competition of Brain-Computer Interface 2022 Olympics in China. The average age of the participants was 12.3 ± 1.3 (mean ± standard deviation; range: 10~16) years. None of them had a history of neuropsychiatric disorders or any other disorders that would affect the experimental results. The participants were naïve BCI users. Written informed consent was obtained from the participants and their parents before the experiment, in which they were informed of the procedures and potential risks associated with the experiments. This study was approved by the Institutional Review Board of Tsinghua University.
2.2 Visual Stimuli
In this study, the particpants were presented with a 40-target SSVEP-BCI speller system. Figure 1 (a) shows the user interface of the system. The interface contains 40 characters (26 English letters, 10 digits, and 4 symbols) and is arranged in a 4 × 10 matrix. During the experiments, a 27-inch LCD monitor (Dell P2719H) with a resolution of 1920 × 1080 pixels was used to present the visual stimuli, and the participants were seated in an armchair 55 cm away from the screen. A single stimulus occupies a square of 164 × 164 (5.4° × 5.4°) pixels, in which a unique grid pattern is incorporated. Each grid pattern consists of flicking dark squares (10 × 10 pixels) arranged in an 8 × 8 matrix with a stationary background, contributing to a spatial frequency of 1.48 cycles/ degree. According to a previous study, the Weber contrast of the darkest squares and background is 0.5, whereas the gray scale of the background is 50% [10].
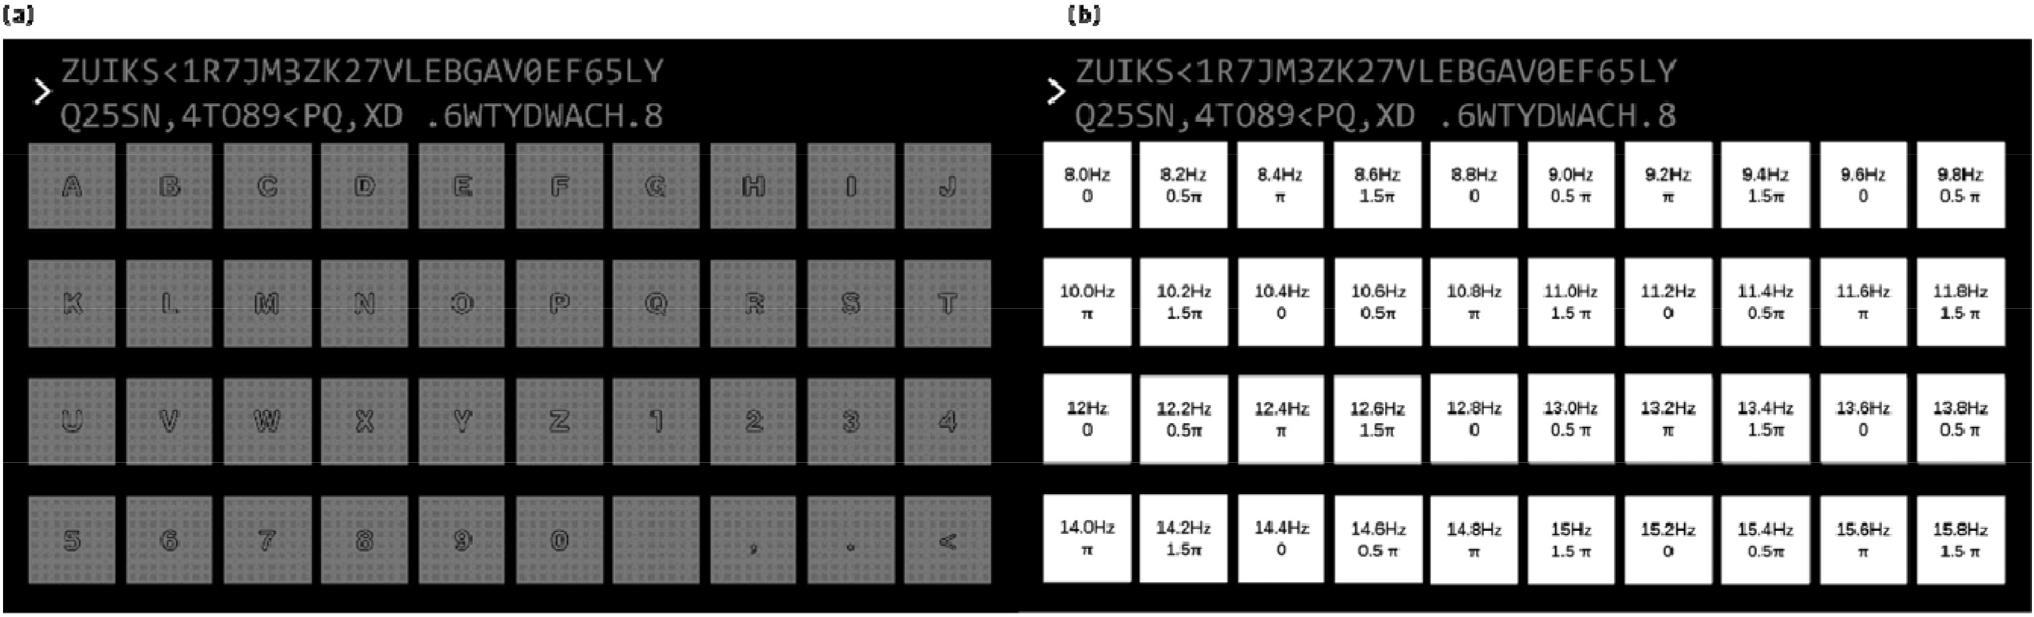
(a) User interface of the SSVEP-BCI online speller. (b) Frequencies and phases of 40 targets.
Visual stimuli were presented using the sampled sinusoidal stimulation method [18, 19]. The stimulus sequence s(f,

where the frequency f and phase
2.3 Procedure
The experiment included four blocks. Each block consisted of 40 trials corresponding to 40 targets in a random order. Each trial began with a 1-s visual cue, indicating the target at which the participant should gaze in the following 4-s stimulation. During stimulation, the targets flickered concurrently. Then, a 1-s visual feedback was provided. The visual cue was presented as an orange arrow pointing to the desired target. When the participant made right or wrong choice, the visual feedback was presented as a green or red frame around the character, respectively, depending on the online processing using the modified filter bank canonical correlation analysis (FBCCA) method [21]. To avoid visual fatigue, the participants could take a break between two consecutive blocks for as much time as they wanted. After the experiment, the participants were asked to complete a questionnaire regarding their feelings about the visual stimuli. The questionnaire included three aspects: comfort level, flicker perception, and preference level [10]. A lower score represented a better user experience.
2.4 Data Acquisition
The 8-channel EEG data were recorded via NeuSenW (Neuracle, Ltd. Changzhou, China) at a sampling rate of 1000 Hz. According to the international 10–20 system [22], eight electrodes around the occipital lobe were selected (POz, PO3, PO4, PO7, PO8, Oz, O1, and O2). The reference electrode was placed on the forehead (Fp1), whereas the ground electrode was placed at Fp2. Pregelled (PreG) electrodes were used during the experiments [15]. Electrode impedances were maintained below 100 kΩ to balance the preparation time and signal quality.
2.5 Data Preprocessing
Data epochs were extracted according to the event markers in the event channel. Each trial included a 5-s long dataset consisting of 0.5-s data before stimulus onset, 4-s EEG responses to the stimulation, and 0.5-s data after stimulus offset. The signals were downsampled to 250 Hz. A 50-Hz notch filter was applied to the EEG recordings to remove the power-line noise.
2.6 Metrics
The quality of the EEG signals was quantified using the signal-to-noise ratio (SNR), which can be defined as the ratio of the spectral amplitude at the stimulus frequency to the mean amplitude of neighboring frequency bands [21].

where
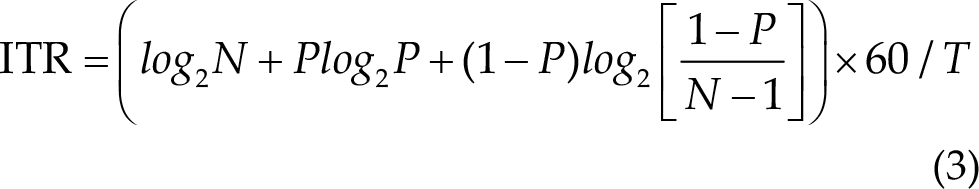
where N is the number of classes, P is the classification accuracy, and T is the average selection time in seconds. ITR is presented in the unit of bits/min. To estimate theoretical ITRs, a gaze shifting time of 0.55 s was added.
3 Data Records
3.1 EEG Data
The dataset is available for free at https://drive.google.com/drive/folders/1TXuxU863nZoniZRgNWZy0PRuL8lhBuP4?usp=sharing. It contains 59 individual MATLAB MAT files named after the participants from S1 to S59. Data were stored as double-precision floating-point values in a matrix named ‘eegdata’ with four dimensions, which indicate the channel index, time points, target index, and block index. The lengths of these dimensions were 8, 1250, 40, and 4, respectively. Each trial included 5-s long data (i.e., 5 s × 250 Hz = 1250 time points) consisting of 0.5-s data before stimulus onset, 4-s EEG responses to the stimulation, and 0.5-s data after stimulus offset. A total of 160 trials, each consisting of 8 channels of 1250-point data, were recorded for each participant. Information regarding the data structure can be obtained from the ‘Readme.txt’ file.
3.2 Electrode Position
The locations of the eight electrodes were saved in a file named ‘8-channels.mat.’ Each electrode’s information comprised 12 fields, including labels, locations in spherical coordinates (theta and radius), locations in Cartesian coordinates (X, Y, and Z), and locations in geographic coordinates (sph_theta, sph_phi, and sph_radius). The channel location file can be used in the topoplot() function of EEGLAB for topographic analysis [24].
3.3 Participant Information
Information regarding the 59 participants was saved in a file named ‘59-subject.mat.’ Each participant’s information comprised four fields, including participant index, sex, age, and handedness.
4 Data Validation
4.1 Temporal, Spectral, and SNR Analysis
To evaluate the data quality, we analyzed the temporal waveform, amplitude spectrum, and SNRs of the dataset. Because of the short length of EEG responses in each trial, the resolution of the amplitude spectrum calculated using fast Fourier transform is insufficient to show the precise values of target frequencies. Therefore, an integer frequency (e.g., 12 Hz) was selected from 40 stimulation frequencies as an example for data analysis. In the temporal analysis, four trials of 12-Hz stimulation from channel Oz were averaged for each participant. Then, the data were band-pass filtered between 7 and 70 Hz and averaged for the participants. Figure 2 (a) shows the temporal waveform of the averaged SSVEP. The red lines indicate the onset and offset of visual stimuli. The waveform is similar to a sinusoidal signal at 12 Hz with a time delay at the stimulation onset. Figure 2 (b) shows the amplitude spectrum of 12-Hz SSVEPs, which was averaged from the amplitude spectra of the trials from all participants. The red circles indicate the values of the amplitudes for the target frequency and its harmonic frequencies. Peaks were observed at 12 and 24 Hz (12 Hz: 1.75 µV, 24 Hz: 0.27 µV). The third or higher harmonic components are not obvious in this figure. Figure 2 (c) shows the averaged SNR of 12-Hz SSVEPs. The bandwidth of the neighboring frequency bands used to calculate the SNR in this study was 2 Hz. Consistent with the amplitude spectrum in Figure 2 (b), only the fundamental and second harmonic components of the SNRs were observed (12 Hz: 9.13 dB, 24 Hz: 3.19 dB).
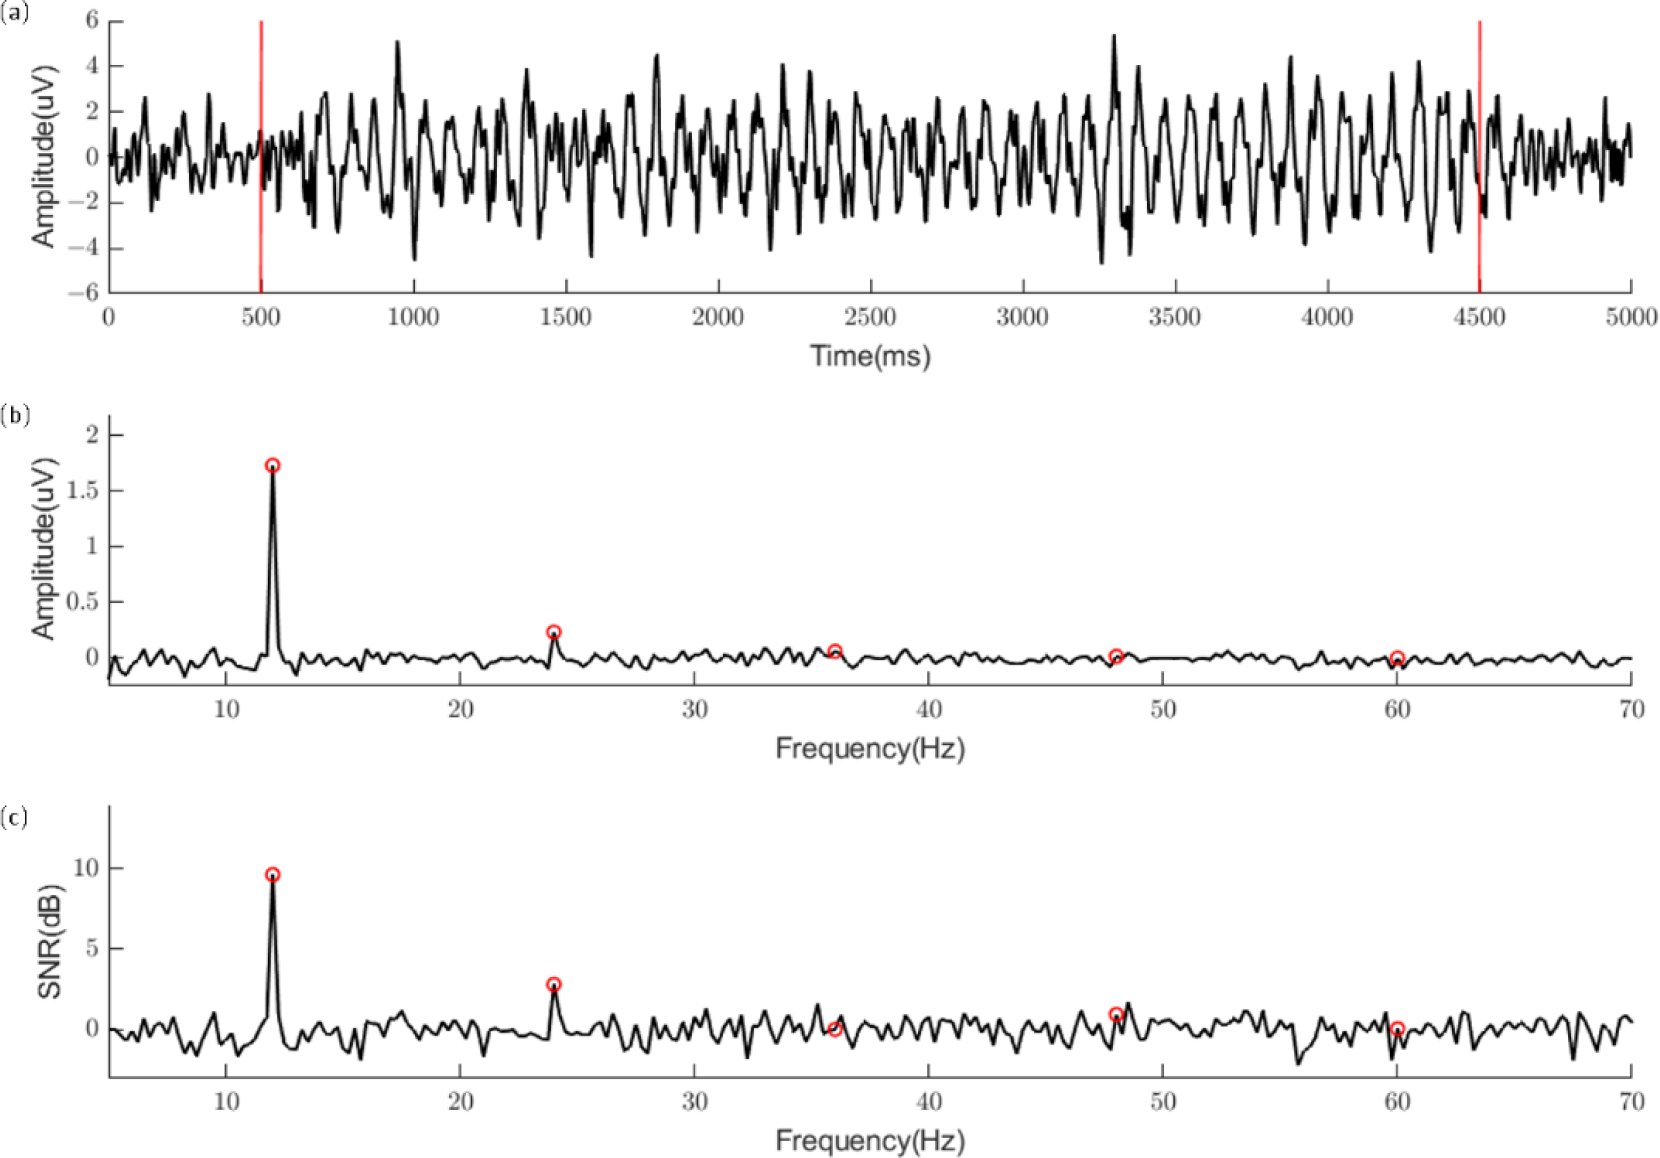
(a) Averaged waveform of 12-Hz SSVEPs from Channel Oz. The red lines indicate the onset and offset of visual stimuli. (b) Averaged amplitude spectrum of 12-Hz SSVEPs from Channel Oz. (c) Averaged signal-to-noise ratio (SNR) of 12-Hz SSVEPs from Channel Oz. The red circles represent the values of the amplitudes (or SNRs) for the target frequency (12Hz) and its harmonics.
To visualize the amplitude spectra and SNRs of the SSVEPs for 40 stimulation frequencies, the values of the amplitude spectra and SNRs were visualized in a color map as functions of stimulation and response frequencies (Figure 3). For all stimulation frequencies, the responses were identified only before 30 Hz in both figures of the amplitude spectra and SNRs. The second harmonic components of SSVEPs corresponding to high frequencies in 40 stimulations (e.g., 15.8 Hz) may not be explicit from the figures.
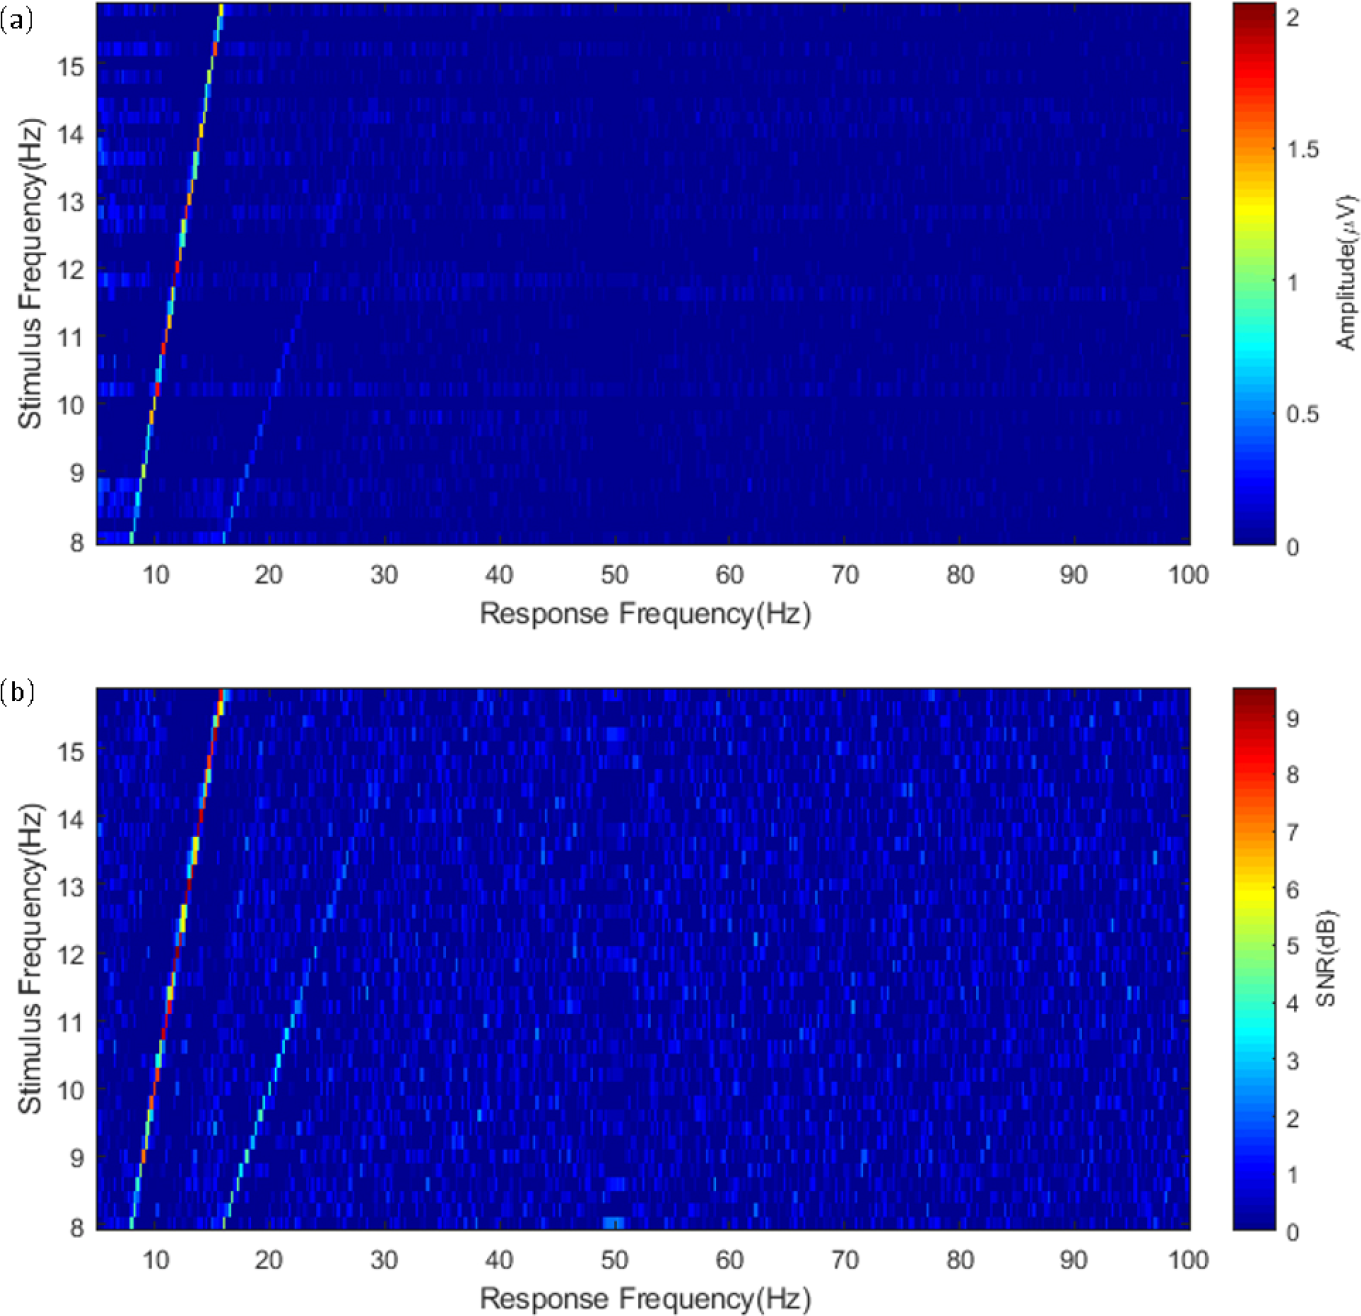
(a) Amplitude spectra and (b) signal-to-noise ratios (SNRs) of 40 stimulation frequencies as a function of stimulation and response frequencies.
4.2 Estimation of Visual Latency
The estimation of visual latency is critical in the classification of SSVEPs. It indicates the precise timing of SSVEP responses to the stimulation and is often used in data epoch extractions. Visual latencies can be measured using the phase of SSVEPs as a function of frequency [25]. In this study, SSVEPs from electrode Oz were used, and signals related to the frequencies with the same phases were grouped together (e.g., frequencies with 0-degree phases: 8, 8.8, and 9.6 Hz). Figure 4(a) shows a group of the averaged phases of SSVEPs across all participants. A linear model fitted the phase data, and the visual latency was estimated using the slope of the curve. As shown in Figure 4(b), the mean visual latency was approximately 159.49 ± 27.00 ms. This finding was consistent with that of other studies demonstrating that SSVEP latency ranges from 80 to 160 ms [25–27]. Therefore, a 160 ms latency was added to the epochs for offline analysis.
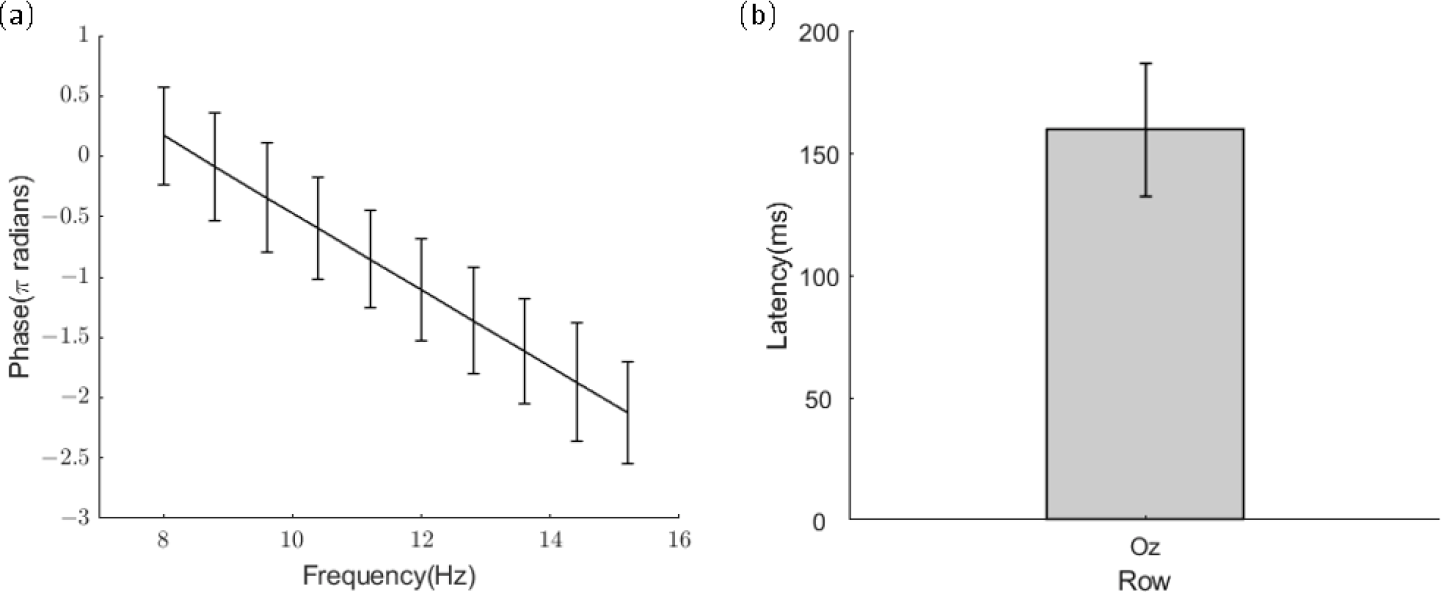
(a) Averaged phases of SSVEPs as a function of stimulus frequencies. (b) Bar plot of the estimated latencies from electrode Oz. Error bars indicate standard deviations.
4.3 Evaluation by Decoding Methods
For offline analysis, different lengths of windows with a step of 0.2 s were applied to the epochs from the stimulus onset to a maximum length of 4 s. In this study, FBCCA [21] and ensemble task-related component analysis (eTRCA) [28] were used for classification. They employed the same filter bank scheme, with subbands covering multiple harmonic frequency bands [21]. The values of weight parameters and frequency ranges of filter banks were determined using a grid search method.
Figure 5 (a) and (b) show the classification accuracy and ITR with different lengths of data epochs using FBCCA, respectively. The mean classification accuracy of the 4-s window was 76.85%, with a standard deviation of 23.15%. To estimate theoretical ITRs, a gaze shifting time of 0.55 s was added. The peak of the ITR values was 50.12 bits/min, with a data length of 2.4 s.
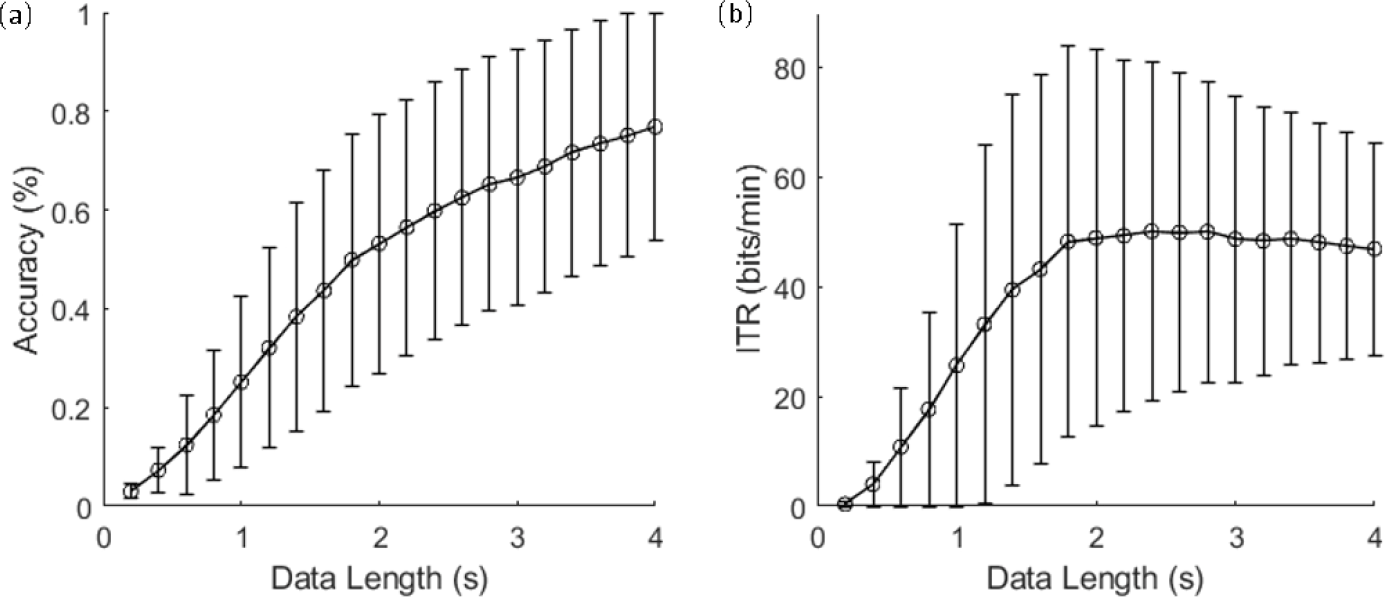
(a) Averaged classification accuracy and (b) ITR based on FBCCA. Error bars indicate standard deviations.
Figure 6 (a) and (b) show the classification accuracy and ITR with different lengths of data epochs using eTRCA. Leave-one block-out cross-validation was applied to divide each participant’s blocks into training and testing blocks for calculating the classification accuracy. The mean classification accuracy of the 4-s window was 63.49%, with a standard deviation of 29.79%. The peak of the ITR values was 36.65 bits/min, with a data length of 3.6 s. To further investigate the dataset, multi-stimulus task-related component analysis (msTRCA) [29–31] was used for classification. Figure 7 shows the average classification accuracy of msTRCA, FBCCA, and eTRCA. The results showed that msTRCA and eTRCA outperformed FBCCA when the data length was <2 s and <0.8 s, respectively. At the 4-s window, FBCCA achieved the best classification accuracy.
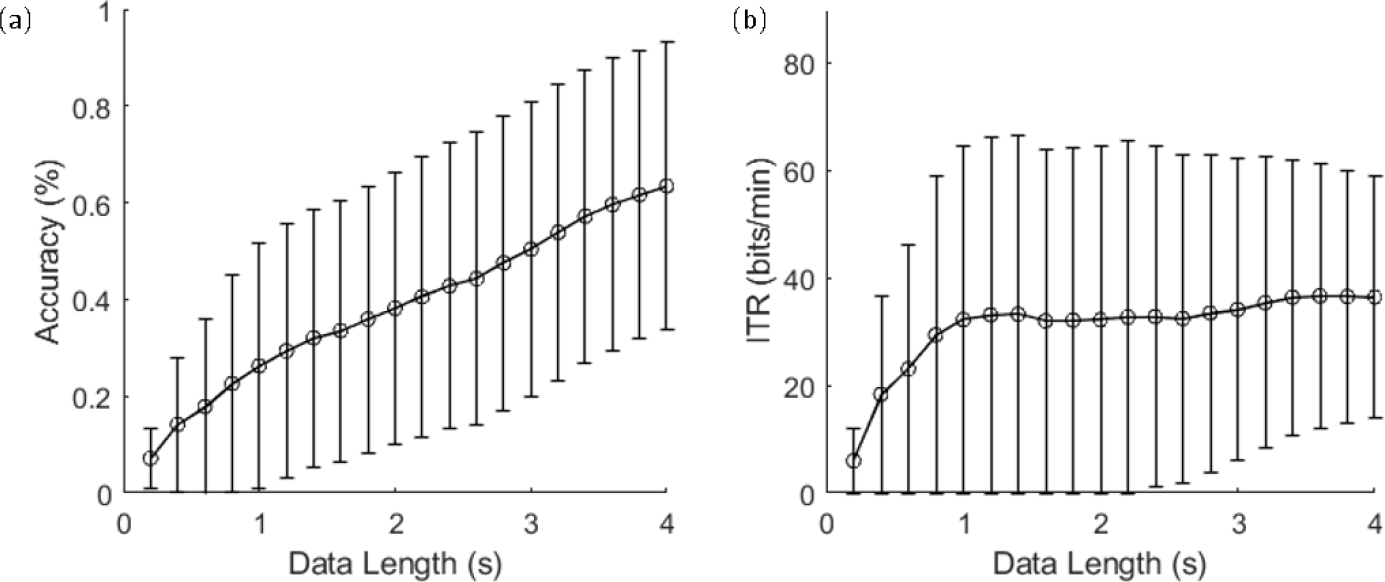
(a) Averaged classification accuracy and (b) ITR based on TRCA. Error bars indicate standard deviations.
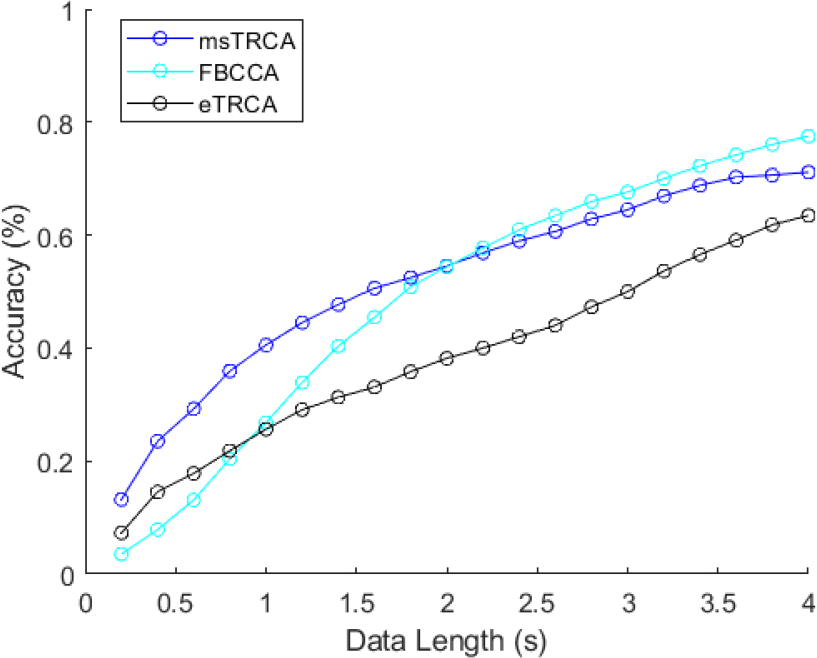
Average accuracy of the three methods.
5 Discussion
This study describes a dataset from a user-friendly SSVEP-BCI system. The participants recruited in the experiments were adolescents. The average classification accuracy by all participants was 76.85%.
5.1 User-Friendly BCI System
Laboratory technicians usually require >20 min to prepare whole-head EEG electrodes with electrode placement and gel injection. Participants have to clean their hair after the experiments because of conductive gels. In this study, technicians required <5 min to prepare PreG electrodes for each participant, and no residue, except water, was found on the scalp after the experiments. Pei et al. [15] recruited 10 participants to perform a BCI task using PreG electrodes and reported that 70% of them felt comfortable without any pain. Based on both comfort and convenience, 80% of the participants preferred PreG electrodes over wet electrodes [15].
This study also applied grid stimuli to reduce visual fatigue. Figure 8 shows the user experience of these stimuli based on three aspects. The average comfort level, flicker perception, and preference level scores were 2.4, 3.1, and 2.0, respectively (Figure 8). This indicated that the participants felt comfortable about the stimuli despite the slight flicker and accepted it as a preferred BCI system. This finding aligns with the user experience reported by Ming et al. [10]. Moreover, Ming et al. [10] demonstrated that participants preferred grid stimuli over high- contrast flicker stimuli, and each contrast increment represented a step sacrifice in user experience. The BCI system will be further evaluated systematically in the future (e.g., the tradeoff between the low-contrast stimuli and the effort required to focus on a target), thus establishing a standard evaluation of user experience.
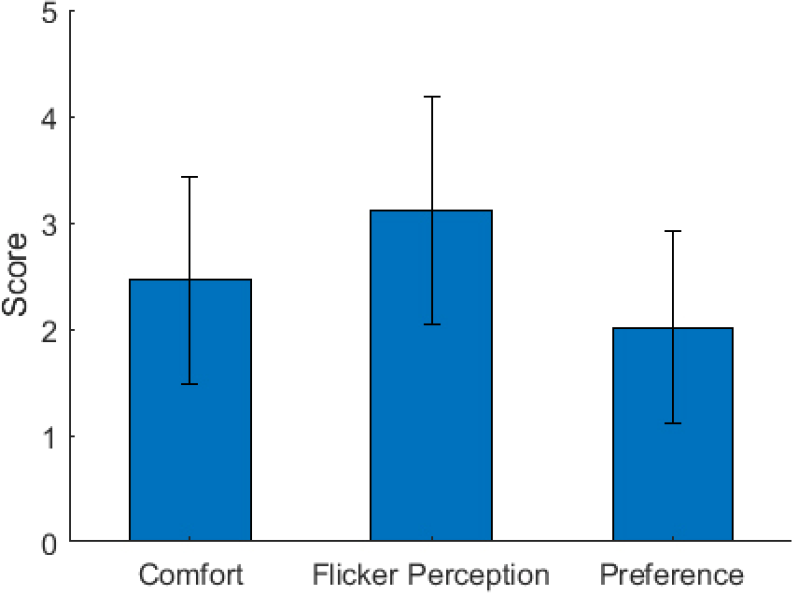
Average user experience score of comfort level, flicker perception, and preference level based on the questionnaire. Error bars indicate standard errors.
5.2 Comparison with other database studies
The SNRs and ITRs of the current database were lower than those of other databases in previous studies [32, 33]. For the benchmark database, the highest average ITR was observed at 117.75 bits/min, with a data length of 1.25 s, using the FBCCA method [32]. However, in the current database, the highest average ITR was observed at 50.12 bits/min, with a data length of 2.4 s. Figure 9 shows the comparison of the SNRs of the fundamental component of 12 Hz in this study with the SNRs in benchmark database [32]. It illustrates the normalized histogram of the SNR values of all trials from eight channels (POz, PO3, PO4, PO7, PO8, Oz, O1, and O2) in two databases. The SNRs in this study were significantly lower than those in the benchmark database (p < 0.001, z = −22.51; Mann-Whitney U-test).
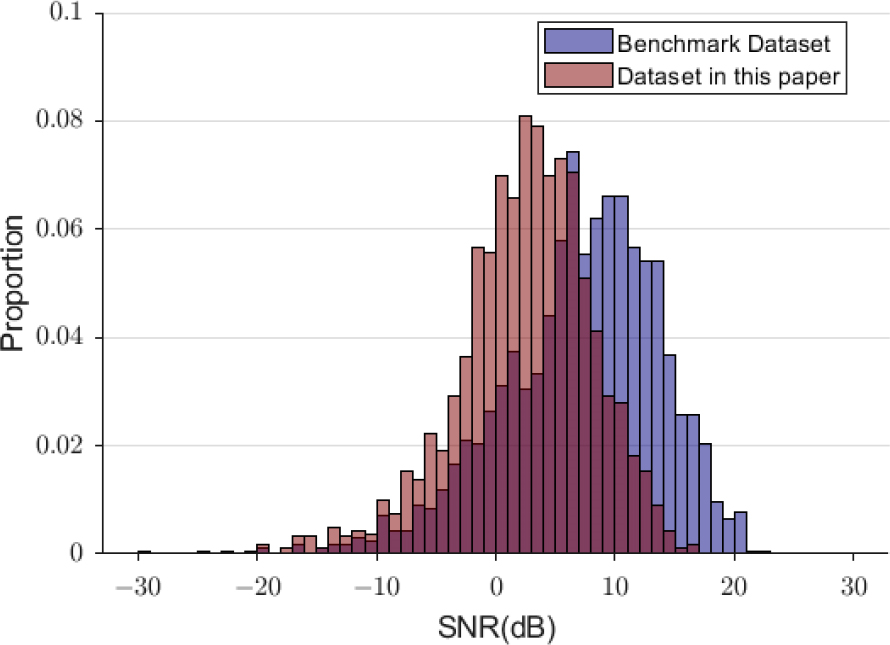
Normalized histogram of SNRs for the trials in this study and the benchmark database.
The disparity in classification performance and data quality between the two databases may have resulted from three aspects. First, the EEG signals in this database were recorded outside the electromagnetic shielding environment. In real-world applications, a well-controlled environment cannot be guaranteed. Although the EEG signals might be contaminated by background noise and other environmental interferences, collecting signals in the real world is necessary to investigate the possibility of future BCI applications in industries. Second, the grid stimuli were designed to obtain relatively high SNRs with a subtle flickering sensation, possibly evoking EEG responses with characteristics different from those of uniform flicking stimulation. Compared with traditional pure-color flickering, the SSVEPs of the new grid stimulus showed rapid decay in harmonic responses, as observed in the study by Ming et al. [10] as well as the current study. Third, the impedances of PreG electrodes were maintained below 100 kΩ instead of the standard impedance of 10 kΩ to reduce the preparation time. The hair length and thickness affected the moisture content of the hydrogel probes. Therefore, participants with long hair had a high impedance, possibly leading to a relatively low SNR.
5.3 Age
The participants in this study were adolescents, with an average age of 12.3 ± 1.3 (mean ± standard deviation; range: 10–16) years. Existing literature on the impact of age on SSVEP remains controversial. Allison et al. [34] reported that younger individuals and females performed better in the SSVEP-BCI typing system in a group of 106 participants aged 18~79 years. Conversely, Volosyak et al. [5] observed no significant difference in SSVEP-BCI performance among individuals aged 18~55 years, and factors such as handedness, fatigue level, alcohol, and caffeine intake had no significant impact on SSVEP. A separate study revealed that the ITR of older individuals aged 64~76 years was significantly lower than that of young adults aged 19~27 years [35]. Regarding children and adolescents, research on SSVEP has focused on exploring the relationship between SSVEP and spontaneous rhythms to investigate visual development stages in this population. Ehlers et al. [36] reported that children aged 6~10 years showed significantly lower accuracy in completing the SSVEP-BCI tasks with a stimulation of 7~11 Hz than adults, possibly due to the difficulty of generating phase-locked responses to α-bandwidth stimulation in children aged <10 years. Birca et al. [37] found that phase alignment is a mature indicator of SSVEP, especially in the occipital area of children aged 7~10 years. This phenomenon may reflect the maturation of the structure and function of brain regions involved in SSVEPs and explain the lower accuracy of low-frequency SSVEP classification in children [37]. In contrast, Hébert-Lalonde et al. [38] found that the frequency amplitude of SSVEP fundamental and second harmonics was independent of age and sex, showing no difference among individuals aged 5~34 years. Norton et al. [39] reported that accuracy of SSVEP classification in children aged 9~11 years was similar to that in adults. However, notably, they considered participants with an accuracy of <85% during calibration as “unable to use SSVEP-BCI” and excluded their data from subsequent analysis [39].
In this study, SSVEP data analysis in adolescents revealed longer visual latencies, which may be due to two reasons. First, the experiment used low-contrast visual stimuli to evoke SSVEPs. It is known that contrast sensitivity reaches full maturity between the ages of 8 and 19 years [40]. In other words, during adolescence, considerable developmental differences are observed in contrast sensitivity among individuals. Second, incomplete maturation of the structure and function of brain regions involved in contrast sensitivity might make it more difficult for some adolescents to generate phase-locked responses to low-contrast α-bandwidth visual stimuli, leading to significant individual differences in phases and affecting visual latencies based on phase calculations.
Moreover, the significant individual differences in phases may contribute to the less effective performance of eTRCA compared with that of FBCCA. The limited training data and lower SNR of the TRCA templates used in this experiment could be additional reasons for its poorer performance. To validate the hypothesis of significant phase differences in adolescents’ responses to low-contrast stimuli, future studies with further data collection and elimination of electrode variations should be conducted.
6 Conclusion
This study introduced an open database of SSVEPs with semi-dry electrodes and grid stimuli. EEG recordings from 59 healthy participants were collected along with detailed information on visual stimuli, data acquisition, and preprocessing methods. The dataset provides a valuable resource for further research and development of SSVEP-BCI systems. Overall, this study contributes to the advancement of SSVEP-BCIs in real-world settings by addressing key challenges related to visual fatigue and electrode preparation. The dataset presented herein can guide future studies to develop more user- friendly and practical BCI solutions for various applications, including communication and motor rehabilitation of individuals with physical disabilities.
Footnotes
Funding information
None.
Acknowledgments
We would like to thank all volunteers and participants who participated in the study for their time and involvement. We thank Wang Yijun for the invitation to write this article.
Author Contribution
Yue Dong prepared the first draft of the manuscript and constructively revised the manuscript. Sen Tian participated in data collection and organization. Yue Dong and Sen Tian analyzed the data. All authors commented on previous versions of the manuscript and approved the final version.
The authors declare no conflict of interest.
Data Availability Statement
Ethics Statement
The study protocol was approved by the Institutional Review Board of Tsinghua University (Project No. 20230058).
Informed Consent
All participants and their parents provided written informed consent at the time of entering this study.