
Abstract
Background:
The personality-brain association mechanism has been a topic of interest in the field of neuroscience. Usually, the previous research strategy was to first group the population based on different personality traits, and then explore the brain mechanisms corresponding to different personality groups. At present, a “brain-first” research strategy, which uses data-driven approaches instead of personality traits to first group the population, has been adopted to further enhance study objectivity.
Methods:
Here, we used a data-driven approach following the “brain-first” research strategy to deeply mine the resting-state brain functional magnetic resonance imaging data of 119 healthy participants, classified subjects into different groups based on brain image characteristics, and used the Sixteen Personality Factor Questionnaire to explain the variabilities of resting-state brain characteristics between different groups.
Results:
We have identified 3 personality–brain connections, including the privateness–left frontoparietal network, liveliness–sensory–motor network, and vigilance–sensory–motor network.
Conclusion:
We conclude that the above-mentioned three personality factors are based on brain neural activity, independent of the subjective experience of the personality scale creator, and have stronger explanatory power of brain imaging features.
Keywords
1 Introduction
The study of personality has important theoretical and practical value because it is one of the important concepts in psychology [1]. However, personality concept formation depends on the researcher’s life and observation experience, creating a subjective experience of the researcher affecting the objectivity and consistency of these concepts. The cognition/behavior patterns that constitute personality are stable and widely predictable [2, 3], thus researchers in the field of cognitive neuroscience had conducted a series of works to reveal the brain mechanism of personality. These studies aimed to connect the concept of personality that rely on the researcher’s observation experience with neural activities that are independent of the researcher’s observation experience, especially brain activities.
An increasing number of studies aim to uncover the personality–brain connection using imaging methods such as electroencephalography (EEG) [4–6], and positron emission tomography (PET) [7, 8]. Numerous researchers had begun to use functional magnetic resonance imaging (fMRI) to explore the connection between the brain and personality due to the high spatial resolution of fMRI [9–12].
However, most previous personality–brain connection studies had a limitation in their research strategy. They are typically driven by the concept of personality that is formed by relying on the life experience and consensus of the observer [13, 14] and detected differences in brain activity corresponding to different personality concepts, thereby inferring certain personality concepts involved in different brain regions or functional networks (Fig. 1(a)). Whether personality can objectively reflect brain mechanisms remains questionable. Therefore, data-driven and large- scale methods should be incorporated into personality–brain connection research to more objectively explore the brain mechanisms of personality concepts [13, 15].
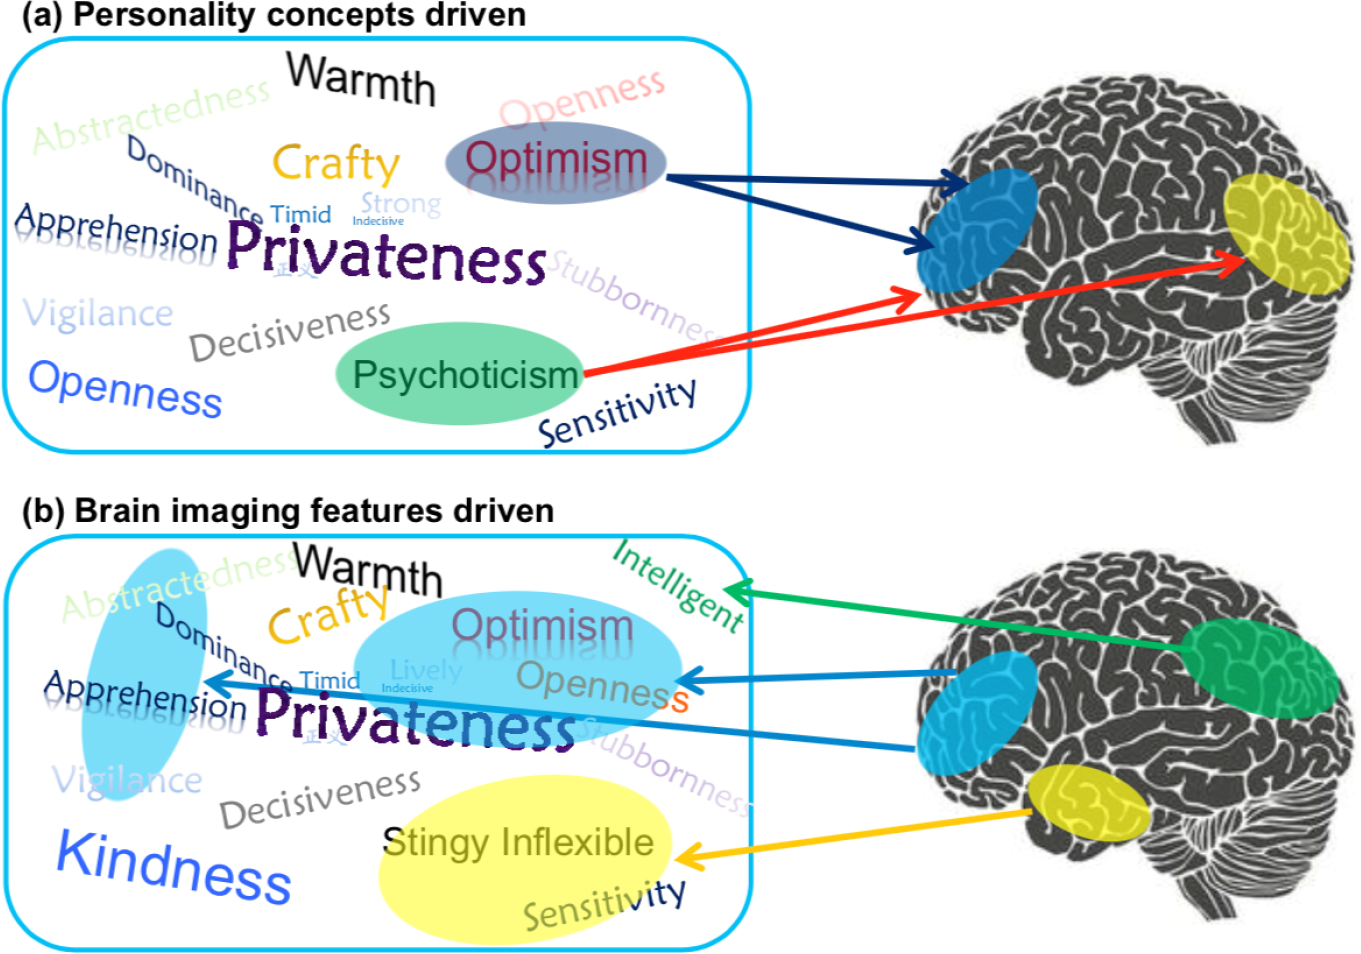
Two opposing strategies for investigating the personality–brain association. (a) Traditional research strategy (personality concepts driven) characterizes brain activities based on the current personality concepts. (b) New research strategy that focuses on the brain (brain imaging features driven) characterizes personality and behavior feature sets based on functional brain networks.
Here, we adopted generalized ranking and averaging independent component analysis by reproducibility (gRAICAR) [16–19] to examine whether individuals can be divided into different groups based on their intrinsic connectivity network (ICN) characteristics. The personality scores were then associated with the ICN-derived participant groups to explain the results. We attempted to infer the personality concepts involved in a certain brain functional network (Fig. 1(b)) to generate reliable and objective personality traits based on intrinsic brain characteristics.
Finally, this study included 119 subjects. We explored whether these individuals can be grouped into different groups based on the ICN features. Then, we associated the personality traits from the Sixteen Personality Factor Questionnaire (16PF) with the ICN-derived groups to interpret the results. Figure 2 graphically illustrates the data analysis process.
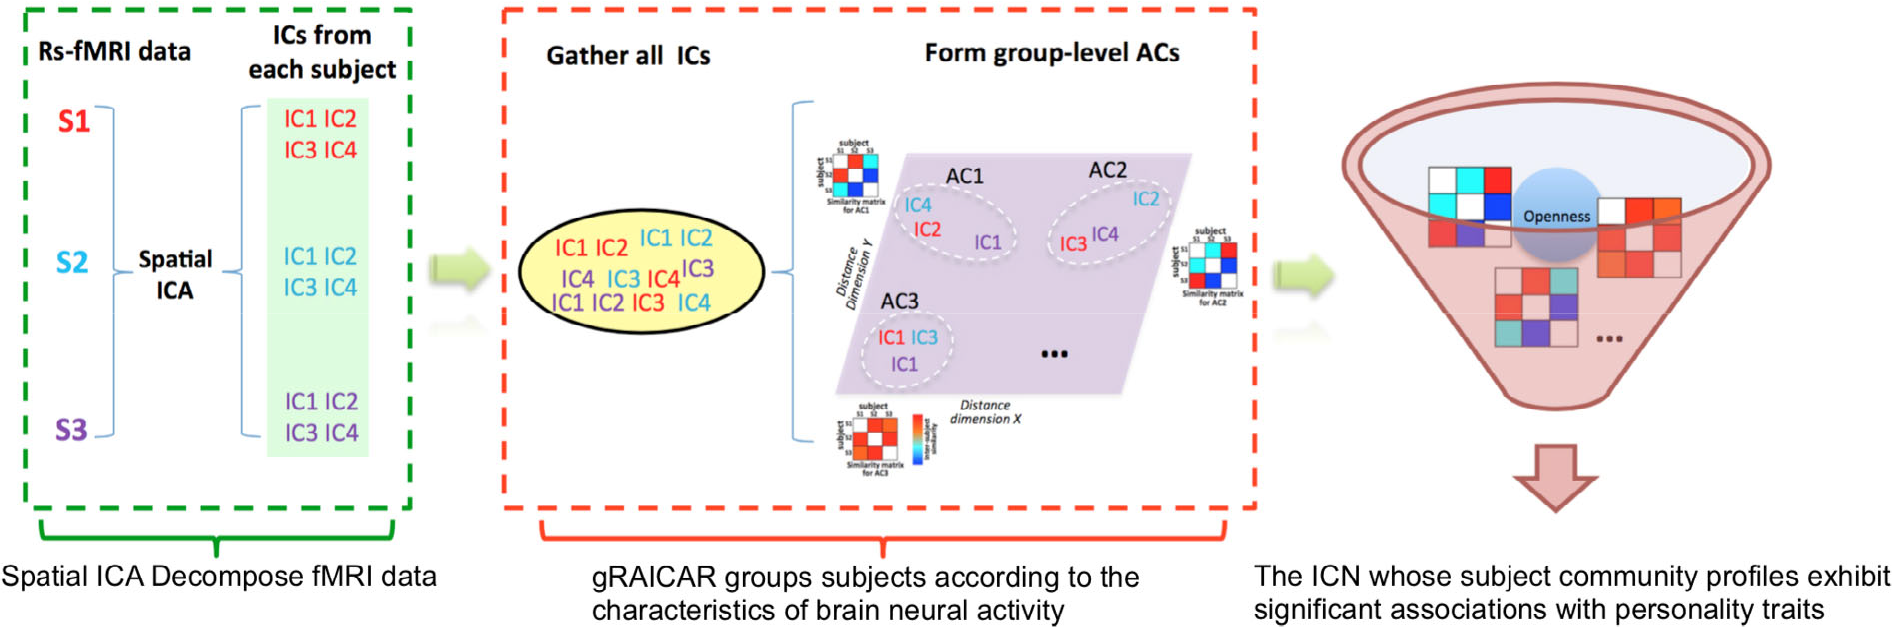
Demonstration of data analysis workflow. For simplicity, we assumed only three subjects (denoted as S1, S2, and S3). First, the fMRI data of subjects were decomposed individually using spatial ICA into ICs. We assumed that we could get four ICs for each subject that were color-coded to indicate which subject they were from. The resultant ICs maps were presented in the green layer. Second, all of the ICs from individual subjects were pooled in gRAICAR (as presented in the yellow layer). We presented a distance space depicting the similarity between all ICs in the purple layer. In this part, gRAICAR aimed to identify ICs that were from different individuals but were close to each other (as marked with white dashed circles). The ACs were formed by these clustered ICs sequentially, and a community detection algorithm could be applied to each AC to identify homogeneous subject communities among all subjects. Third, we tried to seek the intrinsic connectivity networks whose subject community profiles exhibited significant associations with personality traits. Note: ICA, spatial independent component analysis; ICs, spatial components; ACs, group-level aligned components.
2 Material and methods
2.1 Participants
This study recruited 137 participants from Shanxi Medical University or advertisements on bulletin boards in the community, and 18 participants were excluded because of incomplete MRI or questionnaires. The inclusion criteria were: 1) age 18–50 years; 2) right-handed (Edinburgh Handedness Inventory) [20]; 3) no serious physical diseases, neurological disease, brain injury, pregnancy, or substance abuse. The exclusion criteria were: 1) history of mental disorder and substance abuse; 2) MRI scan contraindications (e.g., implanted metal objects and claustrophobia). The Ethics Committee of Shanxi Medical University approved this study. All participants signed an informed consent form to participate in this study. The authors assert that all procedures contributing to this work comply with the ethical standards of the relevant national and institutional committees on human experimentation and with the Helsinki Declaration of 1975 [21].
2.2 Personality assessments
The 16PF, which is a self-report personality test developed over several decades of empirical research by Raymond B. Cattell, Maurice Tatsuoka, and Herbert Eber, was used to assess personality [22, 23]. The 16PF provides a personality measurement standard that includes 16 personality factors.
2.3 MRI data acquisition
All MR images were collected at Shanxi Provincial People’s Hospital with a 3.0T Siemens MRI scanner. The resting-state fMRI images were acquired using an echo-planar imaging sequence and the acquisition parameters are as follows: 32 slices, repetition time (TR)/echo time (TE) = 2,500/30 ms, flip angle = 90°, matrix = 64 × 64, field of view (FOV) = 240 × 240, thickness = 4 mm, 212 volumes, and duration 8′50″). Sstructural MRI data were acquired using a T1-weighted three- dimensional MPRAGE sequence (TR = 2,300 ms, TE = 2.95 ms, TI = 900 ms, flip angle = 9°, thickness = 1.2 mm, slices = 160, FOV = 225 mm × 240 mm, and matrix = 240 × 256). All participants were required to keep their minds clean and as motionless as possible with their eyes closed during the scan.
2.4 MRI data preprocessing
The preprocessing of T1-weighted and resting-state fMRI images was mainly conducted using the Connectome Computation System [24], including AFNI [25], FSL [26], and FreeSurfer [27].
The T1 data preprocessing steps included: cleaning the images by a spatially adaptive non-local mean filter [28] and feeding into FreeSurfer to extract the brain and segment tissues into white matter, gray matter, and cerebrospinal fluid. All images were transformed into the MNI152 space using Advanced Normalization Tools (ANTs) [29].
The functional data preprocessing steps included: (1) first 5 volume removal; (2) slice timing correction; (3) head motion correction; (4) rigid transformation estimation from individual functional space to the corresponding anatomical space; (5) 4D data standardization to a global mean intensity of 10,000; (6) band-pass temporal filtration at 0.01–0.1 Hz.
The quality of brain extraction, tissue segmentation, and spatial registration was visually inspected. The mean frame-wise displacement (mean FD) to evaluate and excluded excessive head motion for functional images should be <0.2 mm.
2.5 gRAICAR network mining analysis
The rationale, detailed illustration, and application examples of the gRAICAR algorithm can be obtained in the original [17] and subsequent work [1, 18–19, 30].
The gRAICAR algorithm could identify group- level aligned components (ACs) and the ratio of significant subjects within all ACs was computed (Fig. 3(a)). The change of this value across ACs reflected the trend in fractions of subjects who possess the given network. In particular, a certain number of subjects significantly possess the brain network of that group.
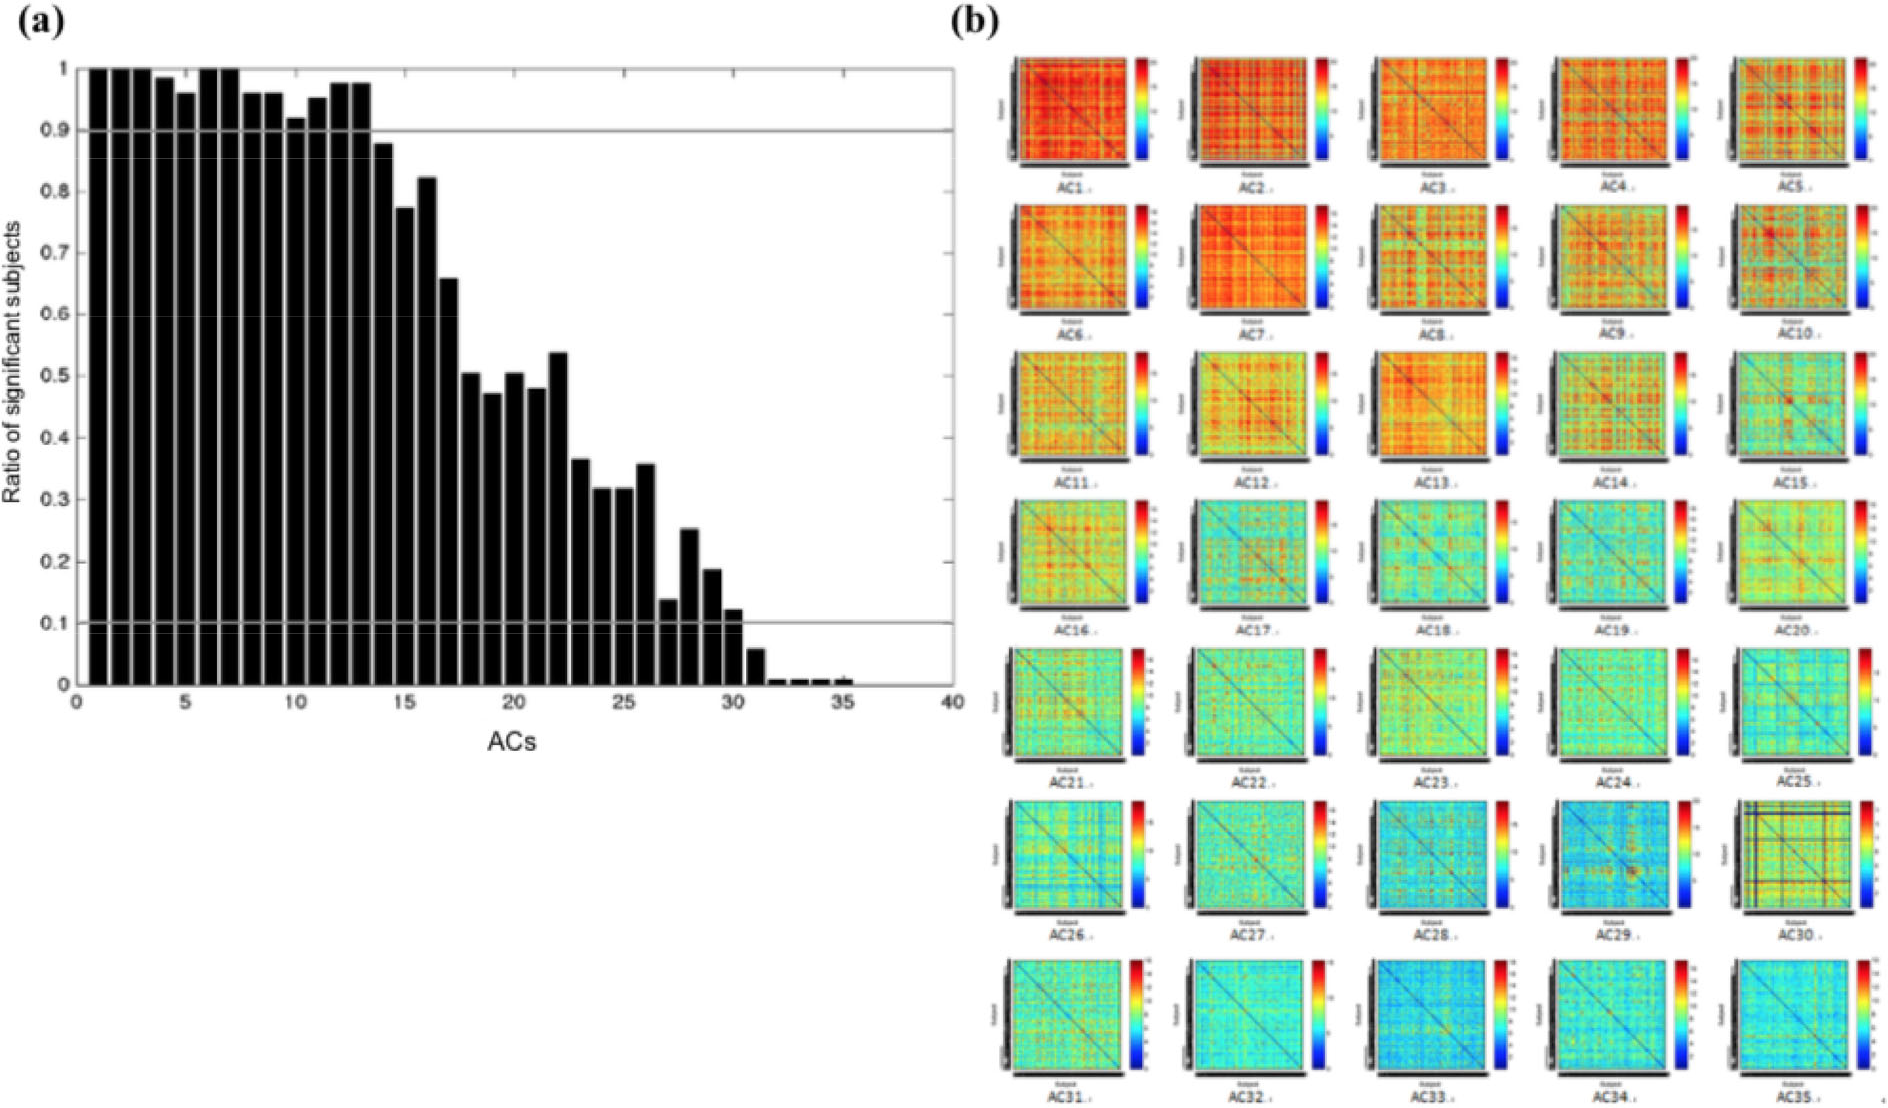
Demonstration of the RSS/inter-subject similarity matrix of each ACs. (a) There were 13 ACs with RSS of > 90%, 5 ACs with RSS of < 10%, and 17 ACs with RSS of 10%–90%. (b) The inter-subject similarity matrix of each ACs. Note: ACs, group-level aligned components; RSS, ratio of significant subjects.
Further, we combined the personality scores with the similarity matrix of each ACs to find which original confused similarity matrix becomes a regular distribution through alignment test and visual inspection.
2.6 Statistical analysis
The gRAICAR revealed that the personality variables were associated with the inter-subject similarity reflected in the ICNs. Post hoc analyses were performed to examine functional connectivity strength between the regions in the identified ICNs and their associations with personality scores to provide further supporting evidence for the gRAICAR findings. Pearson’s correlation analyses were performed to assess the relationship between brain characteristics and personality variables.
3 Results
gRAICAR algorithm identified 35 ACs, indicating that 119 subjects can be divided into 35 groups based on the similarity characteristics of brain networks (Fig. 3(b)). The subjects in each group may share similar ICN characteristics different from those in other groups. Based on previous literature [31, 32], 12 ACs were found to represent functional ICNs. We will report three personality-ICN connections separately in the following sections.
3.1 Demographical and behavioral measures
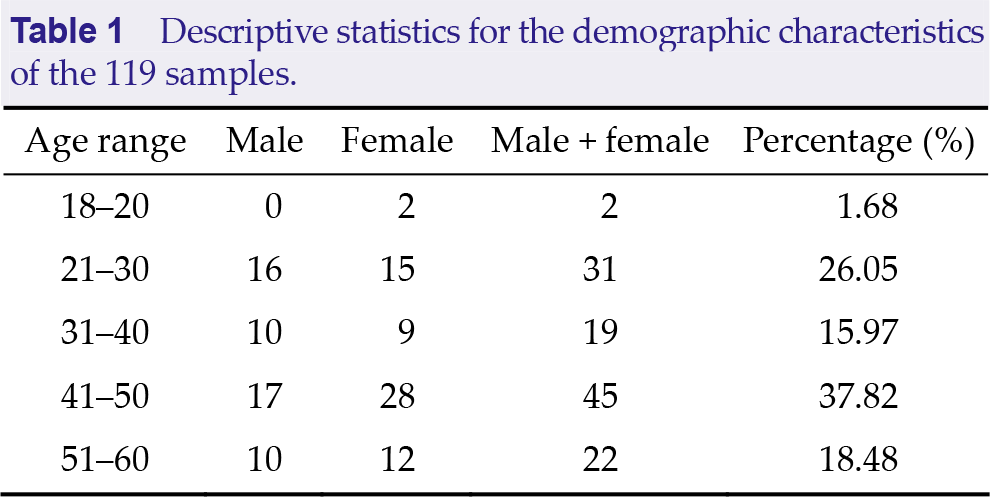
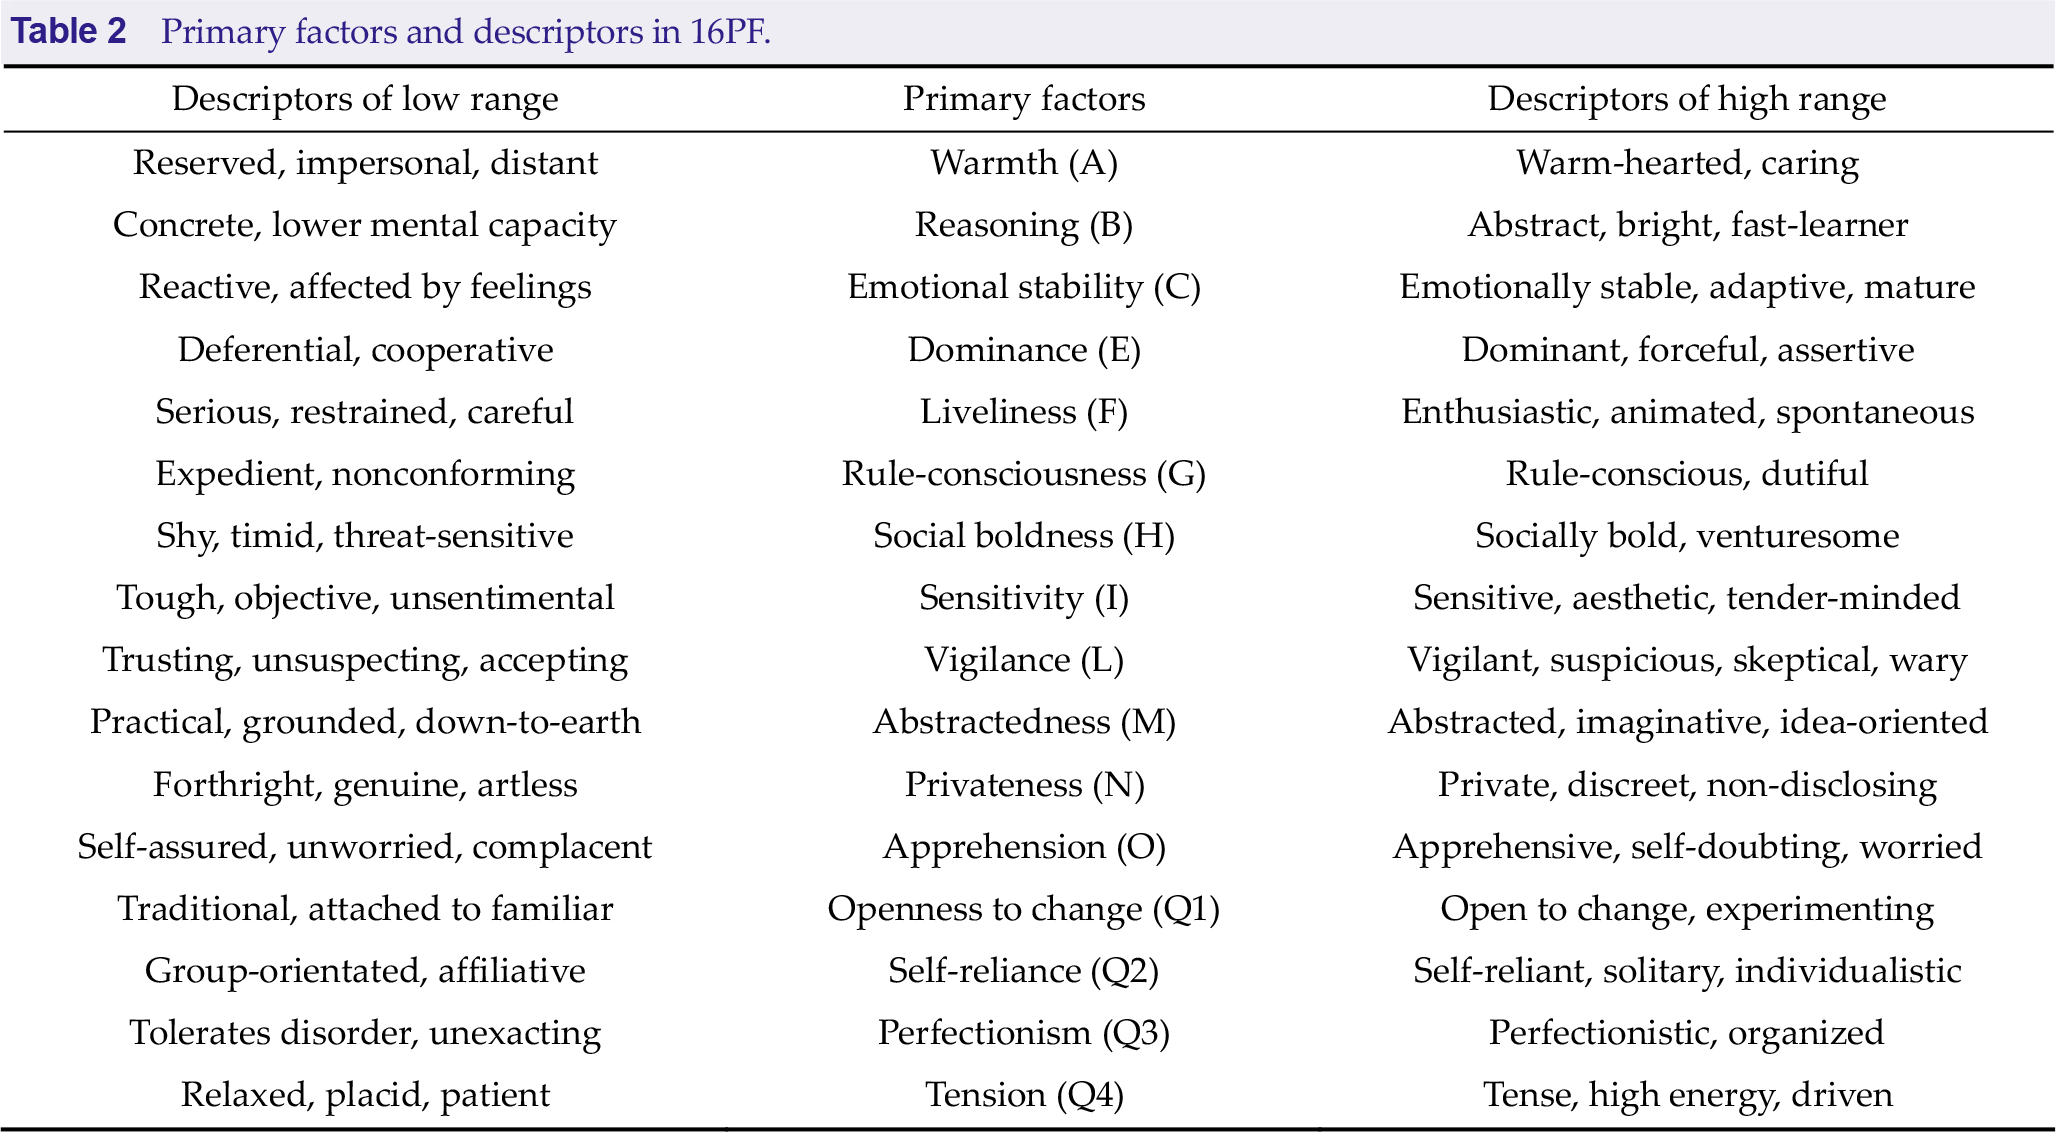
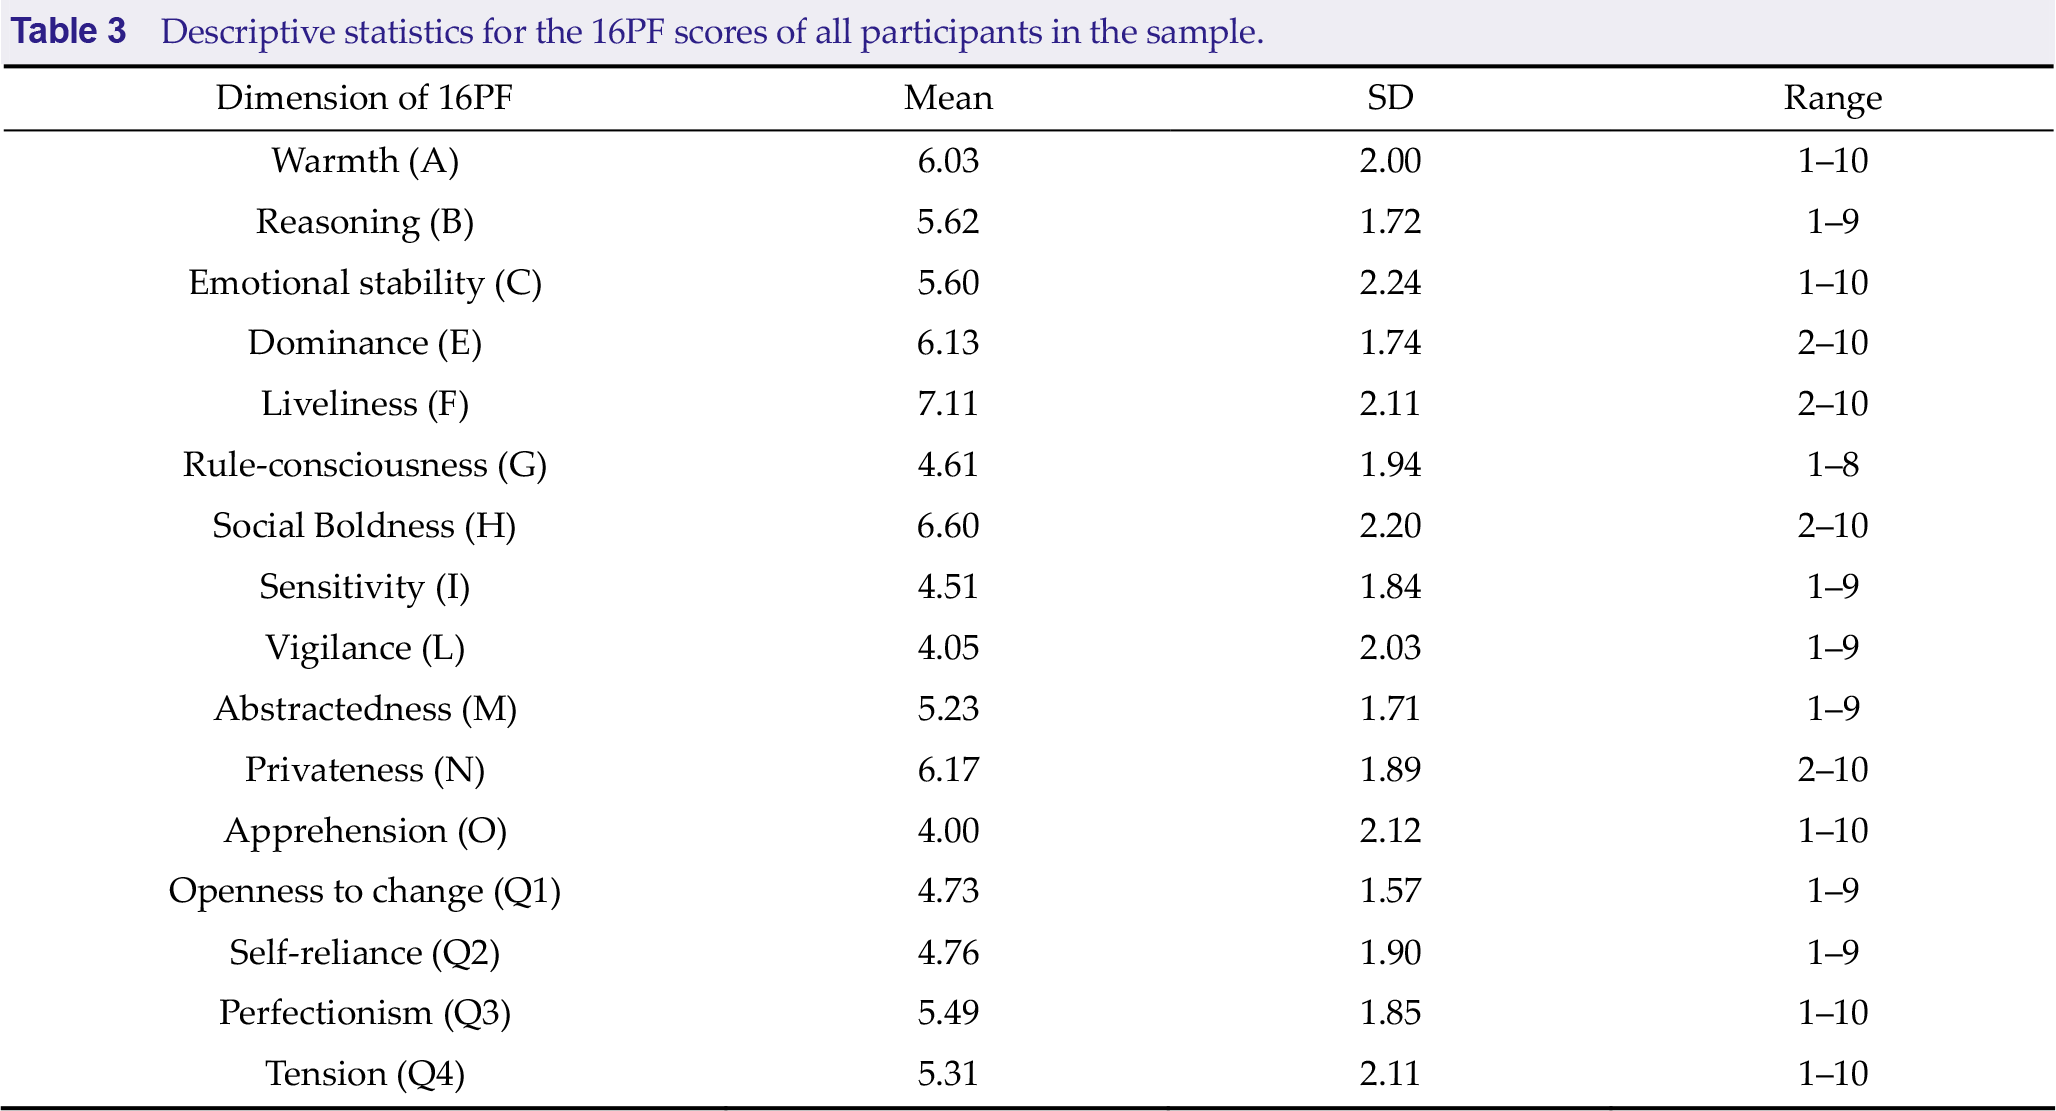
Table 1 shows the demographical information of all participants. Table 2 shows the primary factors and descriptors information in 16PF. Table 3 shows the descriptive statistics for each factor score of the 16PF.
Descriptive statistics for the demographic characteristics of the 119 samples.
Primary factors and descriptors in 16PF.
Descriptive statistics for the 16PF scores of all participants in the sample.
3.2 Left frontoparietal network associated with privateness classification
We found that the left frontoparietal network, mainly including Broca, Wernicke, medial frontal lobe, and caudate nucleus, reflected a group associated with the privateness trait (Fig. 4). A significant difference was found in the average similarity degree between the low privateness scores (LPS) and the other privateness scores (OPS) subjects. Visually, the original inter-subject similarity matrix (Fig. 4(b)) showed a clearer block when the subjects were reordered following the privateness scores (Fig. 4(c)). LPS has higher mean intra-group similarity (Fig. 4(d)) and stronger intrinsic connectivity (Fig. 4(e)). These findings indicate that the left frontoparietal network can distinguish the LPS from the OPS.
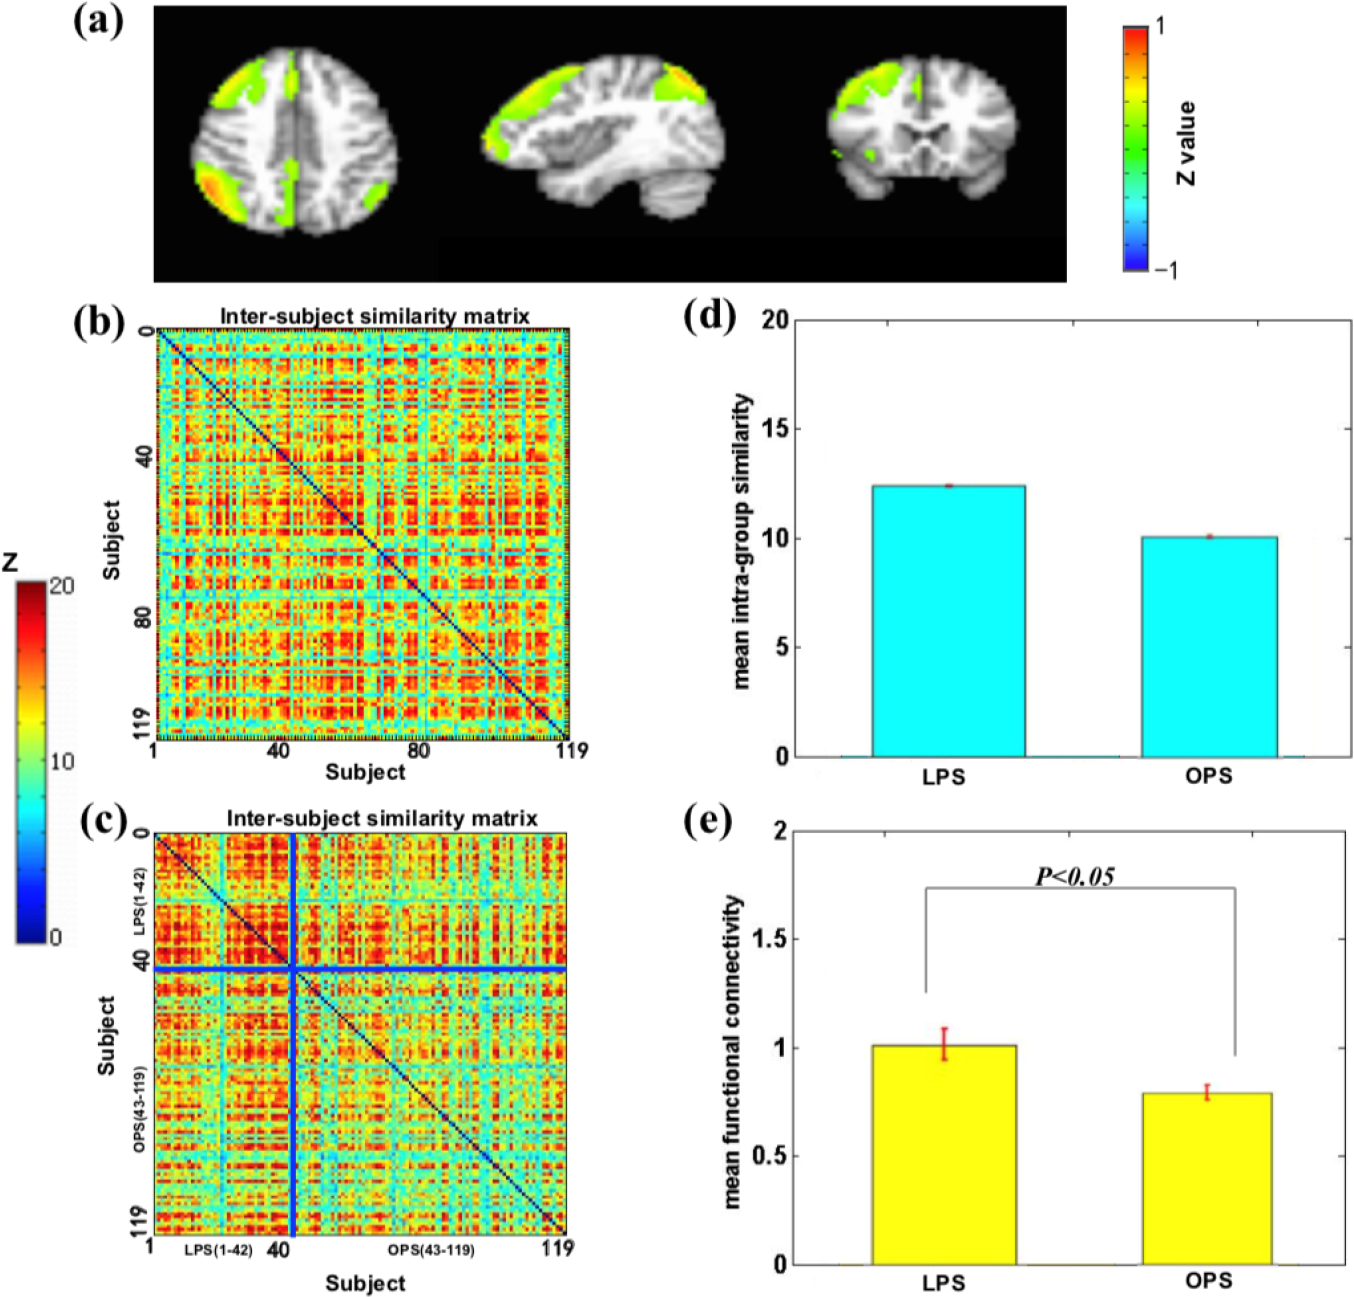
Left frontoparietal network is associated with the level of privateness. (a) Left frontoparietal network mainly includes Broca, Wernicke, medial frontal lobe, and caudate nucleus. (b) The similarity matrix of the left frontoparietal network across 119 subjects had no regular distribution. Both horizontal and vertical axes represented subjects. (c) The similarity matrix changed into a regular distribution in combination with the privateness scores. The LPS subjects had a higher inter-subjects average similarity compared to the OPS subjects. The subjects were grouped into LPS and OPS groups for visualization purposes, and the blue solid lines marked the boundary between the two groups. (d) The mean intra-group similarity of LPS was higher than that of OPS. (e) Voxel-wise functional connectivity analyses revealed higher functional connectivity strength (Fisher’s Z) of the left frontal-parietal network in the LPS group than that in the OPS group. Note: LPS, low privateness scores; OPS, other privateness scores.
3.3 Sensory–motor network is associated with liveliness classification
We found that the sensory–motor network, mainly including the primary motor cortex, cingulate cortex, and anterior motor cortex, reflected a group associated with the liveliness trait (Fig. (5)). A significant difference was found in the average similarity degree between the high liveliness scores (HLS) and the other liveliness scores (OLS) subjects. Visually, the original inter-subject similarity matrix (Fig. 5(b)) showed a clearer block when the subjects were reordered following the liveliness scores (Fig. 5(c)). HLS has higher mean intra-group similarity (Fig. 5(d)) and stronger intrinsic connectivity (Fig. 5(e)). These findings indicate that the sensory–motor network can distinguish the HLS from the OLS.
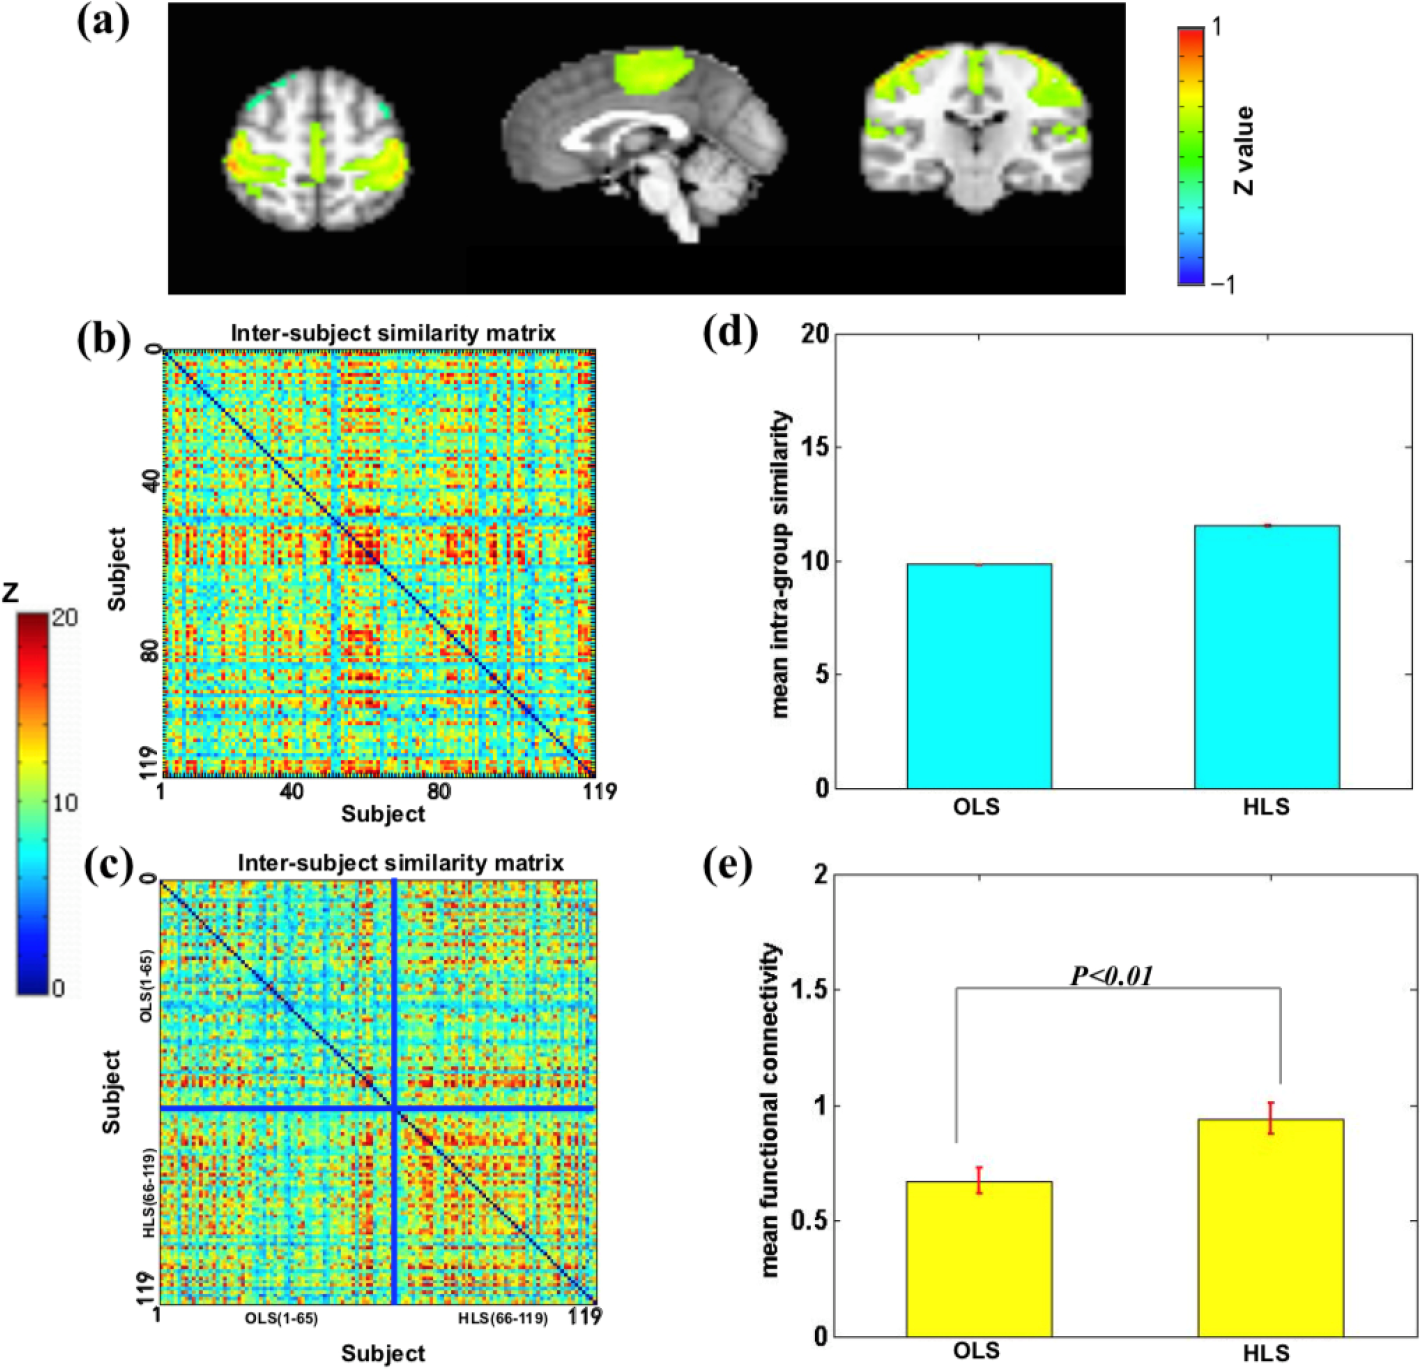
Sensory–motor network is associated with the level of liveliness. (a) Sensory–motor network mainly includes the primary motor cortex, cingulate cortex, and anterior motor cortex. (b) The similarity matrix of the sensory–motor network across 119 subjects had no regular distribution. Both horizontal and vertical axes represented subjects. (c) The similarity matrix changed into a regular distribution in combination with the liveliness scores. The HLS subjects had a higher inter-subjects average similarity compared to the OLS subjects. The subjects were grouped into OLS and HLS groups for visualization purposes, and the blue solid lines marked the boundary between the two groups. (d) The mean intra-group similarity of HLS was higher than that of OLS. (e) Voxel-wise functional connectivity analyses revealed higher functional connectivity strength (Fisher’s Z) of the sensory–motor network in the HLS group than that in the OLS group. Note: HLS, high liveliness scores; OLS, other liveliness scores.
3.4 Sensory–motor network is associated with vigilance classification
We found that the sensory–motor network also reflected a group associated with the vigilance trait (Fig. 6). A significant difference was found in the average similarity degree between the low vigilance scores (LVS) and the other vigilance scores (OVS) subjects. Visually, the original inter- subject similarity matrix (Fig. 6(b)) revealed a clearer block when the subjects were reordered following the vigilance scores (Fig. 6(c)). LVS has higher mean intra-group similarity (Fig. 6(d)) and stronger intrinsic connectivity (Fig. 6(e)). These findings indicate that the sensory–motor network can distinguish the LVS from the OVS.
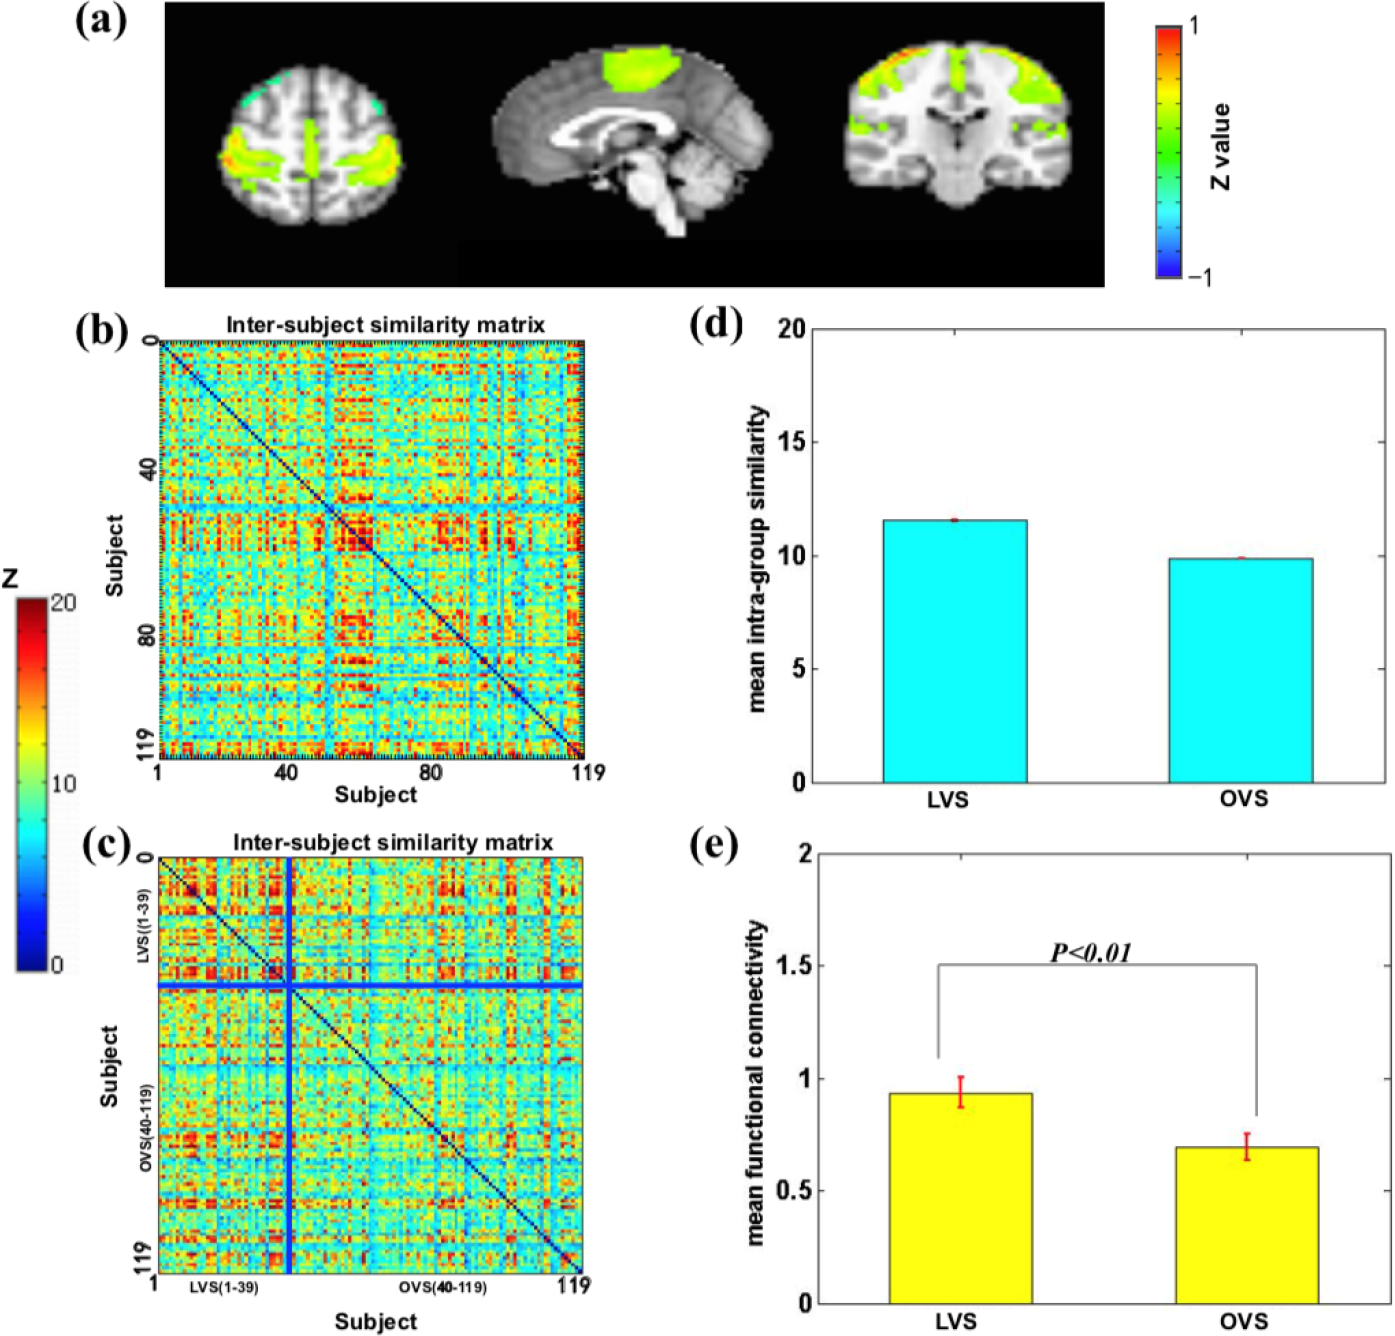
Sensory–motor network is associated with the level of vigilance. (a) Sensory–motor network mainly includes the primary motor cortex, cingulate cortex, and anterior motor cortex. (b) The similarity matrix of the sensory–motor network across 119 subjects had no regular distribution. Both horizontal and vertical axes represented subjects. (c) The similarity matrix changed into a regular distribution in combination with the liveliness scores. The LVS subjects had a higher inter-subjects average similarity compared to the OVS subjects. The subjects were grouped into LVS and OVS groups for visualization purposes, and the blue solid lines marked the boundary between the two groups. (d) The mean intra-group similarity of LVS was higher than that of OVS. (e) Voxel-wise functional connectivity analyses revealed higher functional connectivity strength (Fisher’s Z) of the sensory–motor network in the LVS group than that in the OVS group. Note: LVS, low vigilance scores; OVS, other vigilance scores.
3.5 Correlations between resting-state brain characteristics and personality variables
The mean intra-group similarity of the left frontoparietal network was negatively correlated with the privateness score (Fig. 7(a); r = −0.208, p < 0.05). The functional connectivity strength of the left frontoparietal network was also negatively correlated with the privateness score (Fig. 7(b); r = −0.394, p < 0.001). The mean intra-group similarity of the sensory–motor network was positively correlated with the liveliness score (Fig. 7(c); r = 0.259, p < 0.01). The functional connectivity strength of the sensory–motor network was positively correlated with the liveliness score (Fig. 7(d); r = 0.414, p < 0.001). The mean intra-group similarity of the sensory–motor network was negatively correlated with the vigilance score (Fig. 7(e); r = −0.244, p < 0.01). The functional connectivity strength of the sensory– motor network was also negatively correlated with the vigilance score (Fig. 7(f); r = −0.396, p < 0.001).
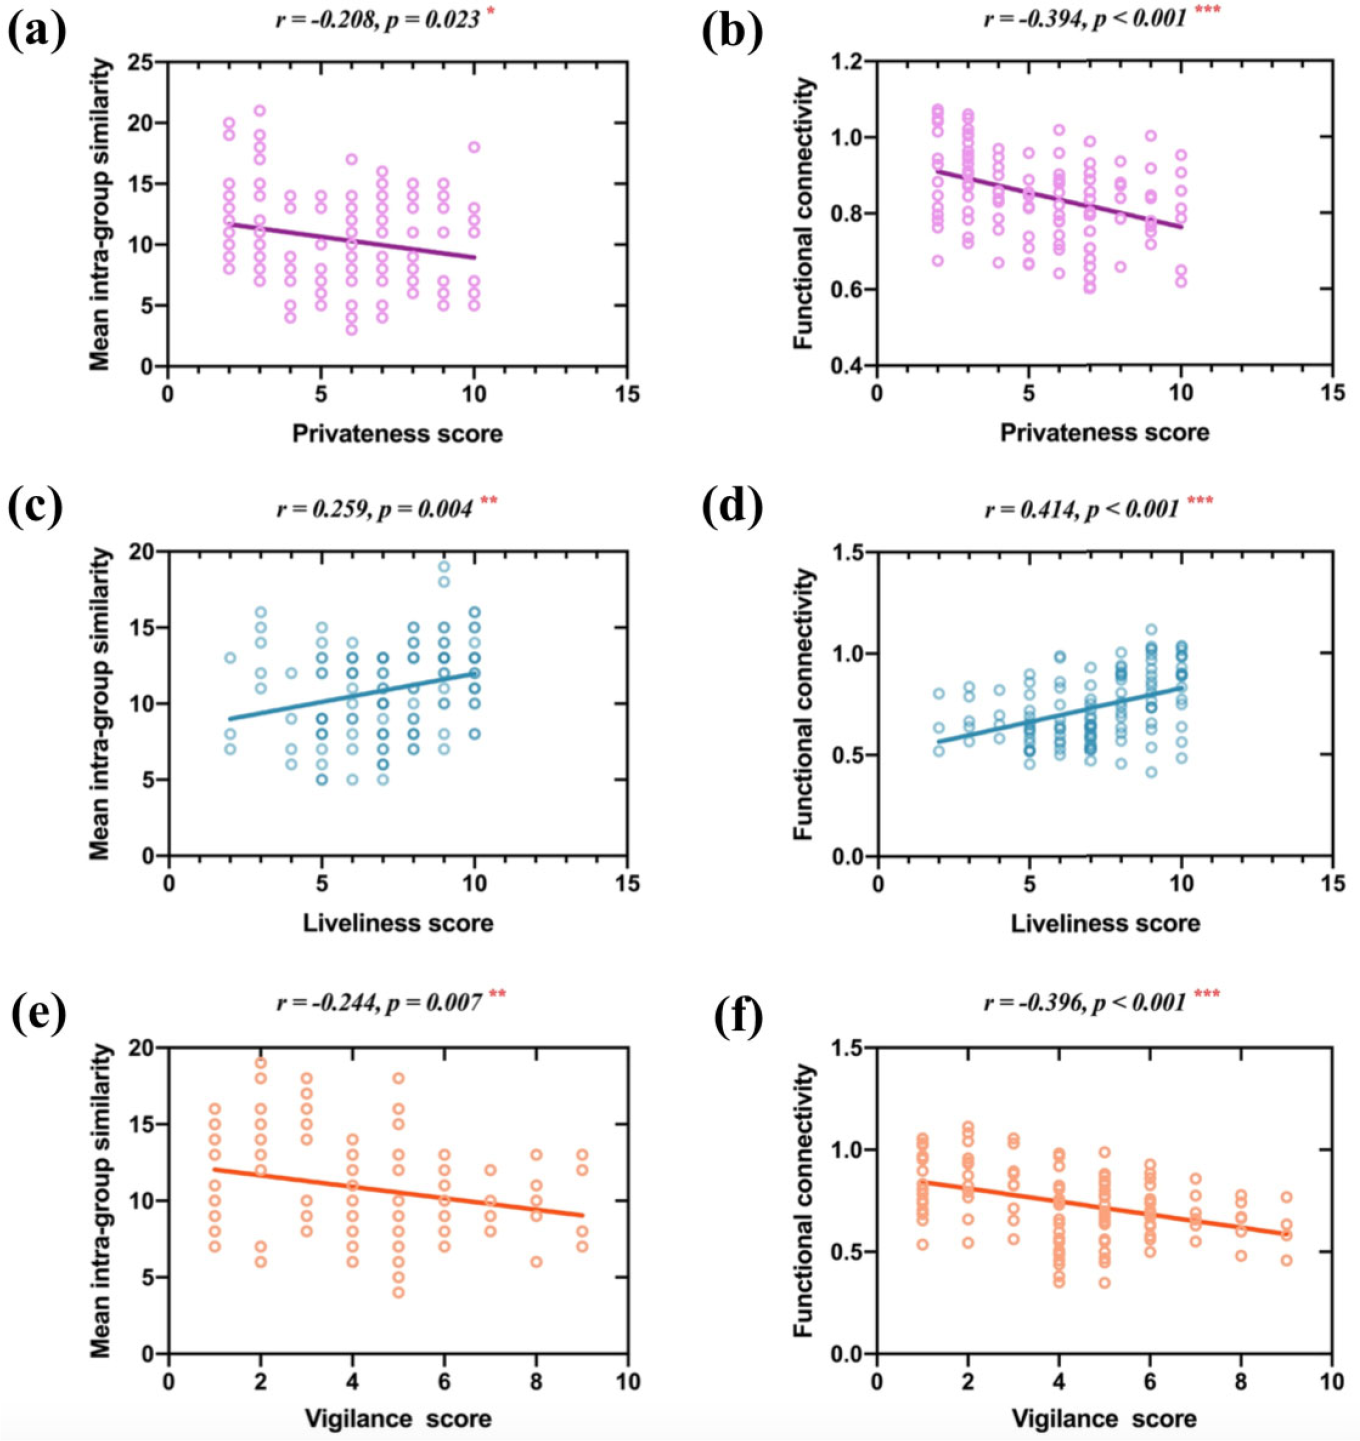
Correlations between resting-state brain characteristics and personality variables. (a) The mean intra-group similarity of the left frontoparietal network was negatively correlated with the privateness score. (b) The functional connectivity strength of the left frontoparietal network was also negatively correlated with the privateness score. (c) The mean intra-group similarity of the sensory–motor network was positively correlated with the liveliness score. (d) The functional connectivity strength of the sensory–motor network was also positively correlated with the liveliness score. (e) The mean intra-group similarity of the sensory–motor network was negatively correlated with the vigilance score. (f) The functional connectivity strength of the sensory–motor network was also negatively correlated with the vigilance score. Note: *, p < 0.05; **, p < 0.01; ***, p < 0.001.
4 Discussion
This study applied a data-driven approach to investigate the characteristics of ICNs with a sample of 119 healthy subjects and revealed a reliable association between the personality traits of 16PF and brain networks. Specifically, 1) people who have high activation of the left frontoparietal network will get a low score on the privateness trait; 2) people who have high activation of the sensory–motor network will get a high score on the liveliness trait; 3) people who have the high activation of sensory–motor network will get a low score on the vigilance trait.
Privateness is one of the 16PF factors. People with high privateness scores are shrewd and good at handling interpersonal relationships, while people with low scores exhibit honesty, frankness, and naivety. We can better understand privateness in combination with life experience, because individuals with strong privateness handle human affairs well, emphasize practicality, and lack principled behavior, while individuals with weak privateness are poor in terms of interpersonal behavior and are following their own set of principles, being objective and rational.
The study results indicate a close correlation between the left frontoparietal network and the privateness factor. The frontoparietal network mainly includes brain regions, such as the dorsolateral prefrontal cortex, inferior parietal lobule, middle cingulate gyrus, and precuneus. Damoiseaux was the earliest to use the ICA method to obtain a lateralized frontoparietal network with left and right separation and proposed that this is mainly a functional network related to memory [33]. Goel and Dolan studied the basic form of reasoning and speculated that neural activity mainly exists in the left frontoparietal network of the brain when individuals use arbitrary (meaningless) materials for reasoning [34]. Additionally, their speculation is consistent with previous studies of Goel, stating that the left parietal cortex of an individual is activated using the strict task of “no content” minus “content” for reasoning [35]. Subsequently, the study by Noveck et al. confirmed the reliability of the results of Goel and Dolan’s study [36].
Neurobasic research on reasoning involving patients has consistently revealed the importance of the left brain hemisphere in logical reasoning. For example, Langdon and Warrington presented semantic or spatial reasoning tasks to patients with brain injury and found that patients with only left hemisphere injuries were unable to complete semantic reasoning tasks, while patients with both left and right brain hemisphere injuries were unable to complete spatial reasoning tasks. Finally, they emphasized the importance of the left hemisphere in the logical reasoning process [37]. Hence, we can conclude that the left brain hemisphere is more important and necessary for logical reasoning compared to the right brain hemisphere, as claimed by Goel et al. The left frontoparietal network is mainly involved in the individual’s logical reasoning process. People with LPS are straightforward and rational, with their principles for doing things, which may be more suitable for logical thinking, and have an objective and rational way of thinking.
People with low liveliness scores are serious, cautious, calm, and reticent, while people with HLS are relaxed, excited, and content with the situation; People with LVS are sincere, cooperative, tolerant, dependent, and easy to get along with others, while people with high vigilance scores are prone to doubt others and be stubborn.
In 1995, Biswal revealed a sensory–motor network in the resting state of the brain. The network includes the bilateral precentral gyrus, posterior central gyrus, and auxiliary motor areas, mainly involving the primary sensory–motor cortex and secondary sensory–motor cortex. These brain regions are consistent with the brain regions activated during individual hand movements [38]. Sugiura et al. revealed that the local cerebral blood flow in the precentral gyrus and posterior central gyrus was negatively correlated with the scores of injury avoidance personality traits [39]. The precentral gyrus and posterior central gyrus are key brain regions in the sensory–motor network. People with high injury avoidance scores are considered cautious and anxious, while people with low scores exhibit optimism and good interpersonal skills [40, 41]. This is consistent with the performance of people with HLS and LVS, and thus the sensory–motor network functional activities of these two groups of individuals are enhanced.
A study involving patients with a social anxiety disorder by Goldin et al. revealed a significantly weakened functional connectivity of the sensory– motor network in patients with social anxiety disorder. The BOLD signal of the sensory–motor network in patients with a social anxiety disorder was significantly enhanced when facing social threat scenarios [42]. Liao et al. revealed weakened functional connectivity of the sensory–motor network in patients with social anxiety disorder, and their perceptual system revealed abnormalities [43]. Kilts et al. revealed that patients with social anxiety disorder experienced changes in the neural responses related to social anxiety in the sensory–motor network before and after treatment when faced with social anxiety images [44]. The main manifestation of patients with a social anxiety disorder is excessive worrying and nervousness about social occasions and interpersonal contact. Concurrently, the above studies indicate reduced functional connectivity of sensory–motor networks in these patients. Contrary to the behavioral performance of patients with social anxiety disorder, individuals with HLS and LVS mainly exhibit relaxed, pleasant, and easy to get along with others. Therefore, the average functional connectivity of the sensory–motor network in these two groups of subjects is enhanced compared to the others.
The current work has proven that conducting corresponding brain mechanism research on personality traits that rely on the subjective experience of personality scale makers can explore the potential neural imaging basis of personality traits that are independent of the subjective experience of the trait concept proposer based on the individual’s brain imaging characteristics. We can identify and conduct horizontal correlation analysis on the neural image basis corresponding to personality traits derived from different classic personality trait scales, such as Eysenck Personality Questionnaire and Neuroticism Extraversion Openness Five-Factor Inventory, in the future with the continuous development of relevant research work. Furthermore, we can identify personality trait concepts that correspond to the same ICNs and belong to different personality trait quality scales but have similar behavioral descriptions. This indicates that we can better integrate different personality trait scales based on more scientific and objective brain image features, which has great scientific value for in-depth personality trait theory development and comprehensive personality trait evaluation in the future.
Notably, the current study has three limitations that merit consideration. First, the current work only collected one data sample for research because of the limited human and material resources. In future work, we should collect additional data samples to validate the current results to support their reliability. Second, MRI has better temporal and spatial resolution than other brain imaging methods, but it can only indirectly reflect the brain neural activity, and the spatial and temporal resolution remain low, causing the limited features of brain neural image activity that we can obtain at present. Future studies should collect brain image data with a higher spatiotemporal resolution, such as collecting EEG data to improve temporal resolution and collecting 7 T MRI data to improve spatial resolution, to comprehensively analyze and explore the characteristics of individual brain activity. Third, The gRAICAR reveals the similarity of brain activities between individuals based on the spatial distribution characteristics of brain functional networks under a resting state. Future studies can integrate multiple similarity measurement methods to increase the reliability and effectiveness of research results.
5 Conclusion
This study mainly proposes a new strategy for the study of the brain mechanism of personality. We can use data-driven methods to deeply explore individual resting fMRI data and classify populations based on individual brain imaging features. Personality trait scores are used to verify and explain the resting brain functional network that reflects individual variation between different groups and identify personality traits based on brain neural activity.
Footnotes
Ethical approval
The Ethics Committee of Shanxi Medical University approved this study. The authors assert that all procedures contributing to this work comply with the ethical standards of the relevant national and institutional committees on human experimentation and with the Helsinki Declaration of 1975.
Consent
All participants signed an informed consent form to participate in this study.
Conflict of interests
The authors have no conflict of interest to declare.
Funding
This work was supported by the National Natural Science Foundation of China (Grant No. 82101610).
Authors’ contribution
Hong Li: Supervision, writing-review & editing. Junjie Wang: Data curation, writing-original draft. All authors contributed to and have approved the final manuscript.
Data availability statement
The data that support the findings of this study are available from the corresponding author upon reasonable request.