
Abstract
Blood oxygen level-dependent (BOLD) functional magnetic resonance imaging studies have shown the existence of ongoing blood flow fluctuations in the absence of stimuli. Although this so-called ‘resting-state activity’ appears to be correlated across brain regions with apparent functional relationship, its origin might be predominantly vascular and not directly representing neuronal signaling. To investigate this, we simultaneously measured BOLD and perfusion signals on healthy human subjects (
Introduction
Mapping of brain function with blood oxygen level-dependent (BOLD) functional magnetic resonance imaging (fMRI) relies on the detection of focal changes in cerebral blood flow (CBF) in response to external stimuli. These changes are believed to support the changes in metabolic demand related to task-induced changes in electrical and chemical signaling (Logothetis et al, 2001) at neuronal synapses.
In the absence of stimuli, the brain continues to show temporal fluctuations in blood flow, as measured with BOLD and perfusion-based MRI (Biswal et al, 1995, 1997). This phenomenon of so-called ‘resting-state activity’ resembles the very low-frequency (< 0.1 Hz) fluctuations of spontaneous neuronal and metabolic activity, which were observed in animals that were deprived of external stimuli (Allers et al, 2002; Dora and Kovach, 1981; Leopold et al, 2003; Ruskin et al, 2003). The observed synchronized fluctuation across distributed regions is suggestive of the underlying functional relationship (Biswal et al, 1995; Cordes et al, 2000; Greicius et al, 2003; Hampson et al, 2002; Lowe et al, 2000). In addition, the regions showing correlated fluctuations are highly consistent within and across subjects (Beckmann et al, 2005; van de Ven et al, 2004), suggesting that they might allow mapping and classification of the networks that underlie human brain function without the need for carefully conditioned stimuli.
Despite their potential functional significance for neuroscience research, the origin of blood flow fluctuations in the absence of stimuli has not yet been established. Potential contributors that involve modulation in electrical and chemical signaling at neuronal synapses include cognitive processes, fluctuations in vigilance and conscious awareness, and homeostatic (restorative) and plasticity processes. An alternative possibility is that, rather than having a neuronal origin, the fluctuations are caused by physiologic fluctuations (e.g., vasomotor effect (Johansson and Bohr, 1966) or fluctuations in endtidal CO2 (Wise et al, 2004)), without a substantial metabolic or neuronal component. As such, these fluctuations might bear little relevance to the mapping of functional networks.
Because of these confounding sources, the metabolic contribution to resting-state activity cannot be determined from BOLD or perfusion-based fMRI measurements alone. Nevertheless, several previous studies have shown that the analysis of simultaneously acquired BOLD and perfusion signals during a variety of tasks might reveal the level of the underlying metabolic activity (Chiarelli et al, 2007a; Davis et al, 1998; Hoge et al, 1999). In the context of this work, we designed an experiment to simultaneously acquire perfusion and BOLD signals during resting-state activity and tasks with varying metabolic demand, to estimate relative levels of metabolic activity.
Methods
Theory
A number of studies have compared the relationship between BOLD and perfusion signals during metabolically demanding tasks, such as stimulation-evoked activity, and tasks with reduced or negligible metabolic involvement, such as hypercapnia through controlled CO2 inhalation or breath-holding (BH) (Kety and Schmidt, 1948; Novack et al, 1953). Hoge et al (1999) found that the BOLD perfusion relationship could be accurately modeled by

with

In the absence of metabolic fluctuations,

with
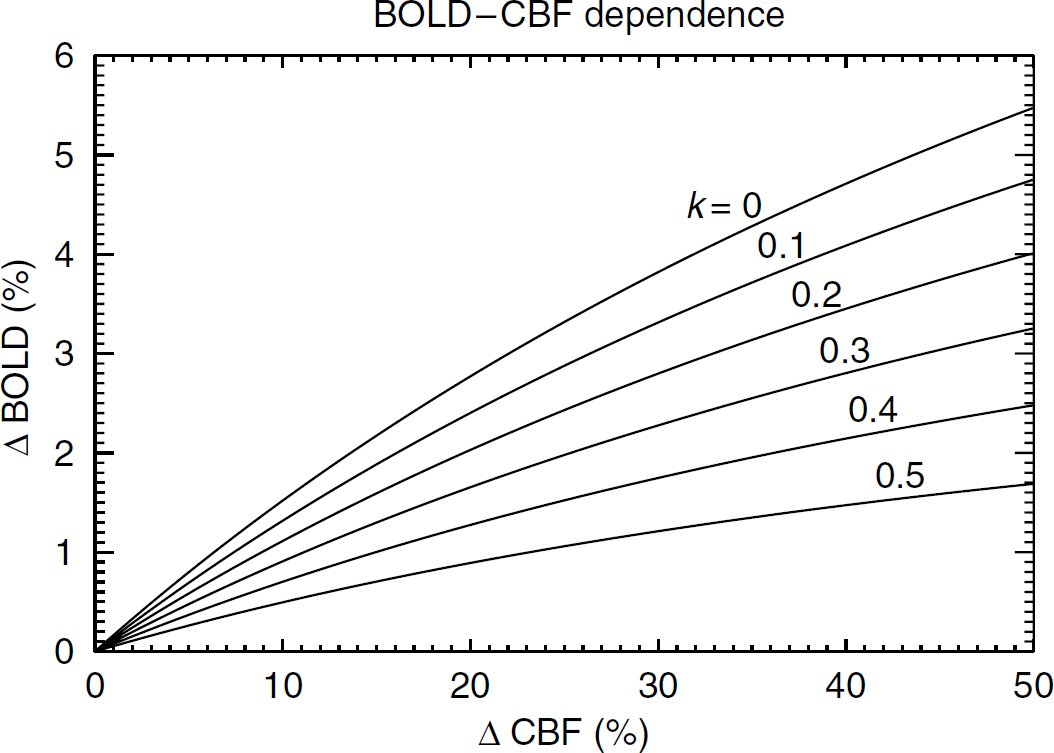
Simulated BOLD—perfusion relationship based on equation (2) using α = 0.38, β = 1.5,
Experimental Design
To determine whether spontaneous fMRI activity during the resting state has a substantial metabolic component, we performed simultaneous BOLD and perfusion MRI studies on 11 volunteers (7 males, 4 females, age: 22 to 38 years, average: 28 years) during a 40-min long experiment. Informed consent was obtained from all subjects before conducting the study, which was approved by the Institutional Review Board at the National Institutes of Health under protocol number 00-N-0082.
The experiment had three separate conditions (Figure 2): a VT, a BH task, and a resting state (REST). Visual and BH tasks were designed to strongly modulate fMRI signals with substantial and small or negligible fluctuation in metabolic demand, respectively. A BH task was chosen over controlled CO2 inhalation for the ease of implementation. If fluctuations during REST occur in the absence of metabolic fluctuations, their associated fluctuations in cerebral metabolic rate of oxygen (CMRO2) should be significantly lower than CMRO2 fluctuations during VT, and similar to CMRO2 fluctuations during BH.
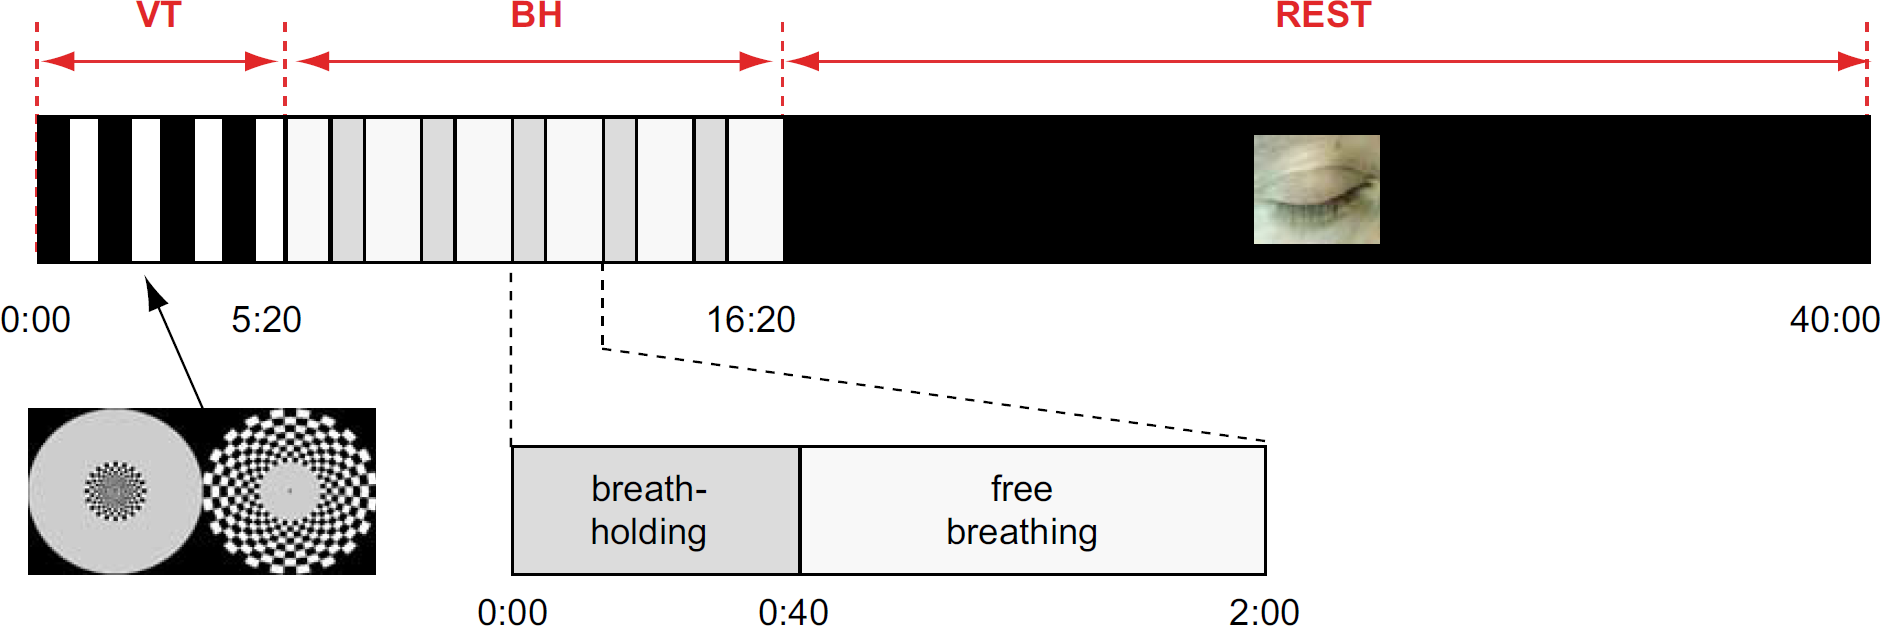
Timeline of simultaneous blood oxygen level-dependent and perfusion functional magnetic resonance imaging experiment. The experiment starts with a 5 mins and 20 secs task protocol, in which the central and peripheral portions of the visual field are alternatingly stimulated for 40-sec periods (visual task or VT). One minute after the VT, a breath-holding (BH) task follows, with five repeated cycles. Each cycle consists of taking in a single deep breath, followed by 40 secs of BH and 80 secs of normal breathing. The final part of the experiment consists of approximately 23 mins of rest, during which subjects close their eyes and are allowed to fall asleep (REST).
Stimulus Presentation
Before the start of each study, the subject was informed of the details of the experiment. In addition, subjects were asked to pay attention during VT, avoid head motion, and were encouraged to fall asleep during REST.
The visual stimulus, presented during VT at the initial part of the experiment (see Figure 2), lasted 320 secs and consisted of a contrast-reversing checkerboard (7.5 Hz) stimulating either the central (0 to 5°) or peripheral (5 to 15°) part of the visual field in eight blocks of 40 secs duration each. To ensure alertness during this part of the experiment, and minimize saccades, subjects were instructed to focus on a small dot that was presented in the center of the checkerboard display, and push a button on an fORP MRI compatible response box (Current Design Inc., Philadelphia, PA, USA) when the color of the dot changed. Color changes were randomized in time and occurred on average at the rate of 0.05/sec. The visual stimuli were back-projected onto a translucent screen with a U2-1200DLP data projector (PLUS Vision Corp., Tokyo, Japan). Button presses were recorded using Presentation 0.80 software (Neurobehavioral Systems Inc., Albany, CA, USA), which also recorded the timing of the MRI acquisition.
The BH task consisted of five cycles (120 secs each) of a BH paradigm, starting 1 min after the end of the VT. At the beginning of each cycle, subjects were prompted to take a deep breath, followed by 40 secs of breath-hold. During the remaining 80 secs of each cycle, the subjects were instructed to breathe freely.
The resting period that followed BH lasted 23 mins and 40 secs. Room lights were dimmed and subjects were instructed to close their eyes and relax. They were allowed to sleep.
Magnetic Resonance Imaging Scanning
All experiments were performed on a SIGNA VH/
Physiologic Monitoring
To monitor the physiologic and cognitive state of the subjects, a number of physiologic signals were recorded in synchrony with MRI acquisition. These signals included electroencephalography (EEG), cardiac and respiratory cycles, and button presses (subjects' response during VT).
Electroencephalographic data, collected using a 64-channel Neuroscan Synamps2 system (Compumedics USA Ltd, El Paso, TX, USA), served primarily to measure the subjects' alertness and to detect sleep. Signals were collected using 40 channels of a sintered Ag/AgCl electrode cap connected via carbon fibers and RF filters to amplifiers and digitizers. Electrodes were placed to cover most of the scalp. Two of the channels were bipolar and were used to allow monitoring of the electrooculogram and electrocardiogram. Acquisition of EEG was performed continuously, in DC mode and with a digitization rate of 10 kHz and analog low-pass filtering at 2 kHz. At each MRI repetition interval (TR), a trigger pulse from the scanner was recorded and used for localization of the gradient artifact (see below).
Magnetic Resonance Imaging Data Analysis
All MRI data analyses were performed using IDL 6.2 software (ITT Visual Information Solutions, Boulder, CO, USA). After EPI image reconstruction, to normalize the BOLD and perfusion signal time course to the resting baseline, both BOLD and perfusion images were divided by the first image in the BOLD-weighted time series. Subsequently, linear drift correction and band-pass filtering between 0.01 and 0.1 Hz were performed on both BOLD and perfusion data. The specific choice of pass-band was made to reduce nonlinear drift and thermal noise, while minimally affecting the predominant frequencies of BOLD and perfusion signals during VT, BH, and REST. After these preprocessing steps, VT, BH, and REST data segments were analyzed separately.
Based on the VT data, a functional (activated) region of interest (ROI) was selected by comparing the signal level during active stages to that during nonactive stages of visual stimuli. This was carried out for foveal and peripheral stimuli separately. This ROI roughly covered most of the lower visual areas. Pixels were considered activated when significant (
Subsequently, potential time shifts between BOLD and perfusion signals were determined by correlating these signals at different time shifts (lags). This was done to compensate for the difference in acquisition time of these two signals, and time shifts related to inherent contrast mechanisms (e.g., vascular delays). A perfusion lag of −1 time point (−1.77 secs) was found to be optimal for all subjects. This value was used to correct (time shift) all perfusion data (VT, BH, and REST) before further analysis. For the REST data, global intensity (average of whole-brain signal) fluctuations were removed by using the brain-averaged signal as a regressor in a pixel-by-pixel manner. This was done for BOLD and perfusion data separately.
Finally, to determine the proportionality constant between BOLD and perfusion signals (see equation (2)), linear regression was performed on the average signals in the functional ROI in the VC for VT, BH, and REST periods. For VT, foveal and peripheral signals were averaged after time-shifting to account for the differences in stimulation paradigm between these regions. In addition, to estimate the fluctuation level, root-mean-square (RMS) of the averaged signal time course in the VC was measured for each period separately. Since this fluctuation is a spontaneous phenomenon, because of lack of the reference for regression analysis as in task-evoked activity, RMS value was employed in this study. To determine the differences between sleep and wake states, this analysis was also performed separately on the eight subjects who fell asleep, as determined from EEG (see below).
To evaluate the presence of ongoing activity, the through-plane spatial correlation was determined on a pixel-by-pixel basis. This was carried out for each experimental condition. Through-plane spatial correlation was chosen rather than in-plane correlation to avoid potential bias (spatial blurring) inherent to the image acquisition process.
In addition, further analysis was performed using ROI selection based on spatial correlation during REST. Similar to the methodology used in earlier studies of resting-state activity (Biswal et al, 1995; Fox and Raichle, 2007), a ‘seed’ voxel was placed in a specific anatomic location, and an ROI was generated by selecting all pixels that had a correlation of 0.3 or higher with the time course of the seed voxel in both BOLD and perfusion data. Regions of interest were placed in a number of locations, including VC, lateral temporo-parietal cortex, sensory-motor cortex, and prefrontal cortex based on the anatomic MRI data. Linear regression was performed on the average signals in each ROI.
Electroencephalographic Data Analysis
Electroencephalographic data were analyzed using Scan 4.3.2 software (Neuroscan; Compumedics USA Ltd, El Paso, TX, USA). After low-pass filtering of the data at 250 Hz (IIR, 48 dB/oct), gradient artifacts were removed based on template subtraction (Allen et al, 2000). The parameters of template subtraction were selected as follows: a window from −50 to 3,955 ms around the scanner's trigger, phase shift of 99 points, and window size of 3 events. Data were then downsampled to 200 Hz and subsequently band-pass-filtered (IIR, 24 dB/oct) to select a 0.5 to 28 Hz interval. A template of the cardioballistic artifact was constructed for each recording and used to extract principal components. These components were removed from the filtered data set.
Electroencephalographic data sets were visually inspected by a sleep expert (TJB) blinded to the fMRI data. A score (0: wake, 1: stage 1 sleep, 2: stage 2 sleep, 3/4: slow-wave sleep, 5: REM (rapid eye movement) sleep) was assigned for each 30-sec interval (Rechtschaffen and Kales, 1968). These values were then averaged over 2-min intervals and used to discriminate sleep from waking conditions. Sleep was defined as an average score greater than 0 over a 2-min interval. The longest single sleep interval was chosen for each (sleep) subject.
Results
All subjects actively performed both BH task and VT, as indicated from button responses and the signal recorded from the respiratory bellows. Eight of the 11 studies showed extended periods of sleep (stage 1 and 2 sleep only) lasting at least 5 mins. No slow-wave (stage 3 or 4) or REM sleep was detected.
In all subjects, a significant amount of spatially correlated activity was found outside the VC region that was active during the task. This was the case for both VT and REST periods, with correlation levels (averaged over covered brain area) during REST (0.20 ± 0.03) significantly (
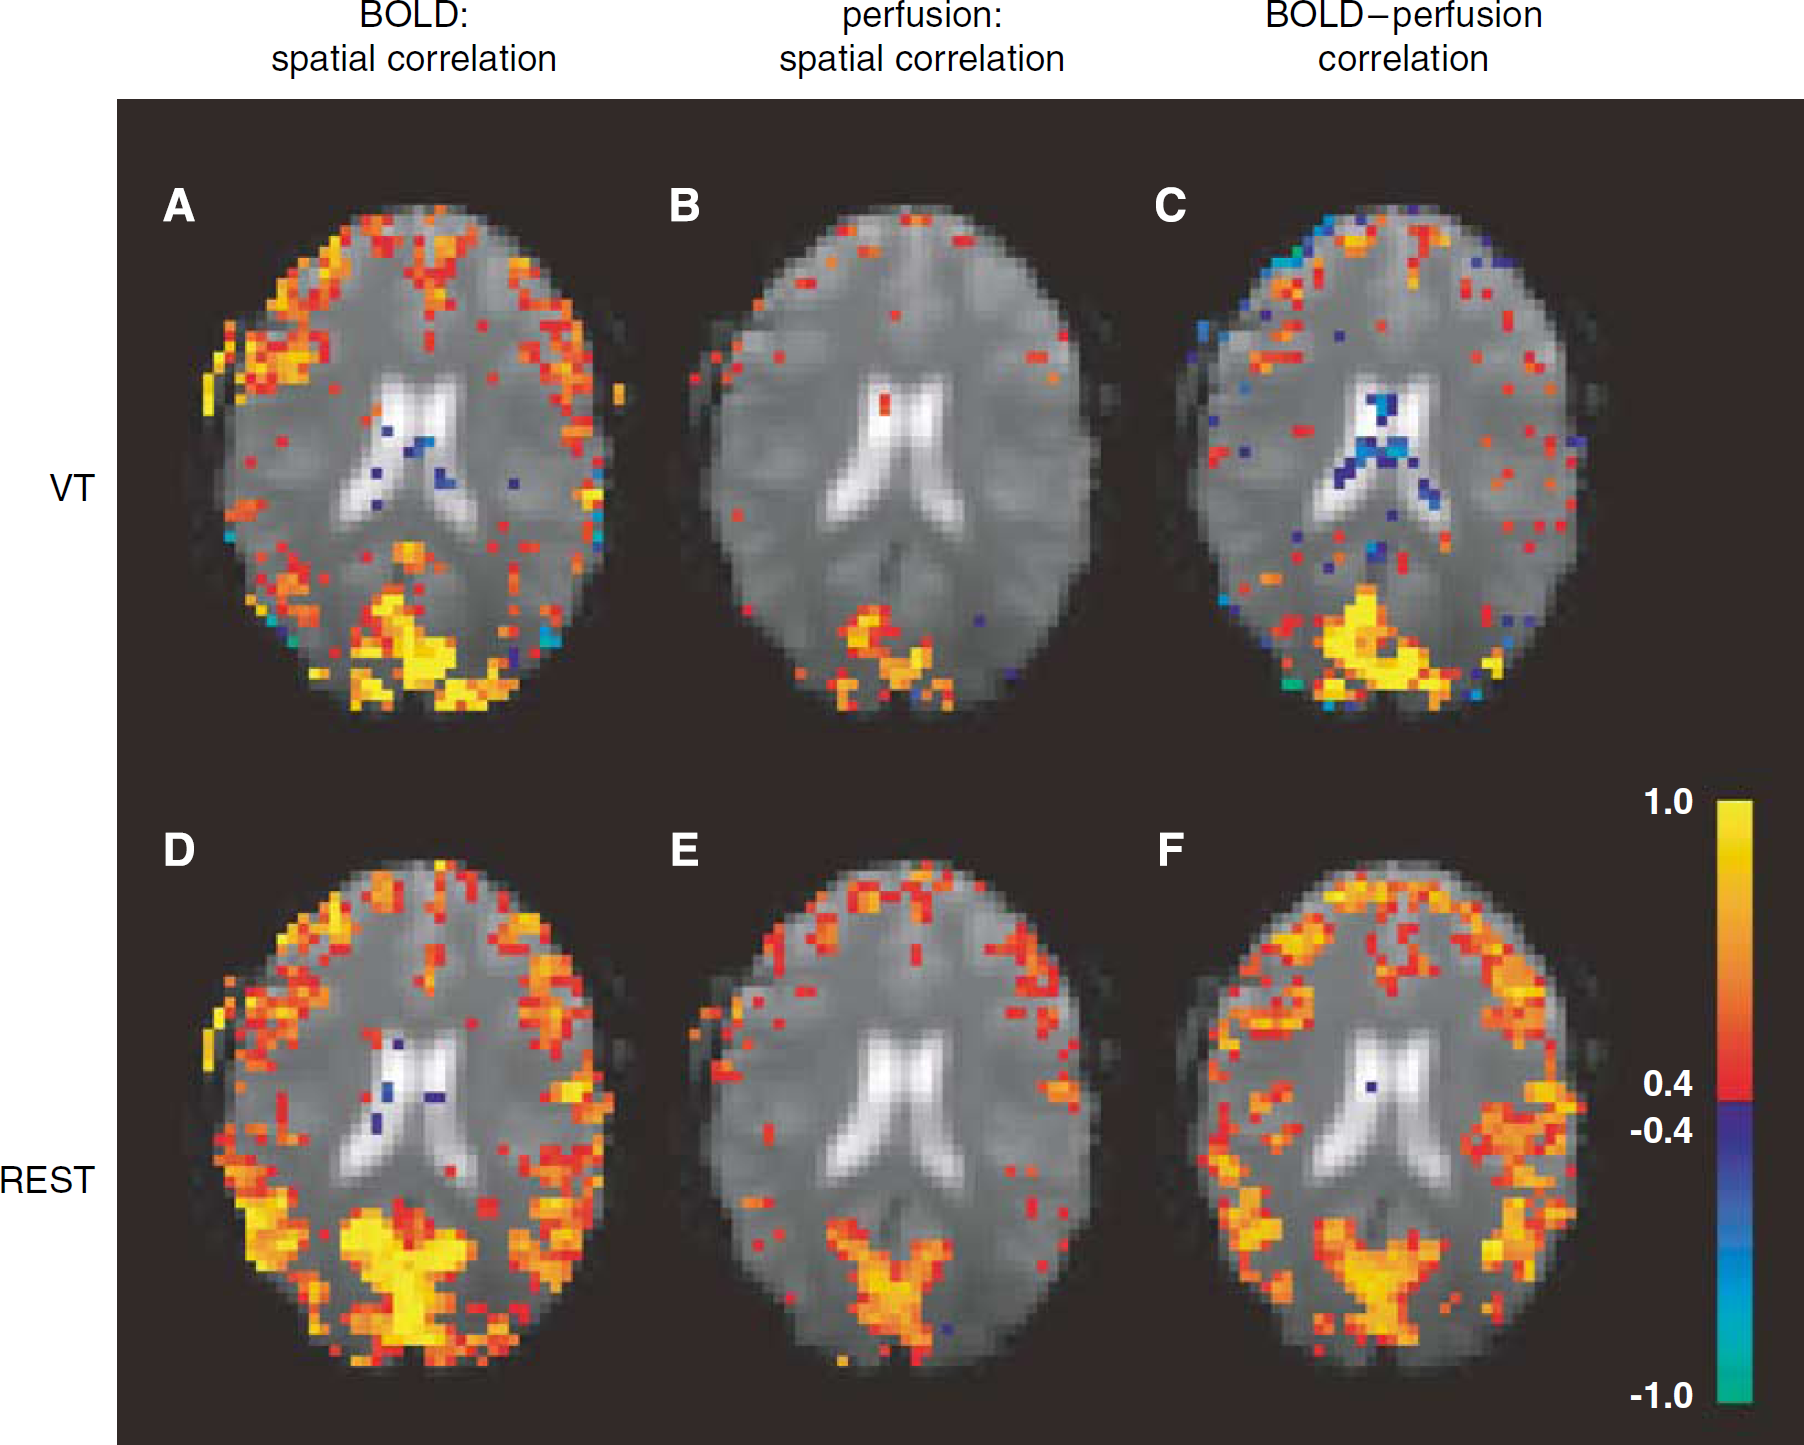
Example (single subject data) of correlated activity (see Methods) in one of the five slices studied. Images in each of the three columns indicate (in color) spatial correlation of BOLD (blood oxygen level-dependent) signal (
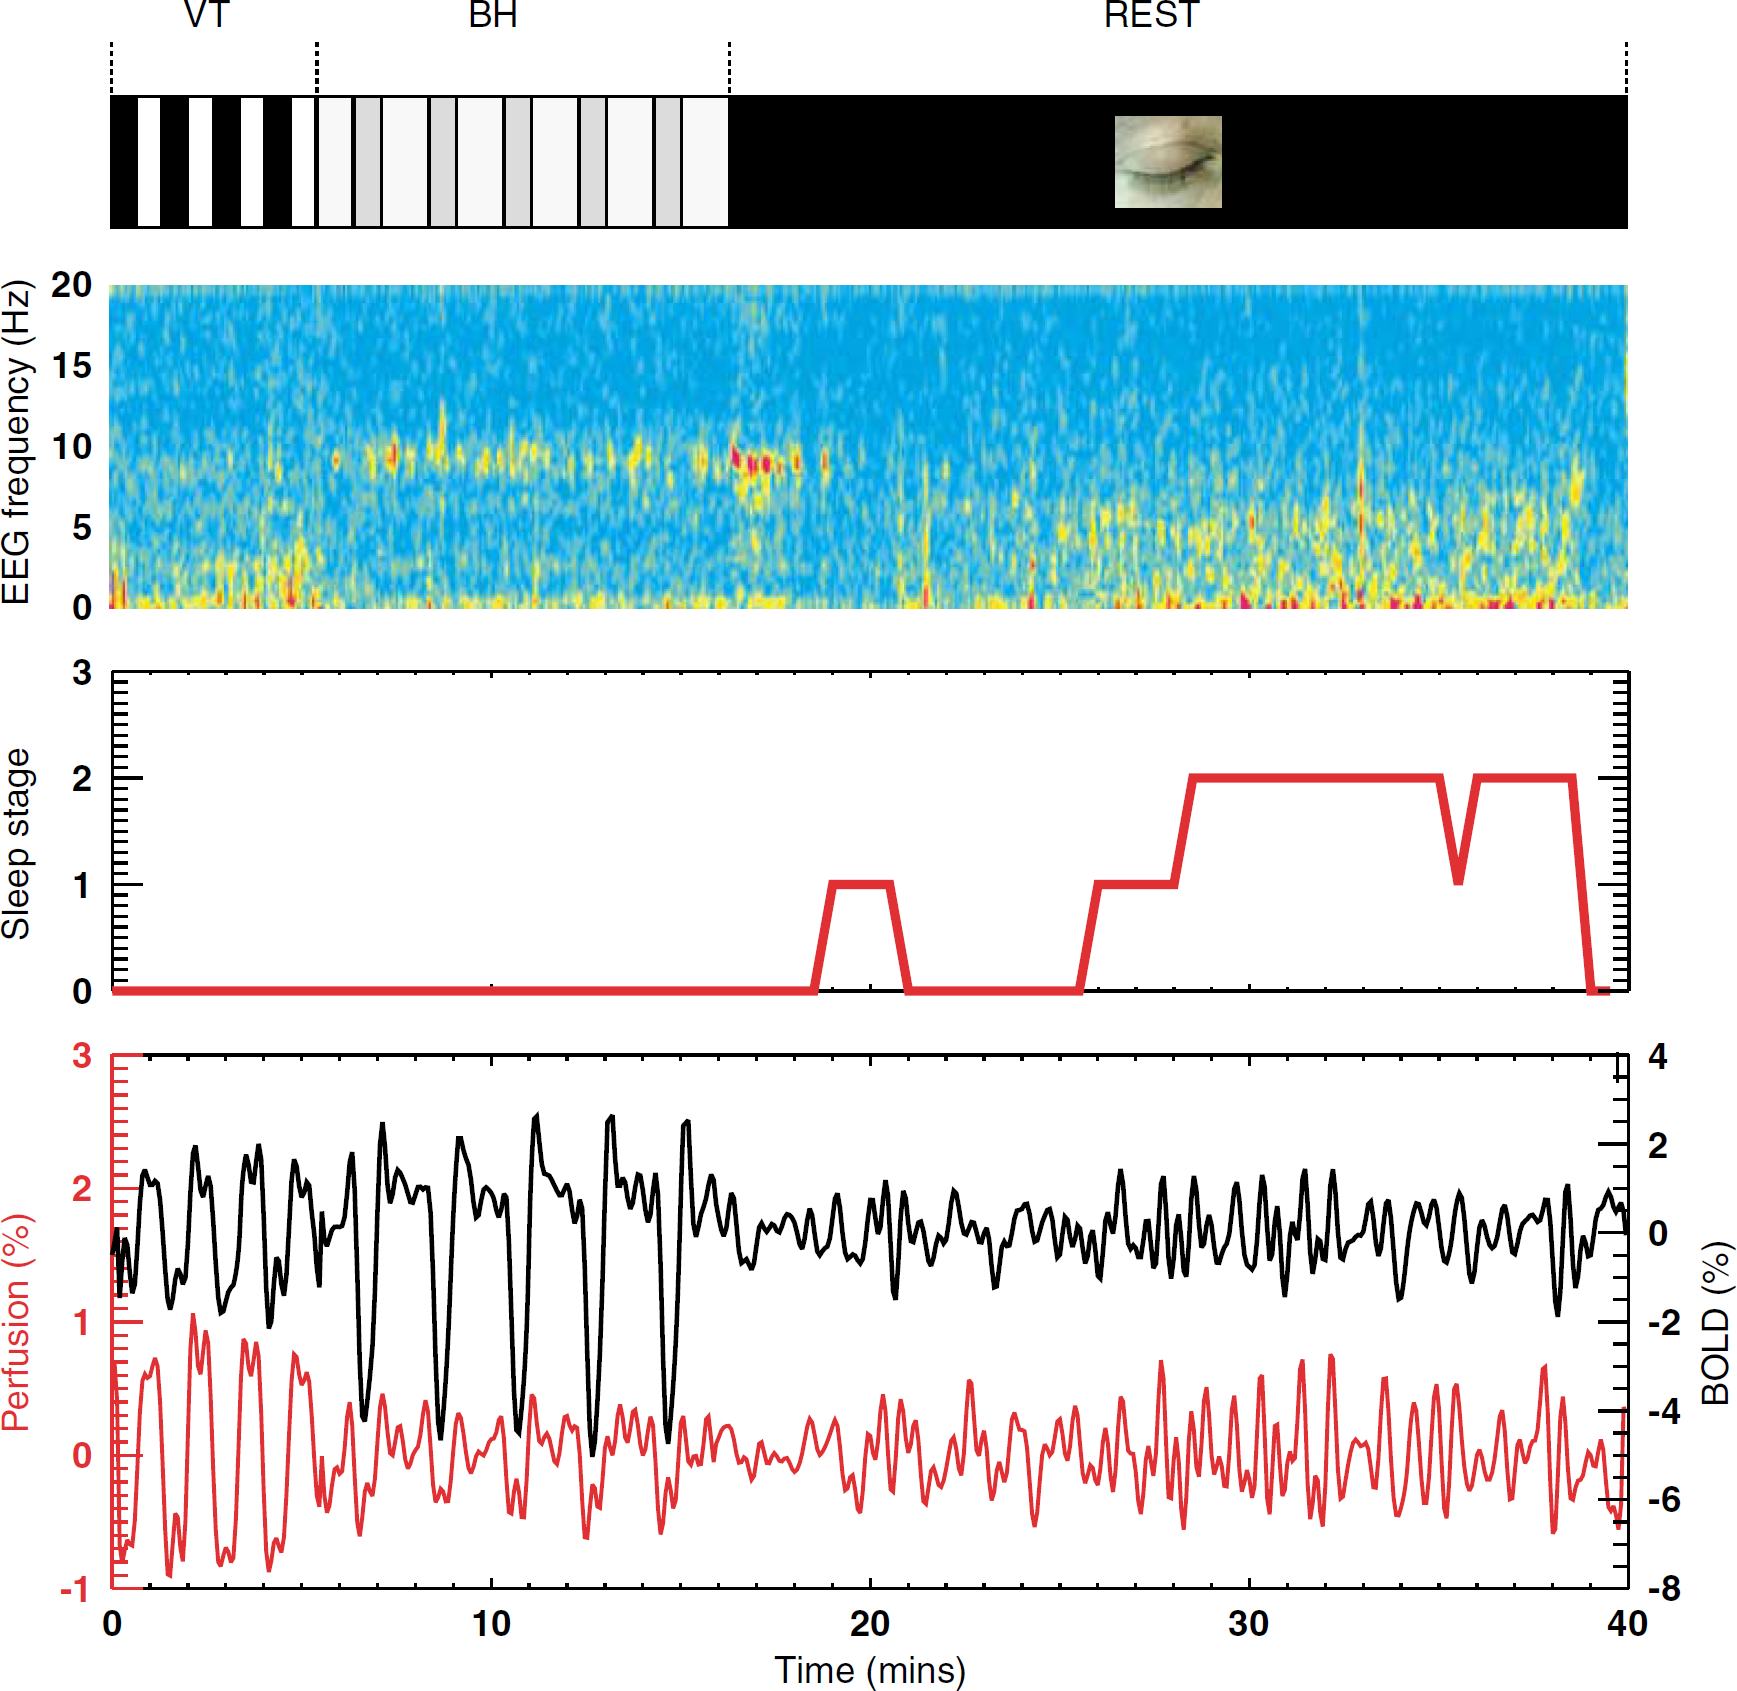
Example of time course EEG signals (parietal electrode), sleep stage, and BOLD and perfusion signals in the visual cortex (region activated during VT). Perfusion signals were normalized to baseline BOLD signal (see Methods). Image segments (top to bottom) show experimental timeline, EEG spectral amplitude, sleep stage (see Methods), and average fMRI signal evolution in functional region of interest. BOLD (black line) and perfusion fMRI (red line) signals show substantial correlated activity during each of the experimental stages, including VT, BH, and REST. This activity persists during sleep periods (sleep stage > 0), which is characterized by a reduction in alpha power (8 to 12 Hz), and an increase in extended theta power (2 to 7Hz). BH, breath-holding; BOLD, blood oxygen level-dependent; EEG, electroencephalography; fMRI, functional magnetic resonance imaging; VT, visual task.
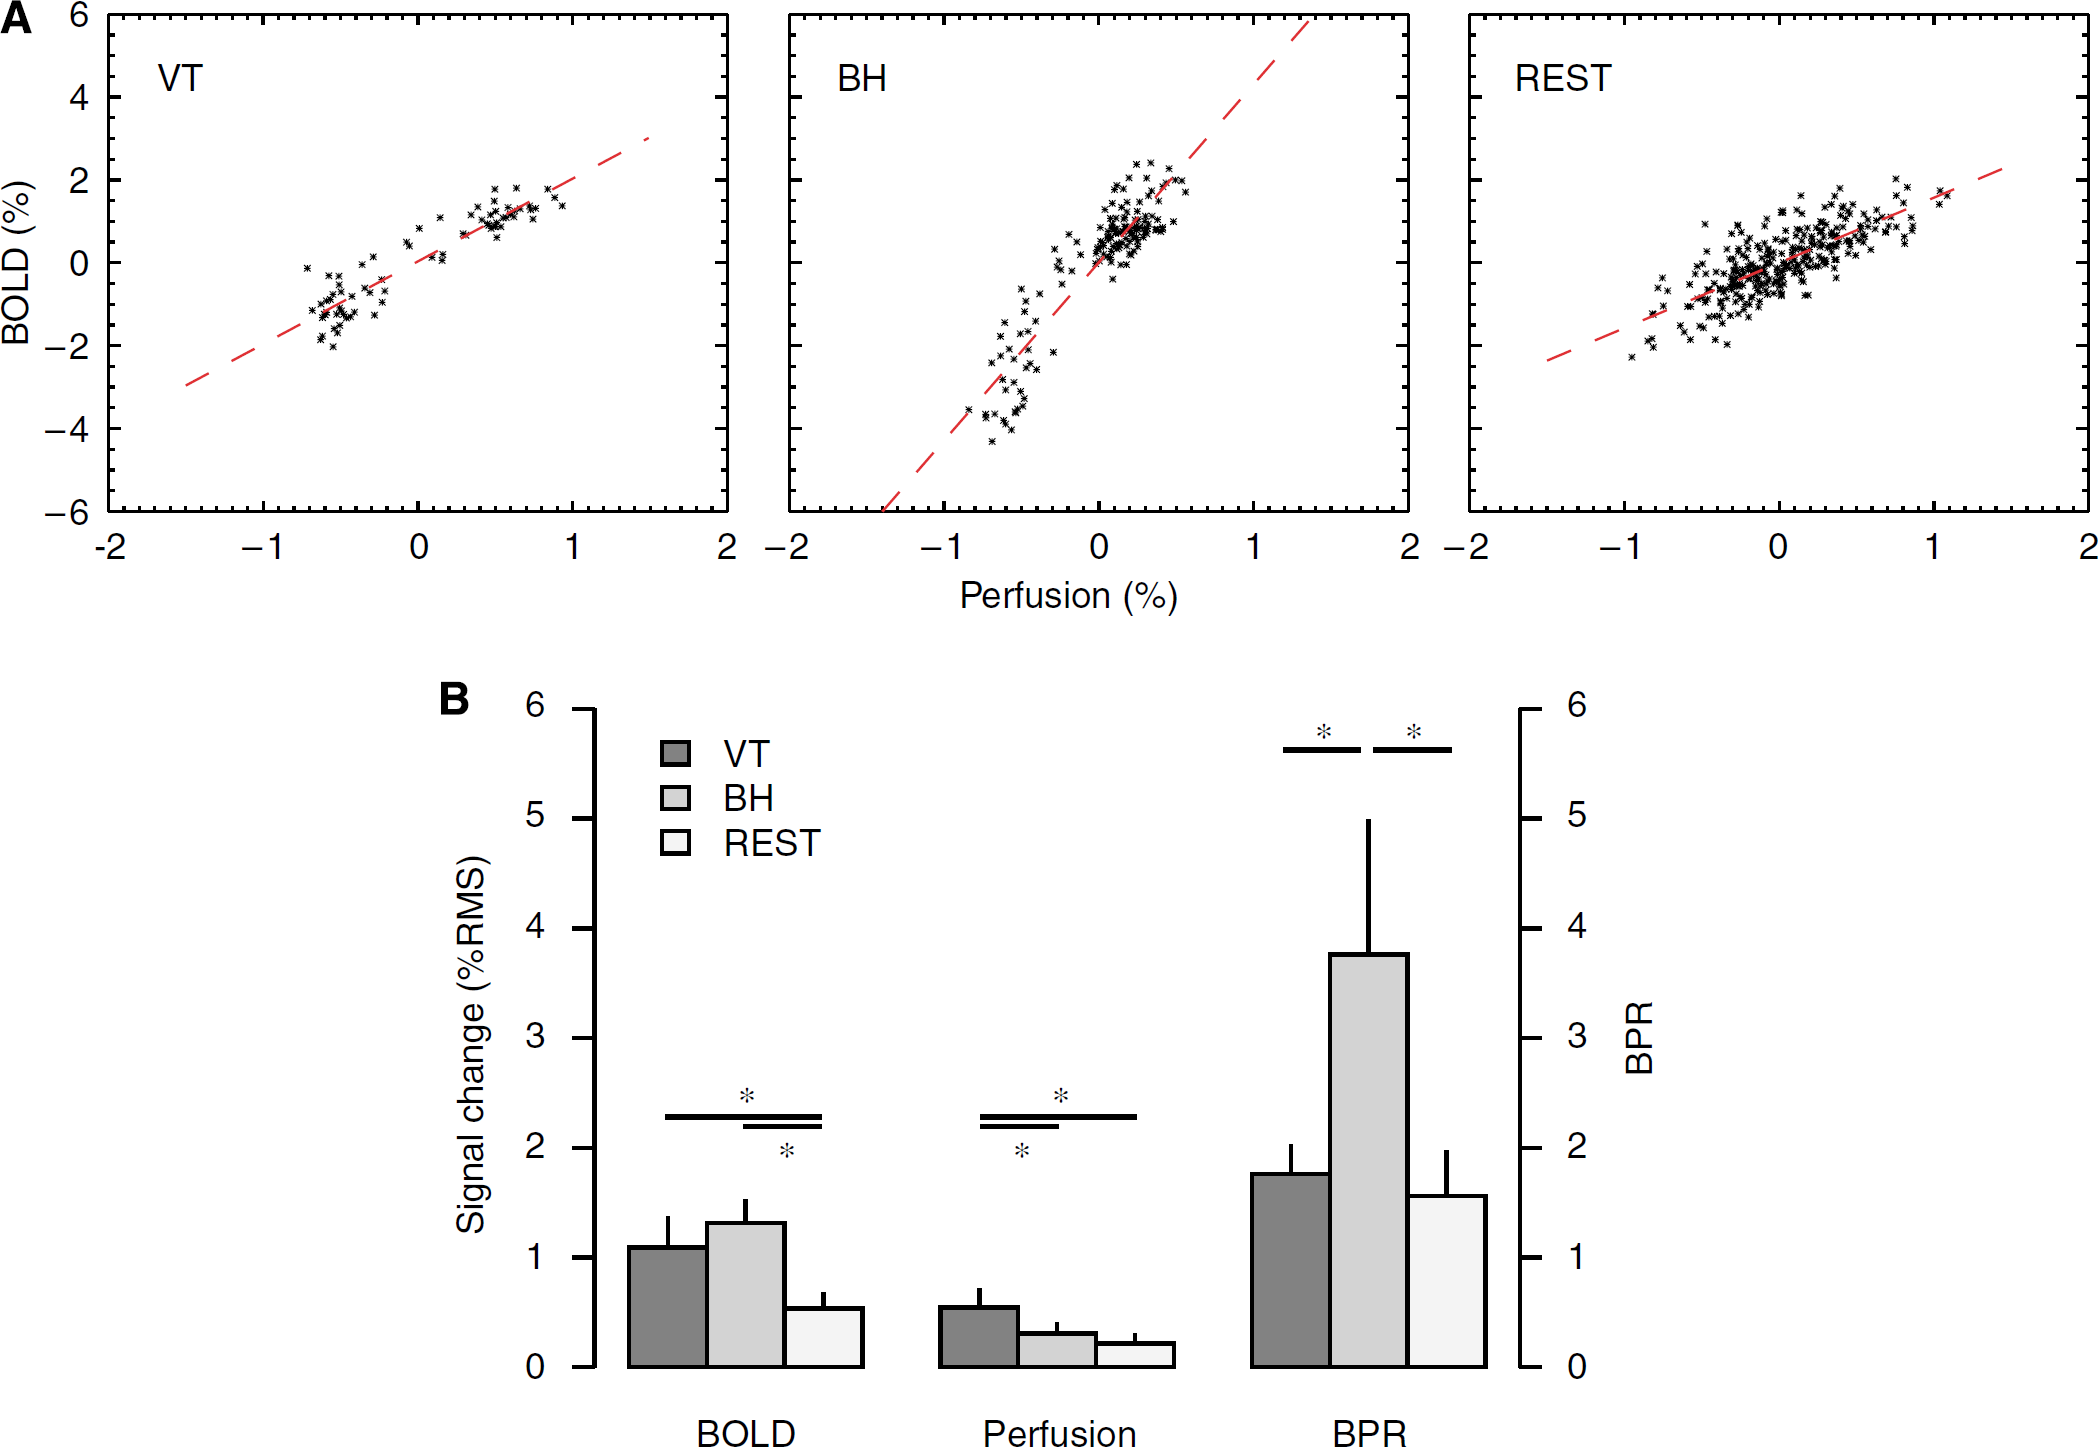
Perfusion and BOLD signals in visual cortex during three experimental stages. (
The average ratios of BOLD and perfusion signals in VC were 1.76 ± 0.27, 3.76 ± 1.23, and 1.56 ± 0.41 for VT, BH, and REST periods, respectively (Figure 5). Normalized to the ratio during VT, the relative BOLD/perfusion ratios during BH and REST (BPRBH and BPRREST) averaged 2.16 ± 0.73 and 0.90 ± 0.25, respectively. BPRBH was significantly higher than BPRVT and BPRREST (
Within VC of sleep subjects, BPRVT, BPRBH, and BPRREST averaged 1.76 ± 0.30, 3.75 ± 1.44, and 1.60 ± 0.47, respectively. Again, BPRBH was significantly higher than BPRVT and BPRREST (
During REST, a substantial correlation between perfusion and BOLD signals was also observed in the ROI derived from seed-point analysis (see Methods). The ROIs in VC, lateral temporo-parietal cortex, sensory-motor cortex, and prefrontal cortex all showed BPRREST; in VC, BPRVT values were also shown, which were significantly higher than BPRBH (Figure 6 and Table 1). In general, for brain regions outside VC, BOLD and perfusion signals did not consistently show sufficient fluctuation above noise level to reliably determine BPR during VT. In addition, BPR in these regions might reflect a mixture of ongoing and task-evoked activity. In fact, BPRVT was often unreliable because of the low level of correlation outside VC during this stage. This is attributed to a reduced level of signal fluctuation, possibly because of a reduction in ongoing activity owing to increased attention demands during VT (Nir et al, 2006). For this reason, BPRVT values in these regions were not included in the comparison between the various conditions.
Mean fluctuation level (%RMS) of BOLD and perfusion signals and BPR in several brain regions
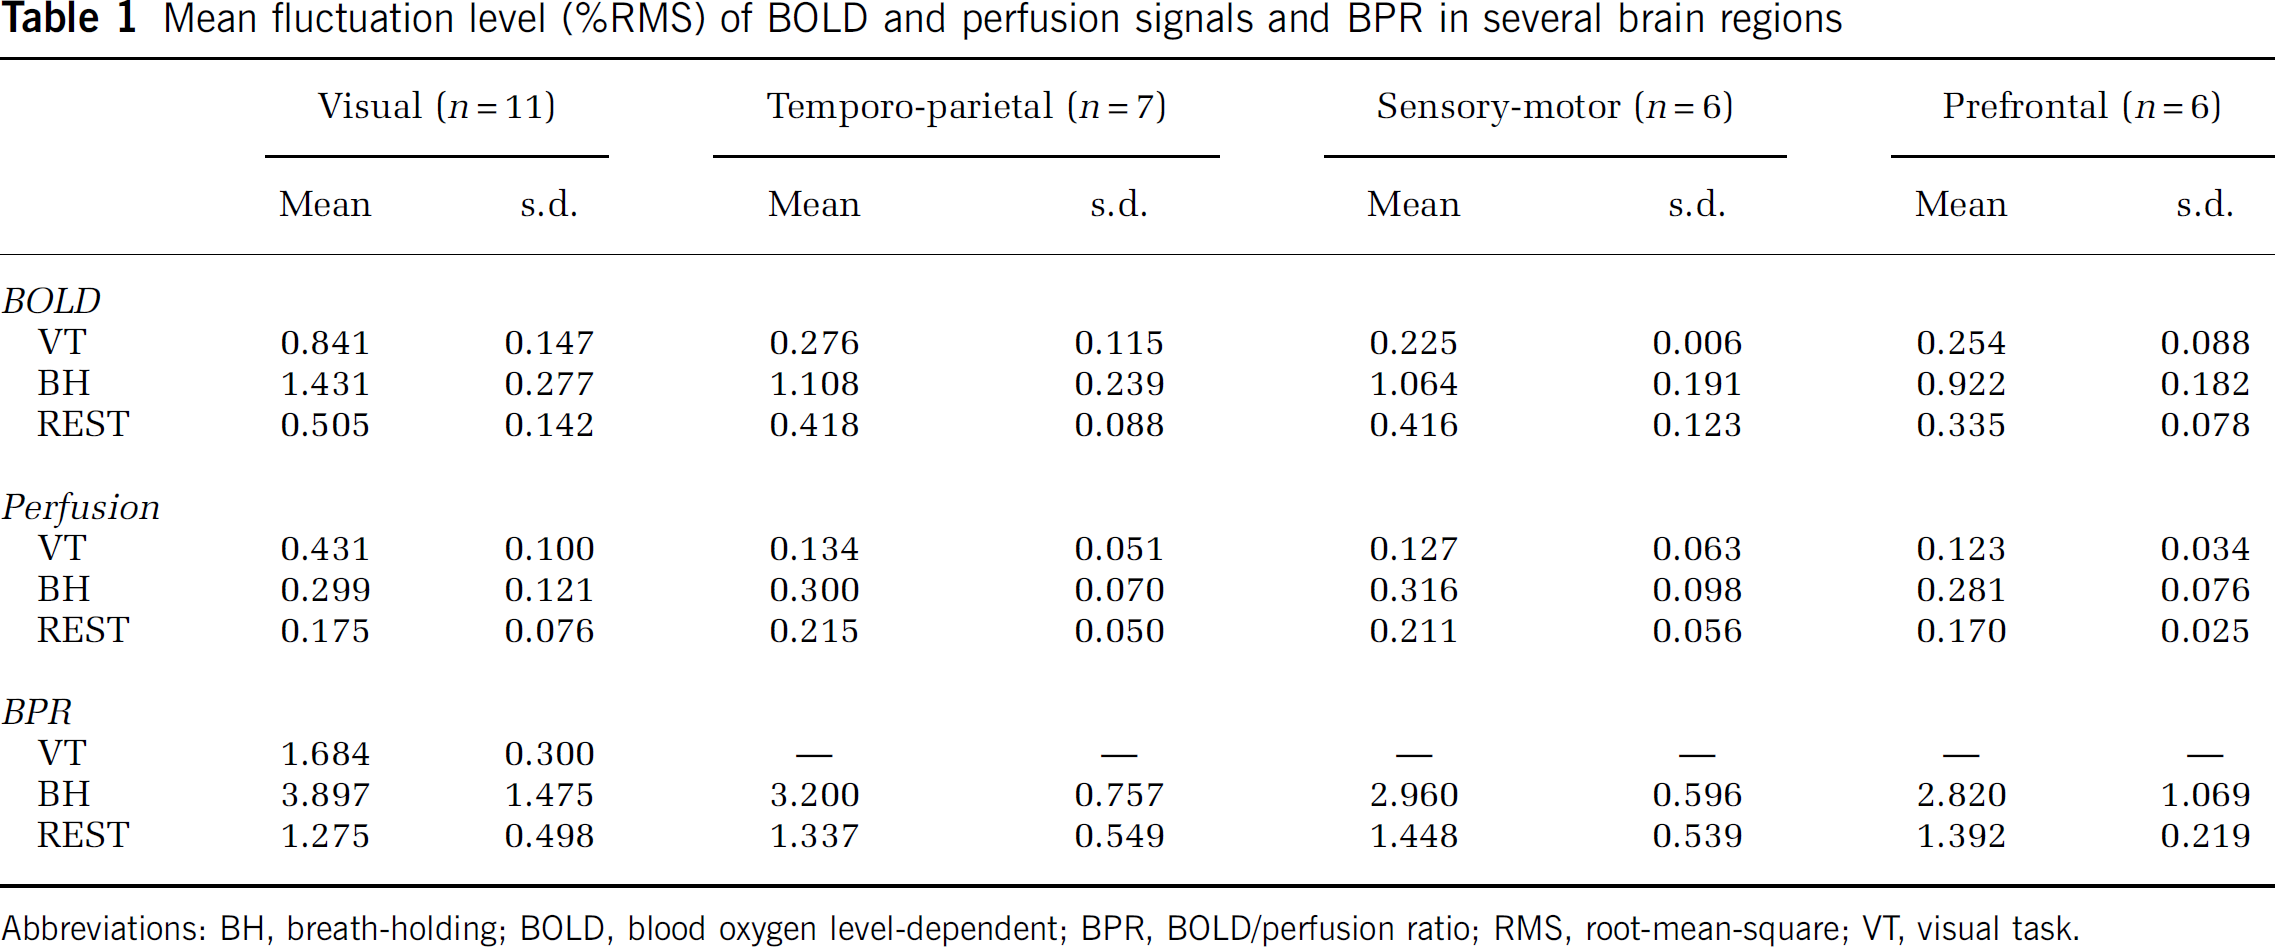
Abbreviations: BH, breath-holding; BOLD, blood oxygen level-dependent; BPR, BOLD/perfusion ratio; RMS, root-mean-square; VT, visual task.
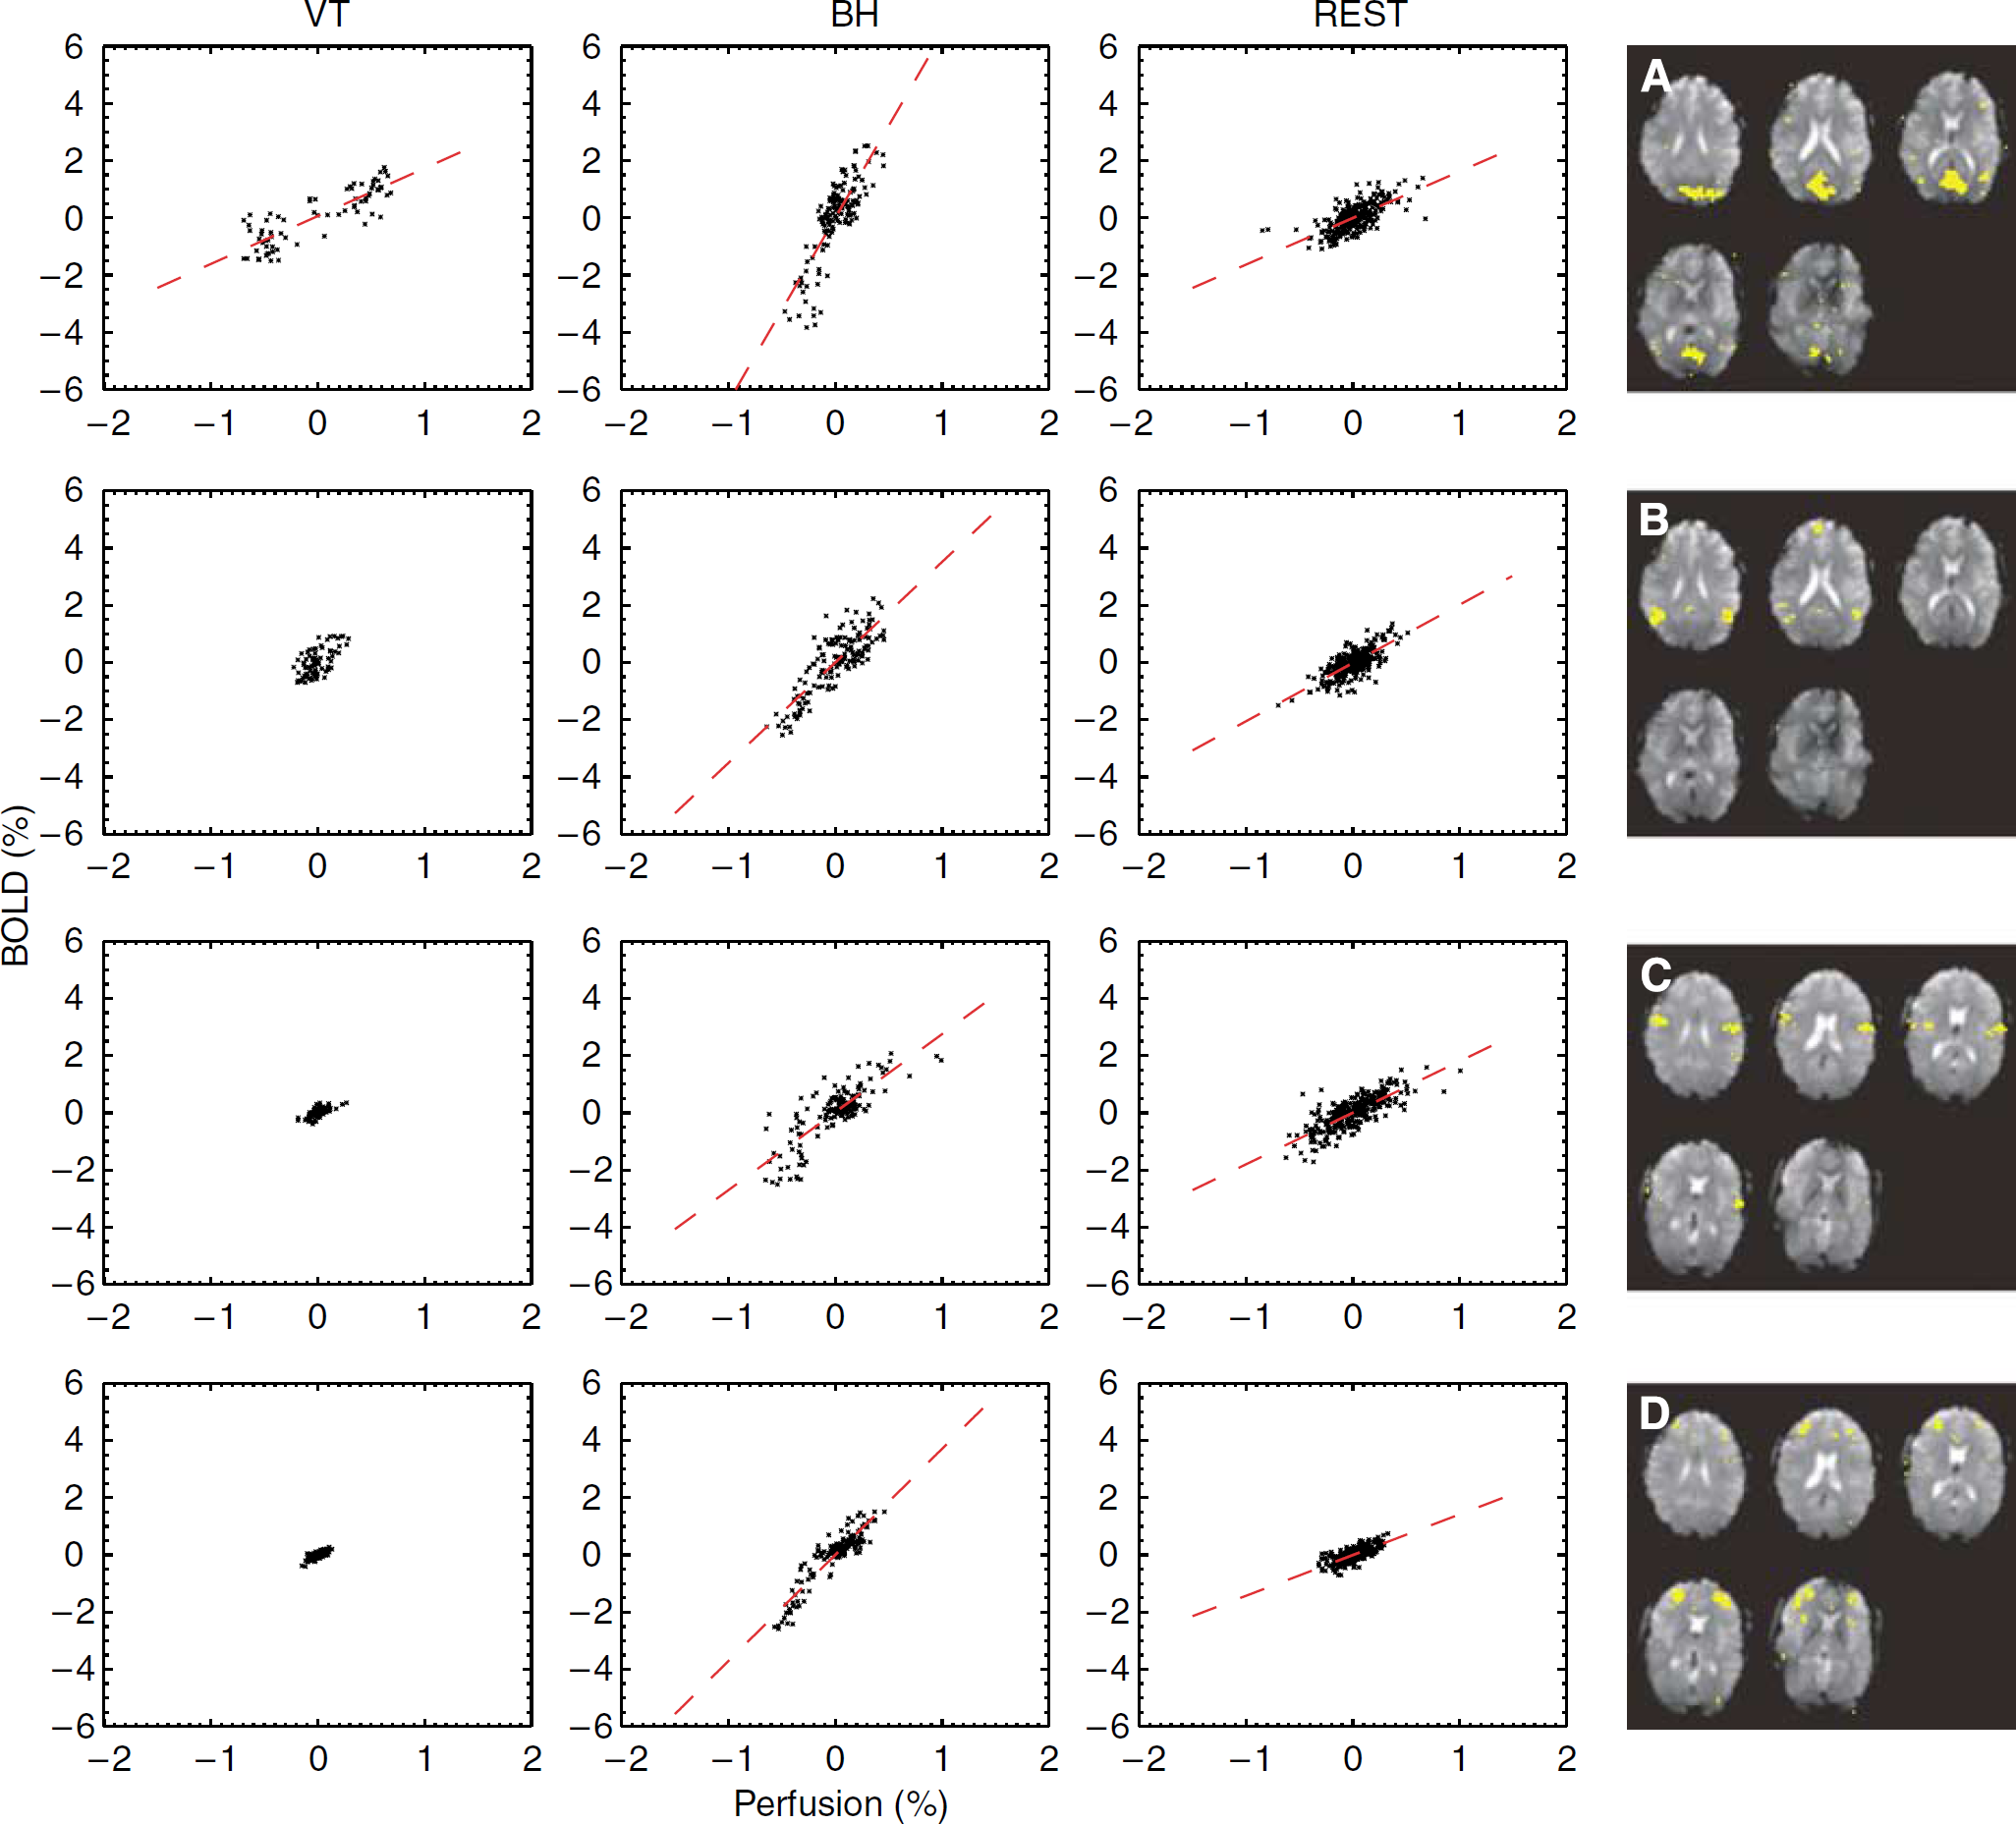
Relationship between BOLD and perfusion signals during each of the experimental stages in a number of regions selected based on seed-point correlation analysis (single subject data). Regions include visual cortex (
Discussion
Major Findings
This is the first human study to investigate metabolic involvement in the phenomenon of spatially correlated BOLD signal fluctuations in the absence of stimuli. Using the fluctuation level of BOLD signal relative to simultaneously acquired perfusion signal, an indicator was derived for relative CMRO2 during rest, and compared with values found during tasks with substantial (VT) and insignificant (BH) metabolic involvement.
The main finding of this study is that in VC during REST, BOLD fluctuations are accompanied by perfusion fluctuations to an extent that is very similar to what occurs during VT, and significantly dissimilar to a BH task. The latter was true in the regions with strong ongoing activity outside VC as well.
This finding suggests that ‘resting-state activity’ is not a purely vascular effect, but has a metabolic component, and possibly supports a functional role. Among the possible candidates are neuronal signaling, homeostatic processes, and plasticity processes.
Additionally, it was found that resting-state metabolic activity does not only occur during waking rest but also during light (stage 1 and 2) sleep. This continued metabolic activity during sleep indicates that the processes underlying BOLD resting-state activity neither exclusively support cognitive activity nor activity underlying conscious awareness and monitoring of the environment, all of which are presumably reduced during sleep.
These findings are consistent with the presence of slow fluctuations (< 0.5 Hz) in cortical oxidative metabolism, which was observed by reflectance spectrophotometry in animals (Vern et al, 1988). Furthermore, as observed in animal studies (Vern et al, 1997, 1988), the observed fluctuations were synchronized over both hemispheres, and maintained during both wake and sleep.
In addition to establishing a metabolic origin of resting-state BOLD fluctuations, the current findings support the notion of a persistent level of brain connectivity during sleep, as suggested previously (Fukunaga et al, 2006; Horovitz et al, 2007). To some extent, this appears contradictory to a recent study that reports a reduced effect of transcranial magnetic stimulation excitation on the spatial extent of EEG activity during sleep as compared with waking rest conditions (Massimini et al, 2005). However, it must be noted that the study reports on slow-wave sleep, and measured effective cortico-cortical connectivity on relatively fast time scales (hundreds of milliseconds), which enabled the identification of a causal relationship (Massimini et al, 2005). In contrast, the current MRI study reports on functional connectivity on a multisecond time scale that might not be causal and/or originate or be guided by secondary nonneocortical regions, such as the thalamus (Steriade, 1999).
Limitations
Although the present study suggests the presence of metabolic processes with apparent functional relevance during rest and sleep, interpretation of the results is subject to a number of limitations.
One of the main limitations of the current study is that it does not allow the determination of absolute levels of cerebral perfusion or CMRO2. This is primarily because of the lack of a perfusion reference scan (scan without perfusion label), which was omitted to improve temporal resolution and accurately detect and capture perfusion fluctuation levels. It is therefore difficult to relate the current findings to positron emission tomographic CBF measurements of sleep, which suggest minimal or no reduction in VC activity during light sleep, and a substantial reduction during stage 3 and 4 non-REM sleep (Braun et al, 1997; for review see Maquet and Phillips, 1998).
Another limitation is the low sensitivity of the methodology, which makes it difficult to derive reliable measures of relative CMRO2 in focal regions outside the VC under all conditions (including a VT). It is hoped that transition to a higher magnetic field (7T), which is currently in progress in our laboratory, will alleviate this problem. Conversely, it will remain difficult to assess CMRO2 on a pixel-by-pixel basis, because of the fact that MRI measures of perfusion and BOLD do not originate from precisely the same location. This is because BOLD signals originate primarily from the venous side of the vasculature, whereas perfusion signals originate primarily from the arterial side.
Lastly, there are limitations to the model assumptions that might affect the comparison of relative level of metabolic fluctuations during the different stages of the experiment. The calculation of BPR values used for this comparison was based on an assumed linearity between BOLD and perfusion signals. With the actual size of perfusion changes occurring in the experiments (estimated at about 40% during VT; see Results), a substantial departure from linearity is expected (see Figure 1). Evidence of this nonlinearity can be seen in Figures 5A and 6, particularly with the BH challenge. In the presence of these nonlinearities, the BOLD—perfusion relationship cannot be accurately described with a single BPR value. This might partly explain the fact that the measured average BPRBH value of 2.16 (relative to BPRVT) was lower than the theoretical estimate of 3.1 derived from equation (3) for small perfusion changes. Other factors that might affect relative BPR levels are the differences in actual and assumed values for α, β, and
Implications
The suggestion that resting-state BOLD activity represents metabolic and, therefore, most likely, functionally relevant processes has potentially important implications for the study of brain function. The findings suggest that the spatial clusters found with resting-state BOLD fMRI represent functional connectivity that is at least in part neuronal, rather than purely vascular in origin. However, they do not exclude the potential for a substantial nonmetabolic contribution, the size of which will depend on experimental conditions. The current findings validate the assumption that systematic identification of correlation clusters might provide an insight into the functional architecture under normal and pathologic conditions. The study of functional connectivity during sleep might provide new insights into the role and mechanistic aspects of sleep. In this context, it appears particularly interesting to use fMRI to study deep (slow-wave) sleep, which is believed to be functionally relevant for recovery and memory consolidation processes.
Footnotes
Acknowledgements
We thank Alan P Koretsky for helpful suggestions and Susan C Fulton for her assistance with the experiments.