
Abstract
Resting-state functional magnetic resonance imaging (rs-fMRI) provides a potential to understand intrinsic brain functional connectivity. However, vascular effects in rs-fMRI are still not fully understood. Through multiple modalities, we showed marked vascular signal fluctuations and high-level coupling among arterial pressure, cerebral blood flow (CBF) velocity and brain tissue oxygenation at < 0.08 Hz. These similar spectral power distributions were also observed in blood oxygen level-dependent (BOLD) signals obtained from six representative regions of interest (ROIs). After applying brain global, white-matter, cerebrospinal fluid (CSF) mean signal regressions and low-pass filtering (< 0.08 Hz), the spectral power of BOLD signal was reduced by 55.6% to 64.9% in all ROIs (P = 0.011 to 0.001). The coherence of BOLD signal fluctuations between an ROI pair within a same brain network was reduced by 9.9% to 20.0% (P = 0.004 to < 0.001), but a larger reduction of 22.5% to 37.3% (P = 0.032 to < 0.001) for one not in a same network. Global signal regression overall had the largest impact in reducing spectral power (by 52.2% to 61.7%) and coherence, relative to the other three preprocessing steps. Collectively, these findings raise a critical question of whether a large portion of rs-fMRI signals can be attributed to the vascular effects produced from upstream changes in cerebral hemodynamics.
INTRODUCTION
In the last few years, the application of resting-state functional magnetic resonance imaging (rs-fMRI) 1 has gained an explosive momentum (see Figure 1 in Birn et al 2 ) because it provides a potential to understand the intrinsic functional connectivity between brain regions and the disruption of functional connectivity in diseased states.1,3–13 The principle of rs-fMRI is based on the observed phenomena that approximately 95% of brain's metabolism occurs due to spontaneous neuronal activity, which possesses intrinsic synchronous oscillations among functionally connected brain regions and may be linked with spontaneous fluctuations of blood oxygen level-dependent (BOLD) signal via neurovascular coupling.1,14
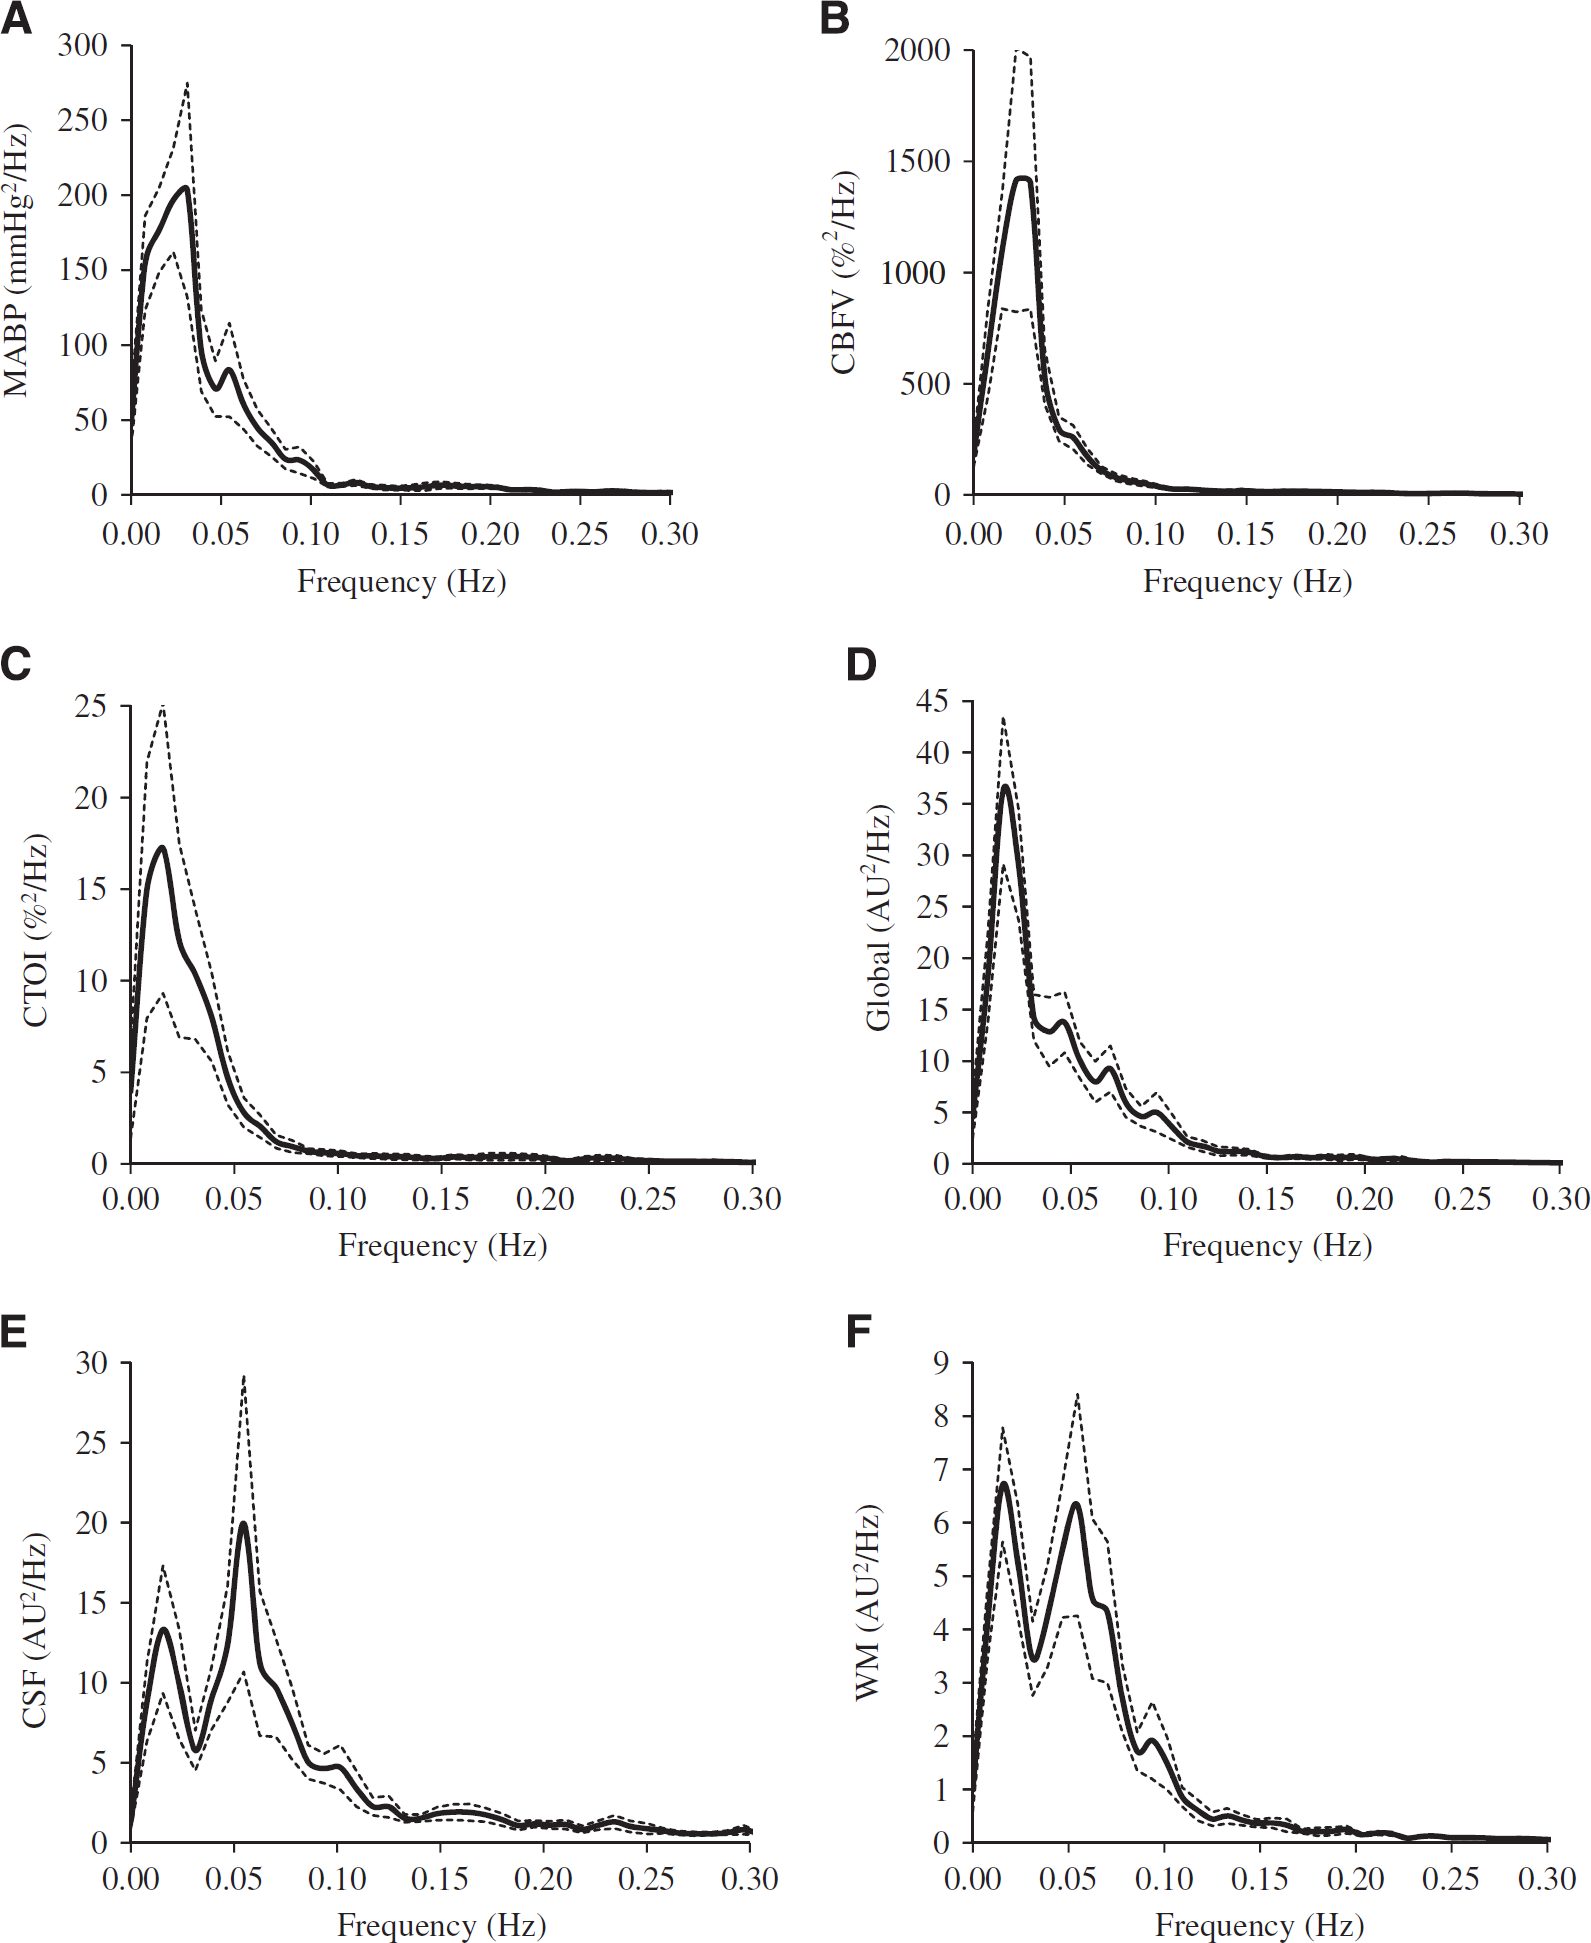
Power spectra (n = 12) of (
With the current MRI technology, the frequencies of spontaneous BOLD fluctuations were found to be < 0.1 Hz.1,15,16 With this discovery, many studies have provided strong evidence indicating the existence of correlated neuronal activity among structurally related anatomic regions.3,5,12,13,17,18 However, it has been well recognized since its inception that BOLD signal in essence reflects regional microcirculatory changes in cerebral hemodynamics, i.e., changes in cerebral blood flow (CBF), cerebral metabolic rate for oxygen utilization, and cerebral blood volume. Furthermore, it is possible that BOLD signal is also influenced by the upstream vascular changes related to pulsatile blood pressure and respiratory oscillations. 19 Therefore, the fundamental question of how to dissect, if at all possible, the vascular contributions to BOLD signal that are independent of changes in neuronal activity has been a great challenge for rs-fMRI studies. 20
Given the pulsatile nature of the systemic circulation and the well-recognized respiratory effects on arterial pressure, cardiac output, and heart rate, all of which influence brain perfusion, earlier studies have focused on reducing the vascular effects on BOLD signal at the cardiac (~1 Hz) and respiratory (~0.3 Hz) frequencies. 21 Specifically, temporal changes in BOLD signal were sampled at a frequency which at least doubled the observed cardiac frequency (the Nyquist frequency), and then were low-pass filtered to remove the cardiac- and respiration-induced signal fluctuations. For example, a sampling frequency of BOLD signal needs to be at least 2 Hz to prevent aliasing of the 1-Hz cardiac signal to a lower-frequency range. Then, low-pass filtering with a cutoff frequency of 1 Hz would reduce the cardiac signal, and low-pass filtering with a cutoff frequency of 0.3 Hz would reduce the effects of both cardiac and respiratory signals on the BOLD signal. However, application of this approach in fMRI studies with full-brain coverage would be difficult for utilizing a practical signal acquisition paradigm at a sampling frequency of approximately 0.5 Hz. To resolve this issue, researchers have developed retrospective correction techniques based on heart rate and respiration recordings to reduce signal aliasing induced by low-frequency sampling of BOLD signal.22,23
Along this line of research, the much greater challenging, but less recognized and less studied aspect is the potential impact of the low-frequency CBF fluctuations on rs-fMRI.24–26 With the advent of transcranial Doppler (TCD) for measuring changes in CBF velocity (CBFV) in the basal cerebral arteries with high temporal resolution, we and others have documented the presence of marked spontaneous oscillations in CBFV in human subjects.24,25 The power spectral distribution of changes in CBF velocity obeys the inverse power law (1/f) and possesses predominant fluctuations at the frequencies of < 0.1 Hz.24,25 Interestingly, these low-frequency CBF fluctuations appear to be related directly to spontaneous changes in systemic arterial pressure and partial pressure of CO2 through both feed-back and feed-forward regulatory mechanisms. 27 More recently, we and others have also showed that upstream CBF oscillations recorded in the middle cerebral artery using TCD can be transmitted into microcirculation as revealed by simultaneous and coherent changes in brain tissue oxygenation measured by spatially-resolved near-infrared spectroscopy (NIRS), which quantifies changes in oxy- and deoxygenated hemoglobin. 28 In addition, these spontaneous low-frequency CBFV and brain tissue oxygenation oscillations appear to be influenced by aging and cognitive tasks. 26 These observations highlight the importance for a better understanding of the impact of low-frequency vascular signals on BOLD signal. 2
In this study, using a multi-modality approach with combined measurements of rs-fMRI, brain tissue oxygenation using NIRS, CBFV using TCD and systemic arterial blood pressure, we tested the hypothesis that spontaneous fluctuations of BOLD signal have a similar power spectral distribution as those observed in systemic arterial pressure, CBFV, and brain tissue oxygenation. In addition, we assessed the impact of the current commonly used rs-fMRI preprocessing procedures on the BOLD signal power spectral distribution as well as the coherence function between BOLD fluctuations obtained from six brain regions that are commonly used in rs-fMRI functional connectivity studies.
MATERIALS AND METHODS
Subjects
Twelve healthy older adults (65 ± 6 years old, 4 females) with normal cognitive function (mini mental state examination score = 29±1), blood pressure (systolic and diastolic blood pressure = 129 ± 18 mm Hg and 80±9 mm Hg), and heart rate (65 ± 9 beats per minute) participated in this study. A comprehensive physical examination including 2-D Doppler echocardiogram, 12-lead electrocardiogram, and neurologic examination was preformed to exclude cardiovascular and neurologic diseases. All subjects signed consent forms approved by the Institutional Review Boards of the University of Texas Southwestern Medical Center and Presbyterian Hospital of Dallas.
Physiologic Measurements
Physiologic data were collected in an environmentally controlled laboratory (~22°) after subjects rested in the supine condition for > 15 minutes. Subjects were asked to refrain from high-intensity exercise, alcohol, and caffeinated beverage consumption at least 24 hours before the test. Photoplethysmography was used to measure beat-to-beat changes in arterial blood pressure from the middle finger at heart level (Finapres 2300, Ohmeda, Boulder, CO, USA). Arterial blood pressure measured by photoplethysmography correlates well with intraarterial pressure and has been used extensively to quantify the dynamic cerebral pressure-flow relationship. 24 Intermittent recordings of brachial cuff blood pressure further corroborated the measurement of finger arterial pressure and ensured the proper placement of finger cuff throughout data collection (Tango+, Suntech Medical, Morrisville, NC, USA). Heart rate was measured by a three-lead electrocardiogram (Solar 8000M, GE Medical Systems, Milwaukee, WI, USA). Breath-by-breath changes in end-tidal CO2 were measured with capnograph (Capnogard, Novametrix, Wallingford, CT, USA). Cerebral blood flow velocity was measured continuously from the middle cerebral artery using a TCD (Multi-Dop ×2, Compumedics/DWL, Singen, Germany). A 2-MHz TCD probe was placed over the temporal window using a headgear (Spencer Technologies, Northborough, MA, USA) and fixated at a constant angle and depth where the optimal CBFV signal was obtained. TCD has a high temporal resolution (sampling period at 10 ms) and allows noninvasive measurement of beat-to-beat changes in CBF under the assumption that the diameter of insonated blood vessels remains constant or only varies slightly. 29
Brain tissue oxygenation of the prefrontal cortex was measured by spatially resolved NIRS (NIRO-200NX, Hamamatsu Photonics, Hamamatsu City, Shizuoka, Japan) and expressed as cerebral tissue oxygenation index (CTOI), which is the ratio of intravascular oxygenation to total hemoglobin concentration. 30 Cerebral tissue oxygenation index provides a quantitative estimation of cerebral cortex oxygenation and has been used extensively in various clinical conditions. 31 It was recorded at the forehead ipsilateral to the TCD measurement. Spontaneous fluctuations in CTOI reflect changes in brain microcirculatory oxygenation. All hemodynamic data were simultaneously and continuously recorded for 8 minutes with a sampling frequency of ⩾ 250 Hz and stored for offline analysis using a data acquisition system (Acknowledge, BIOPAC Systems, Goleta, CA, USA).
Physiologic Data Analyses
Hemodynamic data were analyzed using Acknowledge (BIOPAC Systems) and DADiSP (Newton, MA, USA) software according to the procedures described in detail elsewhere. 24 First, all hemodynamic data were averaged in each cardiac cycle to obtain beat-to-beat values. Cerebral blood flow velocity was normalized to a mean value of the entire recording and expressed as percent change (CBFV%). Second, beat-to-beat values of mean arterial blood pressure (MABP), CBFV%, and CTOI were linearly interpolated, resampled at 2 Hz to obtain equidistant time series, and detrended by a third-order polynomial curve fitting. Finally, these data were subdivided into 256-point segments with 50% overlap, and a Hanning window was applied for spectral and coherence function analyses. 24
The power spectra of CBFV, CTOI, and MABP were estimated for each subject. Spectral power of each signal was calculated from the area under the curve of power spectral density. The spectral power and coherence function of these signals were calculated from 0.016 to 0.078 Hz where most of the vascular and rs-fMRI signals are contained (Figure 1). The coherence functions between arterial pressure, CBF velocity, CTOI, and each pair of rs-fMRI region of interest (ROI) measurements (further discussed later) were estimated with the following equation:
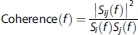
where,
Si(f) and Sj(f) = auto spectra of two signals at frequency f, S ij (f) = cross spectrum of the two signals at frequency f.
For a perfect linear correlation between two signals, the coherence value is 1. When there is no linear correlation, the coherence value is 0.
Magnetic Resonance Imaging Measurements
In a separate session from physiologic measurements, rs-fMRI data were collected on a Philips Achieva 3T scanner (Philips Healthcare, Best, The Netherlands) under an ‘eye-closed’ condition with the following parameters: gradient recalled echo planner imaging, 29 contiguous 5-mm axial slices, 30-ms time of echo, 1,500-ms time of repetition, 60° flip angle, 24-cm field of view, 80×80 matrix size, and 200 time points. High-resolution T1-weighted 3D MPRAGE (Magnetization-Prepared Rapid Acquisition Gradient-Echo) images (matrix size = 256 × 256 × 160 and voxel size = 1 mm × 1 mm × 1 mm) were also collected to cover the whole brain.
Resting-State Functional Magnetic Resonance Imaging Individual-Subject Data Processing
Resting-state fMRI preprocessing was performed using AFNI software 32 in the native space. For each subject, the acquisition timing difference was first corrected for different slice locations. With the last functional volume as the reference, rigid-body motion correction was performed in three translational and three rotational directions. The motion derivatives in these six directions at each time point were estimated and then modeled as regressors in data analysis. For each subject, spatial blurring with a full width half maximum of 4 mm was used to reduce random noise and intersubject anatomic variation. At each voxel, motion-related signal changes, baseline, linear and quadratic system-induced signal trends were modeled as linear regressors from the time courses using the ‘3dDecon-volve’ routine in AFNI, and then were removed from the time courses. To further reduce the system-introduced low frequency noise, the time courses were high-pass filtered at the frequency of 0.009 Hz. These filtered time courses would be used in further ROI and whole-brain analyses.
To create the mean time course from pure cerebrospinal fluid (CSF) regions, the lateral and third ventricles on the high-resolution T1-weighted volumetric images were segmented using FreeSurfer software followed by 1 mm3 erosion. 33 For the same reason, pure white-matter (WM) regions were segmented from the T1-weighted volumetric images using the ‘FAST’ routine in the FSL software 34 followed by 4mmx4mmx4mm cubical erosion. Six ROIs (bilateral isthmi of cingulate cortex (ICCs), hippocampi and lateral occipital cortices (LOCs)) were defined on the 3D MPRAGE images with the FreeSurfer software. 33 Lateral occipital cortices are a part of the visual network, and ICCs belong to a subnet of the default-mode network. 11 Hippocampi have unique functions during memory retrieval and encoding processes. They behave differently from ICCs and thus should be classified to a different subnet of the default-mode network. 35 For the purpose of this work, the homologous ROI pairs were classified as within-network pairs and the non-homologous ROI pairs were classified as outside-network pairs.
For each ROI, as well as CSF, WM, and global brain regions, the preprocessed time courses up to this point across all voxels within a region were averaged to generate the mean time course. Pairwise coherences were calculated according to Equation (1). The methods used for BOLD signal spectral analysis and coherence estimation were similar to those applied to CBFV, CTOI, and MABP. 24 Further common preprocessing steps include the regression of brain global, CSF, and WM mean signals and then low-pass filtering at the commonly used frequency threshold of 0.08 Hz. 36
In the rest of the paper, for convenience, we refer to these steps as the ‘global-CSF-WM regression and low-pass filtering’ procedure. For this study, after the application of these steps in the fMRI time courses, the mean signal time course at each ROI was generated. The power spectra of the mean time courses and the coherence between each pair of them were estimated again based on Equation (1). To understand the impact of each of the four preprocessing steps, we repeated the spectrum and coherence calculations after applying each of the four steps to the same high-pass filtered time courses.
Statistical Analyses
The spectral powers of each ROI before and after the applications of preprocessing steps were compared using paired t-tests and the percent changes were calculated. The changes in coherence before and after the applications of pre-processing steps as well as their region-pair differences were assessed by two-way repeated analyses of variance (pre-processing × region-pair). When a significant F-test was obtained, pairwise post hoc comparisons were performed with Bonferroni correction. The percent changes of coherence were calculated. A P-value of < 0.05 is considered to be statistically significant in all analyses.
A representative case was selected to show how the functional connectivity map was modified due to the ‘global-CSF-WM regression and low-pass filtering’ procedure. In this case study, the left ICC was selected as a seed region. Correlation was calculated between the preprocessed time course of each voxel described earlier and the mean preprocessed time course obtained at the left ICC right before and then after the application of the further ‘global-CSF-WM regression and low-pass filtering’ pre-processing steps.
RESULTS
Spectral Powers
The power spectra of MABP, CBFV, CTOI, and BOLD signals obtained from the global brain, WM, CSF, and the six ROIs all showed concentrated signal power at frequencies < 0.1 Hz as shown in Figures 1 and 2. The power spectra of MABP, CBFV, CTOI, global mean BOLD signal, and the BOLD signals from the six ROIs all had a peak around 0.02 Hz. The power spectra of WM and CSF signals also showed a second peak around 0.06 Hz. The ‘global-CSF-WM regression and low-pass filtering’ procedure reduced BOLD spectral power in all six ROIs (Table 1A) in the magnitude of 55.6% to 64.9% (Table 1B). Table 1A also shows that except for CSF regression, each of the other three preprocessing steps significantly reduced BOLD spectral power in all ROIs. When comparing the percent changes of BOLD spectral power after different preprocessing steps (Table 1B), there was a significant main effect on each ROI. Overall, global signal regression had the largest impact on reducing spectral power (52.2% to 61.7%), followed by WM signal regression (42.2% to 46.9%), then CSF signal regression (10.4% to 19.8%), and finally low-pass filtering (1.0% to 1.8%). Global signal regression had a significantly greater impact than both CSF regression and low-pass filtering at each ROI, but its significant difference from WM regression was not found (Table 1B).
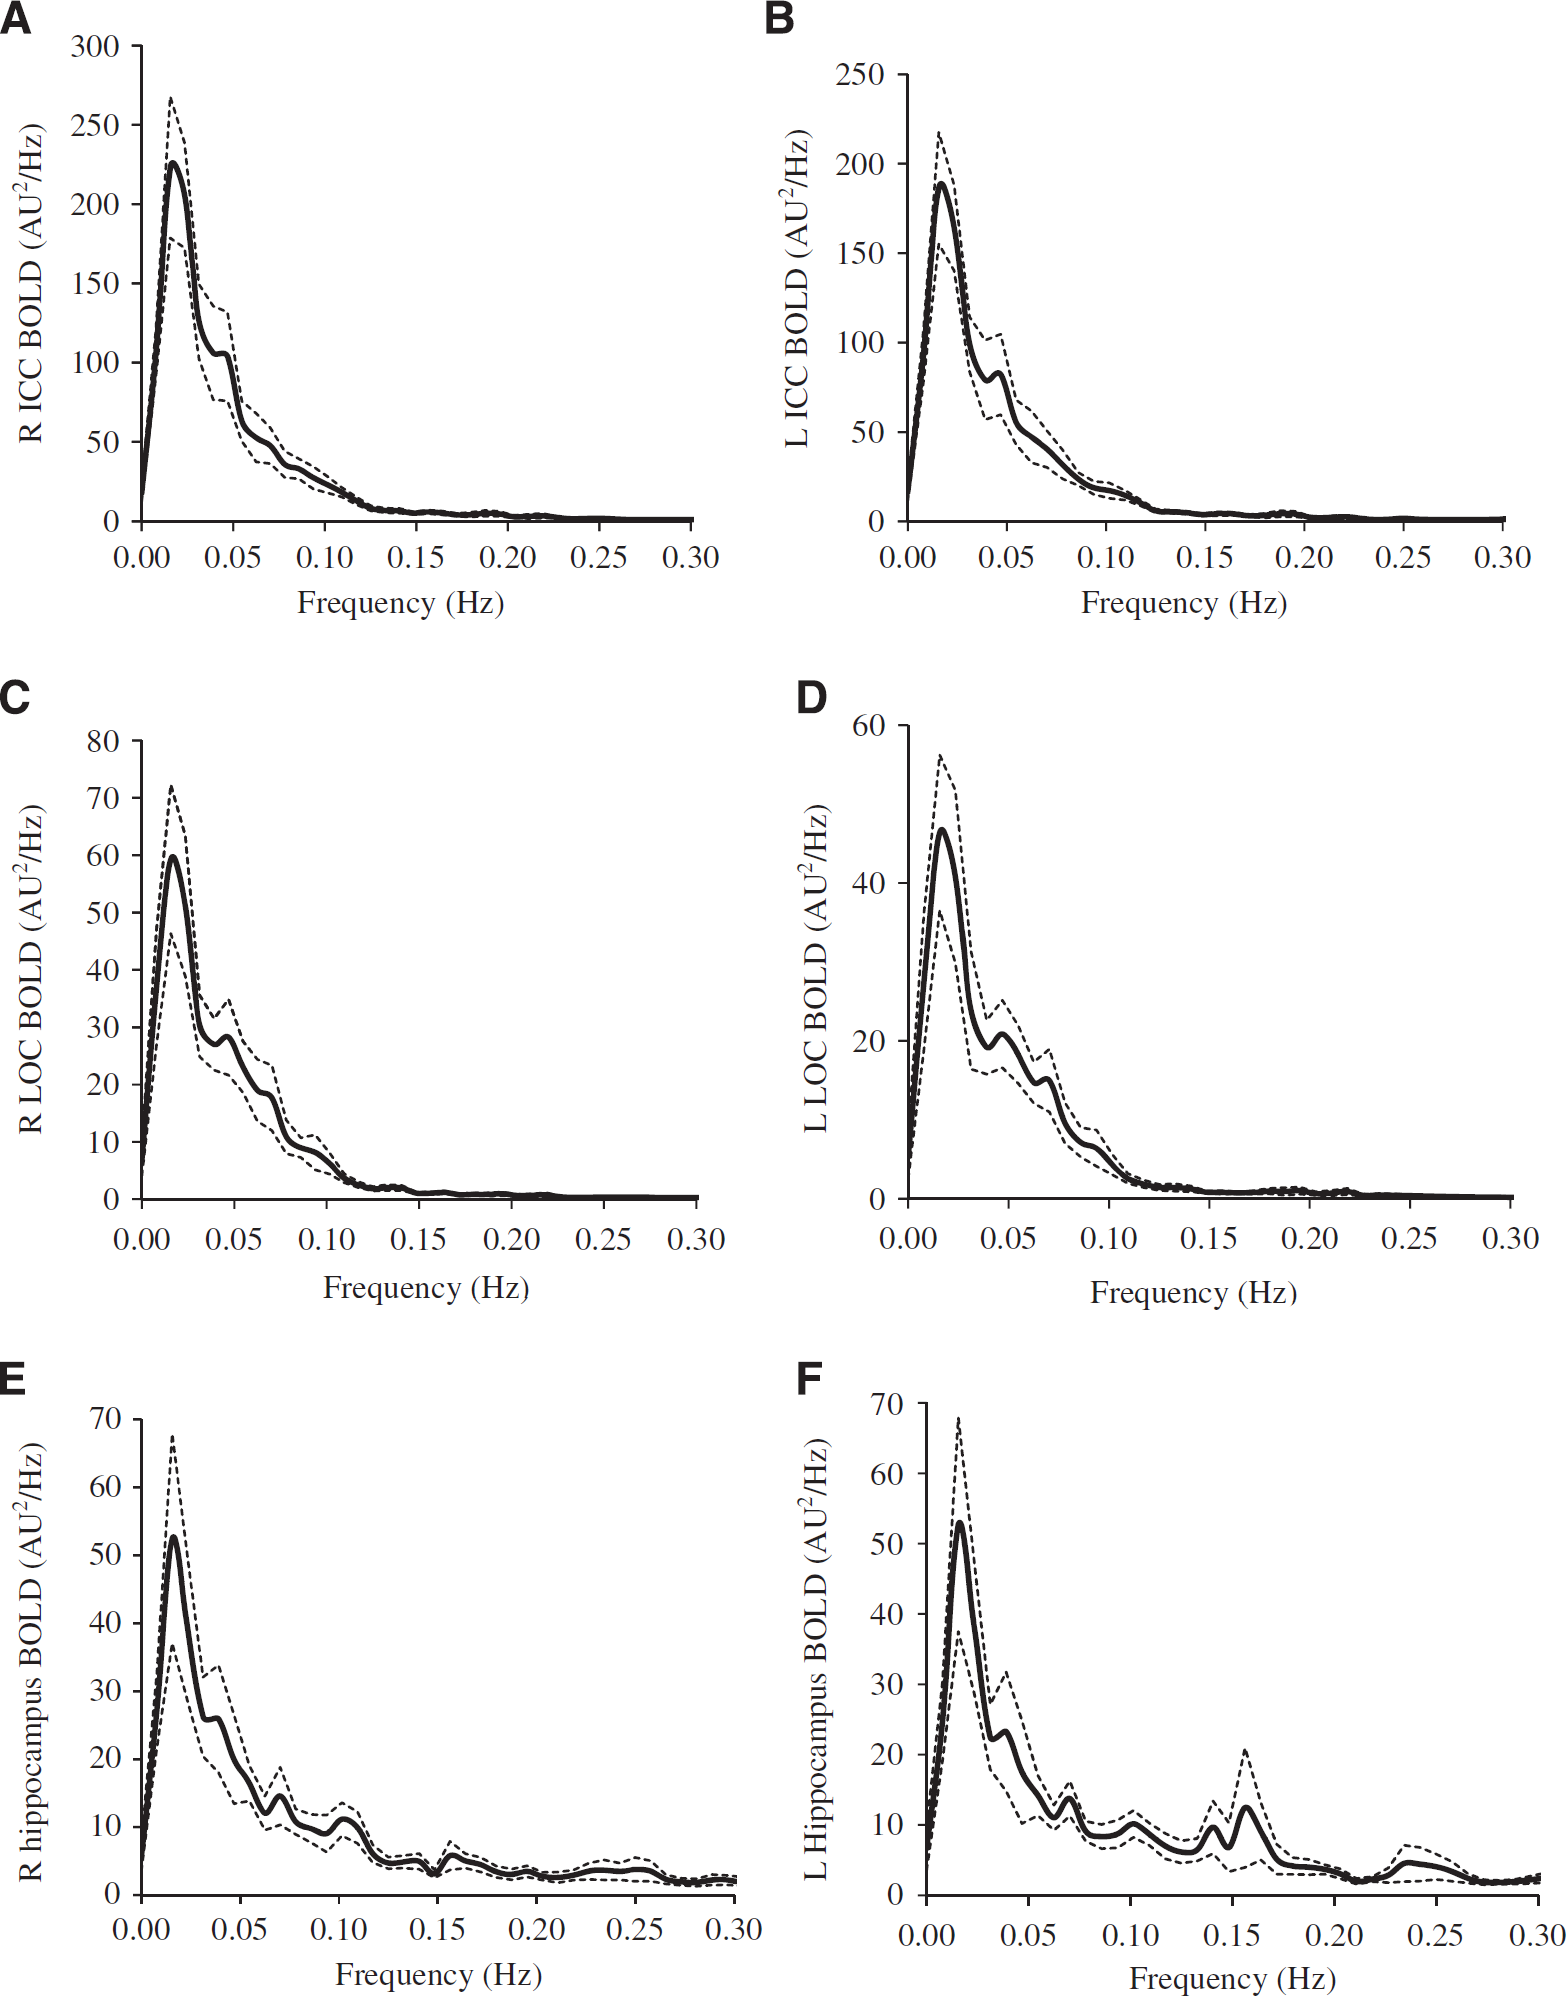
Power spectra (n = 12) of mean blood oxygen level-dependent (BOLD) signals at (
The effect of preprocessing steps on spectral power of BOLD signals within regions of interest
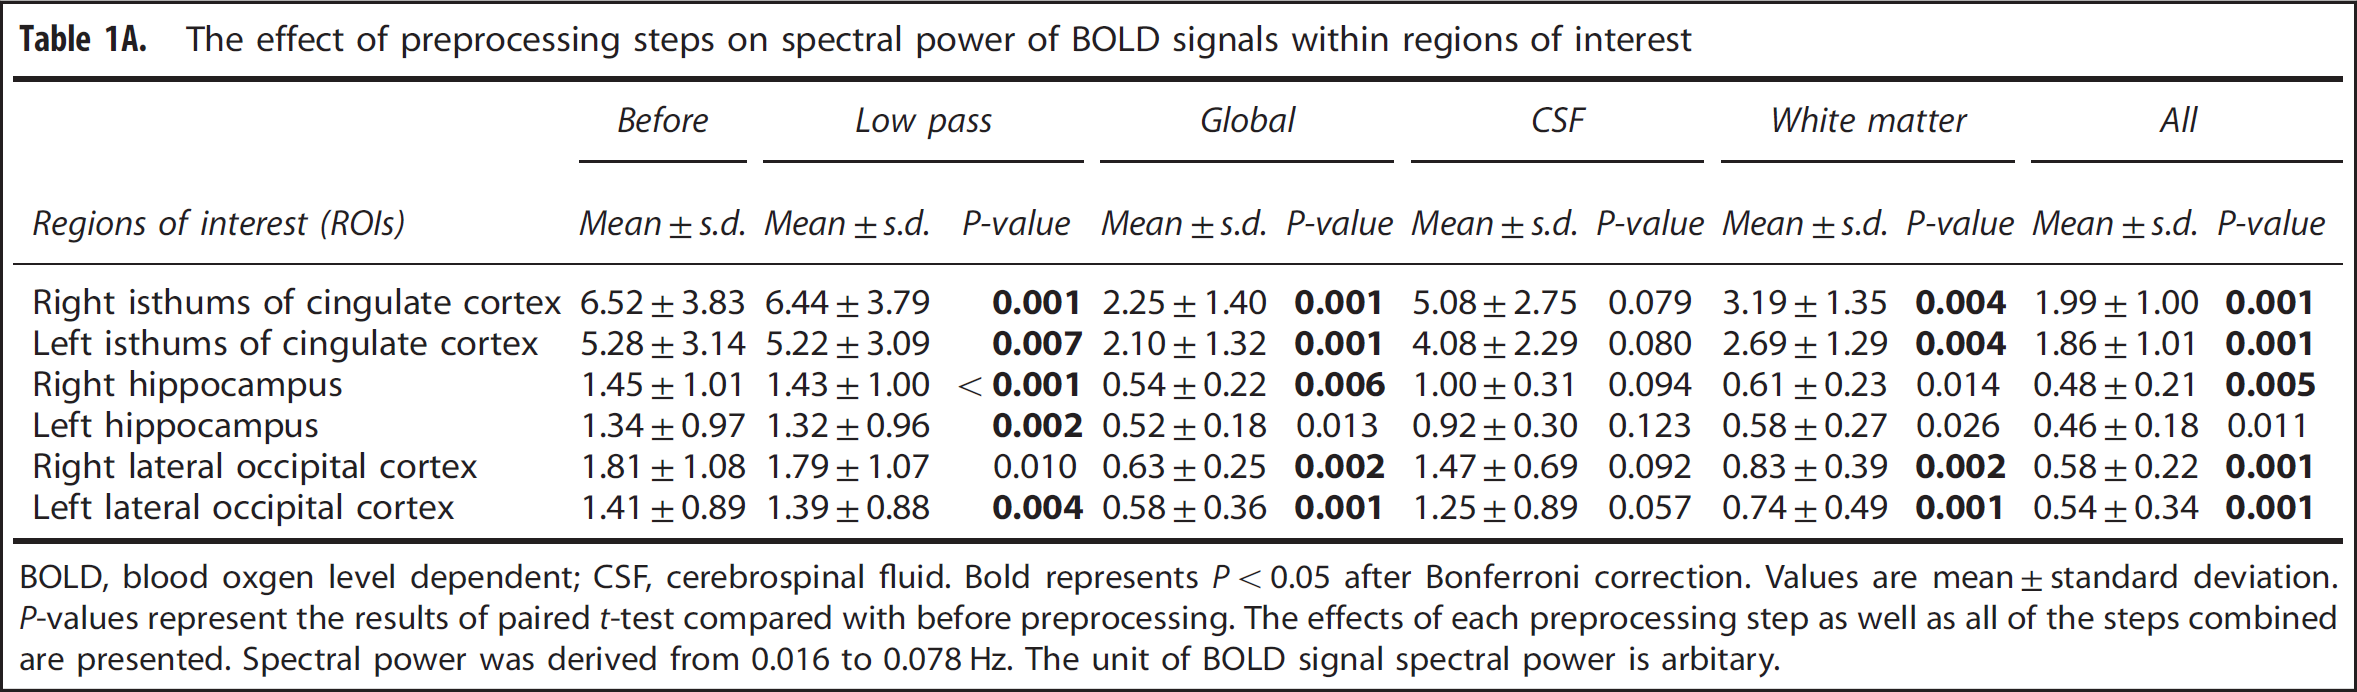
BOLD, blood oxgen level dependent; CSF, cerebrospinal fluid. Bold represents P < 0.05 after Bonferroni correction. Values are mean ±standard deviation. P-values represent the results of paired t-test compared with before preprocessing. The effects of each preprocessing step as well as all of the steps combined are presented. Spectral power was derived from 0.016 to 0.078 Hz. The unit of BOLD signal spectral power is arbitary.
Percent changes in BOLD spectral power before and after preprocessing steps
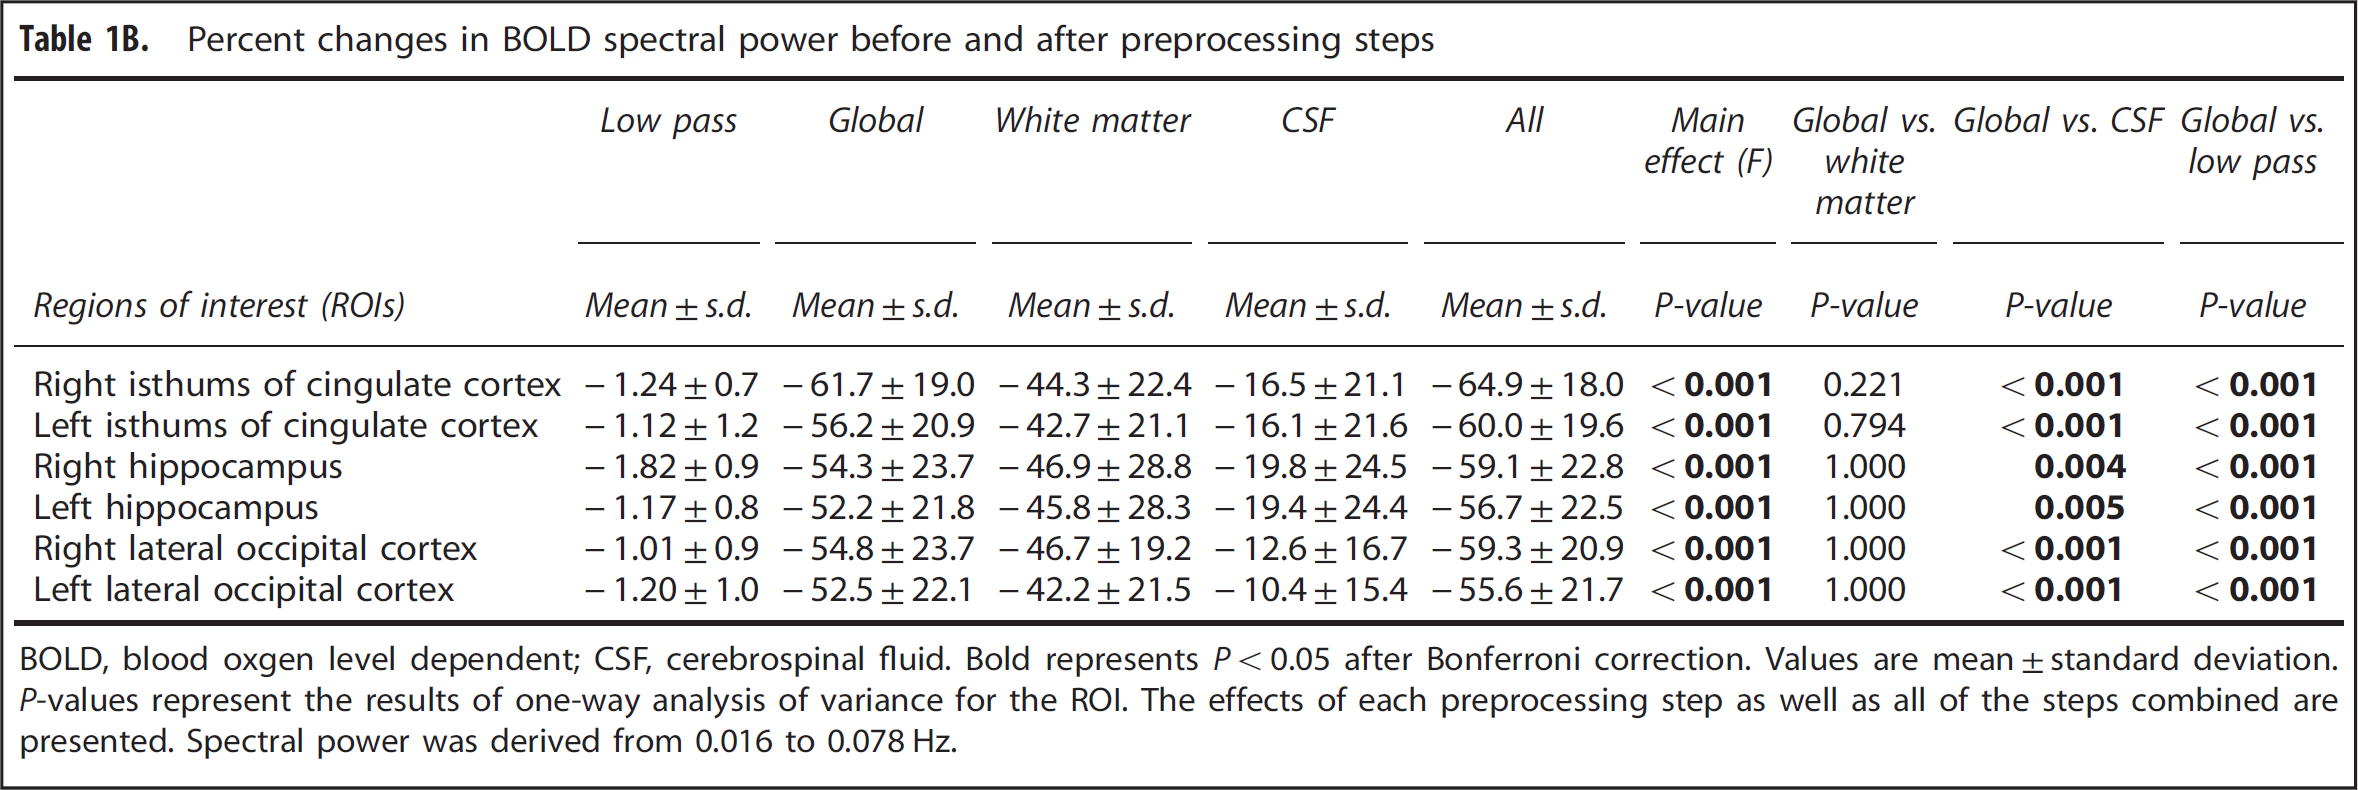
BOLD, blood oxgen level dependent; CSF, cerebrospinal fluid. Bold represents P < 0.05 after Bonferroni correction. Values are mean ± standard deviation. P-values represent the results of one-way analysis of variance for the ROI. The effects of each preprocessing step as well as all of the steps combined are presented. Spectral power was derived from 0.016 to 0.078 Hz.
Coherence Functions: Effect of Treatments
High levels of coherence in the frequency range of 0.016 to 0. 078 Hz were observed between the MABP and CBFV pair and the CBFV and CTOI pair as shown in Figures 3A and 3B. Similarly, in the frequency range of 0.016 to 0.078 Hz, high levels of coherence among pairs of the brain global mean BOLD signal and the mean BOLD signals at WM, CSF, and the ROIs are shown in Figures 3C–3F, Figure 4A, 4C, and 4E, and Table 2A. Table 2A shows that the ‘global-CSF-WM regression and low-pass filtering’ procedure and its two individual steps (global and WM signal regression) significantly or nearly significantly reduced the coherence of the ROI–ROI and global–ROI pairs. When comparing the coherence percent changes due to different preprocessing steps (Table 2B), there was a significant main effect on each pair of ROIs. The combined steps reduced the coherences between global and ROI mean signals by 40.9% to 56.7% (also see Figures 4A and 4B). They also reduced the coherences between ROI pairs by 9.9% to 37.3%. Global signal regression had the largest impact on reducing the coherence (39.2% to 55.4% on global–ROI pairs, and 9.8% to 35.6% on ROI–ROI pairs), followed by WM signal regression (30.6% to 40.7% on global–ROI pairs, and 5.0% to 37.2% on ROI–ROI pairs), then CSF regression (4.8% to 12.8% on global–ROI pairs and 1.0% to 10.2% on ROI–ROI pairs), and finally low-pass filtering (0.73% to 3.09% on global–ROI pairs and 0.22% reduction to 4.89% increase on ROI–ROI pairs). Global signal regression showed a significantly greater impact than both CSF signal regression and low-pass filtering in some ROI pairs, but not in any pair when compared with WM signal regression (Table 2B).
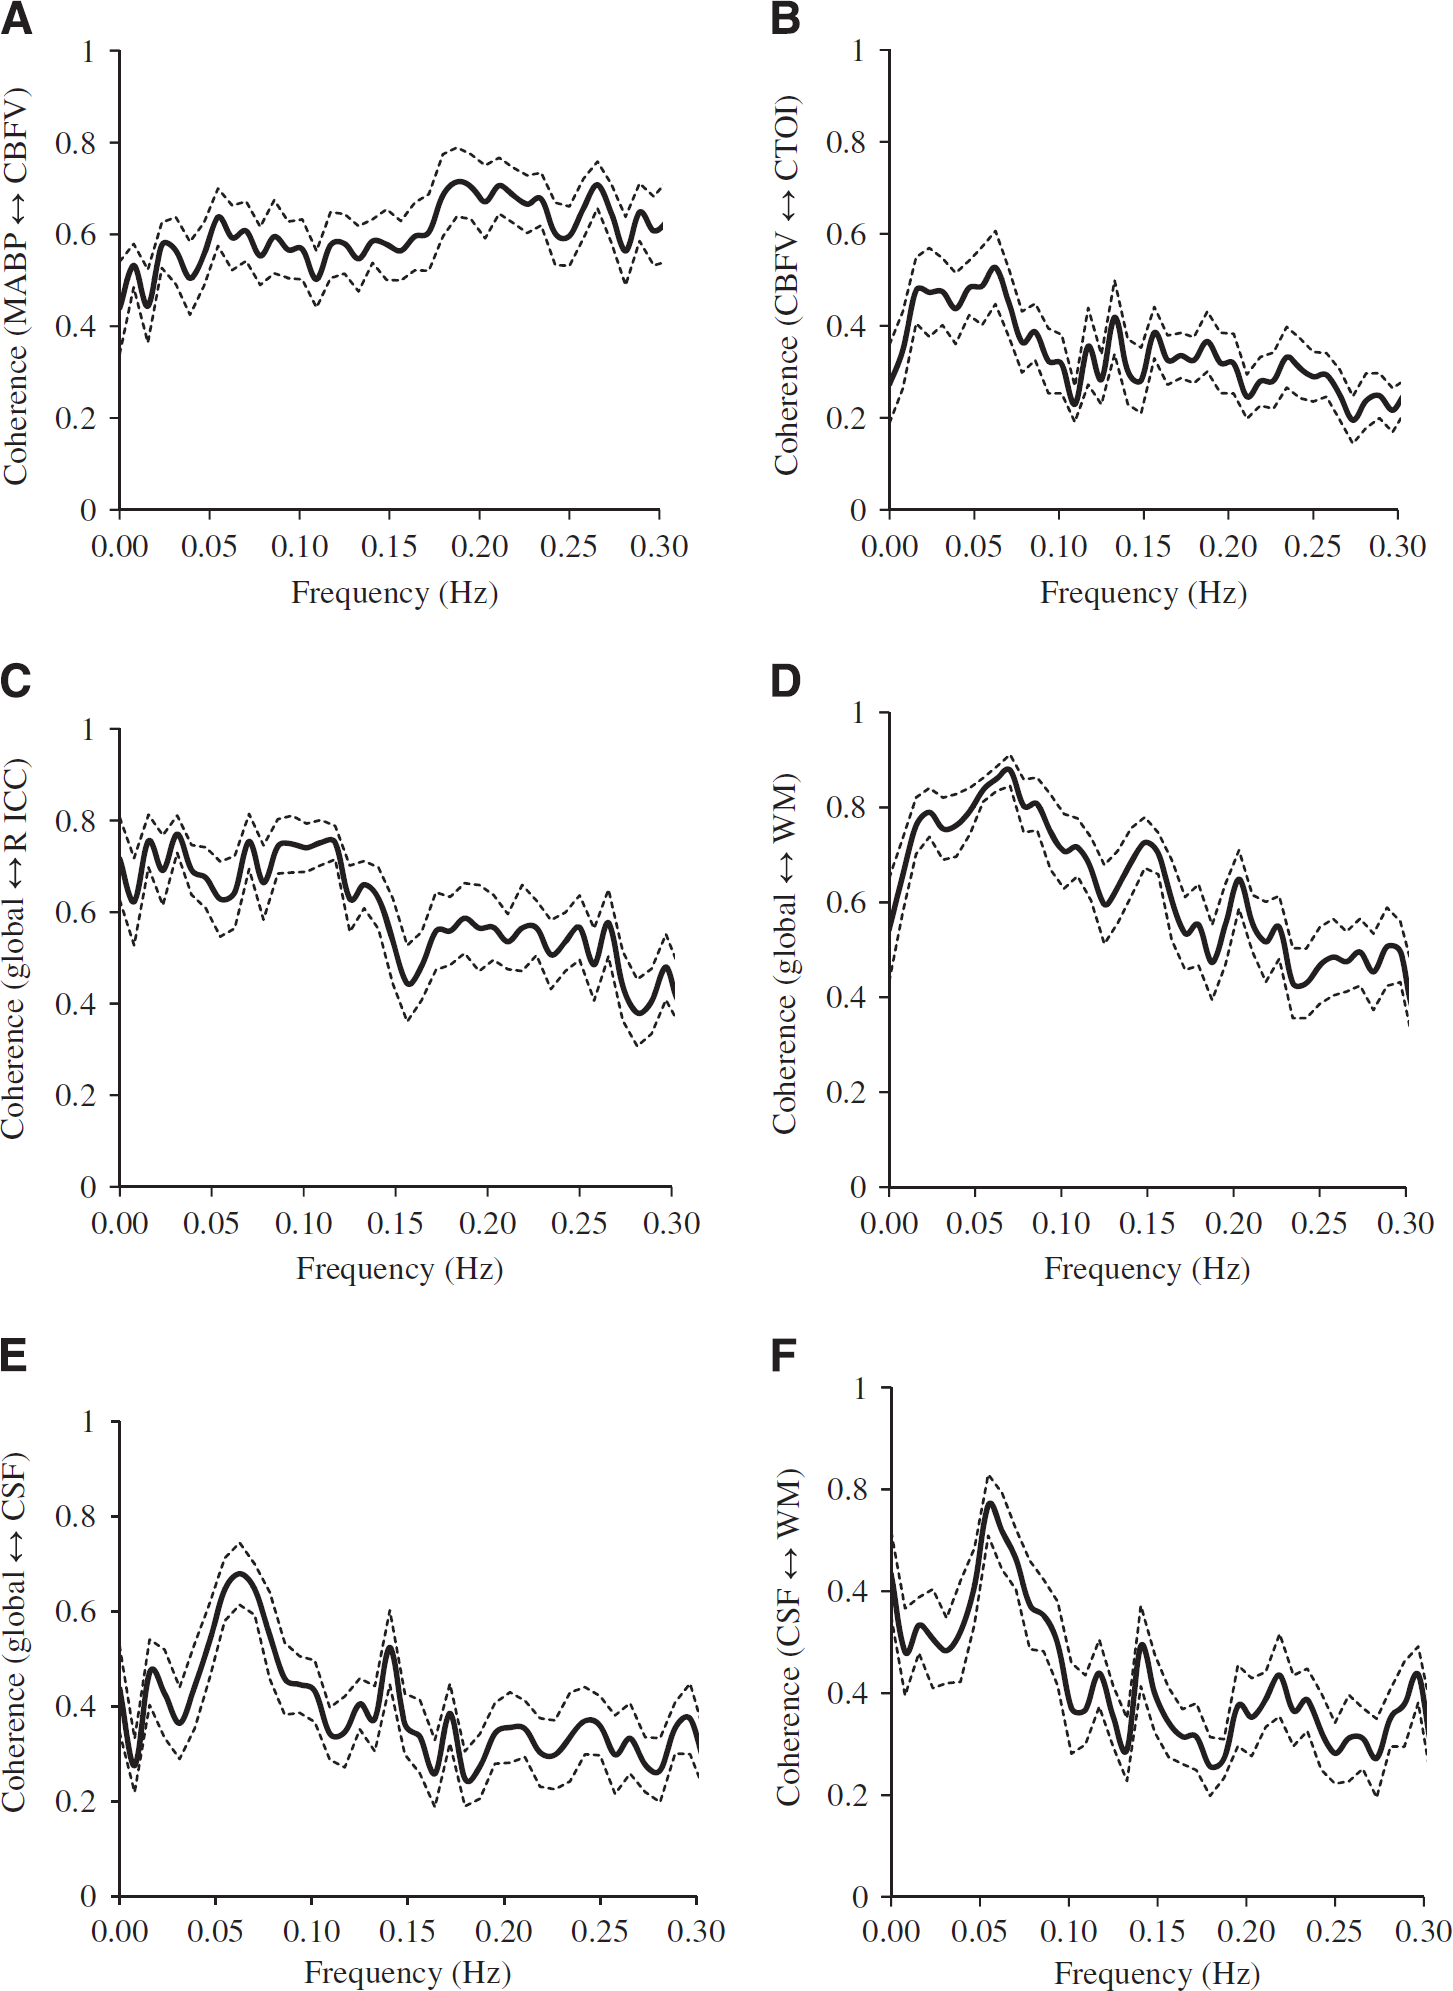
The coherence (n = 12) between the signals at (
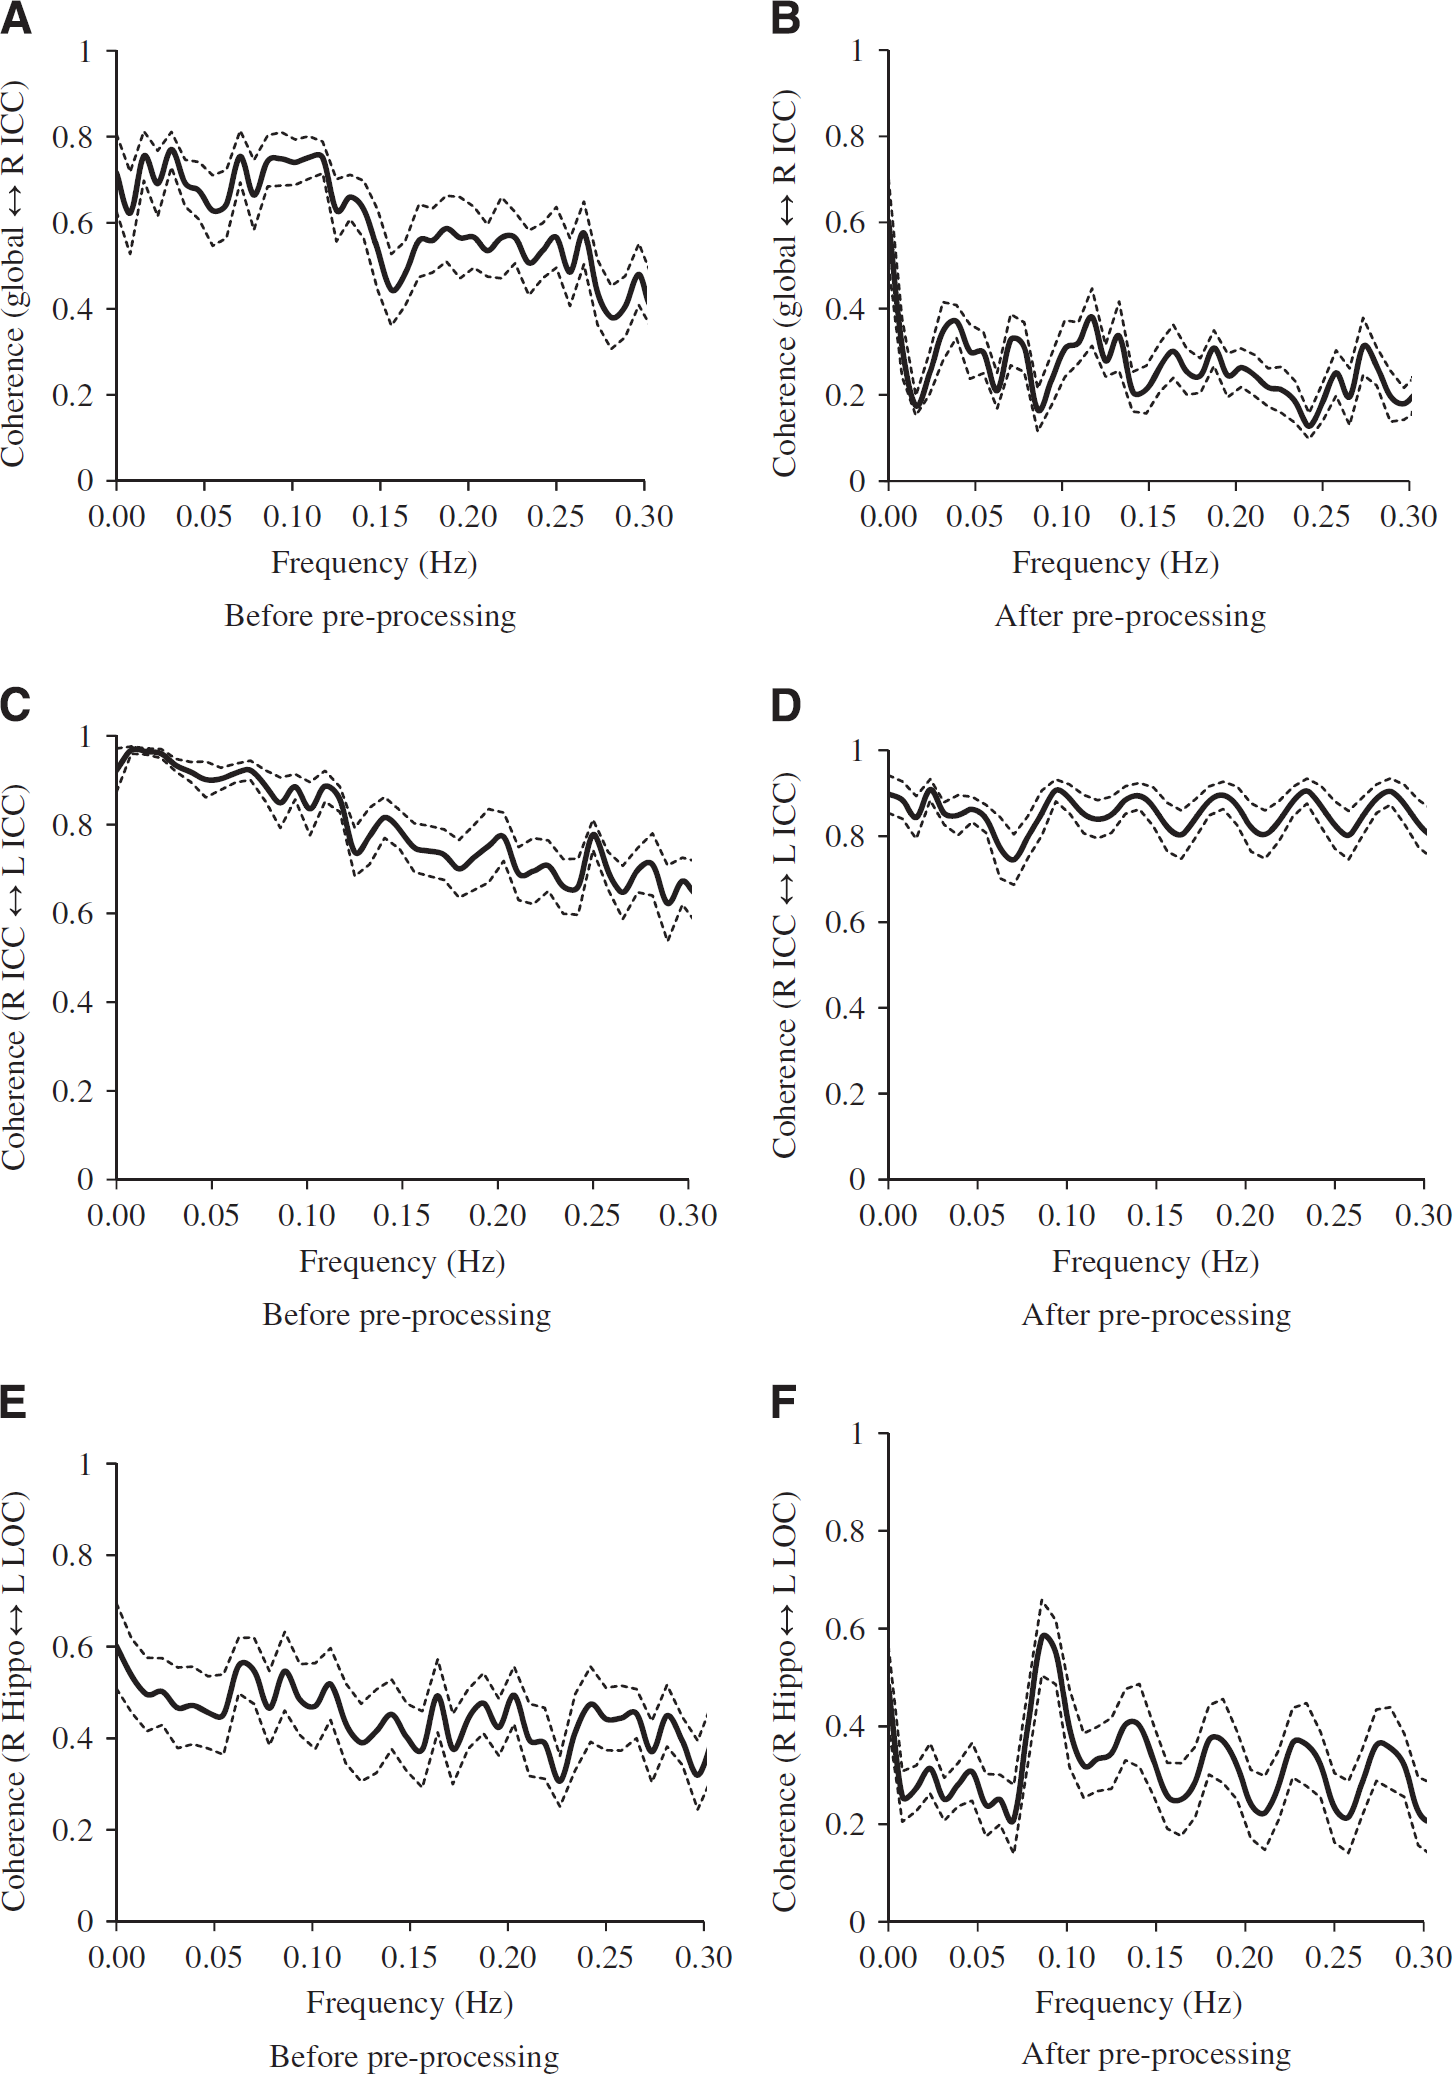
The effect on the coherence (n = 12) between two mean blood oxygen level-dependent (BOLD) signals due to the application of preprocessing steps of global, white-matter, cerebrospinal fluid (CSF) mean signal removal and low-pass (0.08 Hz) filtering: (
The effect of preprocessing steps on coherence function of BOLD signals within regions of interest
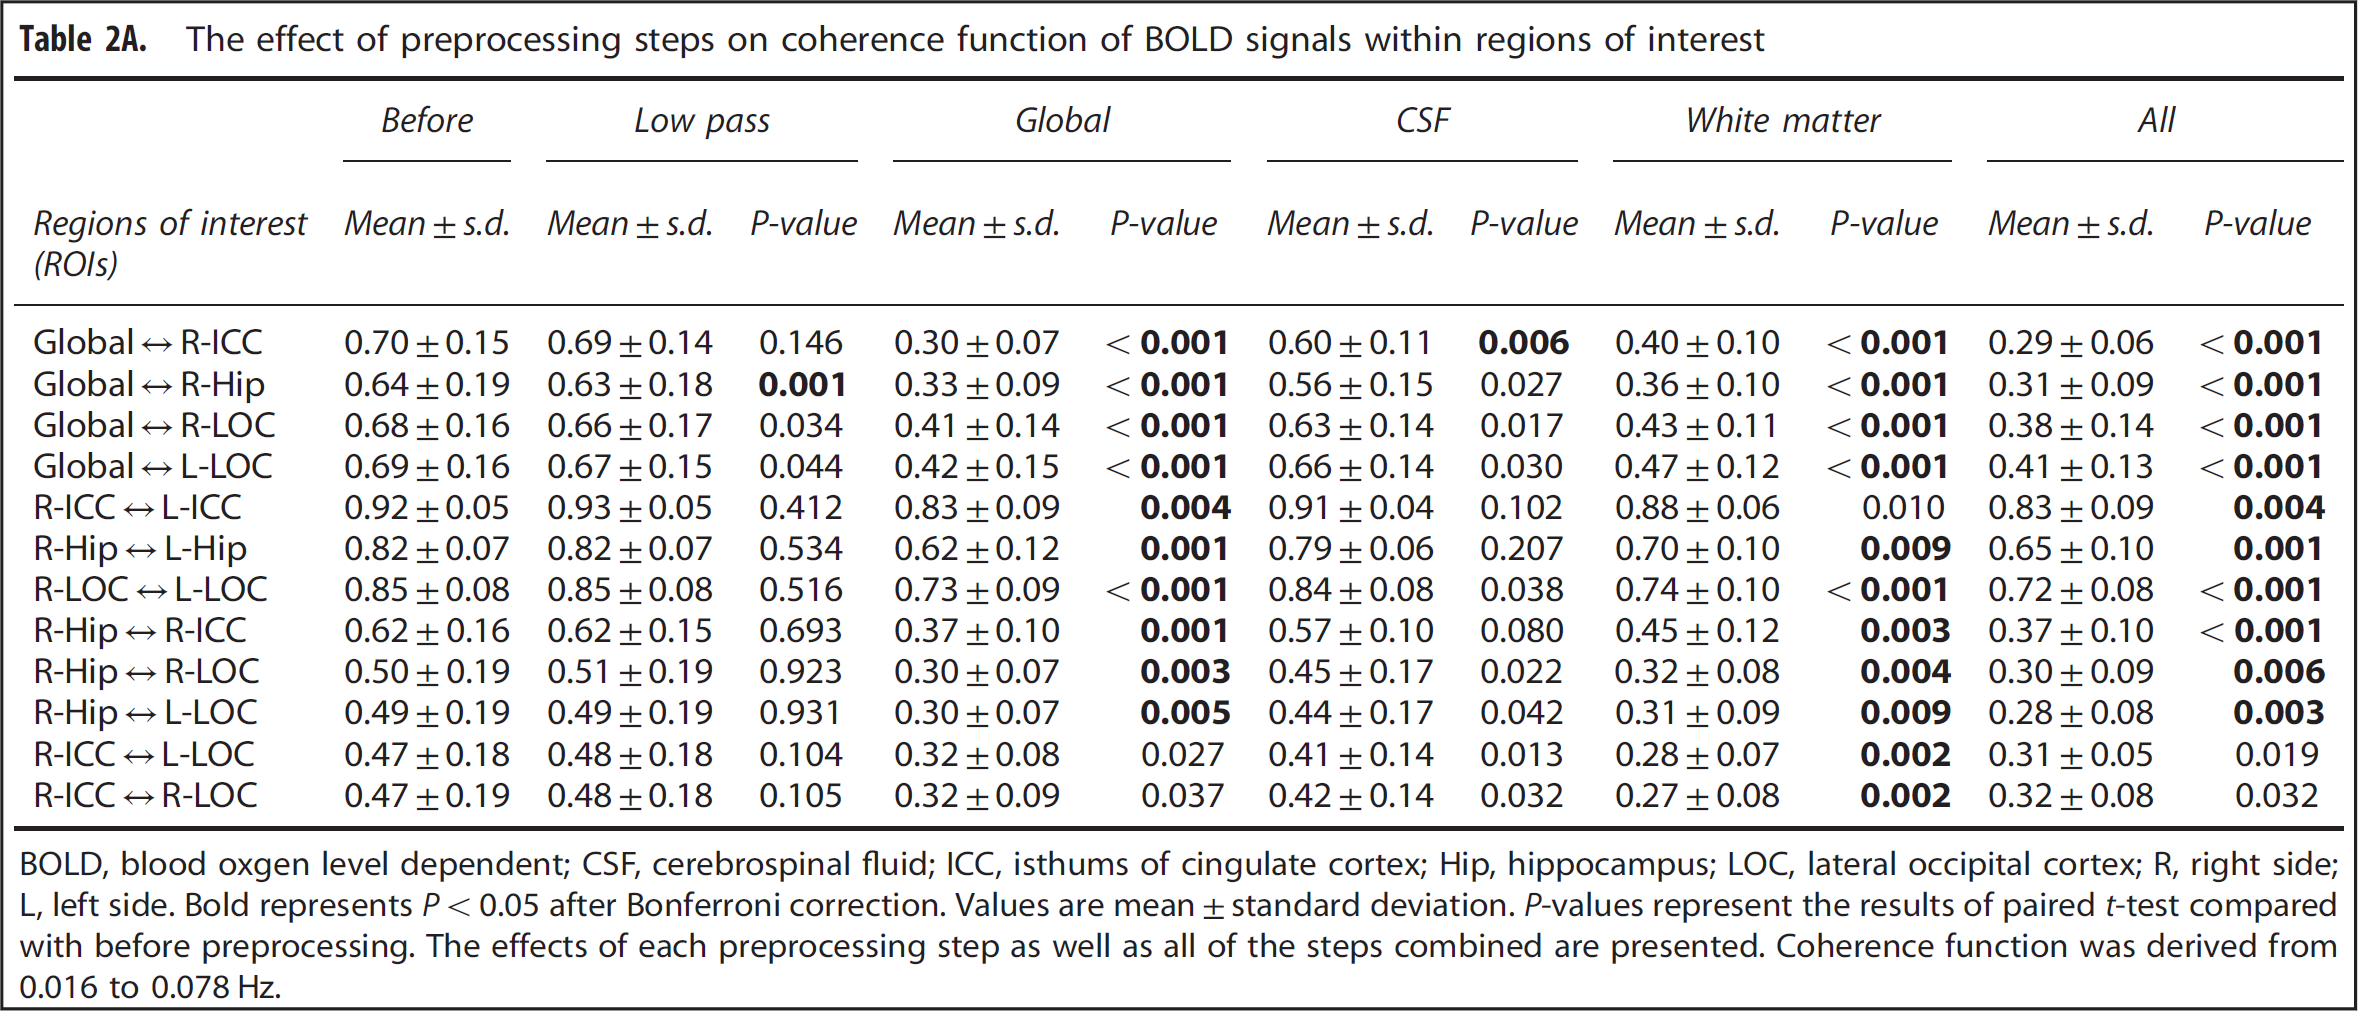
BOLD, blood oxgen level dependent; CSF, cerebrospinal fluid; ICC, isthums of cingulate cortex; Hip, hippocampus; LOC, lateral occipital cortex; R, right side; L, left side. Bold represents P < 0.05 after Bonferroni correction. Values are mean ± standard deviation. P-values represent the results of paired t-test compared with before preprocessing. The effects of each preprocessing step as well as all of the steps combined are presented. Coherence function was derived from 0.016 to 0.078 Hz.
Percent changes in coherence function of BOLD signal before and after preprocessing
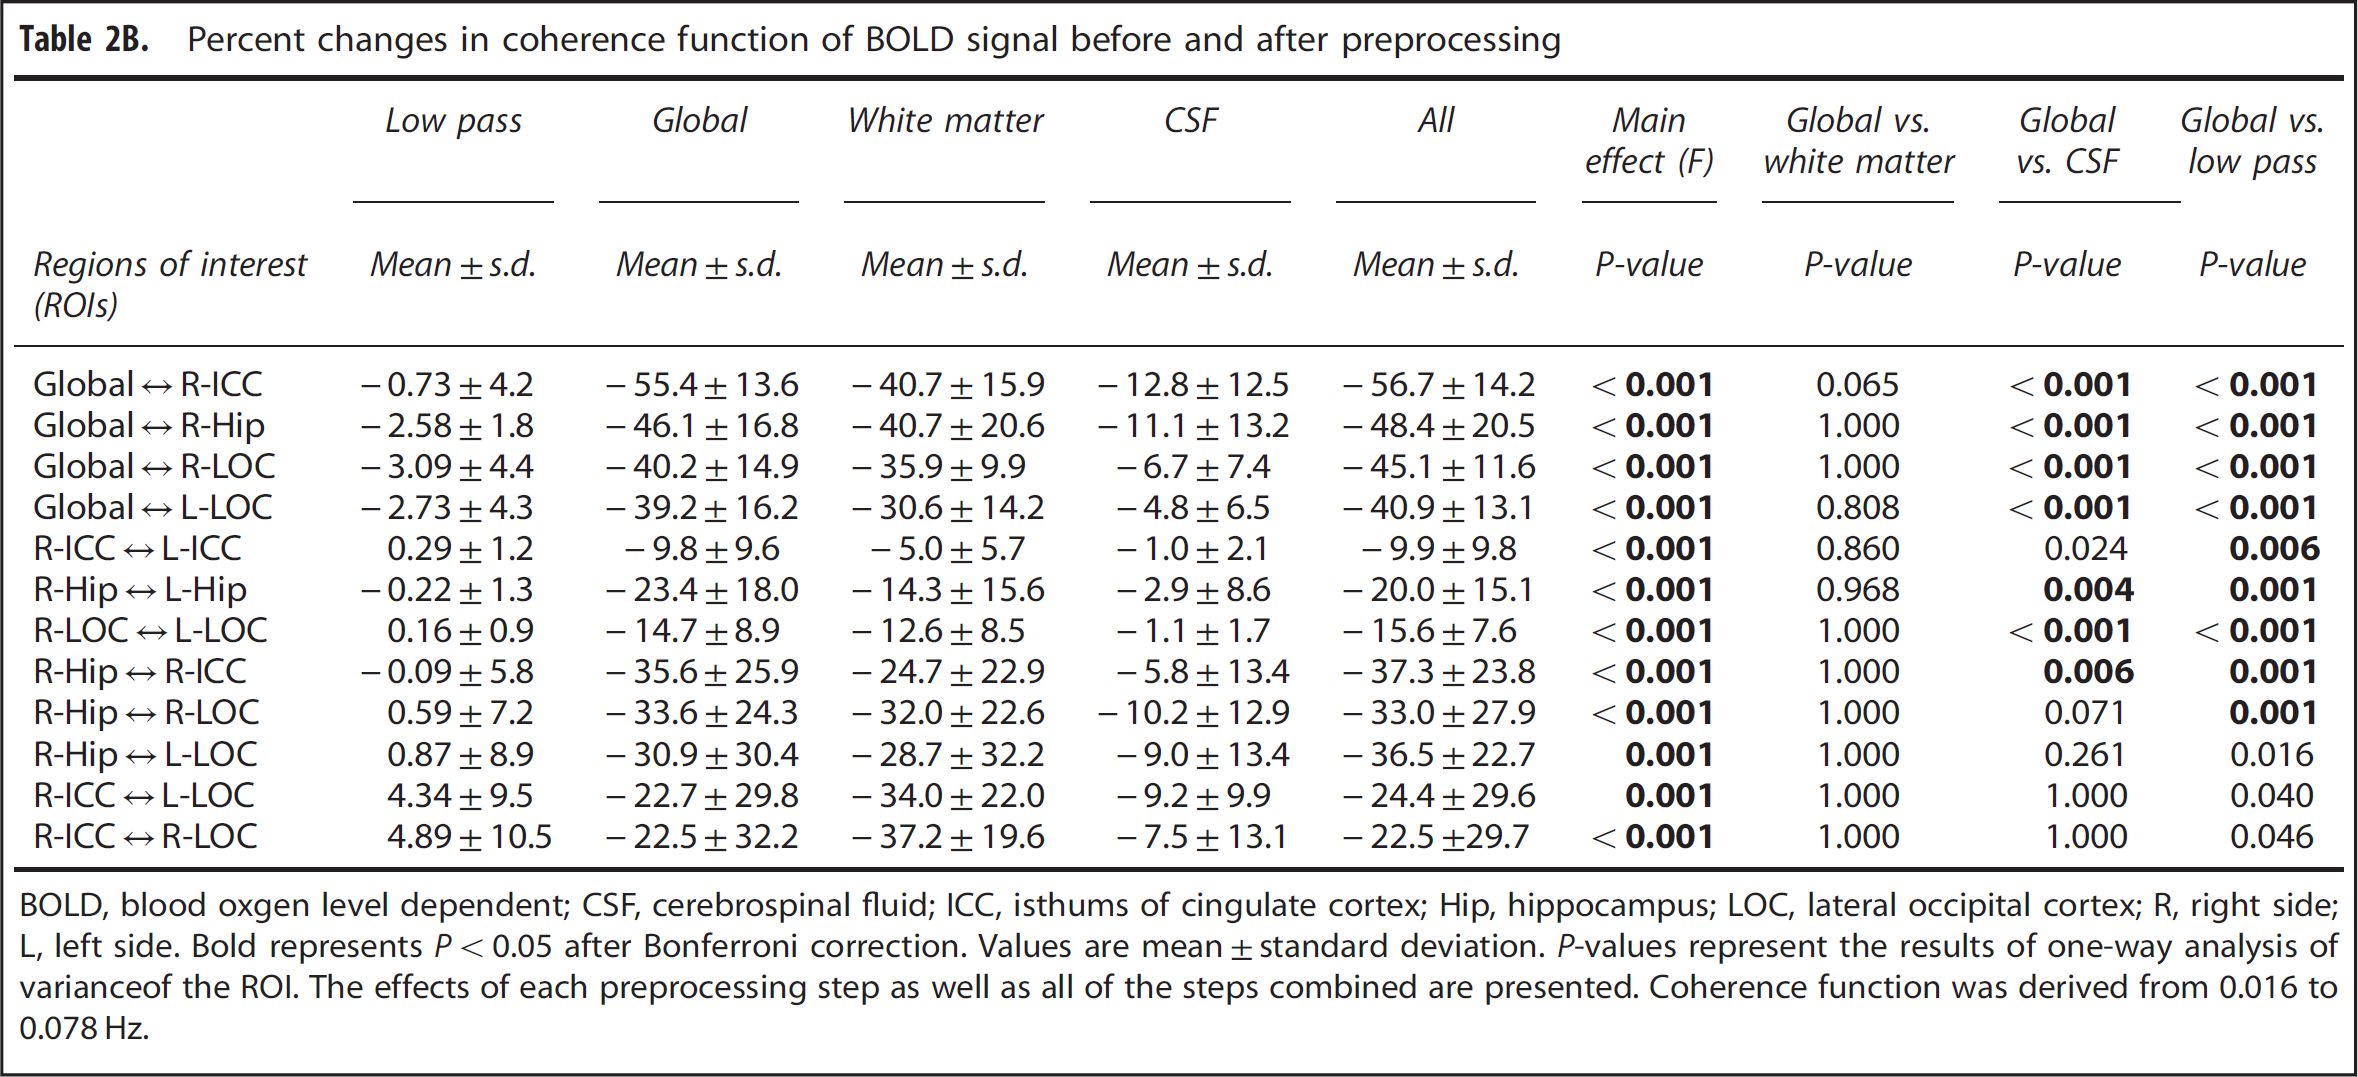
BOLD, blood oxgen level dependent; CSF, cerebrospinal fluid; ICC, isthums of cingulate cortex; Hip, hippocampus; LOC, lateral occipital cortex; R, right side; L, left side. Bold represents P< 0.05 after Bonferroni correction. Values are mean ± standard deviation. P-values represent the results of one-way analysis of varianceof the ROI. The effects of each preprocessing step as well as all of the steps combined are presented. Coherence function was derived from 0.016 to 0.078 Hz.
Coherence Function: Pairwise Differences
Finally, for the ‘global-CSF-WM regression and low-pass filtering’ pre-processing procedure, there was a significant effect of preprocessing × region-pair interaction on coherence function (F = 4.543, P < 0.001). The coherence between an ROI pair within a same network, ROIs in which are expected to be strongly connected in function, was reduced by 9.9% to 20.0% after the preprocessing steps (Table 2B and demonstrated in Figures 4C and 4D). Relatively larger reductions in coherence by 22.5% to 37.3% occurred in an ROI pair not within a same network, ROIs in which are not expected to be strongly connected in function (Table 2B and demonstrated in Figures 4E and 4F). As shown in Supplementary Table 1 data, except for the comparison between the coherences of ‘R-Hip ↔ L-Hip’ and ‘R-Hip ↔ R-ICC’ (still approaching significance at P = 0.088, and Hip = hippocampus), the coherences between the ROI pairs within a same network were higher than the pairs not within a same network before the ‘global-CSF-WM regression and low-pass filtering’ procedure (P = 0.014 for ‘R-LOC ↔ L-LOC’ versus ‘R-Hip ↔ R-ICC’ and P ⩽ 0.001 for other 13 comparisons). These significant differences in coherences as described above were found in all cases after this preprocessing procedure (P < 0.001 for all 15 comparisons).
Effect of Treatment in Resting State-Functional Magnetic Resonance Imaging Connectivity Maps
Figure 5 shows the functional connectivity maps to left ICC on a representative case before and after ‘global-CSF-WM regression and low-pass filtering’. Figure 5B shows a typically expected default-mode network. 11 Before the preprocessing, there were apparently significant but false connections to the left ICC from outside regions of the default-mode network throughout the brain (Figure 5A).
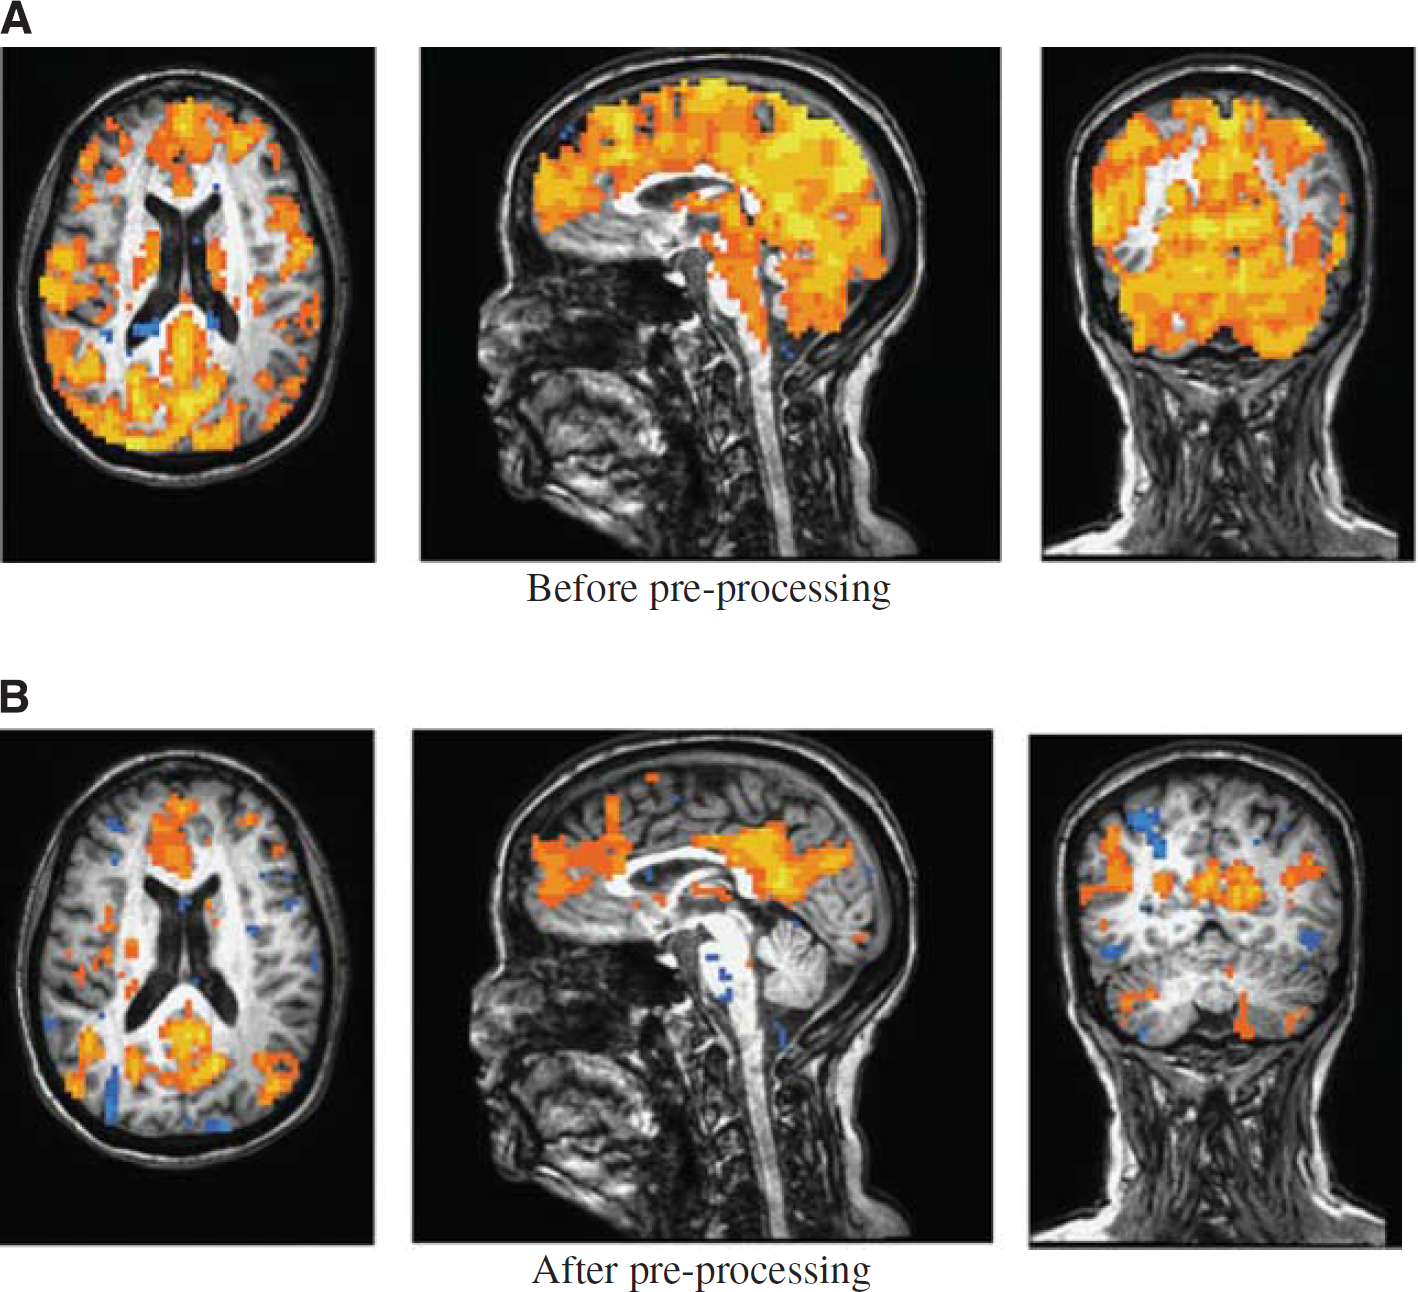
A representative case: the functional connectivity map (P ⩽ 10−6, uncorrected) to the left isthmus of cingulate cortex (
DISCUSSION
In this study, we investigated rs-fMRI and vascular signal fluctuations at less than 0.1 Hz, which is considered to reflect BOLD-based functional connectivity between brain regions. Our results show the presence of marked and coherent arterial pressure, CBFV and brain tissue oxygenation fluctuations in the frequency range of 0.016 to 0.078 Hz. Similar power spectral distribution of BOLD signal was observed in six ROIs, including bilateral ICCs, hippocampi, and LOCs, all of which are common regions used for functional connectivity in rs-fMRI studies. A spectral peak around 0.02 Hz was observed in all signals. A spectral peak around 0.06 Hz was also observed in the CSF and WM signals, probably due to the tight coupling between CSF and brain motions with a low amplitude. 37 After the ‘global-CSF-WM regression and low-pass filtering’ procedure, spectral power of BOLD signal was reduced substantially by more than 55.6% in all observed brain regions. Furthermore, with this preprocessing procedure, coherences of BOLD fluctuations between the within-network regions were reduced by 9.9% to 20.0%, and by 22.5% to 37.3% between the outside-network regions. These differential impacts can also be appreciated from the representative case shown in Figure 5. These observations raise a critical question of whether a large portion of spontaneous oscillations in BOLD signal used to assess brain functional connectivity is due to the vascular effects produced from upstream changes in cerebral hemodynamics. The findings of the present study provide support for using the common ‘global-CSF-WM regression and low-pass filtering’ procedure to reduce vascular effects on rs-fMRI signal.
Low-frequency spontaneous fluctuations of brain perfusion and metabolism have been well recognized in earlier studies in animals. 38 The origin of these fluctuations and their relationship to brain neuronal activity have always been an intriguing question, but not well understood despite extensive studies.38,39 More recent work using high temporal resolution TCD and NIRS in study of cerebral hemodynamics in human subjects showed unequivocally that spontaneous fluctuations of brain perfusion in the microcirculation are likely influenced to a large extent by systemic circulation and upstream changes in CBF.24,26,28 Specifically, it has been shown that both systemic arterial pressure and CBFV measured in the basal cerebral arteries have similar power spectral distributions, which obey the inverse power law (1/f) and have predominant fluctuations at frequencies < 0.1 Hz.24,25 Furthermore, low-frequency CBFV fluctuations measured in the middle cerebral artery can be transmitted into cerebral microcirculation in response to perturbations in arterial pressure such as during posture changes. 28 Further mathematical modeling suggests that the relationship between dynamic changes in arterial pressure and CBFV is modulated by arterial CO2 through complicated feed-back and feed-forward regulatory mechanisms. 27 These physiologic studies, although not directly related to rs-fMRI research, suggest that spontaneous low-frequency BOLD fluctuations at < 0.1 Hz are likely to be induced at least in part by changes in upstream cerebral hemodynamics independent of regional neuronal activity.
However, spontaneous low-frequency BOLD fluctuations are correlated with changes in local field potentials as observed in the visual cortex of monkeys. 40 The BOLD signal fluctuations are associated with low-frequency electrical potential fluctuations observed in human subjects using full-band electroencephalography. 41 These observations suggest that BOLD signal fluctuations may reflect corresponding spontaneous changes in neuronal activity through neurovascular coupling. In support of these mechanistic studies, rs-fMRI studies have provided strong evidence indicating that brain functional connectivity revealed with BOLD signal is correlated with neuroanatomy and DTI-based structure connectivity.3,5,12,13 Taken together, current evidence indicates that spontaneous BOLD signal most likely reflects both vascular effects and changes in neuronal activity although the relative contributions of vascular versus neuronal activity remain unknown, particularly in aging and diseased states.
In this aspect, using a multiple-modality approach in the same subjects, the present study documented for the first time the presence of similar and prominent power spectral distributions at frequencies < 0.1 Hz among systemic arterial pressure, CBF velocity measured in the middle cerebral artery, brain tissue oxygenation, and BOLD signal in brain regions which are commonly used in functional connectivity rs-fMRI studies. In addition, we found that after applying the ‘global-CSF-WM regression and low-pass filtering’ procedure, spectral power of BOLD signal was reduced substantially by 55.6% to 64.9% in the frequency range of 0.016 to 0.078 Hz. It was also reduced substantially by 52.2% to 61.7% just due to the brain global signal regression step alone. If we assume that vascular effects on BOLD signal are global and contribute predominantly to the global mean signals used in the rs-fMRI preprocessing procedures, then these observations suggest that a large portion of BOLD signal can be attributed to vascular effects. This assumption is consistent with the observation that global signal regression has the largest impact in reducing the BOLD spectral power and coherence, relative to the other three preprocessing steps.
Furthermore, we found that upon application of the ‘global-CSF-WM regression and low-pass filtering’ procedure, coherence function between the expected functionally connected regions (regions within a same network) was reduced only by 9.9% to 20.0%, whereas regions that are not expected to be strongly connected in function (regions belonging to different networks/subnets of a network) showed a larger reduction of 22.5% to 37.3%. In addition, the coherence between the global mean signal and each of the examined ROI was reduced substantially by 40.9% to 56.7%. Collectively, these observations suggest that the apparent connectivity revealed by the BOLD signal between the regions not in a same network is most likely influenced to a large extent by vascular effects, relative to the neuronal activity-related connectivity. These results also highlight the importance of applying the ‘global-CSF-WM regression and low-pass filtering’ procedure or other similar procedures in reducing ‘nuisance’ vascular fluctuations. However, we cannot exclude the possibility that significant reductions in spectral power of BOLD signal after preprocessing may have led to the reductions in the coherence between regions within a same network, 42 or the possibility that the differences in coherence reduction between the regions not in a same network were related to regional vascular effects.
The BOLD preprocessing procedures used in this study are straightforward and may be effective in removing vascular effects as discussed above. However, controversies on the effects of removing global mean signal on functional connectivity have been raised by several groups.43,44 They argued that regression of the global mean signal first can also remove the correlated signals attributed by neuronal activity, and second can also introduce artificial negative correlation, as shown by the negatively correlated regions in Figure 5. While we showed the high impact of the global signal regression in removing the vascular contribution, we did not resolve the controversies on this regression technique in this paper. New methods are needed to uncover the BOLD signal due to neuronal activities from vascular contaminations.
Our results also showed a high level of coherence (at 0.8) between the global and WM mean signals. Comparing the impacts among the four preprocessing steps also showed that both global and WM signal regressions had large effects in reducing both BOLD spectral power and coherence. Furthermore, WM signal partially contributes to global signal. These findings and reasoning suggest that the regression of mean WM signal alone has some similar effects as the regression of global mean signal. Thus, our analyses provide some support for the application of WM signal regression without global mean signal regression in preprocessing procedures.43,44 Finally, it is worthwhile to mention that the vascular effects on WM and CSF BOLD signals are likely to be different from those on the gray-matter BOLD signal due to the remarkably different vasculature characteristics in these regions. Therefore, the question of whether the regression of WM and CSF mean signals can effectively remove the vascular effects on the local BOLD signals in cortical and subcortical regions also remains to be addressed.
Due to MRI compatibility issues, rs-fMRI was not measured simultaneously with MABP, CBFV, and CTOI. However, MABP, CBFV, and CTOI were measured simultaneously to show the presence of intrinsic associations between the cerebral macro- and microcirculatory hemodynamic oscillations. The corresponding relationship between fMRI BOLD and NIRS time courses has been shown by prior works with simultaneous measurement of brain hemodynamic signals using these two techniques.45–48 The spontaneous oscillations in CTOI most likely reflected the oscillations in BOLD signal, which was obtained from the same subjects in this study. Therefore, the high coherence observed between the changes in MABP, CBFV, and CTOI suggests the impact of changes in MABP and CBFV on rs-fMRI BOLD signal. Nevertheless, either removal or enhancing the upstream vascular oscillations while simultaneously measuring changes in BOLD oscillations would be needed to show a potential causal relationship between these changes. Our findings are consistent and supported by previous studies.28,49 These studies showed that among the oscillations in MABP, CBFV, and CTOI, there was a similar coherence between the MABP and CTOI and between the MABP and CBFV from the very low to low and then high frequencies. Furthermore, these studies have showed unequivocally that oscillations in MABP and CBFV induced by a periodic sit-stand maneuver can be transmitted into the cerebral microcirculation as manifested by the NIRS measurements. One might also argue that the low-frequency vascular contamination in BOLD fMRI was due to the potential aliasing of cyclic cardiac and respiratory activity.22,23 However, similar power spectral distributions between the observed rs-fMRI and CTOI signals, as well as the observed high coherence between CBFV and CTOI support the contention that a large portion of rs-fMRI BOLD signal (before preprocessing) is induced bythe upstreamvasculareffects. Finally, in the present study, estimation of correlation and coherence was conducted under the assumption that the BOLD signal was stationary after the commonly used preprocessing procedures. 32 Further reduction of nonstationary properties of rs-fMRI BOLD signal may need further exploration. 50
In summary, this study reveals that a large portion of rs-fMRI BOLD signal (before preprocessing) is likely induced by the vascular effects produced from upstream changes in cerebral hemodynamics. In addition, we showed that the commonly used ‘global-CSF-WM regression and low-pass filtering’ procedure are effective in reducing the potential vascular effects on BOLD signal at frequencies < 0.08 Hz. Given the importance of rs-fMRI in understanding brain functional connectivity, the findings of this study highlight the necessity to revisit the foundation of this technique to address the following fundamental questions: (1) What is the level of vascular contributions to the rs-fMRI BOLD signal? (2) What are the systemic and local physiologic or pathophysiologic factors that may modulate vascular contributions? and (3) Can new methods be developed to uncover BOLD signal that are related mainly, if not exclusively, to brain neuronal activity from the ‘vascular contamination’?
Footnotes
All authors contributed to the critical revision and final approval of the manuscript version to be published. DCZ also contributed to the conception and design ofthis research, data analysis and interpretation, and drafting of the manuscript. TT also contributed to the data acquisition, analysis, and interpretation. MAK also contributed to the data acquisition. RZ also contributed to the conception and design of this research, data acquisition, and interpretation.
The authors declare no conflict of interest.
ACKNOWLEDGMENTS
The authors thank all our study participants for their willingness, time and effort devoted to this study and all members of the study team for their excellent support.
References
Supplementary Material
Please find the following supplemental material available below.
For Open Access articles published under a Creative Commons License, all supplemental material carries the same license as the article it is associated with.
For non-Open Access articles published, all supplemental material carries a non-exclusive license, and permission requests for re-use of supplemental material or any part of supplemental material shall be sent directly to the copyright owner as specified in the copyright notice associated with the article.