
Abstract
Steady-state visual evoked potential (SSVEP)-based brain– computer interfaces (BCIs) have been widely studied. Considerable progress has been made in the aspects of stimulus coding, electroencephalogram processing, and recognition algorithms to enhance system performance. The properties of SSVEP have been demonstrated to be highly sensitive to stimulus luminance. However, thus far, there have been very few reports on the impact of background luminance on the system performance of SSVEP-based BCIs. This study investigated the impact of stimulus background luminance on SSVEPs. Specifically, this study compared two types of background luminance, i.e., (1) black luminance [red, green, blue (rgb): (0, 0, 0)] and (2) gray luminance [rgb: (128, 128, 128)], and determined their effect on the classification performance of SSVEPs at the stimulus frequencies of 9, 11, 13, and 15 Hz. The offline results from nine healthy subjects showed that compared with the gray background luminance, the black background luminance induced larger SSVEP amplitude and larger signal-to-noise ratio, resulting in a better classification accuracy. These results suggest that the background luminance of visual stimulus has a considerable effect on the SSVEP and therefore has a potential to improve the BCI performance.
Keywords
1 Introduction
Recently, considerable attention has been attracted by the steady-state visual evoked potential (SSVEP)-based brain–computer interface (BCI) for its advantages such as minimal user training, ease to use, and high information transfer rate (ITR) [1, 2]. In the SSVEP-based BCI systems, users fixate on one of the multiple visual flickers tagged with different stimulation properties (e.g., frequency and phase) and the gazed target can be identified through analyzing the SSVEPs elicited by the target stimulus.
One of the major challenges in advancing the SSVEP-based BCI technology is the bottleneck regarding its performance, which is mainly attributed to the poor signal-to-noise ratio (SNR) of electroencephalogram (EEG) signals [3]. The SNR of the SSVEP signals can be improved by increasing the signal level and/or decreasing the noise level. Researchers have made considerable progress in improving the SNR of the SSVEP and enhancing the BCI performance. First, researchers improved the SNR through applying advanced signal processing methods. For example, trial averaging has been widely used in the current BCI systems to improve the SNR in the EEG analysis [3]. Spatial filtering has been used to project multichannel EEG data into a low-dimensional spatial subspace to eliminate task-irrelevant components and improve the SNR of task-related EEG signals [4]. For SSVEP, the canonical correlation analysis (CCA) approach, which maximizes the correlation between the SSVEP signals and predefined reference signals, can considerably improve the detection frequency of SSVEP [5, 6]. Independent component analysis, another spatial filtering method, enhances the SNR of the EEG signals by separating task-related EEG components from the task-irrelevant EEG and artifactual components [7, 8]. Second, researchers designed experiments to obtain enhanced task-related EEG signals and improve the SNR. For example, in an effective SSVEP-based BCI, visual stimuli using emotional human faces considerably enhanced the amplitude of the SSVEP signals compared with those obtained using the checkerboard stimuli [9]. Third, some researchers adjusted the parameters of the visual stimulus luminance to modulate the amplitude of SSVEP response, thereby improving the SNR of SSVEP [10–12]. For example, related studies have demonstrated that luminance contrast information is critical for the perception of form, motion and depth [13, 14]. The luminance contrast or “modulation depth” is defined as the ratio of the maximum luminance minus the minimum luminance to the maximum luminance plus the minimum luminance [15]. The amplitude of the evoked potentials was found to be linearly correlated with the logarithm of a stimulus’ contrast [16]. High luminance and modulation depth tend to increase the SSVEP amplitude [17]. A study on the effects of luminance contrast on the steady-state motion visual evoked potential indicated that when the contrast ratio was the highest, it could obtain high recognition accuracy and SNR; however, it was easy to cause visual fatigue [18]. Currently, the studies of luminance contrast’s effect on SSVEP mostly concentrate on the luminance change of the stimuli themselves and ignore the effect of the background luminance around the stimuli on the SSVEP. Owing to the high sensitivity of SSVEP toward luminance, this study mainly focuses on the influence of stimulus background luminance on SSVEP.
Specifically, this study compared two types of background luminance of visual stimulus, i.e., (1) black luminance [red, green, blue (rgb): (0, 0, 0)] and (2) gray luminance [rgb: (128, 128, 128)], and compared their effect on the classification performance of SSVEPs at the stimulus frequencies of 9, 11, 13, and 15 Hz. This study designed an experiment to compare the two types of background luminance under different initial phases (0 and π). The purpose of this study was to test the effect of stimulus background luminance on the SSVEP-related parameters and provide an optimal background luminance configuration for the SSVEP-based BCIs.
2 Methods
2.1 Subjects
Nine healthy subjects (5 females; age = 20–35 yr, mean age = 24 yr) with normal or corrected-to-normal vision participated in this study. Each subject signed his/her written informed consent prior to the experiment and was paid for his/her participation. This study was approved by the Research Ethics Committee of Tsinghua University.
2.2 Experimental design
The experiment comprised 16 blocks (8 black background blocks and 8 gray background blocks). To reduce the impact of presentation order of the two background conditions, the blocks with black and gray backgrounds were presented alternately. Each block contained 48 trials, including 40 visual stimulation trials and 8 key task trials. All trials were presented in random orders. Each key task trial started with a blank screen displayed for 1 s with a cross mark at the center of the screen. Following the blank offset, the subject was prompted to press the space bar as soon as possible when a word was displayed on the center of the screen. Once the space bar was pressed, the program transferred to the next trial. The key task trials were used to improve subject’s attention. Each stimulation trial lasted for 4 s. Each trial started with a blank screen displayed for 1 s with a cross mark at the center of the screen. Subjects were allowed to blink and then shift their gaze to the target as soon as possible within the blank display period. After the blank offset, a target with gray luminance [rgb: (128, 128, 128)] began to be presented on the screen and lasted for 1 s (prestimulation offset). Following the offset, sinusoidal stimuli began to flicker and lasted for 2 s (SSVEP stimulation offset).
As shown in Table 1, the stimulus trials could be divided into 8 types. For the SSVEPs with black or gray background, each type was repeated for 360 trials (9 subjects × 8 blocks × 5 repeats).
2.3 Stimulation presentation
The visual stimulation was presented on a 23.6-inch liquid-crystal display screen with a resolution of 1920 × 1080 pixels and a refresh rate of 60 Hz. The stimulus was rendered within a 250 × 250-pixel square on the center of the screen. The screen surrounding the stimulus block was covered with black [rgb: (0, 0, 0)] or gray [rgb: (128, 128, 128)] color.
Stimulation types of experiment.
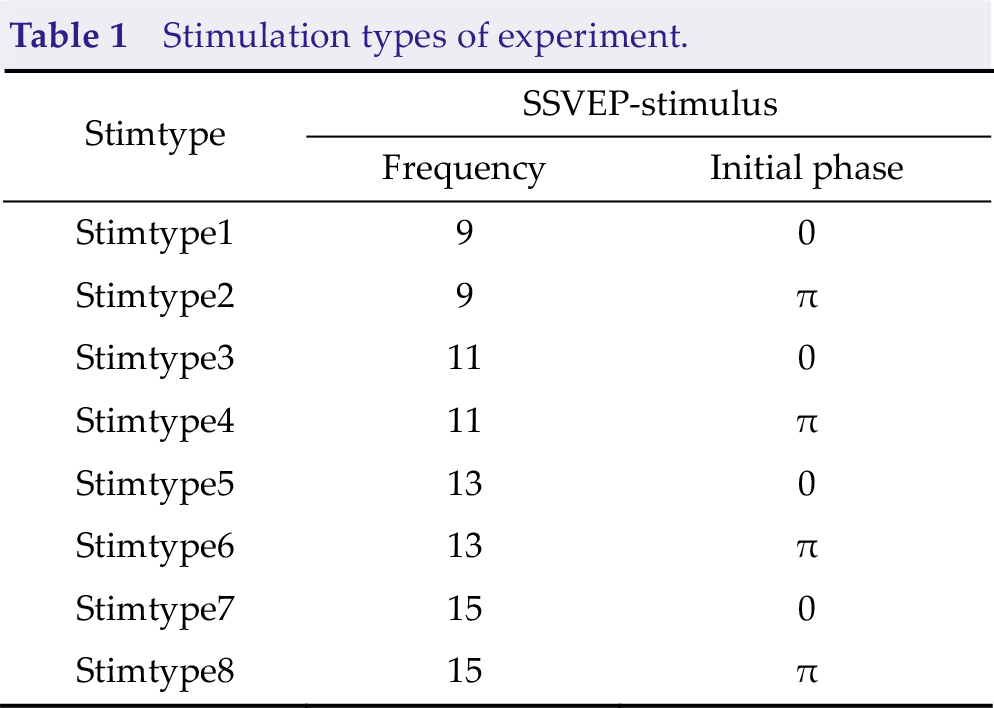
In a sinusoidal stimuli condition, this study used the sampled sinusoidal stimulation method [10, 11] to present visual flickers coded by the joint frequency-phase modulation method [12]. The sequence s(f,i) corresponding to frequency f can be generated by modulating the luminance of the screen using the following equation:
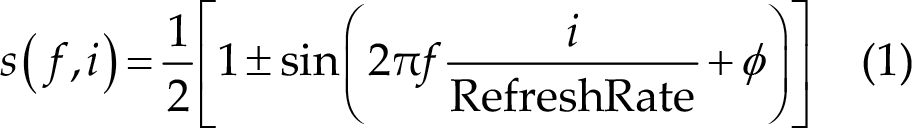
The dynamic range of the stimulation signal is from 0 to 1, where 0 represents black [rgb: (0, 0, 0)] and 1 represents the highest luminance [rgb: (255, 255, 255)]. In this study, frequency f can be 9, 11, 13, or 15 Hz. i indicates the frame index inthe stimulus sequence. φ indicates the initial phase, and it can be 0 or π. The refresh rate was 60 Hz.
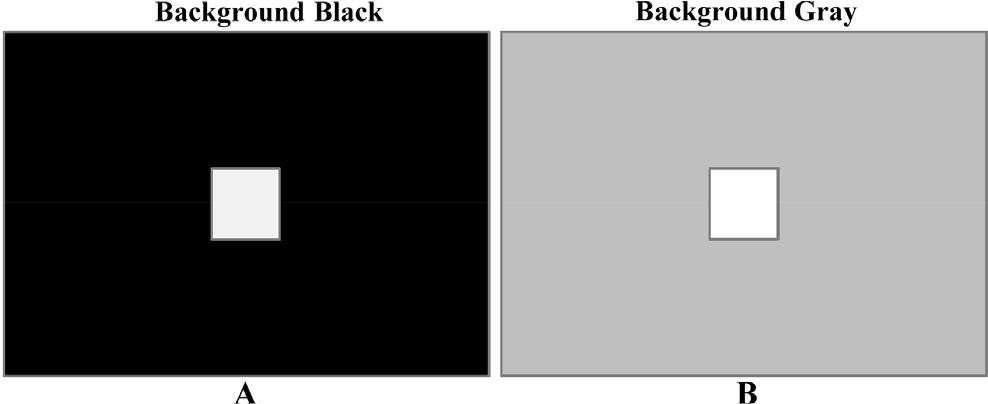
Diagram of visual stimulation. Visual stimulation paradigm with (A) black and (B) gray backgrounds.
2.4 Data acquisition
EEG data were acquired using a Synamps2 system (Neuroscan, Inc.) at a sampling rate of 1000 Hz. The usable bandwidth was 1–100 Hz. Sixty four electrodes were used to record SSVEPs. The reference electrode was located at the vertex. All electrodes were placed according to the international 10–20 system. Electrode impedances were kept below 10 kΩ. During the experiment, subjects were seated in a comfortable chair in a dimly lit soundproof room at a viewing distance of ˜70 cm from the monitor.
2.5 Data analysis
Data epochs were extracted according to event triggers generated by the stimulus program. Considering a latency delay in the visual system, in amplitude and SNR algorithms, a 140-ms delay was selected according to the previous studies [11, 12]. That is, the data epochs were extracted within the time range of [0.14 s, 2.14 s] (time 0 represented a sinusoidal stimulus onset). Amplitude spectrum and SNR were calculated using the overlay averaging method over 360 trials for each stimulus type. Amplitude spectrum was realized using the fast Fourier transform algorithm. The SNR of the SSVEP at the frequency of fn was defined with Eq. (2):
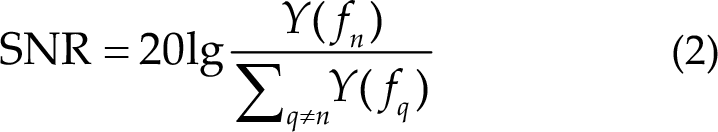
where Y(fn ) represents the amplitude value of SSVEP at a frequency of fn . In this study, the adjacent frequency interval was 0.5 Hz.
The standard training free CCA-based algorithm used in literature previous study [5] was adopted for frequency detection with individual calibration data [12].
2.6 Statistical analysis
Statistical analysis was conducted using paired t-test. Statistical significance was defined as p < 0.05.
3 Results
3.1 Amplitude spectrum
Figure 2 shows the topography of amplitude spectrum with black and gray backgrounds for phase 0 (ABCD) and phase π (EFGH), respectively. The amplitude spectrum data presented in the figures were calculated using the data averaged across the nine subjects. Parts (AE), (BF), (CG), and (DH) indicate the stimulation frequency conditions of 15, 13, 11, and 9 Hz, respectively.
Figure 2 indicates that the area with higher amplitude spectrum was concentrated in the occipital region for all conditions. There was insignificant difference between phase 0 and phase π in the amplitude spectrum. Furthermore, for all frequency and phase conditions, the amplitude spectrum with black background was higher than that with gray background in the occipital region.
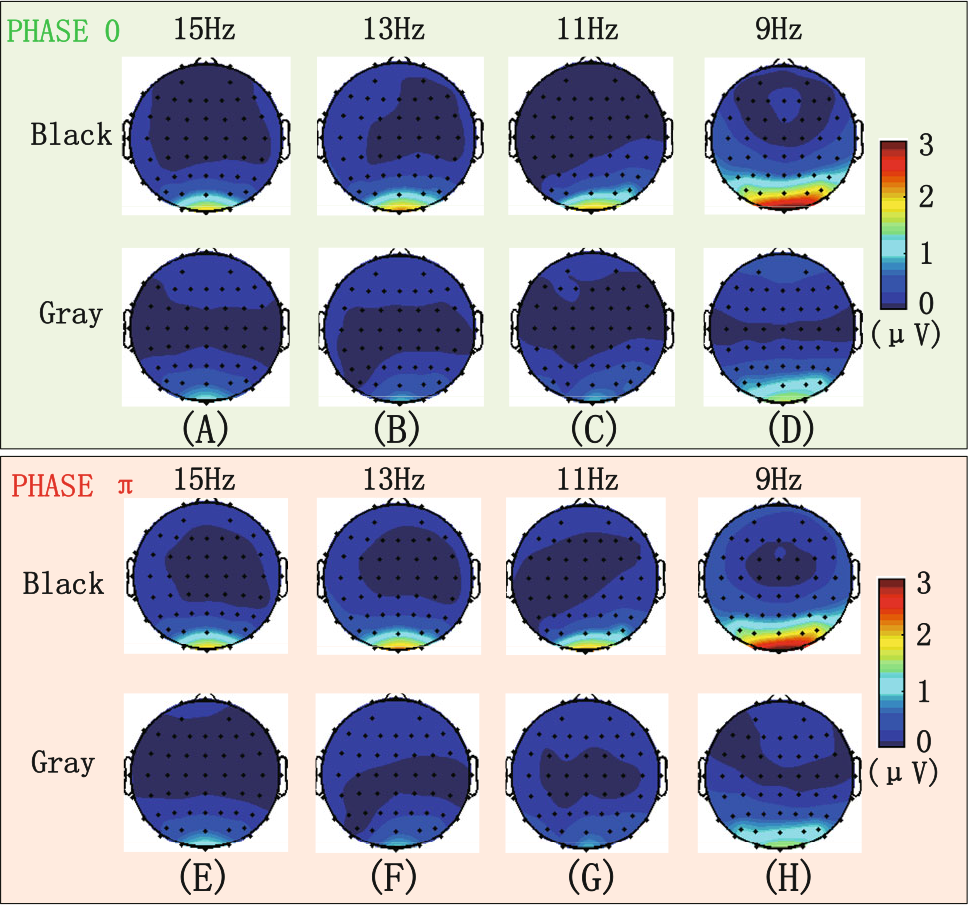
Comparison of amplitude spectrum between black and gray background luminance with phase 0 (A, B, C, and D) and phase π (E, F, G, and H), under different stimulatioin frequencies: 15 (A, E), 13 (B, F), 11 (C, G), and 9 Hz (D, H).
For the phase 0 condition, the paired t-test of amplitude spectrum at Oz channel (nine subjects) indicated that the amplitude spectrum with black background was larger than that with gray background at the frequency of 15 Hz (p = 0.0043), 13 Hz (p = 0.001), and 9 Hz (p ≤ 0.001). For the phase π condition, we found that the amplitude spectrum with black background was larger than that with gray background at the frequency of 15 Hz (p = 0.0077), 13 Hz (p = 0.0015), and 9 Hz (p = 0.0016).
3.2 SNR
Figure 3 shows the topography of SNR with black and gray backgrounds for phase 0 (A, B, C, and D) and phase π (E, F, G, and H), respectively. The SNR data presented in the figures were calculated with data averaged across nine subjects. Parts (A), (B), (C), and (D) indicated the stimulation frequency conditions of 15, 13, 11, and 9 Hz, respectively.
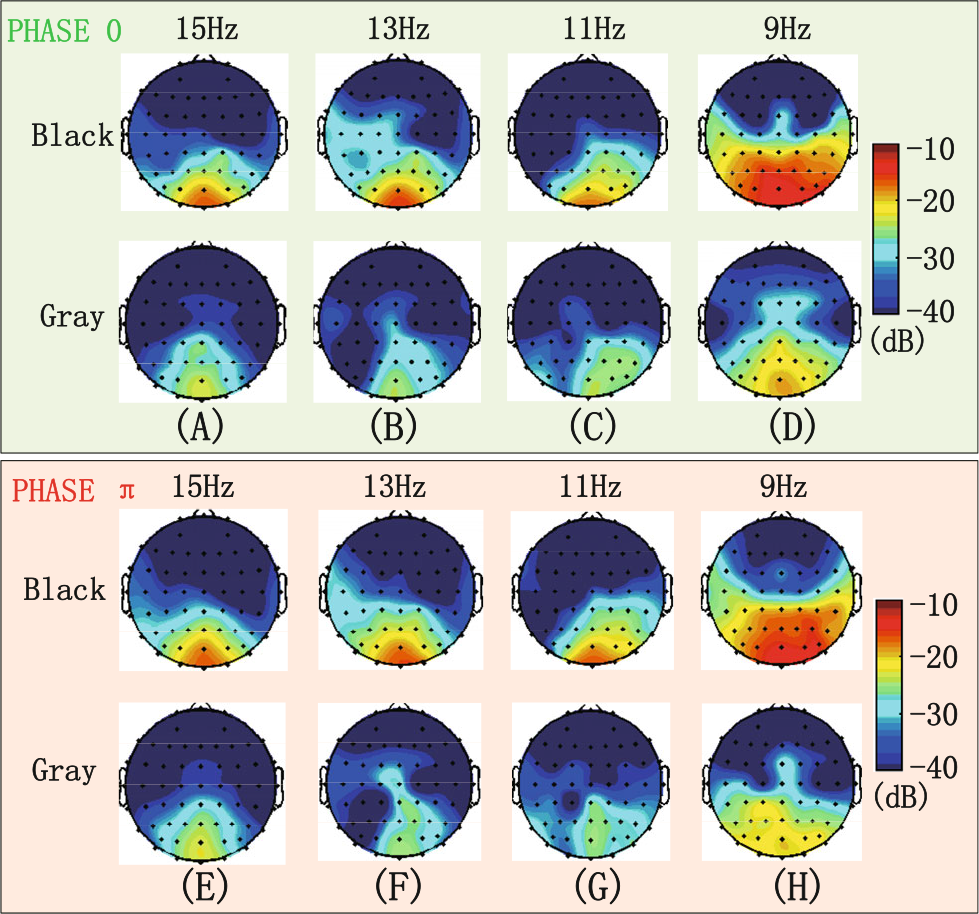
Comparison of SNR between black and gray background luminance with phase 0 (A, B, C, and D) and phase π (E, F, G, and H) under different stimulatioin frequencies: 15 (A, E), 13 (B, F), 11 (C, G), and 9 Hz (D, H).
Figure 3 indicates that the area with higher SNR was concentrated in the occipital region. There was no major difference in the SNR between phase 0 and phase π. Furthermore, for all frequency and phase conditions, the SNR with black background was higher than that with gray background in most areas, especially in the most responsive occipital region.
For the phase 0 condition, the paired t-test of SNR data at Oz channel (nine subjects) showed that the SNR with black background was greater than that with gray background at the frequency of 15 Hz (p = 0.0023), 13 Hz (p = 0.0351), 11 Hz (p = 0.0026), and 9 Hz (p ≤ 0.001). For the phase π condition, we found that the SNR with black background was greater than that with gray background at the frequency of 15 Hz (p = 0.0029), 13 Hz (p = 0.0288), 11 Hz (p = 0.0027), and 9 Hz (p ≤ 0.001).
3.3 Classification accuracy
Figure 4 displays the classification accuracy of SSVEPs (phase 0/π) at 15, 13, 11, and 9 Hz under black and gray backgrounds. For the phase 0 condition, the paired t-test showed that the data with black background had a higher classification accuracy than that of the data with gray background for a data length of 0.5 s (68.61% vs. 51.04%, p ≤ 0.001), 1 s (84.58% vs. 66.94%, p ≤ 0.001), 1.5 s (90.42% vs. 77.64%, p = 0.0017), and 2 s (92.15% vs. 82.78%, p = 0.0076). For the phase π condition, the data with black background had a higher classification accuracy than that of the data with gray background for the data length of 0.5 s (66.39% vs. 50.28%, p ≤ 0.001), 1 s (84.72% vs. 67.43%, p ≤ 0.001), 1.5 s (91.11% vs. 76.81%, p = 0.0012), and 2 s (93.54% vs. 83.47%, p = 0.0046).
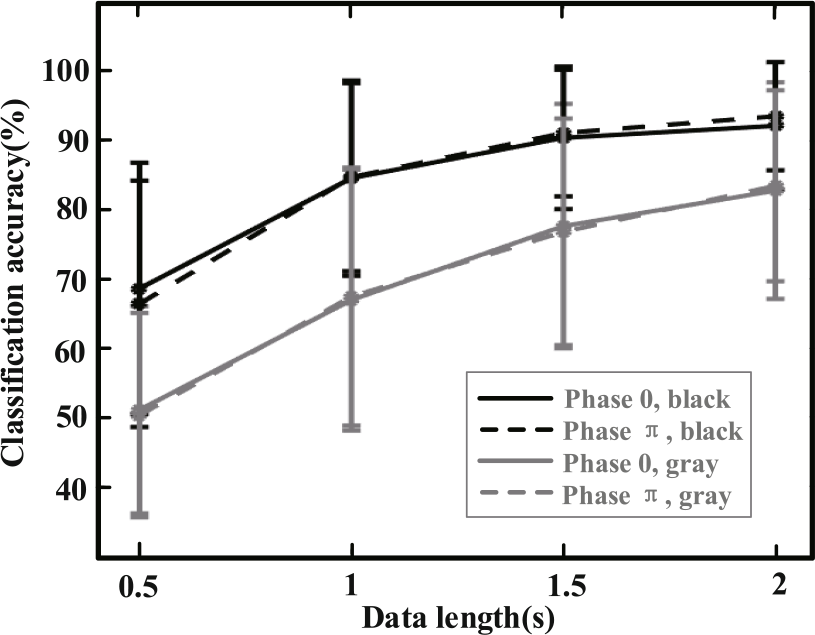
Classification accuracy of SSVEPs at 15, 13, 11, and 9 Hz.
4 Discusion and conclusion
Currently, most existing studies of stimulus luminance on SSVEP mainly focus on the luminance of the stimulus and ignore the effect of the background luminance around the stimulus. This study focused on the effect of the background luminance on the characteristics of SSVEP.
This study designed an experiment to compare the effect of background luminance (black and gray) on the amplitude and SNR of SSVEP. The results indicated that the background luminance has a considerable modulation effect on the characteristics of SSVEP. Specifically, the amplitude spectrum and SNR of SSVEP were substantially higher in the black background condition compared with those in the gray background condition, showing better classification accuracy for the SSVEPs with black background. The background luminance values might be inversely related to the classification performance. These results suggest that the background luminance of visual stimulus has important effect on the SSVEP and has a potential for improving the performance of the SSVEP-based BCIs.
The results of this study showed that black background evoked stronger neural responses while at the same time predicting worse subjective comfort. The conclusions were reasonable and indicated that black background elicit stronger stimulus contrast than grey backgrounds, which were consistent with our subjective feelings. The results of this study provide a reference for the experimental paradigm design of brain–computer interfaces, and are expected to provide enlightening regulatory directions for achieving the balance between high performance and comfort of the system.
Footnotes
Ethical approval
This study was approved by the Research Ethics Committee of Tsinghua University.
Consent
Each subject signed his/her written informed consent prior to the experiment.
Conflict of interests
All contributing authors have no conflict of interests to declare.
Funding
This work was supported in part by National Natural Science Foundation of China (Grant No. 62171473), Beijing Science and Technology Program (Grant No. Z201100004420015), and Fundamental Research Funds for the Central Universities of China (Grant No. FRF-TP-20-017A1).
Authors’ contribution
X.C. designed research; S.Z. performed research; S.Z. and X.C. analyzed data; S.Z. and X.C. wrote the paper.