
Abstract
We investigated the capacity of normalized transillumination methods in imaging fluorescent proteins in visible light, in phantoms and in live mice. We demonstrate significant imaging improvements over epi-illumination imaging, as commonly applied today. Of particular importance is the significant betterment in contrast achieved, due to minimization of the influence of autofluorescence and the enhancement of depth sensitivity compared to epi-illumination imaging. Although normalized transillumination does not match the accuracy and quantification capacity of tomographic imaging, it nevertheless attains key advantages over other planar optical imaging methods while preserving implementation simplicity. Due to the balance achieved between simplicity and accuracy, normalized transillumination approaches could serve as an important alternative molecular imaging method.
Keywords
Introduction
In recent years, the development of novel modalities appropriate for in vivo imaging of small animals has rendered fluorescence imaging as an increasingly important technique for detecting fluorescent probes and proteins on a variety of different animal models [1–3]. Macroscopic fluorescence imaging of small animals is largely based today on epi-illumination imaging. This method expands a light beam at the excitation wavelength of a fluorochrome onto the animal surface and detects any back-emitted fluorescence activity using appropriate filters and a charge-coupled device (CCD) camera, which is placed on the same side as the illumination source [4,5]. A more elaborate approach that has been recently considered for small-animal fluorescence imaging is the use of theoretical models of photon propagation in tissues and multiangle illumination systems for performing three-dimensional (3-D) tomographic imaging of fluorescence activity in vivo through entire animal bodies. Tomography offers superior quantification to epi-illumination imaging and generalizes fluorescence imaging to whole-body, small-animal investigations but is also technologically more complex [6–9].
An alternative optical imaging approach is transillumination. This method has been recently applied to small-animal imaging in the near-infrared (NIR) [10] or in dental research and cardiac muscle imaging [11,12], but it has been more broadly investigated in the past for resolving attenuation or absorption and scattering. Reports of its use in medical imaging go as far back as 1929 in the form of diaphanography for breast cancer detection [13], and several studies have considered its application to tissue imaging, especially for breast cancer detection [14–16]. In transillumination, the animal or tissue of interest is placed between the source and the detector, that is, the imaging object intercepts the virtual line connecting the source and the detector. Therefore, photon signals collected from the tissue have propagated through the animal volume. It was recently demonstrated that the use of normalized data, that is, fluorescence images that are divided by corresponding photon attenuation images obtained under identical geometry and animal placement, have the ability to look deeper into tissues, compared to epi-illumination methods [10], and yield superior imaging performance, compared to non-normalized transillumination data.
Herein, we investigated the application of normalized transillumination in visible light for imaging of fluorescence proteins and compared it to epi-illumination imaging. We found that there are important benefits in using normalized transillumination in fluorescent protein imaging and overall fluorescence imaging in the visible spectrum. In addition to the improved depth sensitivity that was also observed in the NIR [10], we further found improved performance in terms of the contrast achieved as compared to epi-illumination imaging. We demonstrate the imaging performance with phantoms and in vivo on mouse models with implanted fluorescent-protein-expressing tumors. However, applications to other fluorescence imaging applications in the visible can be predicted as well.
Methods
Experimental Setup
Fluorescence images were obtained using a scanner previously developed for small-animal tomography of fluorescence proteins [8]. A schematic of the system is shown in Figure 1. An Ar+ laser (Melles Griot Laser Corp., Carlsbad, CA) emitting a maximum of 200 mW constant wave (CW) intensity at 488 and 514 nm was employed. Laser light was delivered through a single 100-μm multimode fiber (Thorlabs Inc., Newton, NJ) to the input collimator of a custom-made optical scanning head (Nutfield Technology Inc., Windham, NH). The optical scanner employed two galvanometer controlled mirrors and an apochromatic telecentric lens (Special Optics Inc., Wharton, NJ) for scanning and focusing the laser beam onto the input window of custom-made imaging chamber. The beam spot diameter at the focus plane was 300 μm, and any pattern could be scanned at the back of the animal depending on the specific requirements of each experiment. The detection was made using a highly sensitive CCD camera (Roper Scientific, Princeton Instruments, Trenton, NJ) utilizing 334 × 324 pixels after a 4 × 4 pixel binning and cooling to −120 °C for reduced dark noise.
Epi-illumination and Transillumination Imaging
Epi-illumination was implemented using a beam expander that front-illuminates the subject through an antireflection-coated window. Reflected or fluorescence light is then captured through the glass window by the CCD camera focused onto the inner surface of the glass window using an appropriate band-pass filter (510 ± 5 nm, Andover Corporation, Salem, NH).
Transillumination was implemented as a superposition of the transmitted diffuse light for multiple positions illuminated by the galvanometer switch. This selection of back-illumination using a superposition of point sources was herein directed by the concurrent tomographic purpose that the scanner serves; however, it also serves the practical purpose of avoiding direct lines of sight between the source and the detector. Direct lines of sight between source and detector would be possible if a laser beam was simply expanded on the back of the animal and would require special masks to avoid CCD pixel saturation, blooming effects, and possible detector damage. Although the diffusive matching fluid used herein also blocks direct lines of sight, the system has been more generally used without the matching fluid (see Ref. [10]) where the above considerations become more important.
The transillumination field pattern through the diffusive fluid at the excitation wavelength is shown in the inset of Figure 1. Due to high scattering, each of the illumination spots for each scan position becomes diffuse within the first millimeter of propagation and yields a practically homogenous intensity at the front of the glass window over a field of ~23 × 18 mm2 for the case of the 33 sources. It has been shown that although the illumination field significantly drops outside the 23 × 18 mm2 area, normalized methods, summarized below, offer good imaging performance outside this area as well [10]. Although larger illumination areas could be established, this intensity distribution is sufficient for demonstrating key features of transillumination.
Typically, six images were obtained for each experiment: (1) a transillumination image obtained at the excitation wavelength through a 488 ± 1.5-nm (Andover Inc., Salem, MA) three-cavity band-pass filter, (2) a corresponding transillumination image at the emission wavelength (fluorescence image; through a 510 ± 5-nm filter, same as above), (3) an epi-illumination image using white light acquired for outlining the underlying geometry and for registration purposes, (4) a corresponding epi-illumination image at the emission wavelength (fluorescence image, 510 ± 5-nm filter) and (5) two background (dark current) images that capture CCD camera background noise corresponding to the fluorescence and intrinsic image acquisition parameters. Typically, acquisition times for transillumination images were 5 and 30 sec for excitation and emission images, respectively, and epi-illumination images required 0.5 and 3 sec, respectively.
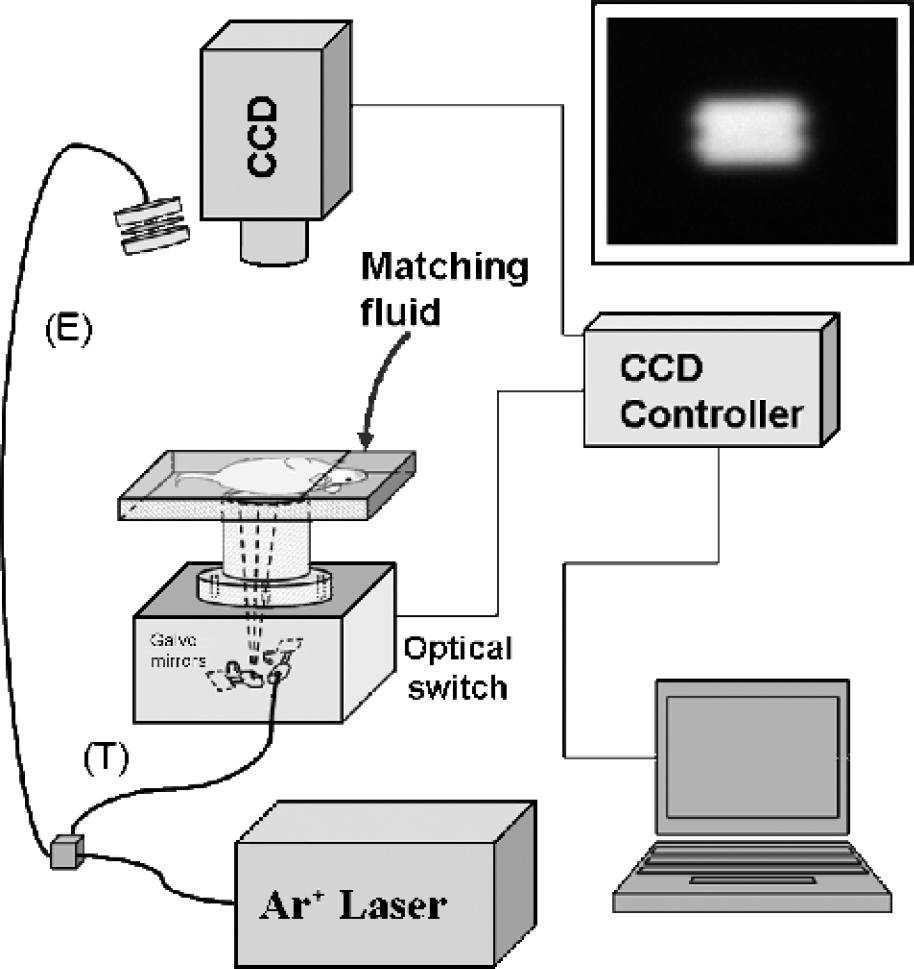
A schematic representation of the experimental setup. The Ar+ laser, the CCD camera, and the optical scanning devise, as well as the imaging chamber are shown. The inset shows the transillumination image of the sources through the homogeneous intralipid solution averaged over all 33 illumination points.
The transillumination measurements were employed to calculate the normalized field Ut, that is,
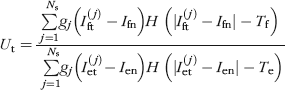
Normalization techniques such as the one used here offer a much more robust imaging method because they are less dependent and less affected by variations of the optical properties, inhomogeneities, and boundary conditions, canceling out also any free-space propagation effects.
Phantoms
We have performed measurements on phantoms and on animals postmortem and in vivo. The phantom studies involved measurements at two different arrangements employing a single or two plastic tubes filled with 0.5 μM fluorescein isothiocyanate (FITC). In both cases, the tubes were placed at the center of the field of view and at 6-mm depth under the front window surface, for a slab width of 1.2 cm. The tubes had an outer diameter of 3 mm, whereas in the case of the two tubes, the clear separation between them was 4 mm. The chamber was then filled with an intralipid (Fresenius Kabi Clayton, L.P., Clayton, NC) and India ink solution that simulated the tissue average optical properties in the visible. The solution's optical properties were chosen to be μa = 2 cm−1 and μs' = 16 cm−1 for absorption and reduced scattering coefficient, respectively.
Animal Models
All animal studies were performed according to procedures approved by the Massachusetts General Hospital Review Board. Imaging subjects were placed horizontally on the imaging plate and slightly compressed with a glass window to a thickness of 1.3–1.2 cm. The postmortem studies were performed by inserting a thin glass capillary tube filled with 4 μM FITC through the esophagus of a euthanized nude mouse. This measurement allows imaging of a known fluorescent object through a mouse, which most closely resembles the in vivo case.
The in vivo study was performed on female nude mice. The results reported herein were from a mouse with a tumor grown on the side of the chest wall after implantation of 106 green fluorescent protein-expressing 9L rat Glioma cells into the right lung using direct needle injection. The injection was done by using a 0.5-mL insulin syringe from the posterior and approximately at the middle of the upper torso area and through the intercostal muscles according to procedures previously reported for similar experiments but in the tomographic mode [17]. X-ray CT imaging of the mouse was performed on a micro-CT small-animal imager (X-SPECT, Gammamedica, Northridge, CA) to confirm the presence and anatomical location of the tumor.
Results
Figure 2 shows the results from the phantom studies employing the two plastic tubes. White light images of the tubes demonstrating the arrangement used for the measurements were taken before the addition of the matching fluid, as shown in Figure 2A and E. The corresponding planar fluorescence reflectance images obtained after the addition of the matching fluid are shown in Figure 2B and F, whereas the corresponding transillumination images are shown in Figure 2C and G. The tubes are well resolved in the transillumination images but not in the epi-illumination images. Figure 2D and H depict an overlay of the transillumination images (Figure 2C and G) on the white light images of Figure 2A and E, respectively, for better illustration. We note that because only a small area is illuminated at the back side of the objects, fluorescence from only a small part of the tubes is resolved. By obtaining a larger back-illumination field, fluorescence from the entire length of the tubes could be resolved.
Although the previous phantom study did not yield significant optical heterogeneity, imaging of animals implanted with fluorescent tubes postmortem examined the relative performance of epi-illumination and transillumination in media closely resembling the in vivo case. The results of the postmortem study are summarized in Figure 3. Figure 3A shows a white light epi-illumination image of the mouse depicting the placement geometry. Figure 3B shows an epi-illumination fluorescence image. In this case the fluorescent tube could not be detected, but strong skin autofluorescence was observed, as is common in epi-illumination measurements in the visible [4,18]. Autofluorescence is due to several intrinsic fluorochromes of tissue, such as skin collagen and elastins, which are strongly excited in epi-illumination mode because light of maximum intensity is incident on the skin. This autofluorescence signal typically limits the detection contrast and sensitivity and could shield weaker signals originating from superficial or deeper seated tissues. In this case, spectral differentiation has shown detection benefits [4,18]. Figure 3C depicts the corresponding normalized transillumination image. Interestingly, the transillumination acquisition did not show significant autofluorescence and accurately resolves the fluorescent tube with significant contrast. In this case, the autofluorescence contribution is minimized because very low light intensity reaches the front side of the mouse to excite endogenous skin fluorochromes. In our measurements, we found that the sensitivity and contrast of the method was limited only by the sensitivity and shot noise of the CCD detector and not by tissue autofluorescence, thus resulting in images of high contrast. Figure 3D is an overlay of the resolved fluorescent tube presented in Figure 3C on the white light image of Figure 3A using pseudocoloring. Similarly to Figure 2, only part of the fluorescent tube is shown due the limited back-illumination area in this study.
Finally, Figure 4 depicts the results from the in vivo study. Figure 4A shows a white light image of the mouse with the red arrow pointing to the location of the tumor and Figure 4B depicts the corresponding fluorescence epi-illumination image. The tumor is visible on Figure 4B due to the relatively superficial depth at which it was grown. High skin autofluorescence is, however, evident, which reduces the contrast, although spectral differentiation could potentially offer better discrimination in this case [4,18]. In comparison, similarly to observations seen in Figure 3, the transillumination image shown in Figure 4C exhibits high tumor-to-background contrast with a measurement that is shot-noise limited and not autofluorescence limited. Figure 4D depicts an overlay of Figure 4C on the white light image of Figure 4A for illustration purposes. Figure 4E and F shows axial and coronal slices from the X-ray CT reconstructions confirming the anatomical location of the tumor on the upper side of the chest cavity wall (red arrow).

(A, E) White light images of the plastic tubes field with FITC in the two experimental arrangements used to illustrate the resolving power of transillumination, in the case of a single tube and two tubes. (B, F) Planar reflectance images showing no fluorescence from the fluorochrome for the two cases. (C, G) Transillumination images of the tube averaged over all 33 sources, with the fluorescence from the tubes clearly visible. The two tubes, which are placed 4 mm apart, are evidently resolved. (D, H) Overlays of the transillumination images of the tubes on top of the white light images after applying a pseudocolor map.

(A) A white light image of a mouse with a glass capillary tube filled with FITC inserted in the esophagus. (B) Aplanar reflectance image of the mouse showing high skin autofluorescence but no fluorescence from the tube. (C) A transillumination image averaged over all 33 sources and showing negligible autofluorescence, with the fluorescence from the tube clearly visible. (D) The transillumination image overlaid on top of the white light image after applying a color map.
Discussion
In this study we have investigated the potential of transillumination imaging as an alternative modality for fast, high-throughput in vivo imaging of fluorescent proteins and fluorochromes in the visible. Transillumination is based on collecting light that has fully propagated through the tissue or animal volume and carries information from the entire volume sampled during its propagation. For this reason, it can probe deeper than epi-illumination imaging, which is surface weighted. In addition, because minimum light intensity reaches the animal's surface that is viewed by the camera, transillumination imaging offers very low background fluorescence. It was actually observed that in most cases the measurements were shot-noise limited and not autofluorescence limited. This improves the imaging contrast compared to standard epi-illumination imaging and is a particular advantage for imaging in the visible.
Color imaging or spectral differentiation has shown great utility in improving the detection contrast in epi-illumination imaging, compared to the epi-illumination examples shown in this work [19]. In that respect, transillumination has been shown as an alternative method for improving detection sensitivity. However, epi-illumination is still limited by the inherent properties of surface-weighted imaging, that is, that superficial events are detected with superior sensitivity to deeper seated structures. For the same reasons, for any solid lesions imaged (i.e., a solid tumor), only the top part is visualized with high sensitivity and not the entire tumor. This performance was manifested in our results by the reduced sensitivity seen with epi-illumination imaging of deep-seated objects, even in the case of the phantom measurements where some bleed-through signals and intralipid autofluorescence did not allow detection of the fluorescence tubes when they were placed at the center of the diffuse fluid (Figure 2B and F). In contrast, transillumination offers more symmetric sampling of the entire volume and yields better quantification accuracy as a function of depth and optical properties as was also similarly demonstrated for the case of NIR light [10].

(A) A white light image of a female nude mouse with the red arrow showing the site of the tumor. (B) A planar reflectance image showing the fluorescence of the tumor, but with very high skin autofluorescence affecting the contrast and the sensitivity of imaging. (C) The same tumor as detected with transillumination averaged over all sources. (D) The transillumination image overlaid on top of the white light image presented with a pseudocolor map. (E, F) An axial and a coronal slice obtained from X-ray CT imaging sessions of the same mouse. The red arrows show the location of the tumor.
A particular transillumination implementation considered herein allows for normalization of the fluorescence measurements. This approach has been recently shown to offer significant advantages over non-normalized approaches, as it was found insensitive to possible heterogeneity of the illumination field and to tissue optical contrast heterogeneity [10,20]. Improvements were observed in both epi-illumination and transillumination when using normalization. This is an important feature for improving the quantification and image accuracy in in vivo applications, even at strong spatial variation of the background optical attenuation [10,20]. We note, however, that normalization may account for heterogeneous optical property variation, but it is the nature of the transillumination acquisition that improves the detection characteristics seen in the results herein, as compared to the epi-illumination images.
A better integrated approach is fluorescence tomography applied to entire (whole body) volumetric animal imaging. This method has been recently shown feasible to three-dimensionally resolve deep-seated fluorescence activity [6], including fluorescence emitted from fluorescent proteins [6,17]. The method can improve the localization and quantification of planar imaging methods (i.e., epi-illumination and transillumination) by using physical models of photon propagation in tissues to account for the nonlinear dependence of fluorescence intensity to depth. On the other hand, the design, implementation and operation of 3-D tomographic imaging systems is more challenging than planar imaging systems, with the added complexity of developing accurate algorithms for the modeling and inversion of the data that need high computational power, and of more elaborate illumination and detection schemes.
Overall, we have demonstrated that for applications common to planar imaging, normalized transillumination methods offer some advantages over current epi-illumination imaging methods, especially in probing deep-seated activity, and yield improved accuracy while offering implementation simplicity compared to the more accurate tomographic approaches. Currently, in laboratory research, we find it very useful to inspect normalized transillumination images as a first estimation of fluorescence activity before applying the computationally more challenging tomographic methods [17] to gain quantification and 3-D localization.