
Abstract
Current methods of studying angiogenesis are limited in their ability to serially evaluate in vivo function throughout a target tissue. Dynamic contrast-enhanced magnetic resonance imaging (DCE-MRI) and pharmacokinetic modeling provide a useful method for evaluating tissue vasculature based on contrast accumulation and washout. While it is often assumed that areas of high contrast enhancement and washout comprise areas of increased angiogenesis and tumor activity, the actual molecular pathways that are active in such areas are poorly understood. Using DCE-MRI in a murine subcutaneous tumor model, we were able to perform pharmacokinetic functional analysis of a tumor, coregistration of MRI images with histological cross-sections, immunohistochemistry, laser capture microdissection, and genetic profiling of tumor heterogeneity based on pharmacokinetic parameters. Using imaging as a template for biologic investigation, we have not found evidence of increased expression of proangiogenic modulators at the transcriptional level in either distinct pharmacokinetic region. Furthermore, these regions show no difference on histology and CD31 immunohistochemistry. However, the expression of ribosomal proteins was greatly increased in high enhancement and washout regions, implying increased protein translation and consequent increased cellular activity. Together, these findings point to the potential importance of posttranscriptional regulation in angiogenesis and the need for the development of angiogenesis-specific contrast agents to evaluate in vivo angiogenesis at a molecular level.
Introduction
Over the last several decades, much progress has been made in understanding the underlying mechanisms of tumor angiogenesis [1,2]. This knowledge has led to an increasing number of clinical trials targeting tumor angiogenesis as a means of cancer therapy. Since these agents target tumor vasculature, effects may be seen through alterations in tumor blood dynamics far before tumor regression occurs. Thus, it has been necessary to develop noninvasive surrogate markers of therapeutic response and efficacy measures for clinical trials involving antiangiogenic drugs [3,4]. Dynamic contrast-enhanced magnetic resonance imaging (DCE-MRI) has emerged as a powerful noninvasive tool for serially assessing vascular dynamics within tumor tissue using parameters deduced from pharmacokinetic modeling [5–11]. This method exploits the abnormal hierarchical branching patterns and increased permeability of tumor vasculature [12–14] through the influx, interstitial space extravasation, and washout of nonspecific low-molecular-weight contrast agents. Here, we have used a two-compartment model (Figure 1A) initially described by Brix et al. [15], focusing on maximal amplitude of enhancement (A) and the tissue exchange rate constant from interstitial to intravascular compartments (kep) as important functional parameters for vascular density [16,17] and permeability, respectively. Despite the demonstrated value of DCE-MRI in assessing angiogenesis, the output parameters are an extrapolation of pathophysiological mechanisms occurring within different tumor regions. Thus, in order to elucidate the specific biological meaning of these pharmacokinetic parameters, correlations must be made at the cellular and molecular levels. Ideally, this comparison would be made through image-guided biopsies from distinct tumor regions, pre- and posttherapy. However, due to the limitations and difficulties of acquiring human tissue in such a trial, the need to develop a versatile animal model for investigating the biological basis of DCE-MRI parameters is necessary. Here, we describe the molecular analysis of distinct pharmacokinetic regions defined by DCE-MRI using cDNA microarray gene expression analysis in a murine subcutaneous colon adenocarcinoma model.
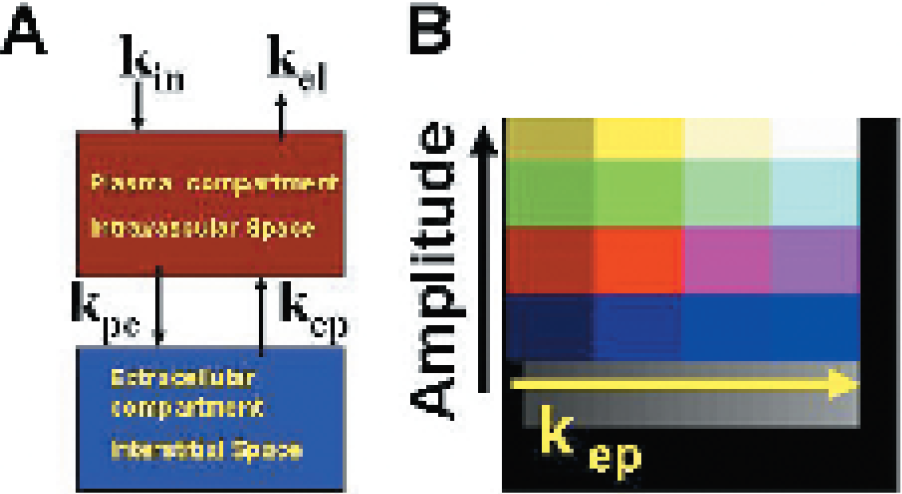
Pharmacokinetic model. Two-compartment pharmacokinetic model with exchange constants (A). Pixel by pixel parametric color coding scheme for amplitude and kep parameters (B).
Materials and Methods
Animal Preparation
MC38 murine colon adenocarcinoma cells (developed in the Surgery Branch, National Cancer Institute, Bethesda, MD) were maintained in DMEM with 10% fetal calf serum (FCS), 100 units/mL penicillin, 100 μg/mL streptomycin, 50 μg/mL gentamicin, 0.5 μg/mL Fungi-zone, and 4 mM glutamine (Biofluids, Rockville, MD). Cells were resuspended in phosphate-buffered saline and 106 cells were inoculated and grown to approximately 1 cm in diameter in the right flank of C57BL/6 mice. Prior to imaging, each mouse was cannulated through the lateral tail vein for contrast delivery during DCE-MRI. Mice were anesthetized with 1–2% isoflurane by nosecone for the duration of the imaging study. All animal procedures were reviewed and approved by the ACUC under National Cancer Institute Animal Subject Protocol 129.
DCE-MRI
Mice were imaged in a 4.7-T Bruker (Billerica, MA) Avance MR scanner at the Mouse Imaging Facility of the NIH. A number of gradient-echo scout images were acquired first to locate the tumor and kidneys (as a control for successful contrast administration). During dynamic contrast-enhanced imaging, three 2-D image slices of the tumor and one of the kidneys were repeatedly acquired in a 20-min spoiled gradient-echo (GEFI) imaging sequence. Imaging parameters were: matrix size = 256 × 128, slice thickness = 2 mm, TE = 2.5 msec, TR = 75 msec, tip angle = 45°, BW = 80 KHz, repetition = 60. Contrast was injected 1 min after the start of imaging to allow acquisition of precontrast baseline data. Mice received 0.2 mmol Gd-DTPA over 1 min according to the applied pharmacokinetic model. Pharmacokinetic analysis was performed using software written in IDL (MVK) based on a previously described two-compartment pharmacokinetic model [15]. Time-activity curves were generated for different regions of interest (ROIs) and were fitted to the pharmacokinetic model. The maximal amplitude of enhancement (A) and the tissue exchange rate constant (kep) were calculated for each pixel and were color encoded to assist in visualization of these parameters within the tumor (Figure 1, Figure 2C). ROIs were designated using this color-encoded map to demonstrate pharmacokinetic differences within each tumor.

Pharmacokinetic analysis. Enhancement curves of high amplitude and kep regions (A) and low amplitude and kep regions (B) with corresponding parametric color map (C, see Figure 1 for color scale) from one of three subject mice. Yellow circle: ROI for enhancement curve; Yellow arrows: subcutaneous tumor.
Tissue Processing
Tumors were snap-frozen in liquid nitrogen and stored at −80°C. Frozen sections were imbedded in OCT, cut at 8 μm on a cryostat, and stained with hematoxylin–eosin (H&E) using standard protocols [18]. Frozen sections were also immunolabeled with antibody to CD31 (PharMingen, San Diego, CA), an endothelial cell marker that provides an estimate of vascular endothelial cell density. For immunostaining, after sections were fixed in acetone for 10 min (CD31), endogenous peroxidase activity was blocked by 3% hydrogen peroxide in methanol for 10 min. Sections were then incubated for 1 hr in a blocking solution containing 10% normal goat serum followed by an overnight incubation with CD31 (1:50 dilution) at 4°C. Slides were washed three times in PBS, incubated in biotinylated species-specific appropriate secondary antibody for 1 hr, and exposed to avidin–biotin–peroxidase complex (Vector Laboratories, Burlingame, CA). Sections were reacted with 0.06% 3,3′-diaminobenzidine (Sigma, St. Louis, MO) and counterstained with hematoxylin. H&E and CD31 stained sections were interpreted by a board-certified pathologist (SMH).
Laser Capture Microdissection (LCM) and RNA Extraction
Laser Capture Microdissection (LCM) was performed as previously described [19]. LCM allows the precise extraction of cells from tissue sections under direct microscopic visualization using a laser focused on the desired region for capture. In brief, frozen tumors sections were mounted on plain glass slides. The slides were then H&E-stained and dehydrated in graded alcohol and xylene. LCM was performed on the stained sections using a PixCell laser capture microscope (Arcturus Engineering, Mountain View, CA). The tissue section was overlaid with a thermoplastic polymer membrane mounted on optically transparent caps. Distinct pharmacokinetic regions were captured by focal melting of the membrane through laser activation. Approximately 2000 (8000–10,000 cells) 30-μim laser shots of each cell population were used. After microdissection, the cap with laser-captured cells was overlaid with TRIZOL reagent (Gibco-BRL, Gaithersburg, MD) and placed in a microtube at −80°C. Total RNA was isolated using TRIZOL reagent.
RNA Amplification
Amplified, antisense RNA was prepared as previously described [20]. Amplification is necessary as the starting amount of RNA from LCM is inadequate for microarray analysis. Briefly, total RNA from LCM was amplified three rounds using T7-(dT)24 primer (5-GGCCAGTGAATTGAATACGACTCACTATAGGGAGGCGG-(dT)24-3′), with random hexamer primers also being used for second and third rounds of amplification, and purified using an RN-Easy mini column (Qiagen, Valencia, CA) according to the manufacturer's instructions. Amplified RNA was analyzed for purity and concentration using formaldehyde gel electrophoresis and spectrophotometry. Amplified RNA was applied to the RNA 6000 Labchip using an Agilent bioanalyzer 2100 (Agilent Technologies, Palo Alto, CA) to assess RNA quality following amplification.
Microarray Analysis
Microarray analysis was performed to investigate differences in gene expression between pharmacokinetically distinct tumor regions. RNA from different tumor regions was labeled with different fluorochromes and competitively hybridized to a glass slide microarray containing individually spotted cDNA for various genes. Difference in gene expression between tumor regions was observed as a difference in fluorescence from each respective fluorochrome-labeled RNA sample. Briefly, 3 μg of amplified RNA was labeled using a previously described indirect aminoallyl labeling technique [21] using Cy3 and Cy5 as fluorochromes. Amplified RNA from distinct pharmacokinetic regions within the same tumor was competitively hybridized for subject mice, serving as an internal control for biological variation between mice. Amplified RNA from two different regions within the control mouse tumor was competitively hybridized to control for specificity of coregistration and effects of laser capture on gene expression. National Cancer Institute glass slide microarrays representing approximately 10,000 mouse genes were prehybridized at 42°C for 40 min in 5 × SSC, 0.1% SDS, and 1% BSA. Arrays were then hybridized with labeled amplified RNA in 50% formamide, 5 × SSC, and 0.1% SDS at 42°C overnight (16–20 hr). Slides then were washed for 2 min in 2 × SSC/0.1% SDS, 2 min in 1 × SSC/0.1% SDS, 2 min in 0.2 × SSC, and 1 min in 0.05 × SSC, then spin-dried. Fluorescence images were captured using a Genepix 4000 (Axon Instruments, Foster City, CA). Data were stored in a database supported by the Center for Information Technology, National Institutes of Health, and were analyzed using software developed at the National Human Genome Research Institute (Bethesda, MD). Ratios were expressed as the relative gene expression of regions with high to those with low A and kep. To establish reproducibility and to minimize the effects of labeling bias, all arrays were repeated using reciprocal fluorescence (i.e., RNA targets labeled with Cy3 in the first array were labeled with Cy5 in the second array, and vice versa). Difference in expression was defined as a gene with expression ratios ≥2.0 or ≤0.5 (92% confidence of change in one array experiment) across all six subject mouse arrays, thus including reciprocal microarray analyses (ratios ≥2.0 were ≤0.5 when the Cy3 and Cy5 fluorochromes were reversed, and vice versa), signal-to-background ≥2.0, fluorescence intensities ≥500 (based on a scale from 1 to 65,536 units), and spot sizes of ≥30 pixels.
Quantitative Real-Time PCR (qRT-PCR)
qRT-PCR analysis to validate microarray gene expression ratios of selected genes was carried out as described previously [22], with minor modifications. Briefly, measurements were performed using the GeneAmp 5700 Sequence Detector (Applied Biosystems, Foster City, CA). Primers and probes (BioServe Biotechnologies, Laurel, MD) were designed using Primer Express software (Applied Biosystems), except for rodent GAPDH, which was available commercially (Applied Biosystems, sequences proprietary). Probes were 5′-labeled with 6-carboxyfluorescein (FAM) and 3′-labeled with 6-carbo-xytetramethylrhodamine (TAMRA). Primer-probe Sequences for RpS16 were: 5′-GCTGCGAATCCAAA AAGTTTG-3′, 5′-GGCTTATCGGTAGGATTTCTGGTA-3′, 5′-FAM-AGGTCCTGGTGCCCGTGCCC-TAMRA-3′; Rpl44: 5′-GTTCTAAGCAG ATTTTGTTATGAAGACAA-3′, 5′-TTTAATGTATTCCCTCCCAAACG-3′, 5′-FAM-TGACCTTTCAACCCCTTTGATTGCAGTTG-3′; Usf1: 5′-GTCCAAAGCCTGTGATTATATCCA-3′, 5′-TGATC-TAACCCCTGCAGCTCTT-3′, 5′-FAM-CTGCGGCAGAGCAACCACCG-TAMRA-3′. cDNA was generated from RNA samples (50 ng/assay for total RNA and 2 ng/assay for amplified RNA) using MultiScribe reverse transcriptase and random hexamers for priming (Applied Biosystems). Reaction conditions were 10 min at 25°C, 30 min at 48°C, and 5 min at 95°C. cDNA standards for each gene were generated by primer-specific amplification of laser-captured cDNA and analyzed for purity and concentration by gel electrophoresis and spectrophotometry. Copies were calculated using the molecular weight of each amplicon. Real-time PCR reactions for samples and standards were conducted in a volume of 25 μL using AmpliTaq Gold DNA polymerase (Applied Biosystems), sense and antisense primer concentrations of 900 nM each, and a probe concentration of 250 nM (except for GAPDH, for which primer and probe concentrations each were 100 nM, according to the manufacturer's recommendations). Thermal cycler parameters were 2 min at 50°C, 10 min at 95°C, and 40 cycles each consisting of a 15-sec denaturing step at 95°C and a 1-min annealing/extension step at 60°C. Standard curves were generated for each gene, and copy numbers were extrapolated for each sample. All assays were performed in duplicate and reported as the mean. The relative expression of each gene of interest was normalized to starting RNA template concentration using RiboGreen RNA Quantitation Kit (Molecular Probes, Eugene, OR), and the expression ratio for each gene was calculated.
Results
Four mice were included for microarray analysis. Three mice (subject mice) showed heterogeneously enhancing tumors with distinct pharmacokinetic regions within each respective tumor (Figures 2 and 3). A one-tailed paired t test was performed on A (p = .04) and kep(p = .08) to demonstrate the degree of distinctness between ROIs within the three subject mouse tumors for which further biological analysis was performed. A fourth mouse (control mouse) showed minimal heterogeneity or distinct pharmacokinetic regions (distinct ROIs from 1.38/1.66 to 1.35/1.04 for A/kep) and was included as an internal control for specificity of findings. Tumors were extracted, sectioned, and coregistered with MRI (Figure 4A).
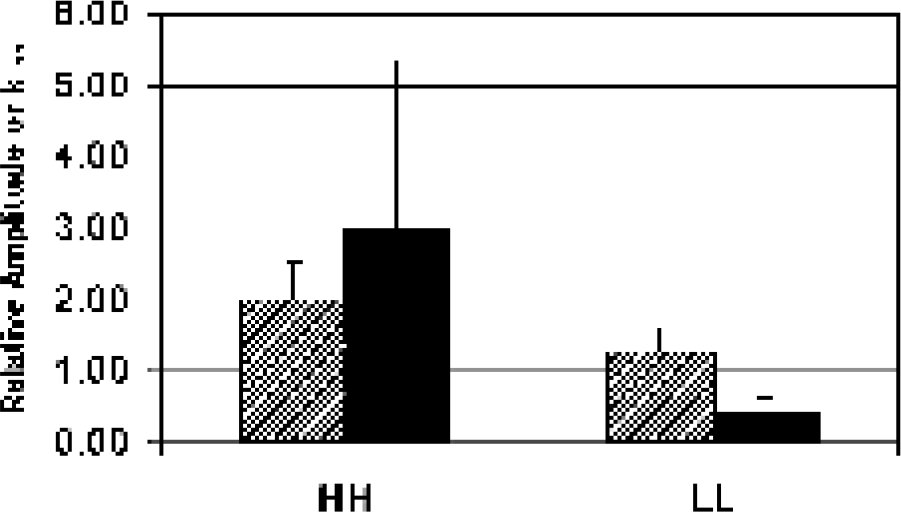
Tumor heterogeneity. Pharmacokinetic parameters of amplitude (diagonal bars; p = 0.04*) and kep (solid bars; p = 0.08*) for high amplitude and kep regions (HH) and low amplitude and kep regions (LL). *Paired one-tailed t test.

Coregistration and histology. Histological coregistration of tumor section with corresponding MRI slice (A). H&E staining (B) and CD31 immunostaining (C) showed no differences between high amplitude and kep regions (left) and low amplitude and kep regions (right).
Tumors were coregistered with MRI images (Figure 4A). No differences were observed in cellular morphology and gross architecture on H&E staining between pharmacokinetically distinct regions (Figure 4B). Furthermore, both high and low enhancing regions showed an abundance of endothelium on CD31 immunohistochemistry (Figure 4C). Tissue was obtained through LCM from distinct pharmacokinetic regions based on sections coregistered with MRI slices. Thus, for subject mouse tumors, LCM was performed on high A and kep regions (HH) and low A and kep regions (LL). To minimize biological noise within microarray data, competitive hybridization between HH and LL ROIs (or separate tumor regions for the control mouse) was performed for each subject mouse. Microarrays were performed in duplicate, reciprocating fluorochromes to control for labeling bias.
The Pearson correlation coefficient for duplicate arrays were all >.90, demonstrating interarray hybridization reproducibility. From the complete set of printed genes, 8804 passed baseline quality control filtering criteria for signal to noise, spot size, and spot intensity. Genes were further filtered for difference in expression between HH and LL regions at a ratio of 2.0 in five of eight arrays yielding 166 differentially expressed genes (Figure 5). Of these 166 genes, none were differentially expressed within the control tumor based on these filtering criteria. Due to the possibility of false-positive data from multiple sample testing inherent to microarray analysis, more stringent filtering criteria were applied (ratio of 2.0 in all six subject microarrays), yielding 44 differentially expressed genes. Of these 44 genes, 37 genes were higher expressed and 7 genes were lower expressed in HH regions compared to LL regions.

Microarray analysis. cDNA microarray analysis of three subject tumors with distinct pharmacokinetic regions (see Figure 3) and one control tumor with minimal intratumor heterogeneity. A dataset of 166 genes was extracted at an expression ratio of greater or less than 2.0 in five of eight arrays. Hierarchical clustering of genes and arrays was performed on this dataset. Increased (red) and decreased (green) relative expression in high amplitude and kep regions compared with low amplitude and kep regions (except the control in which difference was present). No difference in expression is depicted as black boxes. Genes not found are depicted as gray boxes. FW = forward labeled array; RC = reciprocal labeled array (fluorochromes switched).
Increased Gene Expression of Ribosomal Genes
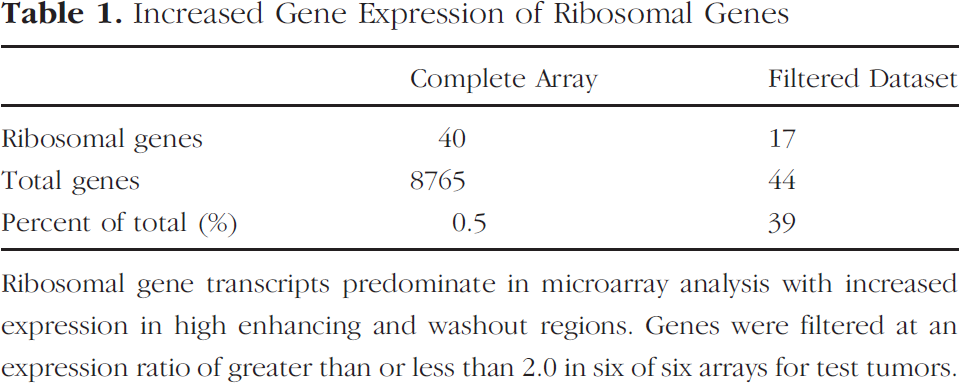
The proangiogenic molecules basic fibroblast growth factor (bFGF) and vascular endothelial growth factor (VEGF) were not included in this filtered group of genes (gene expression ratios of 1.3 and 1.0, respectively). Seventeen of 44 genes were ribosomal proteins (39%) as compared to 0.5% ribosomal proteins on the total microarray geneset (Table 1). Microarray gene expression ratios for two ribosomal genes, murine RpL44 and RpS16 from the large or small subunits, respectively, were verified using qRT-PCR (Figure 6). Increased gene expression of upstream transcription factor (Usf1), a fairly ubiquitous transcription factor implicated in the regulation of FGF binding protein (FGF-BP) and glycolysis, was also validated using qRT-PCR (Figure 6). Usf1 transcript was not detectable using qRT-PCR in the control mouse tumor. Several genes involved in glycolysis and the electron transport chain (oxidative metabolism) were found to be more highly expressed in HH regions (phosphoglycerate mutase, aldolase, cytochrome c oxidase, NADH-ubiquinone oxidoreductase chain 4). Of the glycolytic rate-limiting step enzymes, hexokinase 1 had an expression ratio >2.0 in two of three subject tumors with an average expression ratio of 1.6 in HH compared to LL regions across all three tumors. Pyruvate kinase had increased expression in five of six arrays (average expression ratio of 2.3).

qRT-PCR and microarray gene expression values between high amplitude and kep regions (HH) and low amplitude and kep regions (LL) of ribosomal protein L44 (RpL44), ribosomal protein S16 (RpS16), and Usf1. Subject tumor average for qRT-PCR (diagonal stripes) and microarray (horizontal stripes). Control tumor expression for qRT-PCR (hash marks) and microarray (solid). In the control tumor, the Usf1 transcript was not detectable by qRT-PCR.
Discussion
As DCE-MRI has evolved into an important tool for evaluating tumor vasculature, we must begin to dissect and understand the underlying molecular mechanisms present or responsible for the observed heterogeneity. To our knowledge, this represents the first published study evaluating intratumor heterogeneity at a molecular level using DCE-MRI as a template for analysis. DCE-MRI is theoretically dependent on functional tumor vasculature for contrast-related enhancement. As such, we initially hypothesized that variations in gene expression would be related to perfusion-dependent phenomena relating to oxygenation and nutrition such as cellular proliferation and angiogenesis. Taking into consideration the limitations of cDNA microarray analysis at the transcriptional level and the use of an ectopic tumor model, our results demonstrate multiple interesting observations and provide insight into DCE-MRI defined tumor heterogeneity.
The most striking finding on our microarray analysis was the preponderance of genes involved in ribosome biogenesis. An increase of ribosomal gene transcription is generally due to increases in cellular demand for increased translational activity and is typically seen in proliferating cell populations. Stimuli affecting the rate of ribosomal formation are nutrition, growth factors, and temperature [23,24]. Thus, it follows that HH regions, as demarcated by DCE-MRI, should have increased cellular activity, reflected in increased ribosome biogenesis, due to increased nutrition, oxygenation, and other factors provided by functional vasculature. While this has been anecdotally assumed by observation and through correlations using [18F]2-fluoro-2-deoxyglucose (FDG) PET and functional MRI [25,26], to our knowledge, this is the first in vivo demonstration of increased general cellular activity in regions of increased contrast enhancement at a molecular level.
Despite distinct pharmacokinetic regions based on contrast enhancement, differential expression for several proangiogenic molecules including VEGF and bFGF was not observed on microarray analysis. However, this lack of differential proangiogenic gene expression does not exclude differences in angiogenesis at a functional level. Posttranscriptional regulation of angiogenesis, which may not be detectable as measured by cDNA microarray, may play an important role in modulating angiogenesis within this tumor population. In contrast, the presence of equivalent CD31 immunohistochemical staining between distinct tumor regions supports the hypothesis of roughly equal angiogenesis between distinct tumor regions, and thus no differences would be observed on microarray analysis. The pharmacokinetic distinction observed using DCE-MRI would have greater correlation with functional vasculature, and not necessarily active angiogenesis. This does not undermine the utility of DCE-MRI as a marker of response to antiangiogenic drugs, as a change from a baseline study likely indicates a change in the vascular status of a tumor. However, it does provide evidence for exercising caution when using contrast enhancement or pharmacokinetic profile characteristics of a tumor to make assumptions about an active angiogenic process.
Several genes involved in glycolysis and the electron transport chain, including phosphoglycerate mutase, aldolase, cytochrome c oxidase, and NADH-ubiquinone oxidoreductase chain 4, were identified as being more highly expressed in HH regions using microarray analysis. Furthermore, the heavily regulated glycolytic enzymes, hexokinase and pyruvate kinase, showed a strong trend toward increased expression in HH regions, though not passing the most stringently applied expression change filters. Together, the modulation of this group of genes supports the hypothesis of increased glycolysis and oxidative metabolism in HH regions. FDG hypermetabolism has been shown to have high concordance with Gd-DTPA enhancing tumors [25]. Our findings support the correlation between FDG-PET and Gd-DTPA enhancement due to increased glucose consumption at a molecular level. Furthermore, the dependency of the electron transport chain on oxygen supports the presence of functional vasculature in HH regions.
Of particular interest was the observation of increased expression of the transcription factor Usf1 in HH regions. Usf1 has been implicated in the regulation of glycolysis, hypoxic response, and angiogenesis [27–30]. Thus, Usf1 appears to function in several important mechanisms of cell function and survival, and may play an important role in the switch to and subsequent maintenance of the angiogenic phenotype in tumors. Further evaluation of Usf1 is necessary to assess its possible role in these processes and is beyond the scope of this study. Moreover, as demonstrated with Usf1, this study provides more avenues for investigation than answers. Nevertheless, these results provide the foundation for addressing specific hypotheses.
In summary, DCE-MRI appears to be useful as a general means of monitoring functional vasculature and basic cellular processes such as metabolism and proliferation rather than specific molecular events. However, we have demonstrated a versatile experimental design and method of investigation for understanding and correlating imaging methods and in vivo mechanisms of therapeutics at a molecular level. Additionally, the application of proteomics for evaluating posttranscriptional function will become an important and necessary component of this experimental model. Furthermore, our study underscores the importance for the development of novel imaging methods and contrast agents targeted at the molecular level in order to provide direct correlation between imaging and biological activity.