
Abstract
Heme oxygenase (HO) is the rate-limiting step in the heme degradation pathway and is a potential target for the control, or prevention, of pathologic jaundice in neonates. Metalloporphyrins (Mps), a diverse set of synthetic derivatives of heme, can competitively inhibit the HO enzymes. However, certain Mps are phototoxic and some increase transcription of HO-1, the inducible HO isozyme. Therefore, effective development of this class of compounds as therapeutics for treating pathologic jaundice will require rapid and integrated biological screens to identify the most efficacious and safe Mps. To study the safety of these compounds, we assessed their cytotoxic effects and measured luciferase activity by bioluminescent imaging (BLI) as an index of HO-1 transcription, first in live cell cultures and then in living transgenic reporter mice. A total of 12 Mps were first evaluated in the correlative cell culture assay. Based on results from this study, 2 Mps, zinc protoporphyrin (ZnPP) and zinc bis glycol porphyrin (ZnBG), were selected for further studies in the live animal model. In vitro BLI showed ZnPP to be a strong inducer of HO-1 transcription in comparison to ZnBG, which showed minimal induction. Cytotoxicity studies revealed that ZnPP was phototoxic, whereas ZnBG had no effect on cell viability. In vivo BLI showed that both ZnPP and ZnBG had minimal effects on the levels of HO-1 transcription in the animals. Furthermore, serum enzyme assays indicated that neither caused detectable liver toxicity. These findings, and especially those with ZnBG, support the use of selected Mps as therapies for pathologic jaundice. Coupling the high throughput advantage of cell culture with the capability of imaging for whole-body temporal analyses could accelerate and refine the preclinical phases of drug development. Thus, this study serves as a model for understanding the effects of specific compounds in relation to defined targets using an integrated approach.
Introduction
Heme oxygenase (HO) is the rate-limiting enzyme in the heme catabolic pathway where heme is degraded to equimolar quantities of ferrous iron, carbon monoxide, and biliverdin, which is immediately reduced to bilirubin [1]. There are currently three identified HO isoenzymes [2], and of these, HO-1 and HO-2 have been most thoroughly studied. HO-1 is the inducible isoform that responds to a variety of stimuli, including heme, heavy metals, heat shock, and UV irradiation [3–6]. In contrast, HO-2 is constitutively expressed in many tissues and is not readily induced. Induction of HO-1 transcription following cellular stress led to HO-1 as being described as a general stress protein (the 32-kDa heat shock protein [hsp–32]) [7]. The stress response of the HO-1 promoter, as evaluated in cell culture, is thought to occur via three enhancer elements upstream of the HO-1 transcriptional start site. These are thought to act alone or in concert depending upon the stimulus [8].
Because neonates have an increased red blood cell mass and turnover at birth, they have an increased bilirubin production rate on a per body weight (BW) basis compared to an adult. Moreover, the neonate's capacity to eliminate bilirubin can easily be overwhelmed leading to toxic accumulation of bilirubin, which can result in severe neurological complications and lead to death. Current therapies include phototherapy and exchange transfusion. Phototherapy oftentimes is inadequate in pathologic hyperbilirubinemia and exchange transfusion is invasive with potentially serious complications. A more logical strategy would be to inhibit HO enzyme activity, which would result in reduced production of bilirubin, reducing the risk of pathologic levels of bilirubin that could lead to detrimental long-term effects.
Metalloporphyrins (Mps) are compounds that are structurally similar to heme with differences in the core metal, as well as modifications to ring substituent groups. Several Mps have been shown to decrease bilirubin formation by competitive inhibition of HO activity [9–16]. This property of Mps is desirable in the treatment of jaundice. However, Mps are a diverse class of compounds with a range of biological and toxic effects that vary depending on the specific core metal and associated porphyrin ring side chains [12,17]. The phototoxic property of some of these compounds has been exploited in their use in photodynamic therapies, however, this property would be detrimental when used to treat hyperbilirubinemia in antioxidant-deficient neonates, some of whom might require phototherapy. Moreover, some Mps have been shown to induce transcription of HO-1, which could cause undesirable side effects, or offset their clinical utility in the treatment of protracted hyperbilirubinemia [18–20]. Mps that have been shown to increase transcription of HO-1 include tin protoporphyrin (SnPP), zinc protoporphyrin (ZnPP), and cobalt protoporphyrin (CoPP). Of these, SnPP and ZnPP have also been shown to inhibit enzymatic activity [21–24].
Before large-scale clinical use of Mps can be initiated, studies investigating that Mps do not cause potential long-term cellular and organ damage are warranted. To accelerate the development of this class of compounds as therapeutics, we combined a high-throughput live cell assay, designed to select the compounds that are not strong HO-1 inducers or highly toxic, with an in vivo model where the HO-1 promoter was used to express the reporter luciferase (luc) as a transgene (Tg) in mice [19]. By coupling the correlative cell culture assay with in vivo bioluminescent imaging (BLI) through a common reporter gene, it was possible to streamline the analyses and maximize the data set for this set of compounds. Accelerating and refining the preclinical phases of drug development through integrated assays should improve the data sets and enhance the selection of potential therapeutics.
Materials and Methods
Generation and Maintenance of Stable Murine Cell Lines
HO-1-luc constructs were prepared by inserting a 15kb NotI-Sse8387I fragment containing the full-length HO-1 promoter (encompassing two distal enhancer elements and a proximal enhancer in addition to the basal promoter, Figure 1A, HO-1-luc15) from pMHO-cat15 (kindly provided by Dr. J. Alam) [25], or a 1.4-kb truncated HO-1 promoter (consisting of only the proximal enhancer region and the basal promoter, Figure 1A, HO-1-luc1.4), and a 2.0-kb HindIII–SalI fragment containing the entire modified luciferase (luc coding sequence and a 3–poly-A signal sequence from pGL3-Basic (Promega, Madison, WI) into pBluescriptKS(+)vector (Stratagene, San Diego, CA) [19]. These constructs were then used to generate stable cell lines as follows: NIH3T3 cells were cultured in Dulbecco's Modified Eagle's Medium (DMEM) supplemented with high glucose,
NIH3T3 cells were first seeded onto culture wells, and at 50–70% confluency, the cells were washed with 2 mL of Opti-MEM I medium. DMEM (800 μL) and liposome-DNA mixture (200 μL) were added to each well for a total volume of 1 mL. After 4–5 hr of incubation in a CO2 incubator, 2 mL of DMEM was added to each well. At 12–24 hr posttransfection, reporter gene expression was measured in transfected live cells by BLI using an intensified charge-coupled device (CCD) camera (Model C2400-32; Hamamatsu, Japan) in the presence of luciferin (added to a final concentration of 150 μg/mL from a 15-mg/mL stock (BioSynth, Naperville, IL). The images were acquired for 5 min using LivingImage software (Xenogen, Alameda, CA). Wells with the most intense bioluminescent signals relative to controls were identified and selected as described below.
Bioluminescent cells were removed with trypsin and transferred to three 100-mm2 tissue culture plates containing 10 mL of complete DMEM medium supplemented with 500 μg/mL of Zeocin (Invitrogen). This selection medium was changed every 4 days, and after 2–3 weeks, bioluminescent colonies were identified as described above and were then removed directly from the culture dish with a pipette. Cells from each of these selected colonies were then transferred into individual wells of a 96-well plate. Cultures were expanded over a period of 15–21 days. Subsequently, samples were frozen in DMEM containing newborn calf serum, growth medium, and dimethyl sulfoxide (DMSO) in a ratio of 5:4:1. When needed, these stable lines were quickly thawed and grown in 75-cm2 flasks in DMEM supplemented with high glucose,

Diagram of HO-1-luc fusions and reporter gene expression levels in stable cell lines containing the full-length or truncated HO-1 promoters. (A) The HO-1-luc 15 expression vector containing the entire 15-kb 5′-upstream regulatory region of the murine HO-1 gene and the entire coding sequence of the firefly luciferase (luc) gene (top). The HO-1-luc1.4 fusion containing a 1.4-kb truncated HO-1 promoter and luc (bottom). DE = distal enhancer, PE = proximal enhancer, P = promoter. (B) Relative basal levels of HO-1 expression from the full-length (top) and truncated (bottom) promoter are shown and expressed as relative light units (RLU). (C and D) The effects of CdCl2 and heme treatment on the expression of the reporter gene in stable cell lines, which contain the full-length (left) or truncated (right) HO-1 promoter. Each condition was repeated four times per experiment at each time point, although only single wells are shown. All images are displayed identically. Each well contained 5 × 10⁴ cells in 300 μL of growth medium containing luciferin. Cells were imaged using an intensified CCD camera with 2-min acquisition times and photon counts from the entire well were quantified using the Argus 20 (Hamamatsu). (E and F) The graphs show fold induction from control levels (mean ± SD, n = 6) of cells containing the full-length (-●-) or truncated HO-1 promoter (-▪-) after treatment with 5 μM CdCl2 or 20 μM heme. At some time points, the SD is minimal and obscured by the symbols. Time- and dose-dependent increases in expression were observed for the full-length promoter after addition of CdCl2 or heme. Expression from the truncated promoter was not significantly elevated with CdCl2 (5 μM) at the 8- and 10-hr time points.
Mps, Methemalbumin, and Cadmium Chloride
Mps (Table 1; Porphyrin Products, Logan, UT) were prepared under subdued light as 0.6- or 1.2-mM solutions using 4–5 mg of Mps in 60 μL of 10% ethanolamine and 60 μL of 1.0 N HCl for solubilizing and phosphate-buffered saline (PBS) as solvent for dilution to appropriate concentrations, titrated to a pH of 7.4–7.8, and stored at 4°C in the dark until use. Methemalbumin (MHA or heme) stock solution (1.5 mM) was prepared by dissolving 9.9 mg of hemin (Sigma-Aldrich, St. Louis, MO) in 2.5 mL of 0.4 M Na3PO4, and distilled water was added to a volume of 8 mL. One hundred milligrams of bovine serum albumin (A7030, Sigma-Aldrich) was then added. The pH was adjusted gradually to 7.4 using 1.0 N HCl. Distilled water was added to a final volume of 10 mL, and the solution was stored at 4°C for up to 14 days. Cadmium chloride (CdCl2) was prepared from a powder preparation as 0.8- or 1.25-mM stock solutions using sterile water as solvent.
Correlative Cell Culture Assays
Screening of Mps. Stable cell lines containing either the full-length or truncated HO-1-luc promoter were placed into each well (5 × 10⁴ cells in 300 μL of media) of a 96-well plate and then treated with CdCl2 (0-5 μM) or heme, ZnPP, or zinc bis glycol porphyrin (ZnBG) (0–20 μM). Cells (n = 4 wells per condition) were monitored from 0 to 10 hr by BLI as described above to establish peak HO-1 induction times.
Fold Induction of HO-1 Transcription
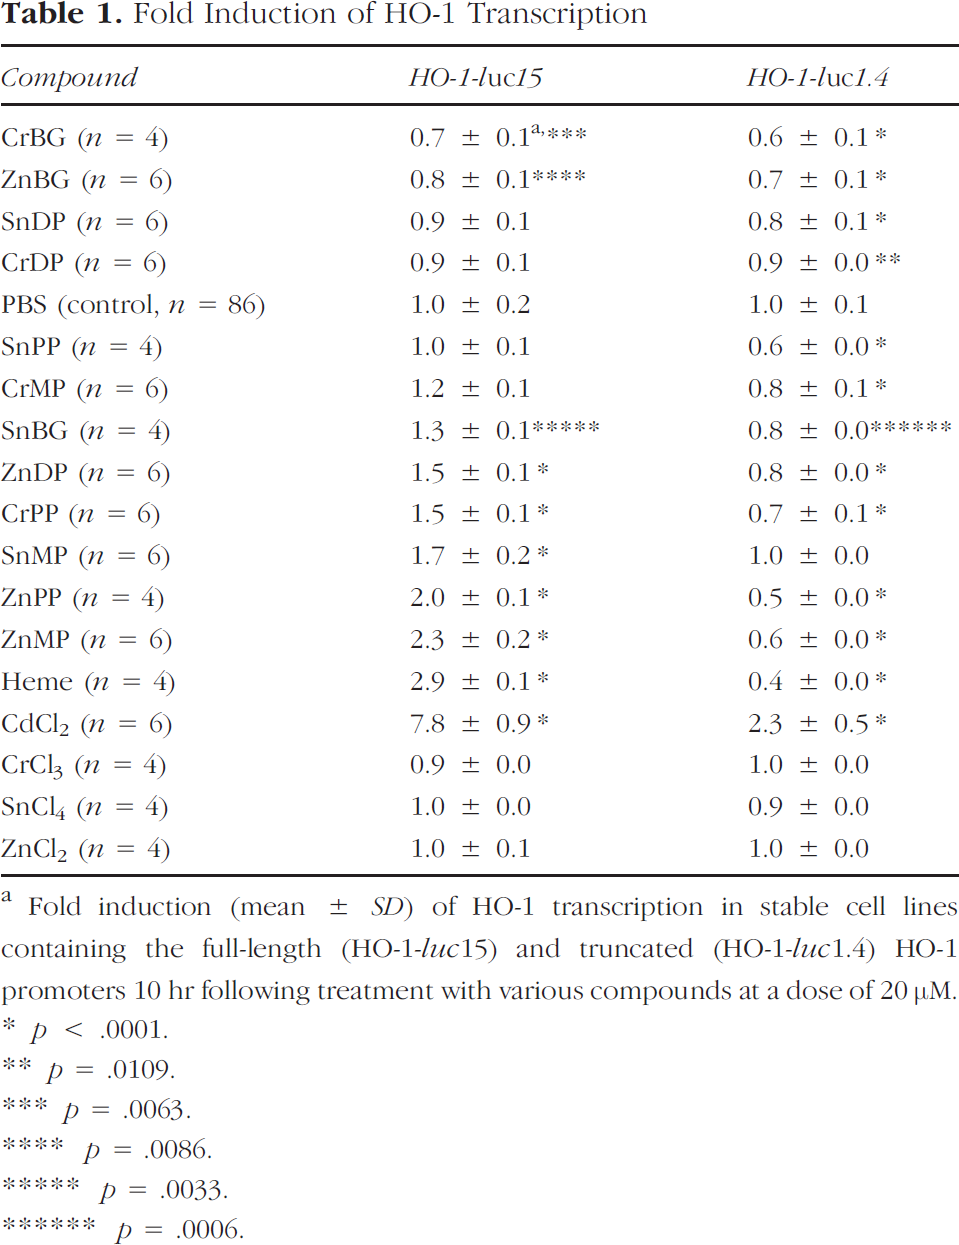
aFold induction (mean ± SD) of HO-1 transcription in stable cell lines containing the full-length (HO-1-luc15) and truncated (HO-1-luc1.4) HO-1 promoters 10 hr following treatment with various compounds at a dose of 20 μM.
* p <.0001.
** p = .0109.
*** p = .0063.
**** p = .0086.
***** p = .0033.
****** p = .0006.
Stable cell lines containing either the full-length or truncated HO-1-luc promoter were placed into each well (5 × 10 cells in 300 μL of media) of a 96-well plate and then treated with PBS (control) or 1 of 12 Mps, each with one of three central metals (chromium, Cr; tin, Sn; or zinc, Zn) and one of the following porphyrin ring substituents: deutero (DP), meso (MP), bis glycol (BG), or proto (PP) porphyrin at a concentration of 20 μM. After 10 hr of treatment, HO-1 expression in each well (n ≤ 6 per Mp group, n = 86 for control) was then assessed using BLI.
Phototoxicity assay. In these studies, only cells containing the full-length HO-1-luc promoter were used. Approximately 2 × 10⁴ cells in 100 μL were placed each well of a 96-well plate and incubated for 18–24 hr at 37°C. For dark conditions, 96-well plates were wrapped in aluminum foil. For light exposure conditions, cells were exposed to cool white light (CWL) at 20 W for 15 min with the temperature of the cell environment thermostatically maintained between 37° and 40°C. Cells were then incubated with PBS (controls), Geneticin (G418) at 500 μg (as a positive control for cytotoxicity), ZnPP or ZnBG at 10, 50, or 100 μM, or CdCl2 at 10 μM. Cytotoxicity (cell viability) was followed hourly from 0 to 6 hr and then at 24, 48, and 72 hr using separate wells for each time point. CellTiter 96 Promega® was used to measure cell number in a spectrophotometer at a wavelength of 490 nm.
HO-1 transcriptional activity assay. In the same set of cell culture plates, 150 μg/mL of luciferin was added to each well and incubated at 37°C in 5% CO2 for 10–15 min at hourly time points from 0 to 6 and at 24 and 48 hr. In vitro BLI was then performed as describe above but with an image acquisition time of 2 min to assess HO-1 transcriptional activity.
Reporter Mice Studies
Toxicity assay. HO-1-luc Tg mice (3–6 weeks old) [19] were treated with ZnPP or ZnBG at 20 or 50 μM/kg BW or with 30 μM CdCl2/kg BW iv. Blood was sampled at t = 0, 1, 3, and 7 days after treatment via retroorbital bleeding and then immediately sent to the veterinary laboratory at Stanford University for serum glutamic oxaloacetic transaminase (SGOT) and serum glutamic pyruvic transaminase (SGPT) analyses. ZnPP, ZnBG, or CdCl2 were injected into mice on Day 0 after the initial blood samples were taken. Control mice were injected with PBS in the same volume as those treated with Mps or CdCl2.
HO-1 transcriptional activity assay. For BLI, mice were sedated using intraperitoneal injections of Nembutal (5–25 mg/kg BW) during the bleeding procedures and imaging. Animals were closely monitored during their anesthetic state for respiration rate. For imaging, mice were treated, after sedation, with 150 μg luciferin/kg BW ip. After 5–10 min, animals were placed in the In Vivo Imaging System (IVIS, Xenogen); the detector in this system is a cooled CCD camera. A grayscale body surface reference image (digital photograph) was obtained under weak illumination. Images of the bioluminescent signals from expression of the transgene were acquired at 5-min integration times. For anatomical localization, a pseudocolor image representing light intensity (blue, least intense, and red, most intense) was generated and superimposed over the grayscale reference image. Photons emitted from luc-expressing cells within the body and transmitted through the tissue were quantified using LivingImage software (Xenogen). Annotations were added using another graphics software package (Canvas 5.0; Deneba, Miami, FL).
Statistical methods. All data are presented as mean ± SD. For cell culture studies, cell viability data from cell cultures were normalized to cell number and expressed as fold difference from control levels. HO-1 transcription was calculated as the fold change in signal intensity at 10 hr after treatment from baseline (pretreatment) levels. Data were then normalized to fold changes in the PBS-treated group and expressed as fold induction. For animal studies, data from liver enzyme studies were analyzed by repeated-measures ANOVA with statistical significance determined using Fischer's exact t test. Changes in HO-1 transcription levels at each time point was first calculated from basal (t = 0 h) levels of each mouse in each group and then normalized to control mice and expressed as fold induction. Statistical significance was then analyzed using unpaired t tests with significance at p <.05.
Results
Cell Culture Studies
HO-1 expression patterns as correlates of in vivo expression patterns. When basal levels of luc activity patterns were determined by BLI for each stable cell line, HO-1 expression in cells containing the truncated promoter (lacking the two distal enhancer elements) was only a fraction (23%, 6.4 × 10⁴/2.8 × 105) of the cells containing the full-length promoter (Figure 1B). When the cell lines were treated with serum-free media containing the known HO-1 inducers, CdCl2 (at 0–5 μM, Figure 1C) and heme (at 0–20 μM, Figure 1D), there was a dose- and time-dependent induction only in cells containing the full-length HO-1 promoter (●). Transcriptional activation was initially observed 4 hr after treatment with either inducer. Following exposure to 5 μM CdCl2, expression was sevenfold (p <.05) over that of untreated cells with peak induction between 8 and 10 hr. In contrast, expression from cells containing the truncated promoter was only twofold greater than that of untreated cells with peak induction occurring at approximately the same time (Figure 1E) as that of cells containing the full-length promoter. After treatment with 20 μM heme, HO-1 expression levels in HO-1-luc15 cells increased to a maximum of threefold (Figure 1F, p <.05) over control levels after 10 hr, whereas expression in cells with the truncated promoter essentially did significantly decreased to 57% of control levels.
Effects of Mps on HO-1 expression. The results of the cell culture evaluating the effects of 12 Mps are summarized in Table 1. For the HO-1-luc15 cells, zinc mesoporphyrin (ZnMP) appeared to be the strongest inducer with a 130% increase over controls. Tin bis glycol porphyrin (SnBG), zinc deuteroporphyrin (ZnDP), chromium protoporphyrin (CrPP), tin mesoporphyrin (SnMP), and ZnPP, in increasing order, induced expression by 33-100% over controls (p ≤ .0006). SnDP, chromium deuteroporphyrin (CrDP), SnPP, and chromium mesoporphyrin (CrMP) did not significantly affect HO-1 expression. Interestingly, chromium bis glycol porphyrin (CrBG) and ZnBG were found to significantly decrease expression by at least 25% (p ≤ .0086). Expression levels from the truncated promoter were all significantly decreased (ranging from 12% to 43%) from control levels after treatment with all 12 Mps, except SnMP, which did not affect expression at all.
Because metal ions, such as Cd2 +, Zn2 +, and Hg2 +, have been shown to induce HO-1 expression in L929 mouse cells [26], it was necessary to demonstrate that the observed transcriptional effects were mediated by Mps, and not by the central metal ions that may possibly be released during Mp degradation. Therefore, the cell lines were treated with 20 μM of CdCl2, CrCl3, SnCl4, and ZnCl2. Unlike Cd2+, the Cr3+, Sn4+, and Zn2 + ions had no affect on HO-1 expression in cell lines containing either transgene (Table 1).
ZnPP and ZnBG were then chosen for comparison because ZnPP is a naturally occurring Mp and has been shown to be an effective inhibitor of tissue HO activity[18] and a strong inducer of HO-1 (Table 1). ZnBG has been shown to be orally bioavailable [27], a potent inhibitor of HO activity [28], and a poor inducer of HO-1 transcription (Table 1). Figure 2 depicts the temporal effects of these Mps administered at a concentration of 20 μM to cells containing either the full-length or truncated HO-1-luc promoter (Figure 2A and B). The induction pattern following treatment with ZnPP (Figure 2A) was similar to that observed after treatment with heme (Figure 1F) in cells containing either HO-1-luc fusion. The effects were also time- and dose-dependent with peak levels achieved within 8 hr after treatment. Compared to the nearly twofold induction of HO-1 expression by ZnPP (p ≤ .0001), ZnBG resulted in a decrease or no change in expression in either reporter cell line (Figure 2B).
Cytotoxicity of selected zinc Mps. ZnPP and ZnBG were tested for cytotoxicity only in cells containing the full-length HO-1 promoter under dark conditions and exposure to CWL [29]. Using a range of concentrations (0–100 μM) of Mps and CdCl2 at 10 μM, cell growth was compared to controls and cells treated with G418 500 μg (positive control for cytotoxicity).

Effects of ZnPP and ZnBG on HO-1 transcription in stable cell lines. Quadruplicate wells containing cells with the full-length (left) or truncated HO-1 promoter (right) were treated with 0, 5, 10, or 20 μM of ZnPP or ZnBG in serum-free media and followed over a 10-hr time course by live cell bioluminescence imaging. Data from the cells treated with the highest concentration (20 μM) of ZnPP (A) and ZnBG (B) are plotted as mean ± SD fold increase of HO-1 expression from the full-length (-●-) or truncated (-▪-) HO-1 promoter over untreated controls. At some time points, the SD is minimal and obscured by the symbols. An increase of reporter gene expression was found only in cells containing the full-length promoter after treatment with ZnPP, but not with ZnBG.
The effects of ZnBG on cell growth under dark conditions were evaluated over 48 hr (Figure 3A, 50 μM data shown only). Cell viability (Figure 3B, black line) was not affected at 10- and 50-μM concentrations after 48 hr, but a drop in cell number at 100 μM was observed and was found to be statistically significant up to 24 hr, but not after 24 hr (p <.05). There was a significant increase in HO-1 induction at all time points except at 4 hr in the ZnBG-treated cells (Figure 3B, red line).
When the effects of ZnPP under dark conditions were evaluated over 48 hr (Figure 3C, only 50 μM data are shown), cell number decreased significantly at concentrations of 10, 50, and 100 μM in the first hour (Figure 3C, black line). At 10 μM, cell growth continued to decrease through 48 hr. ZnPP at 50- and 100-μM concentrations showed an overall average increase in cell number over controls from 2 to 48 hr. There was a significant increase in HO-1 induction at 4, 6, and 48 hr after treatment with ZnPP (Figure 3C, red line).
ZnBG-treated cells showed a similar cell viability pattern as controls at 10– and 50-μM concentrations during the first 6 hr of exposure, at which point a statistically significant drop in cell number was observed for 50 μM at 24 and 48 hr (Figure 4B, black line). At 100 μM, a statistically significant decrease from 1 to 48 hr was similar to the findings found under dark conditions. HO-1 induction was insignificant at all time points except at 2 and 4 hr (Figure 4B, red line).
ZnPP-treated cells showed a large drop in cell number within 1 hr with total cell death by 24 hr (Figure 4C). Relative bioluminescence/cell spiked at 1 hr with a decrease thereafter and is most likely secondary to overwhelming cell death (Figure 4C, red line).
Animal Studies
Zinc Mps did not affect liver enzyme levels. No statistical differences in the SGOT and SGPT levels were noted in mice treated intravenously with either ZnPP or ZnBG compared with untreated control mice (Table 2). Twenty-four hours after treatment with CdCl2, an increase in both SGOT and SGPT levels was observed, but was not statistically different from control levels.

Effects of G418, ZnBG, and ZnPP on the growth and HO-1 expression of stable cell lines under dark conditions. Growth was monitored over 48hr under dark conditions by protecting the plates from light using aluminum foil. (A) Rows 1–3 contained untreated cells (controls) and rows 4–5 contained cells treated with 500 μg G418. Effect of G418 on HO-1 gene expression of stable cell lines. Effect of G418 on cell viability (-▪-) and HO-1 induction (-●-) in the dark. (B) Rows 1–5 contain cells treated with 50 μM ZnBG. Effect of ZnBG on HO-1 gene expression of stable cell lines. Effect of ZnBG on cell viability (-▪-) and HO-1 induction (-●-) in the dark. (C) Rows 1–5 contain cells treated with 50 μM ZnPP. Effect of ZnPP on HO-1 gene expression of stable cell lines. Effect of ZnPP on cell viability (-▪-) and HO-1 induction (-●-) in the dark. Expressed as fold change compared with controls at the same time point. A fold change of 1 is no change compared with controls, <1 shows a decrease in growth or relative bioluminescence per cell, and shows > 1 an increase in growth or relative bioluminescence per cell compared with controls. A statistically significant increase in expression in cells treated with G418 was observed over 24 hr in the dark. ZnBG showed no effect in cell viability relative to controls. A statistically significant increase in HO-1 expression after treatment with 50 μM ZnBG was observed compared to controls. ZnPP showed an increase in cell number compared to controls. Variable increases in HO-1 expression were observed in ZnPP-treated cells relative to controls.

Effects of G418, ZnBG, and ZnPP on the growth and HO-1 expression of stable cell lines under CWL. Growth was monitored over 48 hr under CWL. (A) Rows 1–3 contained untreated cells (controls) and rows 4–6 contained cells treated with 500 μg G418. Effect of G418 on HO-1 gene expression of stable cell lines. Effect of G418 on cell viability (-▪-) and HO-1 induction (-●-) in CWL (B) Rows 1–5 contain cells treated with 50 μM ZnBG. Effect of ZnBG on HO-1 gene expression of stable cell lines. Effect of ZnBG on cell viability (-▪-) and HO-1 induction (-●-) in CWL. (C) Rows 1–5 contain cells treated with 50 μM ZnPP. Effect of ZnPP on HO-1 gene expression of stable cell lines. Effect of ZnPP on cell viability (-▪-) and HO-1 induction (-●-) in CWL. Expressed as fold change compared with controls at the same time point. A fold change of 1 is no change compared with controls, <1 shows a decrease in growth or relative bioluminescence per cell, and > 1 shows an increase in growth or relative bioluminescence per cell compared with controls. A statistically significant increase in expression was observed in cells treated with G418 initially; however, a decrease in expression after 6 hr was most likely secondary to overwhelming cell injury and death under CWL. The 48 hr time point is not shown because of dramatic cell death and low cell number. ZnBG showed decreased cell viability after 5 hr relative to controls in CWL. A statistically significant increase in HO-1 expression was seen after 5 hr in cells treated with 50 μM ZnBG under CWL compared to controls. ZnPP showed cell death within 1 hr of treatment with CWL indicating dramatic phototoxicity. A statistically significant increase in HO-1 expression during the first hour was found with a dramatic drop thereafter.
Effect of Intravenous Injections of Mps and CdCl2 on Liver Enzymes

aSerum glutamic oxaloacetic transaminase.
b(IU/L): international units/liter.
cSerum glutamic pyruvic transaminase.
dn = 3 mice per group
Effects of intravenous administration of zinc Mps on in vivo HO-1 transcription. Figure 5 shows images of HO-1-luc Tg mice taken at 0, 24, 72, and 168 hr after intravenous administration of PBS only (control, A) or 20 μmol/kg BW of ZnPP (B), ZnBG (C), or CdCl2 (D). ZnPP administration resulted in a statistically significant twofold increase in HO-1 transcription by 72 hr, which essentially persisted throughout the study period of 168 hr. In mice treated with ZnBG, HO-1 transcription was increased to 3.6-fold over control levels at 24 hr, but the elevation was not statistically significant due to marked biological variation between mice. Signals at 7 days were elevated 1.7- and 2-fold for ZnBG and ZnPP, respectively, but they were not statistically significant. CdCl2 administration resulted in a statistically significant sharp rise in HO-1 expression to 68-fold over control levels at 24 hr and decreased to 1.5fold by 72 hr (p <.05 at 24 and 72 hr).
Discussion
HO-1 is an enzyme with both beneficial and detrimental effects, depending upon the magnitude and tempo of its expression. HO-1 is thought to play beneficial roles in cytoprotection and in the modification of cellular susceptibility to oxidative stress [30]. However, excessive activation of the HO-1 isozyme can lead to toxic accumulation of compounds, such as bilirubin and iron. Therefore, modulating the dynamics of the HO-1 expression through the administration of HO inhibitors could potentially alter the cell's ability to respond to damage and stress. Regardless of the therapeutic area, cancer, transplantation, or jaundice, the potential undesirable effects that may result from this chemopreventive strategy need to be fully evaluated. Currently, preclinical evaluation of compounds for therapeutic utility is largely based on animal studies that lack access to real time in vivo information pertaining to drug effects on the target or nontarget cells and molecules. Here, we show that the effects of potential therapeutic compounds on gene expression patterns can be assessed in cell culture and in living animal models using BLI, and that this additional information can be used to improve and refine the drug selection paradigm. BLI enables us to quickly analyze a variety of samples in an in vitro assay compared to conventional Northern and Western blots, which would be considerably more labor intensive and time consuming. BLI also provides the advantage of analyzing cells without disturbing their environments and allows us to follow the same populations over time [19].

Effect of in vivo ZnBG and ZnPP intravenous injections on the HO-1 promoter over 7 days. Three mice were used for each group. Control (A, E, -▪-). ZnBG (C, E, -▪-) had an apparent effect of reporter gene expression although statistically not significant. ZnPP (B, E, -▪-) showed an increase in HO-1 expression response that persisted during the 7 days but was statistically significant only at 72 hr. CdCl2 (D, F, -▪-) showed a dramatic rise at 24 hr with a decrease by 72 hr.
We evaluated Mps, which are compounds that may prevent pathologic neonatal hyperbilirubinemia. If selection of these chemopreventive compounds was based solely on the potency of inhibiting HO enzymatic activity, pharmacologic parameters, and phototoxicity, the effects on HO-1 gene expression, which could potentially offset their therapeutic effect, would be neglected. In the absence of rigorous examination of these parameters, including transcriptional effects of Mps on the HO-1 gene, less desirable compounds could be selected for clinical trials, and the results of these trials could be confounded or unsuccessful.
As a screen to identify Mps with optimal characteristics for potential therapeutics, we used a rapid cell culture assay for monitoring HO-1 gene expression as a correlative assay for gene expression patterns in animal models and, potentially, in humans. These studies confirmed other reports [25,26,31–33] that the two distal enhancer elements (DE-1 and DE-2) previously identified in the HO-1 promoter are needed to both maintain normal levels of HO-1 expression and for full induction of HO-1 expression in response to stressor stimuli (Table 1, Kazerouni Zadeh HR et al., submitted). There was a notable decrease in HO-1 expression compared to controls with the truncated promoter and all the Mps except SnMP. ZnBG and CrBG demonstrated inhibition with both full-length and truncated promoters. This suggests possible cytotoxicity or a different mechanism of action on the promoter based on the specific Mps. The initial screening studies did not correct for cell number. Cell cultures were done to address the decrease in expression for ZnBG (Figure 3B) and revealed a minimal but statistically significant increase in induction when cell count was taken into consideration. The concentration of ZnBG used was also 50 μM versus 20 μM in the screening studies. These two factors could account for the discrepancies seen with ZnBG in the two studies. This does not address the findings with the truncated promoter. The mechanism of these findings is unclear and beyond the scope of this article but deserve further investigation.
This assay also showed that both heme and its analogs initially decreased basal levels of HO-1 expression in a dose-dependent manner, suggesting some cytotoxicity. However, cell viability did not decrease during the course of the assay, and increases in reporter gene expression were subsequently apparent. This agrees with the hypothesis that HO-1 is a stress protein, suggesting that stressed cells that survive an insult are protected through the induction of the HO-1 expression. Other protective mechanisms, not measured in this study, may also play a role in increasing survival.
The substituents on the porphyrin ring and central metal of the Mps seem to influence the effects of the various heme analogs on HO-1 transcription in cell culture (Table 1). In general, protoporphyrins and mesoporphyrins (range: 1.0- to 2.3-fold) seem to be stronger inducers than the bis glycol porphyrins (range: 0.70- to 1.33-fold). More specifically, two Zn porphyrins (ZnPP and ZnMP) appear to have the strongest effects on reporter gene expression (2.0- and 2.3-fold, respectively). Because Zn2+, Sn4+, and Cr3+ ions alone did not induce HO-1, increases in HO-1 transcription appeared to be mediated by the intact macrocyle and not by metal ions released from possible degradation of the Mps. Potentially, however, these compounds could demetalate intracellularly, and the metals themselves may have an effect on HO-1 regulation that was not evident in our studies. Ideally, the compound of choice for the treatment of hyperbilirubinemia would be one that inhibits HO-1 enzymatic activity, minimally induces the HO-1 promoter, and has little or no cytotoxic effects. In our in vitro studies, ZnBG showed no evidence of induction of the HO-1 gene compared with ZnPP, and other Mps, and had minimal or no phototoxicity.
In our cell culture studies of ZnPP, at 50- and 100-μM concentrations, we saw an increase in average cell viability compared with controls despite a drop in viability in the 10-μM group. This increase in cell viability may be related to the free Zn2+, because ZnPP is more apt than ZnBG to break down, which has been shown to increase cell viability, and at least, in the short term, suppress apoptotic-related events [34]. Because these cells were grown at low serum concentrations, they are at increased risk of cellular damage and death secondary to decreased nutrients. The addition of Zn2+ may have protected these susceptible cells from apoptotic-related events and increased their survival. The 10-μM concentration may not have provided enough free zinc or sufficiently induced the HO-1 system to protect the cells from injury. However, these differences in viability are not relevant to this study. CdCl2 first shows induction of reporter gene expression at 8–10 after treatment. At 24 and 48 hr, there was extensive cell damage and death. The control group showed that cells, stressed by light, heat, or cytotoxins (i.e., G418), have an increase in HO-1 transcription confirming previous reports that HO-1 may provide cytoprotection and is involved in cellular defense in various cell culture and animal models [35,36]. These findings suggest that surviving cells activate the HO-1 promoter.
Based on the results from the cell culture studies and the characteristics of the various Mps, we chose ZnPP and ZnBG for comparison using the Tg animal model and monitoring in vivo HO-1 transcription by BLI after intravenous administration of ZnPP and ZnBG. In these studies, ZnPP and ZnBG only minimally affected HO-1 induction, although only the effects ZnPP were statistically significant from the untreated control animals. ZnBG showed a fold induction of 3.6 at 24 hr, which appears to be relevant. However, it is not statistically significant. This result was biased by one mouse. Analysis excluding the outlier mouse shows a drop in fold induction to 0.43 ± 0.17. These results correlate with the cell culture results for ZnPP, but there is some discrepancy with ZnBG. With cell number taken into account, ZnBG showed a minor but statistically significant induction in vitro. This was not convincing in the in vivo studies. This may be secondary to a small sample size (n = 3 animal per group) or reflects the biological variations inherent in in vivo studies. Further studies increasing sample size will help delineate these discrepancies. Neither Mps showed evidence of liver toxicity based on blood tests at 20 or 50 μM/kg BW. Previous studies have shown that high concentrations of ZnBG (20–50 μM/kg BW) are lethal to neonatal rats exposed to CWL, with 80% mortality at 25 μM/kg BW [29], however, this was not evaluated in the present study.
We have previously shown that the expression of reporter genes expressed as transgenes in mice can be noninvasively detected using BLI, and that these reporter genes allow real-time evaluation of transcriptional regulation in living animals [37–39]. In the present study, we have coupled BLI measurements with cell culture assays that were designed to aid in the selection of compounds that may be useful for the treatment of pathologic jaundice. Our studies showed a correlation of HO-1 induction between cell culture and in vivo studies after treatment with ZnPP or CdCl2, but a weak correlation with ZnBG as well. Other studies have also reported inconsistent findings between in vitro and in vivo results. Linking the two assays enabled the selection of two compounds that may have therapeutic potential and enabled us to see potential differences that may exist between in vitro and in vivo systems. These preclinical studies provided more data than conventional assays and these will be useful for designing effective clinical trials for these compounds. Accelerating and refining the preclinical models for drug development through imaging and linking cell culture and in vivo assays will improve the selection of compounds for clinical trials and refine the study designs.
Footnotes
Acknowledgments
This work was supported by the National Institutes of Health grants HD37543, HL68703, and HL58013, the H. M. Lui Research Fund, the Hess Research Fund, and the Mary L. Johnson Research Fund.