
Abstract
Eight kinds of polyurethane (PU)-matrix composite samples were prepared by impregnating the warp-knit spacer fabrics with flexible PU foam. An impact test was carried out to investigate the influence of fabric structure parameters on the compression behaviors and energy-absorption efficiency of the composites. By using finite element (FE) analysis and ANSYS software, the unit cell models of the composites were built to simulate the impact responses and get strain-stress curves. Comparison of FE simulation and experimental curves showed good consistency between them.
Introduction
Polyurethane (PU) material is widely recognized for its outstanding elasticity and toughness, which is widely used in various fields. 1 However, as a kind of structural material, it is not enough to only have outstanding elasticity and toughness. In practical engineering applications, there are also high requirements for the strength of the material, which is the soft rib of PU materials. Therefore, in use, it is necessary to have reinforcement to strengthen PU materials, so that it has good elasticity, toughness, and strength. Because of its unique three-dimensional structure, high strength, and a variety of organizational structures, a spacer fabric is widely used as reinforcement material.2,3 At present, there is much research on the impact properties of PU and spacer fabric reinforced composites. Wang 4 used a Shimadzu test machine and an improved Hopkinson pressure bar (SHPB) to test two density (0.057 and 0.048 g/cm3) soft PU foam under quasi-static and dynamic compression, and obtained the compression performance at different strain rates. After studying the deformation mechanism of soft PU foam, Elliot 5 concluded that when the material was loaded, the first bending deformation was the long bubble prop tilted in the loading direction, and then the adjacent bubble pillars were torsional and bent, which caused the bending deformation of the long prop of the bubble to increase until a complete collapse band appeared. The change was the change from the elastic stage to the plain stage on the stress-strain curve. The inter-laminar shear and impact resistance of the composite made of the warp-knit spacer fabric was better than that of the general textile reinforced composite, because the two surface layers are connected by the spacer yarn in the thickness direction. In general, this material uses high-strength polyester fiber as the surface texture and spacer yarn to weave into the spacer fabric. The composite material is prepared by the vacuum assisted transfer (VARTM) process and used epoxy resin. The impact instrument is the same as that used for testing the impact performance of the spacer fabric, which is a drop hammer impact instrument. The impact force displacement curve and energy absorption displacement curve of the composite under different impact velocities are obtained through experiments, and the characteristics of energy absorption are discussed.6,7 The composite cell model is established, the stiffness matrix of the cell model is determined, and the impact force displacement curve and energy absorption curve in the impact process are simulated by using the finite element (FE) software, which are verified by comparison with the experimental results.8,9
In this study, a new type of warp-knit spacer fabric reinforced flexible composite material was obtained by compounding warp-knit spacer fabric and soft PU foam material. Based on the low-velocity impact test and FE analysis, the influence of the structural parameters of warp-knit spacer fabric on the impact response and energy absorption performance of the PU matrix composite under low-velocity impact conditions is discussed to provide the basis for choosing the appropriate fabric structural parameters under different application conditions.
Sample Preparation and Structure
Structure and Parameters of Warp-Knit Spacer Fabric
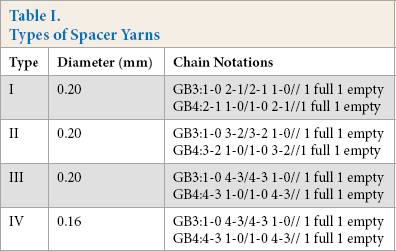
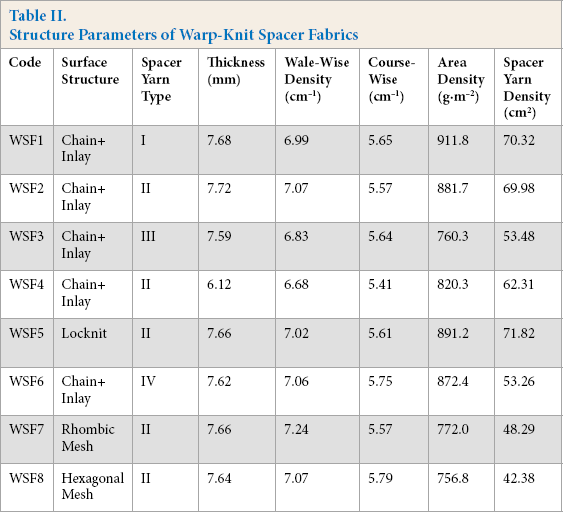
In this research, eight kinds of warp knitted spacer fabrics with different fabric structure parameters were selected. The selected warp knitted spacer fabric was constructed on the Raschel double-needle-bed warp knitting machine, with machine number E18 (Wuyang Co. Ltd., Jiangsu, China). Fig. 1 shows the basic structure of the knitting machine. The front guide bars (GB5 and GB6) knit a surface layer fabric on the front needle bar only, while the back bars (GB1 and GB2) knit the other separate surface layer fabric on the back needle bar. The middle bars (GB3 and GB4) carry the spacer yarns and knit on both needle bars in succession to connect the two outer layers. The materials of spacer fabrics were polyethylene terephthalate (PET) monofilament, 0.2 and 0.16 mm in diameter, for spacer yarns, and PET multifilament, 300D/96F, for the surface layer yarns. The surface layer structures were chain+inlay, locknit, rhombic mesh, and hexagonal mesh, as shown in Figs. 2a–d, respectively. Furthermore, the front and right view of spacer fabric is illustrated in Fig. 3. Two chain notations were involved for spacer yarns to connect to the outer layers. The type of spacer yarn and the structural parameters of spacer fabric are shown in Tables I and II.
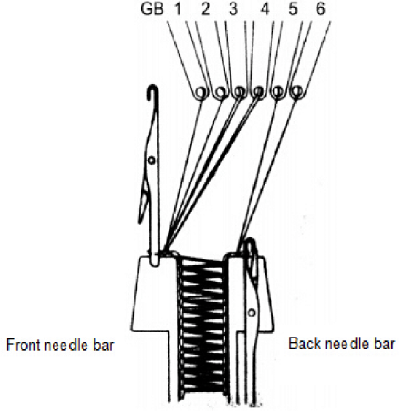
Model of double-needle-bar warp knitting machine. 10 Used under CC BY-NC-ND 4.0.
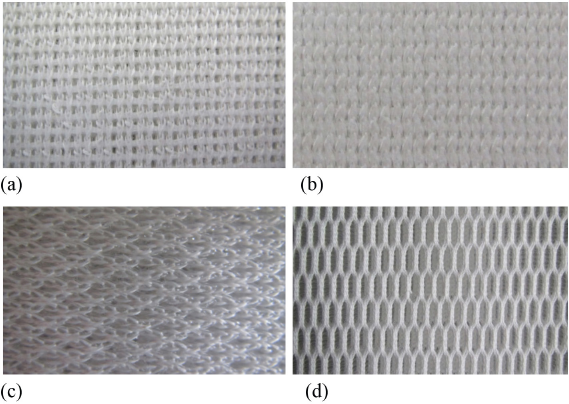
The surface layer structures (a) Chain+inlay, (b) locknit, (c) rhombic mesh, and (d) hexagonal mesh.
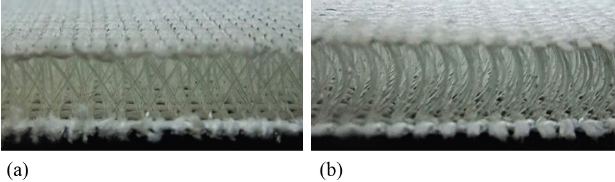
The (a) front and (b) right view of warp-knit spacer fabric.
Types of Spacer Yarns
Structure Parameters of Warp-Knit Spacer Fabrics
Preparation of Composite Sample
The PU material used in this research was soft PU foam, which is polymerized polyol and isocyanate. At room temperature, polyols and isocyanates were foamed in the reaction of M (polyols): m (isocyanates) = 100:43.7, with a moderate foaming rate and uniform foaming. In the preparation process, the distance between the upper and lower surfaces of the mold can be adjusted to the same thickness as the spacer fabric, and the upper and lower surfaces of the mold can be heated by a water bath to accelerate the curing process of the PU foam. When the samples of warp-knit spacer fabric composites (PWSFC) were prepared, eight kinds of warp knitted spacer fabrics (WSF1-WSF 8) were compounded with the PU system containing 3% opening agent, and the corresponding composite material number was PWSFC1-PWSFC8. 11 The details of the composites are illustrated in Table III. The real view and schematic diagram of the produced composites are shown in Fig. 4.
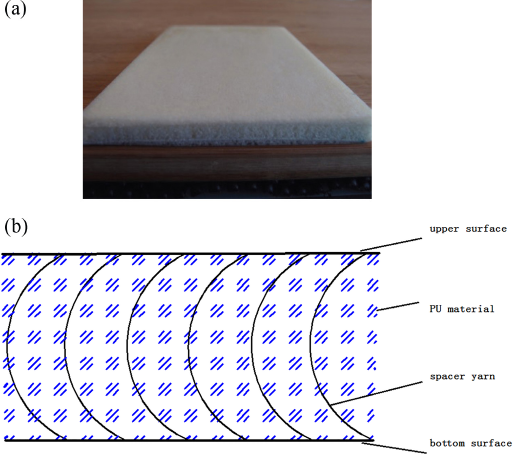
The (a) real view and (b) schematic diagram of PWSFC.
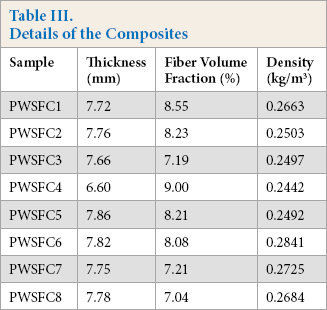
Details of the Composites
Low-Velocity Impact Test of Composites
A Dynatup 9250HV drop hammer impactor (Instron) was used for the impact test. The test was carried out according the GB/T8171-2008 (impact test standard for cushioning materials) standard. 12 According to the requirements of this standard, the punch adopts a cylinder punch with a flat end, with a mass of 6.017 kg, a section diameter of 25 mm, and a specimen size of 200 × 200 mm. In this study, eight kinds of composite materials were tested with an impact energy of 10 J, and all curves were the average values after five tests under the same conditions.
Experimental Results
Structure Change of Composites after Impact
The impact energy applied by the impact system is mainly withstood by the changes of displacement as a result of the bending of spacer yarns. Figs. 5a and b show the status of original spacer yarns and impacted spacer yarns under 10 J impact energy (the original spacer yarns bend slightly due to the knitting technology). A continual increase in force for composites subjected to impact energy is the result of the increased displacement and bending of spacer yarns. Furthermore, the degree of bending of spacer yarns is relative to the incident energy. The higher the incident energy, the greater the bending of the spacer yarns. However, it was observed that the fracture of spacer yarns were fully prevented as the composites were subjected to the impact energy. The specific behaviors of the composites were due to the fact that the PU foam in the spacer area was equivalent to the foam-core of the composites, indicating that the foam-core and 3D structure could support each other. While the foam-core constitutes a vertical support for the 3D structure, the integrated 3D structure forms a structure which prevents the foam-core from breaking and maintains whole structural integrity.
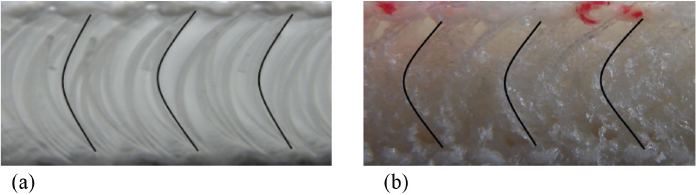
Status of (a) spacer yarns and (b) original after 10 J impact energy.
The impacted surface damage is an important factor for evaluating the impact resistance properties of composites. Based on previous studies, 12 it is evident that the impacting face did not show severe damage. However, to effectively evaluate the damage of impacted faces, a XSM-LC 3D scanner instrument (IMAL DPX300-LTE, Italy) was used to investigate the impacted surfaces of composites. Figs. 6a–d show that the impacted surfaces of four composites (PWS-FC1, PWSFC3, PWSFC7, and PWSF8) under impact energy resembled each other in shape, but not in dimension. The height value for these impacted faces was constant, indicating that all scanned points on the impacted faces were in the same plane. The findings obtained revealed that the impact energy was effectively absorbed and spread on the impacted faces of composites without damaging the impacted faces. This behavior was quite different from previous studies, 12 which reported that the impacted faces of materials were significantly damaged after impacting. According to the above analysis, it is clear that the composites evaluated in this work possess promising anti-impact and resilience abilities, indicating that the composites are an ideal cushioning materials and that its service life can be sustained.
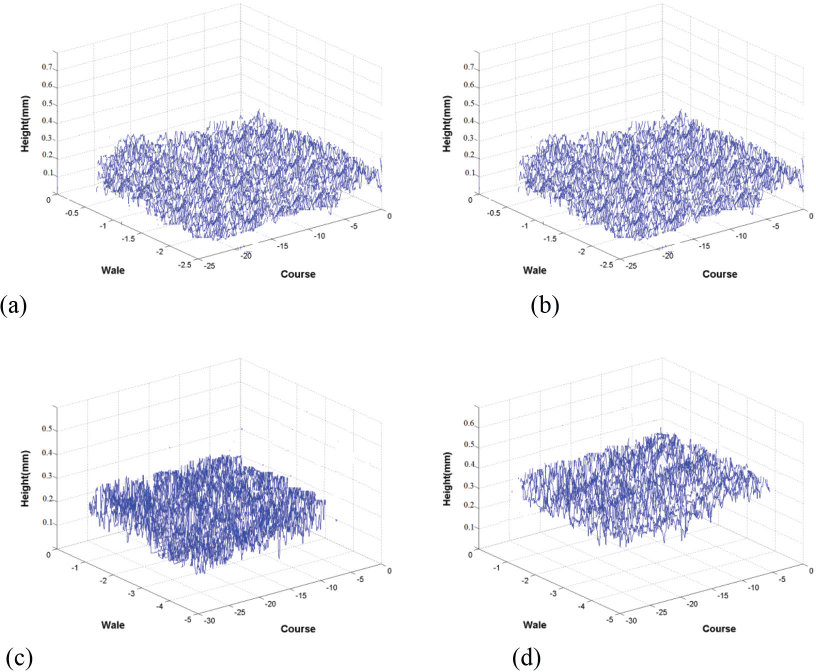
The impacted surface of composites. (a) PWSFC1, (b) PWSFC3, (c) PWSFC7, and (d) PWSFC8.
Influence of the Type of Spacer Yarn
The thickness, fabric surface structure, and spacer diameter of the three samples were the same before impact. The impact force-displacement and energy-time curves of PWSFC1, PWSFC2, and PWSFC3 under 10 J impact energy are shown in Figs. 7a and b.
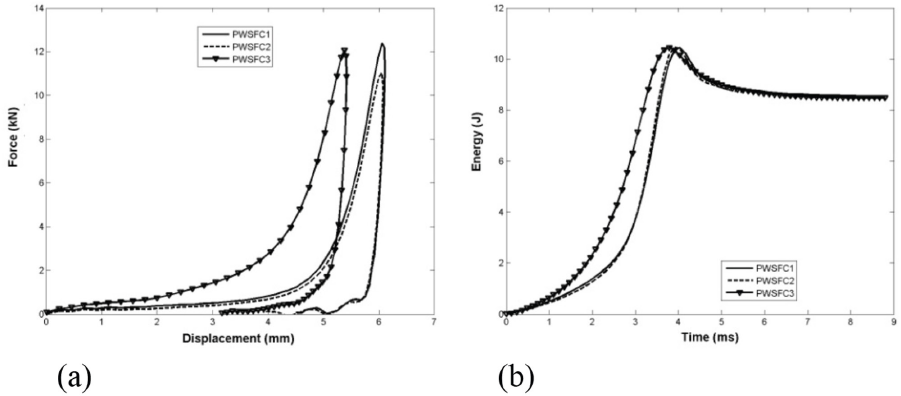
Underlapping spacer yarn influence on the impact properties of the specimen. (a) Impact force-displacement curve and (b) impact energy-time curve.
It can be seen from Fig. 7a that the peak maximum value order of the sample impact force was PWSFC1>PWSFC3>PWSFC2, and that sample PWSFC1 (the number of the under-lapping of the spacer yarn was two), with the smallest number of under-lapping of the spacer yarn, had the largest peak value of the impact force. The reason for this phenomenon is that the lapping movement of the PWSFC1 spacer yarn made the spacer yarn collapse after applying the impact load, which reduces the impact resistance of the whole material as indicated by a sudden drop in the force value. Under the same impact energy, PWSFC3 reached the peak value of the impact force first, which indicates that PWSFC3 was more likely to be compacted into the dense area. According to Fig. 7b, under the same impact energy, the sequence of energy absorption was
Influence of Surface Structure
The surface structure of the samples PWSFC2, PWSFC5, PWSFC7, and PWSFC8 were chain+inlay, locknit, rhombic mesh, and hexagonal mesh respectively. Their impact force displacement and energy time curves under an impact energy of 10 J are shown in Figs. 8a and b.
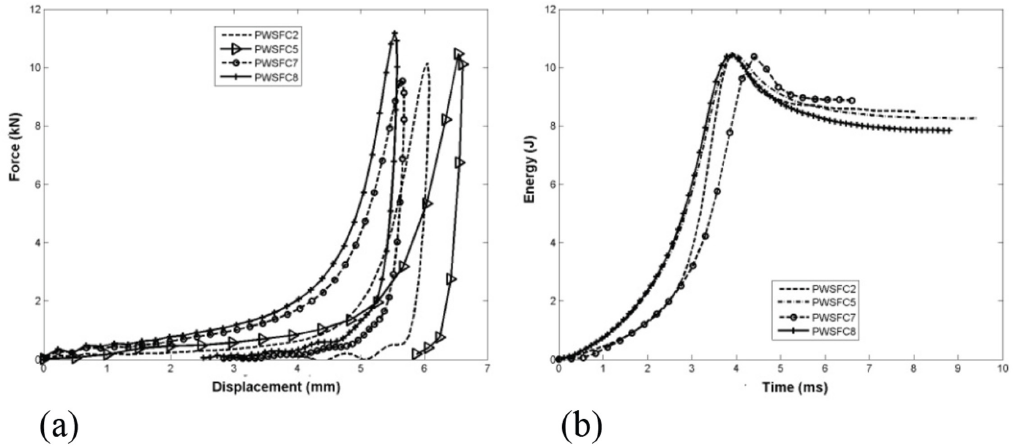
Surface influence on the impact properties of the specimen. (a) Impact force-displacement curve and (b) impact energy-time curve.
The impact curves of PWSFC2, PWSFC5, PWSFC7, and PWSFC8 were the same, but the amplitude was different (Fig. 8a). The sequence of impact force peak values was PWSFC8>PWSFC5>PWSFC2>PWSFC7, that is, composite samples with the mesh structure on the fabric surface had the maximum and minimum peak values of the impact force respectively. Specifically, the composite samples with a hexagonal mesh surface had the maximum impact force peak, while the composite samples with a diamond mesh surface had the minimum impact force peak. The impact force peak values of the samples with dense structure on the fabric surface were between the rhombic and hexagonal meshes, and the impact force peak value of the composite samples with chain+inlay was slightly smaller than that of the composite samples with locknit. According to Fig. 8b, the sequence of energy absorption for the samples was
The surface structure had an obvious influence on the end restraint and the spacer arrangement. Under the same wale density, the wale loops on the edge of the mesh were more closely arranged than those of the dense structure because of the existence of the mesh. In the sample with mesh on the surface, the mutually extruded loops increased the binding force of the ends of the spacer yarns, thus increasing the critical force of the spacer yarns. According to the analysis above, the larger the critical force of spacer yarn was, the better the buffering effect of the composite. In addition, the addition of weft insertion in the surface structure increased the friction between the coil, spacer. and weft insertion, which improved the critical force value of the spacer and the energy absorption characteristics of the composite. Therefore, increasing the mesh size of the fabric can improve the impact resistance of the composite. In addition, the surface structure of the composite can also be improved by adding the liner yarn, but its effect was not very obvious.
Influence of Spacer Yarn Diameter
The spacer yarn diameter of PWSFC3 and PWSFC6 were 0.2 and 0.16 mm respectively. The impact force displacement and energy time curves of them under 10 J impact energy are shown in Figs. 9a and b.
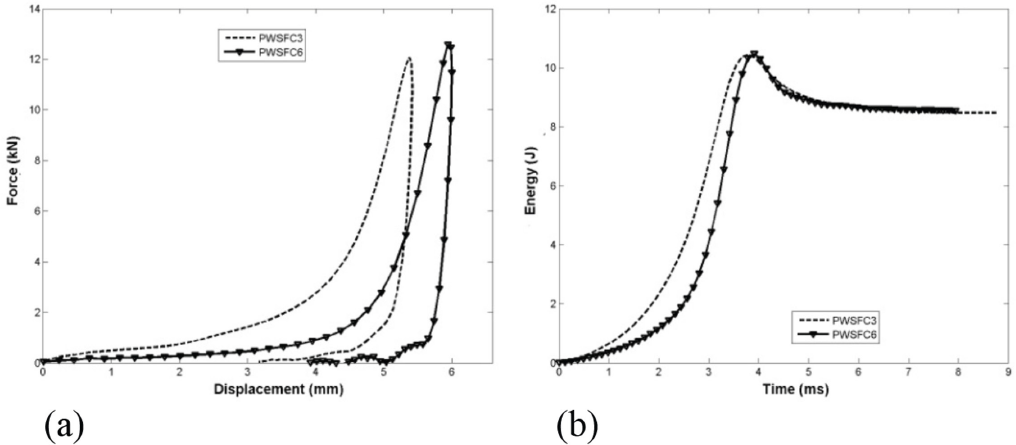
Spacer yarn diameter influence on the impact properties of the specimen. (a) Impact force-displacement curve and (b) impact energy-time curve.
Fig. 9a shows that the impact curves of composite samples with different spacer yarn diameters were similar. In contrast, the impact force peak value of composite samples with coarser spacer yarn was smaller, and the energy absorbed during impact was in the orders of PWSFC6>PWSFC3 and
Influence of Fabric Thickness
The thickness of PWSFC2 and PWSFC4 were 7.76 and 6.60 mm respectively. The impact force displacement and energy time curves of them under 10 J impact energy are shown in Figs. 10a and b.
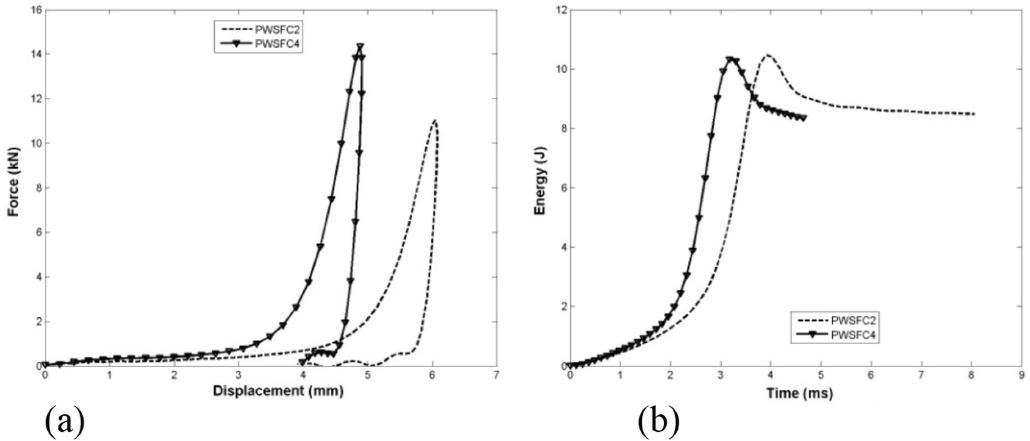
Thickness influence on the impact properties of the specimen. (a) Impact force-displacement curve and (b) impact energy-time curve.
Figs. 10a and b show that the specimen with large thickness had a lower impact peak value and can absorb more impact energy. To minimize the load on the protected object, the thickness of the buffer material can be increased, but this is limited by other factors.
Comparison of Impact Properties between Composite and Spacer Fabrics
The impact responses of two kinds of spacer fabrics (WSF3 and WSF5) and their corresponding composite samples (PWSFC3 and PWSFC5) under 10 J impact energy were compared, and the results are shown in Figs. 11a and b.
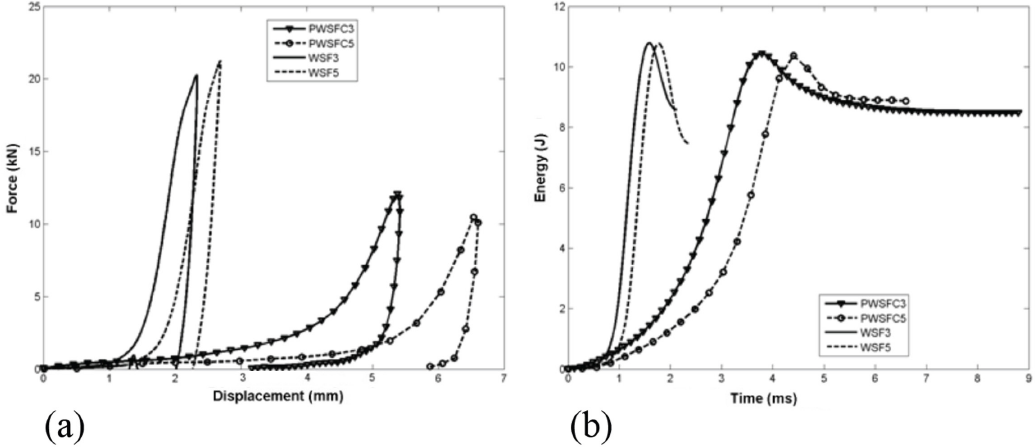
Comparison of impact properties between composite and spacer fabrics. (a) Impact force-displacement curve and (b) impact energy-time curve.
The peak impact force of the composite was significantly smaller than that of the spacer fabric, which indicates that composite samples can absorb more impact energy. It can be seen that there is a peak value of “sharp” impact force on the impact force displacement curve of the spacer fabric. This indicates that, in the process of impact, the upper surface of the spacer fabric was pierced, and the punch reached the lower surface of the fabric and then returned, which was not found on the impact force displacement curve of the composite materials. In the process of impact, the spacer fabric reached the peak of impact force first, which indicated that the spacer fabric was more likely to lose energy absorption capacity by impact load compaction, and can even cause overall fabric failure. At the same time, under the same impact energy, the composite sample can absorb more impact energy, which can better protect the impacted object.
FE Analysis of Composite Impact Properties
Through the low-velocity impact test of the PU matrix composite, it can be seen that the structural parameters of the warp-knit spacer fabric had a significant impact on the low-velocity impact performance of the composite. The change of structural parameters is reflected in the energy absorption performance of the material. Therefore, it is hoped that computer simulation technology can provide the basis for the design of PU matrix composites with different low-velocity impact properties.
The FE software ANSYS was used to establish the structure model of spacer fabric reinforced composite and analyze the compression mechanical properties. Taking PWSFC2 as an example, according to the actual structural parameters, the minimum stress element was selected to establish the FE solid model, the solid model was established, and the impact load was applied to solve the problem. 13 The finite element model of the impact of the warp-knit spacer fabric reinforced composite is shown in Fig. 12. There are two parts in the model: the rigid punch and the composite plate. The punch is a flat cylinder with a diameter of 25 mm, which is exactly the same size as the punch in the impact test. The composite plate size is 200 × 200 × 7.76 mm.
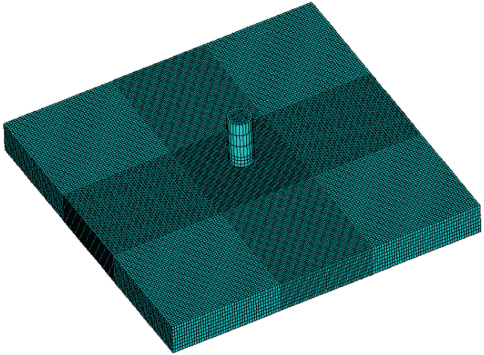
Finite element model of composite impact.
In this study, the peak value of impact force and the corresponding displacement and energy absorption was obtained. Considering the phenomenon that the punch will rebound or penetrate the sample after impacting the sample, this process is complex and difficult to compare with each other, so this process was not studied here. 14 Therefore, in the impact FE calculation, the impact response simulation of the composite materials was only until the peak value of impact force was reached, and the follow-up impact response was no longer studied.
The finite element calculation and the experimental impact force displacement curve under the impact load of the composite materials are shown in Fig. 13. Comparison between the two was good, but the curve obtained from the FE calculation result was slightly higher than that of the experimental result (i.e., the impact load value of the finite element simulation was greater than the impact load value in the experiment). This situation occurs because in the FE simulation, during element calculation, the boundary effect and stress concentration were not set. This will lead to uneven distribution of load and displacement.
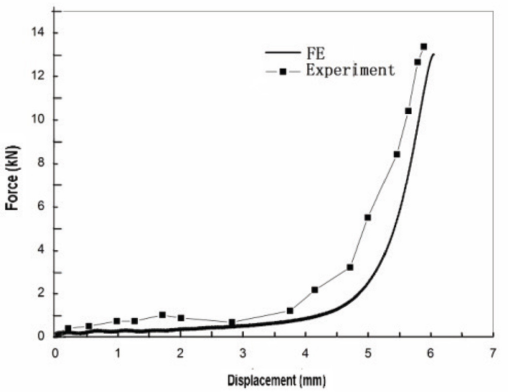
Comparison between the impact test curve and the finite element simulation curve of PWSFC2.
Fig. 14 shows the stress nephogram of the composite during the impact process, from which it can be seen that the stress value of the composite in the central area contacting the punch was the largest and diffused outwards in a circle. At the same time, with the increase of impact velocity, the stress in the center region of the composite increased.
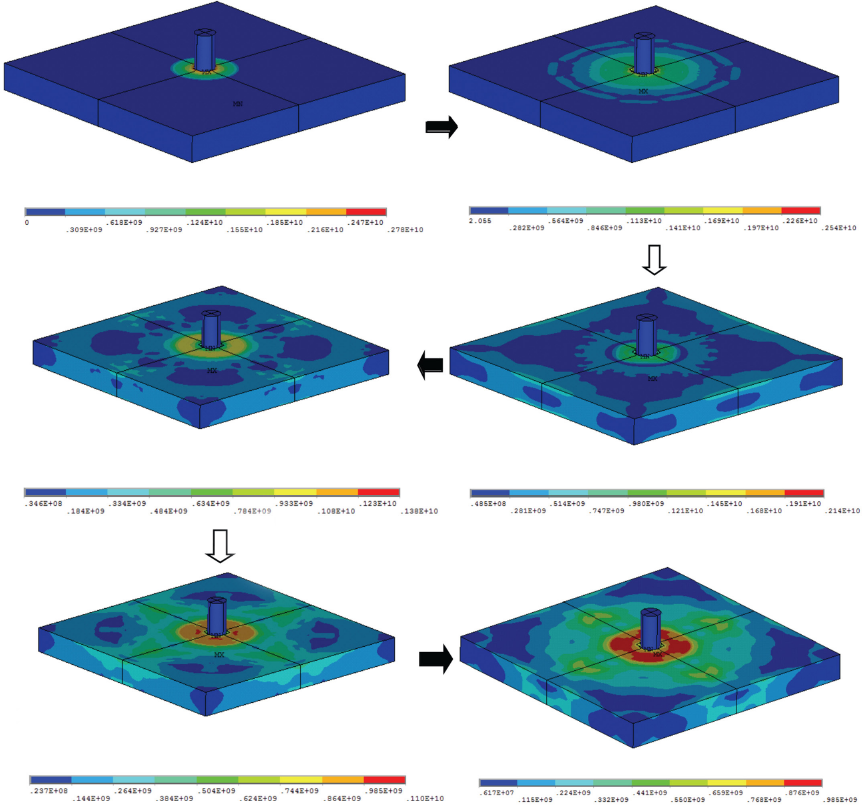
Stress wave diffusion during impact on composites.
To investigate the propagation of stress wave of the composite under impact load, the nodes on the impact surface of composite model along the diagonal OA were extracted in turn (Fig. 15, from point O to point A), and their stress values under different impact times were checked (Fig. 16). With the increase of impact time (i.e., the increase of punch speed), the stress value on each node increased in varying degrees. The stress value of the composite center area (O point) was always the largest, while the stress value of the node (A point) at the edge was the smallest. This shows that the stress wave propagated along the contact point between the punch and the specimen and gradually spread out when the composite was subjected to impact load.
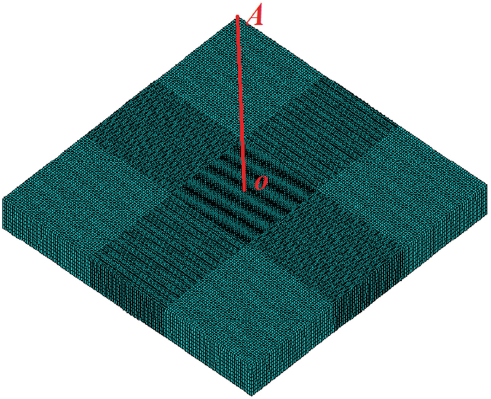
Node extraction on diagonal of composite mode.
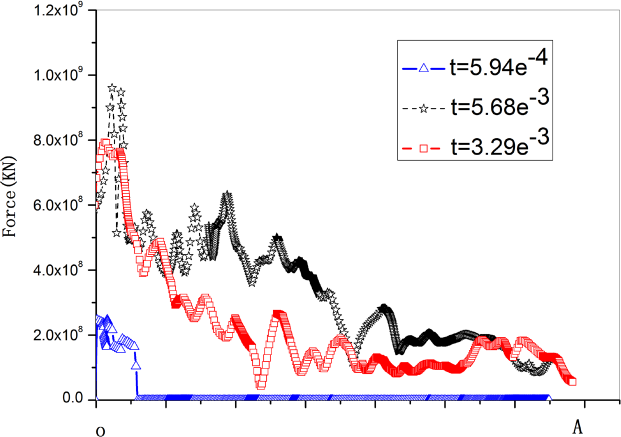
Stress wave curve of composite impact surface.
Conclusion
The low-velocity properties of polyurethane (PU)-based warp-knit spacer fabric composites have been evaluated in this research. The findings show that:
1) The composite samples with the large number of transverse needle spacing, diamond mesh surface structure, larger diameter of spacer yarn, and large thickness of spacer yarn can absorb more impact energy, which is more suitable to be used as buffer material.
2) The FE method provides convenience for the analysis of mechanical properties of materials. The simulation results of the FE model established in this work were basically consistent with the test results, and can be used to simulate the low-speed impact response of PU matrix composites. However, due to the assumption of conditions and the simplification of the model, there were still a few deviations between the simulation results and the test results, which need to be improved in subsequent work.
Footnotes
Acknowledgement
The authors acknowledge the financial support of The Foundation of Inner Mongolia University Scientific Research Projects, NJZY18095, and the Inner Mongolia Natural Science Foundation (2020LH01005).