
Abstract
In this study, the compression behaviors of silicone rubber composites reinforced by warp-knitted spacer fabrics under 20% deformation were investigated by experiment and a finite element analysis method. Based on the compression test, including the compression tests of composites and the warp-knitted spacer fabrics, the compression behaviors of composites were investigated. This revealed that the composites exhibited excellent elastic recovery abilities. Furthermore, the finite element analysis model of composites was established based on the parameters of the geometry and performance of the composites. The simulated results by the finite element analysis model were compared with the experimental ones to verify the accuracy of the model. It is obvious that the compressive finite element analysis model had good agreement with the experimental results, indicating that the compression performance of composites can be effectively simulated by the finite element analysis method. It is a useful tool for understanding the compression mechanism of composites and optimizing the composites’ parameters for cushioning applications.
Keywords
Introduction
Recently, textile fabrics are frequently used as an alternative low-cost reinforcement for cushioning application, due to their special properties like specific modulus and low density. 1 However, fibers and yarns are not to be used for the unique structure of textiles; only knitted fabrics, woven fabrics, and nonwoven fabrics are used as the unique structure of textiles for composite materials. Warp-knitted spacer fabric (WSF) is one type of complex-shaped three-dimensional (3D) construction composed of two separate layers, which are connected by spacer yarns; WSF has a remarkable ability for compression deformation and elastic resilience with unique construction. 2 All of these advantages make WSF have more potential to be used as a reinforcement for composites for cushioning applications.
In some of the published studies, the mechanical features of composites reinforced by WSF have been broadly investigated.3–5 Chen and colleagues6–8 figured out that the compression properties of a polyurethane-based warp-knitted spacer were heavily influenced by the spacer yarn inclination angle, the fabric thickness, and the fineness of the spacer yarn. On the contrary, the later surface structures slightly influenced the outer layer density and spacer yarn inclination angle, although these parameters were kept constant during the knitting process. Other authors found the compression resistance of WSF increased with silicone rubber being integrated. 9 Lu and Jing 10 examined composites composed of silicone rubber and WSF. The result indicated that the filling of silicone rubber made the WSF have greater stiffness, improved load-bearing ability, less deformation, and accordingly a decreased peak load. If the stress distribution of each component could be further analyzed from the above research works when composites were affected by the external load, more meso-results could be acquired. However, the meso-results of the stress distribution of composites were hardly gained only from experiments. With the progress of technology, this objective could be achieved with the appearance of finite element analysis (FEA).
The FEA method is an effective way to explore mechanical features of composites based on numerical simulation. Based on the published research works, it is clearly shown that the mechanical response of composites can be appropriately acquired by FEA. A finite element investigation of insoles was executed by the Rezchell team. It was found that the pressure distribution of insoles could be precisely simulated by an FEA study. 11 Research by the Manuel group shows that the finite element method developed demonstrates that the results are consistent with the states of applied loads in the human joint under real work conditions. 12 However, in current studies, compression model studies for silicone-rubber-matrix composites reinforced by WSF and the corresponding FEA are missing.
In this research, the WSF was absolutely hybridized with silicone rubber at room temperature to fabricate the composites. In order to complete the study for compression feature and finite element simulation of composites reinforced by WSF, the object of this article is to build a compression model for composites within the deformation of 20% of the initial thickness. The parameters of the compression model for the compression resistance of composites were calculated based on the experiment stress–strain curve. The structure model is based on the geometry and property parameters of WSF and silicone rubber for simulating and analyzing the compression resistance of composites by FEA, as well as for comparing with compression tests of composites to verify the feasibility of the compression model. The findings can be helpful for obtaining a better understanding of the compression mechanism of silicone-rubber-based composites, resulting in optimizing the compression performance of composites composed of WSF in design and production.
Materials and Modeling
Sample Preparation
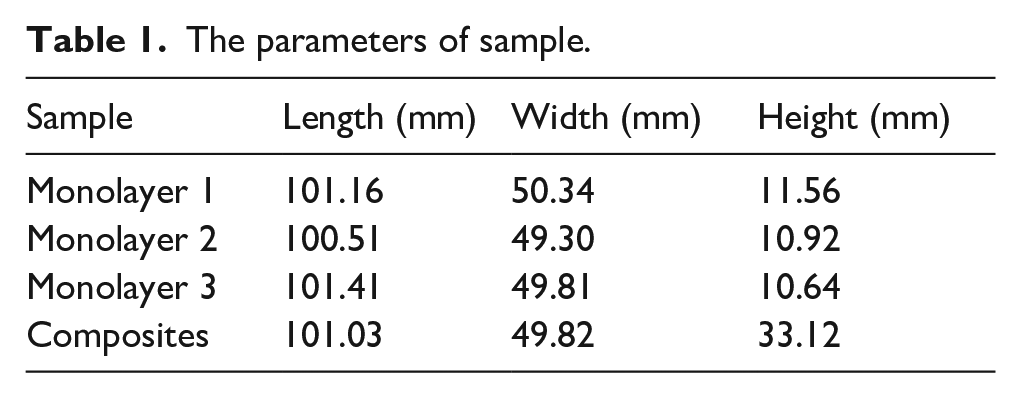
The PET monofilament of 0.16 mm in diameter was used as the spacer yarn of the WSF. The mesh structure, that is, a hexagonal mesh, was used for the fabric surface layers. The WSF was absolutely hybridized with silicone rubber at room temperature, which was carried for 8 h. After vulcanizing, the specimen was placed for 24 h at room temperature until the composite monolayer was generated. In this study, the composites were stacked from three monolayers before the compression experiment, and the parameters of the composite monolayer were measured from the two ends and the middle position with a measuring tool whose minimum indexing value was not more than 0.05 mm, along the length and width direction of the sample. The chain notations for the monolayer and composites are listed in Table 1. The manufacturing process of the composites is shown in Figure 1.
The parameters of sample.
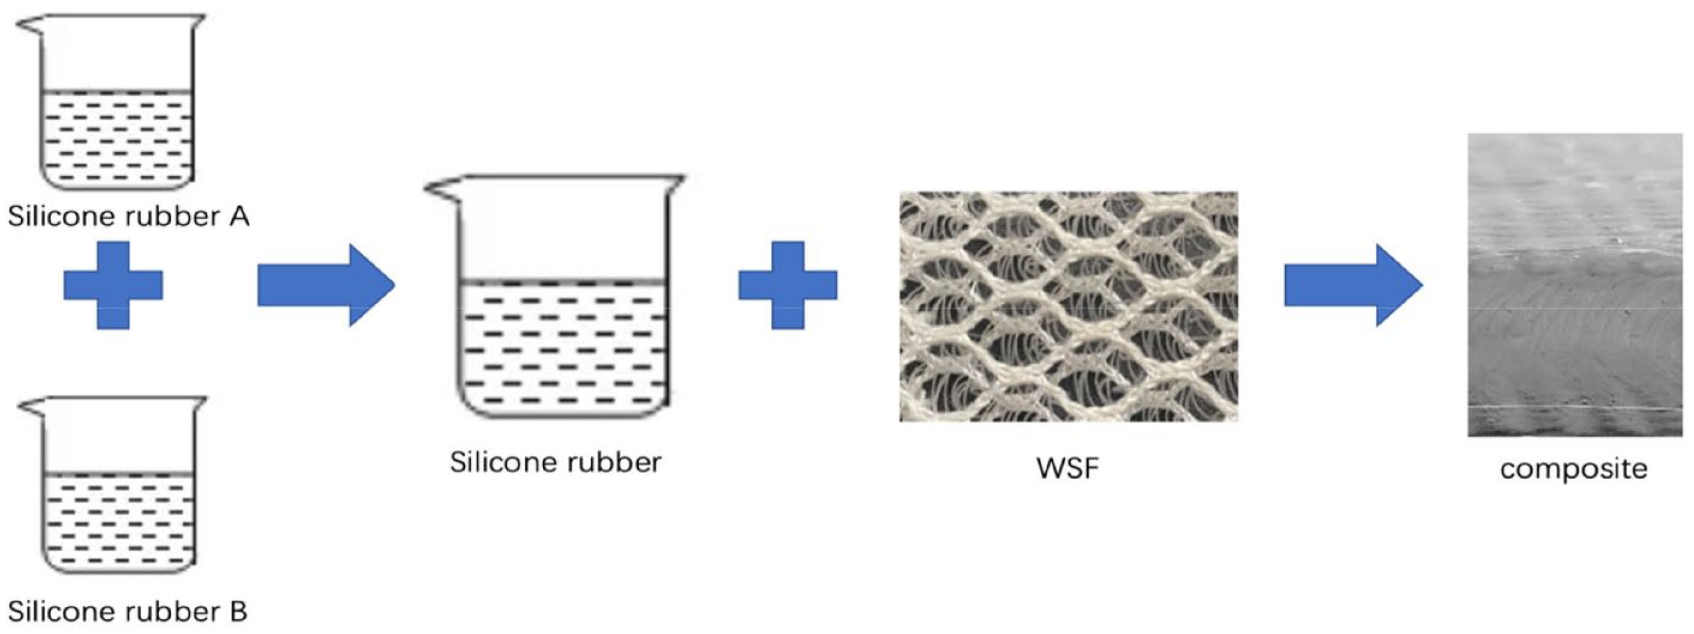
The manufacturing process of composites.
Compression Experiment
In this study, the compression property of WSF was tested according to the Chinese standard GB/T 24442.1-2009
13
using the SHIMADZU Universal testing machine, at a load speed of 1 mm/min in an environment of 23℃ and 65% relative humidity The length of the WSF is equal to 107.91 mm, and the width of the WSF is 53.51 mm. The thickness of the WSF is equal to 8.79 mm. Furthermore, the finished composites were characterized for compression properties according to the Chinese standard GB/T 8168-2008
14
experimental method B, using a SHIMADZU Universal testing machine at a load speed of 9 mm/min in an environment of 23℃ and 65% relative humidity. Ten repeats were carried out for the composites with a deformation equal to 20% of the sample initial thickness, the composites were placed in a natural state for 30 min after testing, and the thickness reduction rate
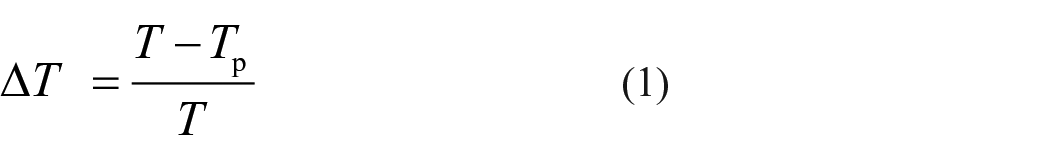
where T is the initial thickness for composites, Tp is the thickness for composites after testing, and the value of ∆T is 0.9496%. The curves were fitted by MATLAB software based on the results which were randomly picked from 10 experiments; the results show that there was a goodness of fit between those curves. The parameters of the compression test for WSF and composites are shown in Figure 2.
The curves of compression test for warp-knitted spacer fabric and composites.
Finite Element Analysis
Establishing Representative Volume Element
The difficulty of the FEA model for composites was tremendously increased due to the complex geometry and the complex mechanical constraints that were created from the unique 3D structure of WSF. In order to accurately describe the real state of composites, the WSF was separated into the spacer yarn and surface layers, which were hybridized with silicone rubber. As a result, the representative volume element of the FEA model for composites can be divided into three parts: spacer yarn, matrix, and solid planes. Each component of the FEA model for composites was established by ABAQUS software based on the parameters of geometry and performance for composites. The pattern of spacer yarn was built based on the coordinates of the trajectory of the spacer comb. The diameter for the spacer yarn model is equal to 0.16 mm. The model of the matrix material was also exhibited based on the coordinates of the sample; it is noteworthy that the part that overlaps with the spacer yarn in the silicone rubber needs to be subtracted for holding the accuracy of this model. The compression resistance of WSF is mainly decided by the spacer yarn. The surface layer of fabric had a slight deformation in the compression process. Therefore, the top and bottom surfaces were idealized as solid panels during the modeling process to simplify the difficulty of the pattern and maintain the reality of the model. It is worth noting that the part that overlaps with the spacer yarn in the solid panels needs to be subtracted to simulate the spacer yarn’s casing in the fabric surfaces. The realistic experiment state cannot be reflected by the geometric model; suitable mechanical constraints were set for the contacting surface of each component of composites based on the performance parameters to simulate the actual experiment. Finally, the model for each component of composites was established, as shown in Figure 3. However, the remarkable thing is that the outermost spacer yarn was tangential to the silicone rubber when the unit cell model was established to have a more intuitive observation of the stress state for spacer yarn during the compression process.
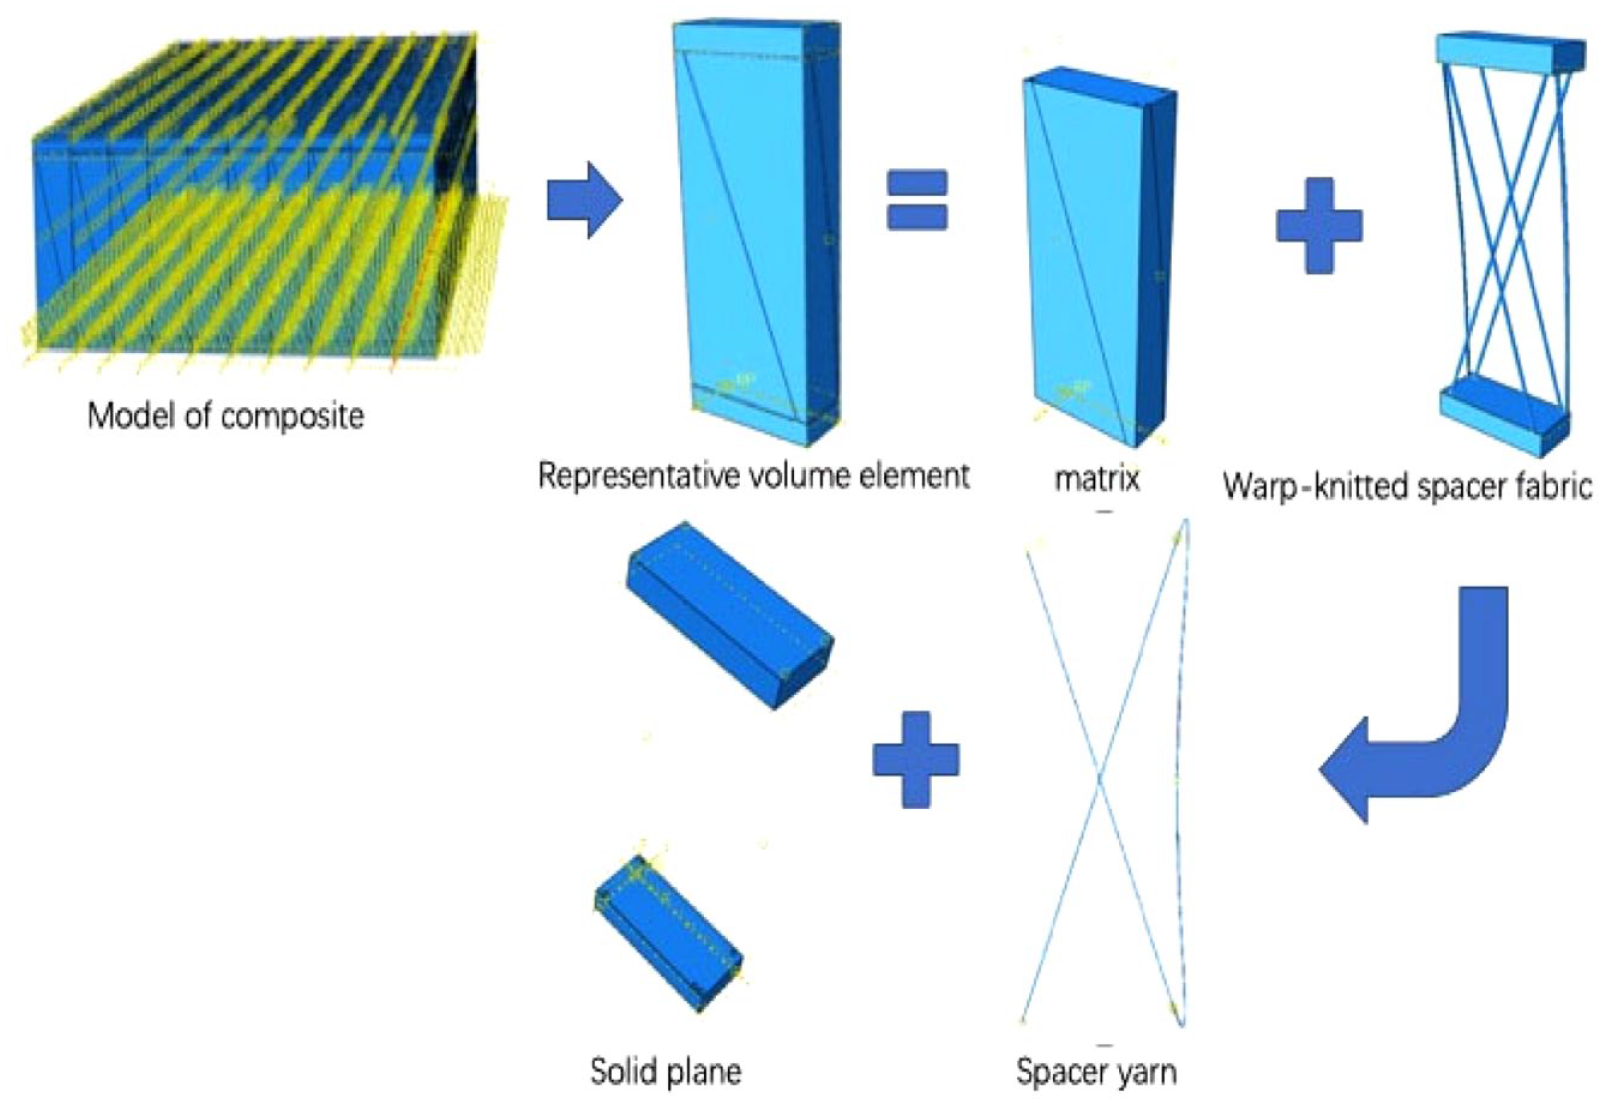
The FEA model for each component of composites.
Defining Materials Properties
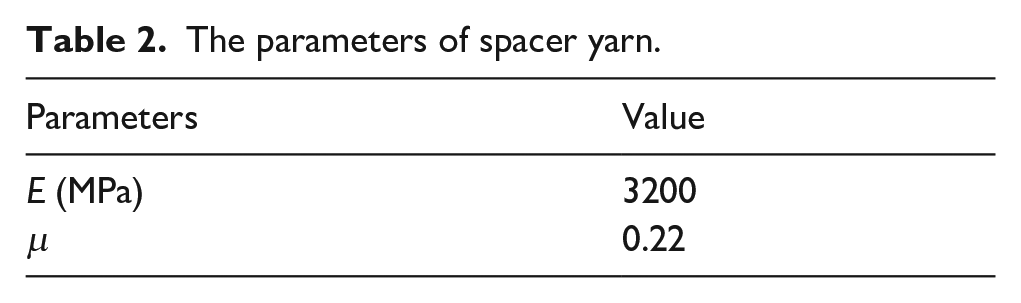
The parameters of the spacer yarn are shown in Table 2, where E is elasticity modulus of spacer yarn and µ is Poisson’s ratio for spacer yarn.
The parameters of spacer yarn.
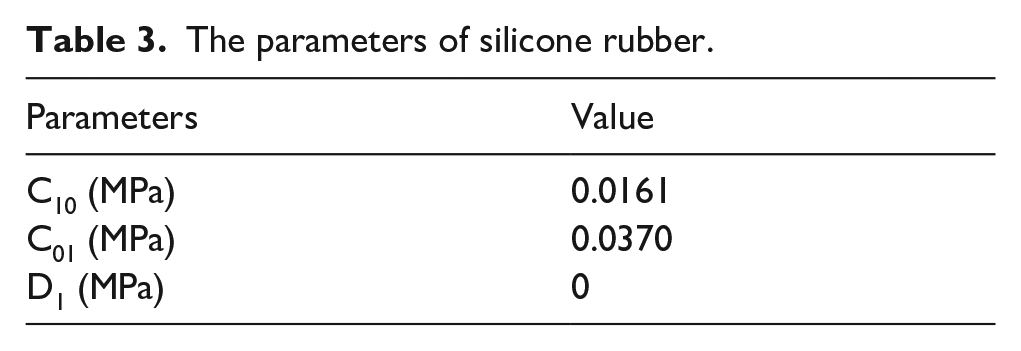
Silicone rubber is an isotropic hyper-elastic material; the material parameters are input into the hyper-elastic module of ABAQUS. The stress–strain curve of silicone rubber can be inferred from the constitutive equation of hyper-elastic materials named Mooney-Rivlin 15 (equation (2)):

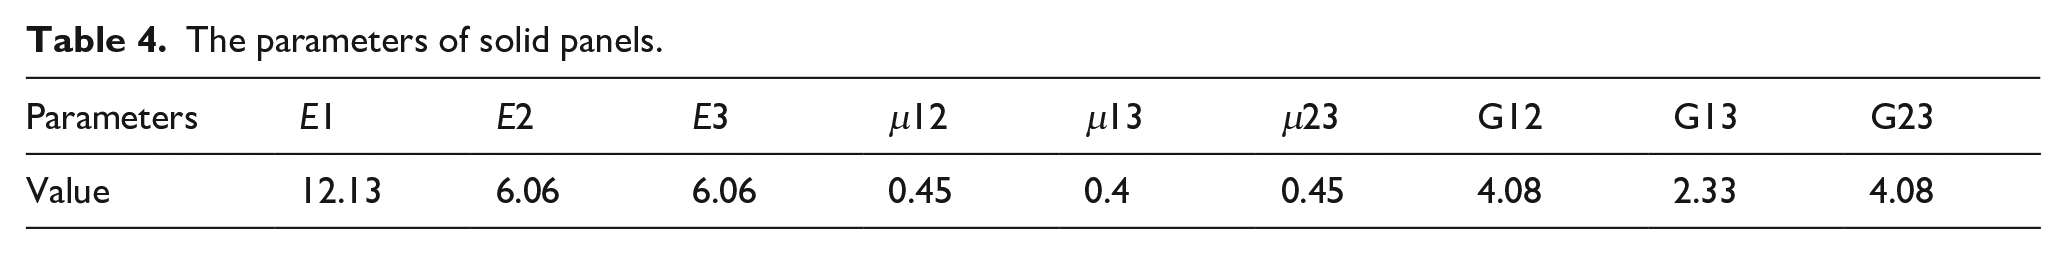
where I1, I2 is the invariant of the right Cauchy-Green deformation tensor, and C10, C01 are the parameters of the hyper-elastic material. At the same time, C10, C01 are the coefficient of the stress–strain curve for silicone rubber, which can be derived from equation (2); it can be calculated by MATLAB software based on the results of experiments. Silicone rubber is hard to compress, so the bulk modulus of silicone rubber equals 0. The parameters of silicone rubber are shown in Table 3, while the parameters of solid panels are listed in Table 4.
The parameters of silicone rubber.
The parameters of solid panels.
Grid Division
In this study, the tetrahedral mesh was adopted for each part of the representative volume element. Then, the hybrid grid was installed in the setting of the grid property due to the Poisson ratio of silicone rubber being close to 0.5, and the reduced integration grid was added for the other parts of composites. Type C3D10 was used for the model based on the characteristics of composite model combined with mechanisms of FEA during the mechanical analysis process. It is important that strain energy be absorbed by the spacer yarn and silicone rubber; thus, the fineness of the spacer yarn’s meshes and silicone rubber’s meshes is greater than that of both ends of the composites. Ultimately, the adaptive mesh was fitted for the model; the number of elements for the final model is 107,748 after meshing, as shown in Figure 4.
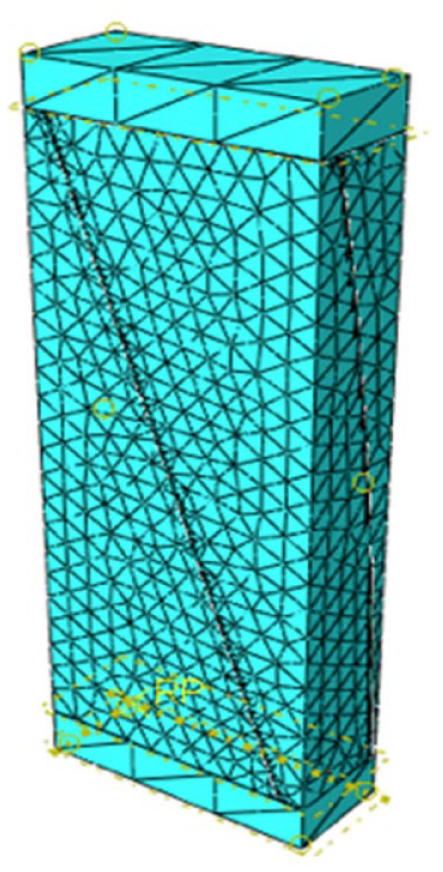
The FEA model of composites after meshing.
Defining Boundary Condition
The compression analysis for representative volume elements of composites is the compression test of simulated specimen, which is realized by constraining one end of the model and inflicting a compression load on the other end. The freedom of all nodes on the lower surface of the model was set as a constraint, that is, the translational freedom of each node in the X, Y, and Z directions was set to zero. The rotational freedom around the X, Y, and Z axes was set to zero when the composites were compressed in the Z direction. The dynamic boundary condition was created on the upper surface of the model. The symmetry/antisymmetry/fully fixed, specified displacement/rotation and specified speed/angular velocity connect the displacement, and the connect speed can be chosen for application. In this research, a specified speed equal to 9 mm/min is applied on the upper surface of the model. According to the result of the compression test, the curve for the compression of a sample is nonlinear. In this simulation, multiple load steps were applied to obtain an accurate solution.
Results and Discussion
It can be clearly seen from Figure 1 that the compression resistance of composites is superior to the compression characteristic of WSF. The modulus of compression for composites and WSF at each strain stage is shown in Table 5.
The elasticity modulus of compression test.
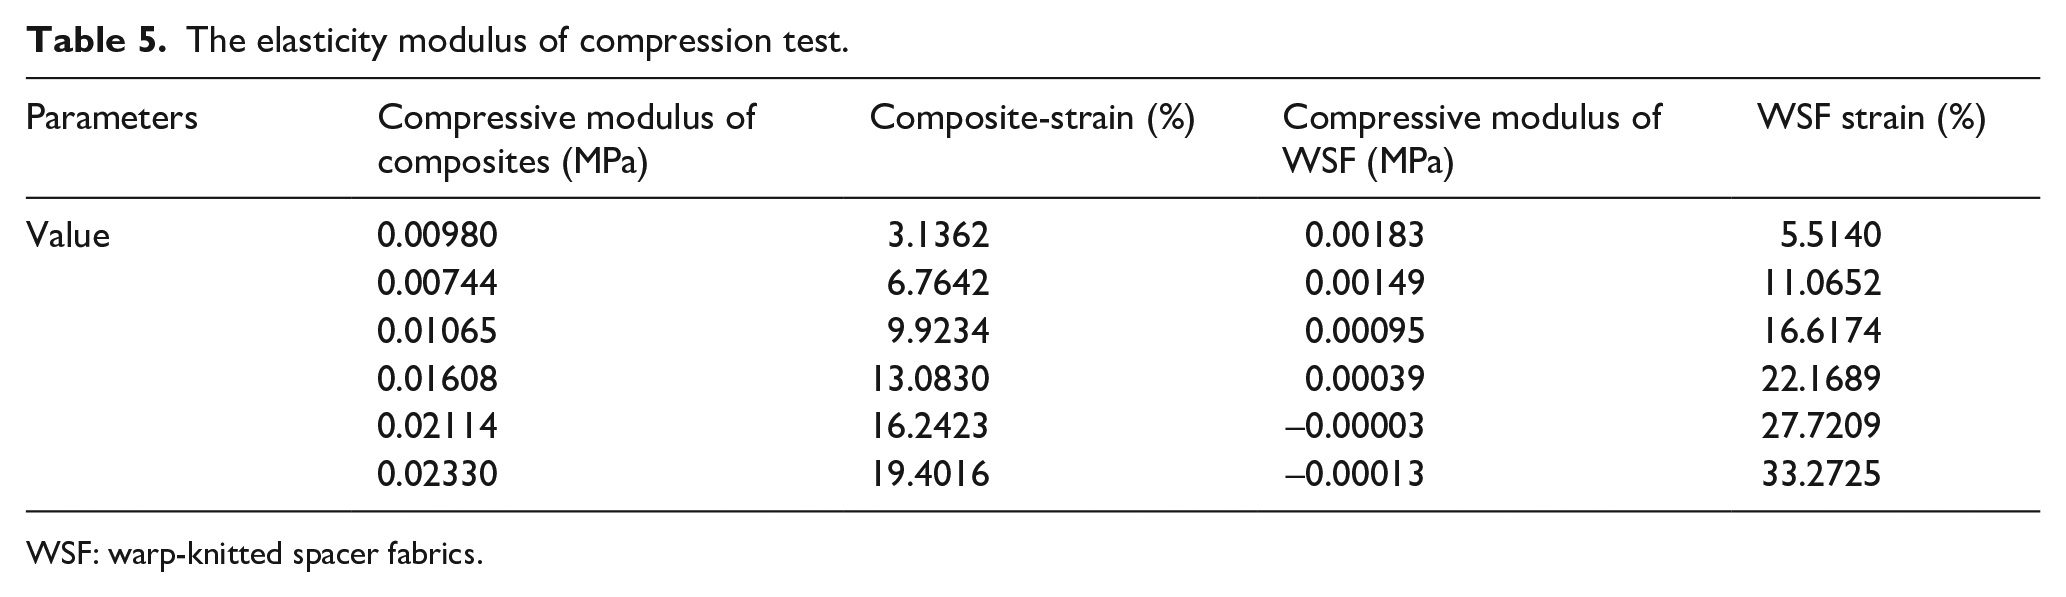
WSF: warp-knitted spacer fabrics.
It is obvious from Table 4 that the compression modulus of composites has been significantly improved compared with the modulus of WSF. This is because the spacer yarns of the fabric were regarded as hinge ends fixed to the fabric layer, and the spacer yarn can be regarded as a deflecting bar. The spacer yarn was deformed in the “gap” area between the two adjacent spacer yarns when the fabric received a compression load, resulting in the decline of the compression resistance for the fabric. With the addition of silicone rubber, the stress acting on the spacer yarn was greatly dispersed from the deformation of the matrix material. The side wall support was effectively provided by the silicone rubber for the spacer yarn. Owing to the easy-to-occur characteristic of deformation of silicone rubber under the action with external load, the deformation of silicone rubber had good agreement with the changes in the spacer yarn. At the same time, the deformation of silicone rubber can be effectively limited by the spacer yarn when the external load acted on the composites, leading to increased compression resistance of composites with the coupling effect between the spacer yarn and the silicone rubber. On the other hand, the modulus of compression for composites is decreased first and then increased with the increase in strain and the compression modulus, which shows a good potential for increase at a 20% strain point. The compression deformation modulus E33 was utilized to accurately reflect the change in compressive stress for composites in the compressive deformation process. The relationship between the compressive modulus and the compressive deformation modulus was expressed by equation (3) as follows:
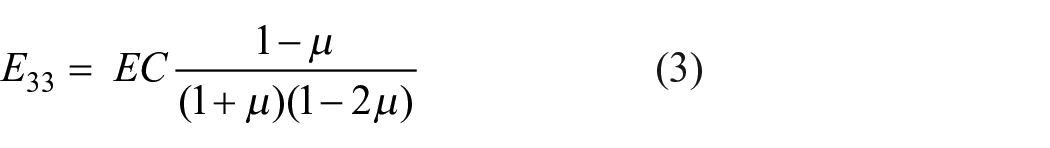
where EC is the compressive modulus of composites and
According to equation (3), the compressive modulus of composites is proportional to the compressive deformation modulus, that is, the composites with larger compressive modulus have a greater compressive deformation modulus. Moreover, silicone rubber has remarkable elasticity to protect the spacer yarn from loss, caused by the external load. It can be shown from the result that the resilience of composites can be reached at 99.0504% within the 20% strain.
To have a further understanding of the compression mechanism of composites, it can be revealed that the compression stress–strain curve can be divided into three stages: the linear stage (stage I), the plastic plateau stage (stage II), and the densification stage (stage III). 8 Referring to Table 2, it can be observed that a nearly constant value of stress is acquired with a relatively large deformation at the 5.1844% strain to the 11.5032% strain, leading to a better characterization of energy absorbed by composites, which can be described as the energy-absorbed efficiency E. The energy-absorbed efficiency E is defined as the ratio of the energy absorbed by a real material at a given strain and the energy absorbed by an ideal one that transmits the same but constant force at the same strain; 16 the energy-absorbed efficiency E can be expressed by equation (4):
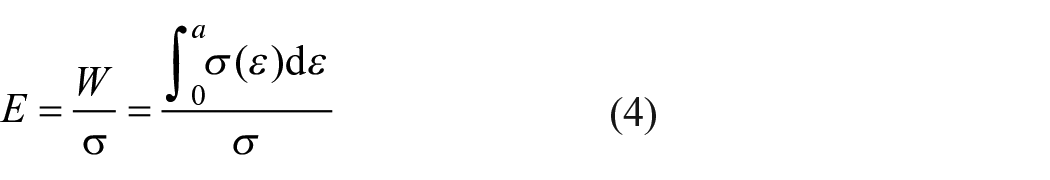
where W is the absorbed energy per unit cell and
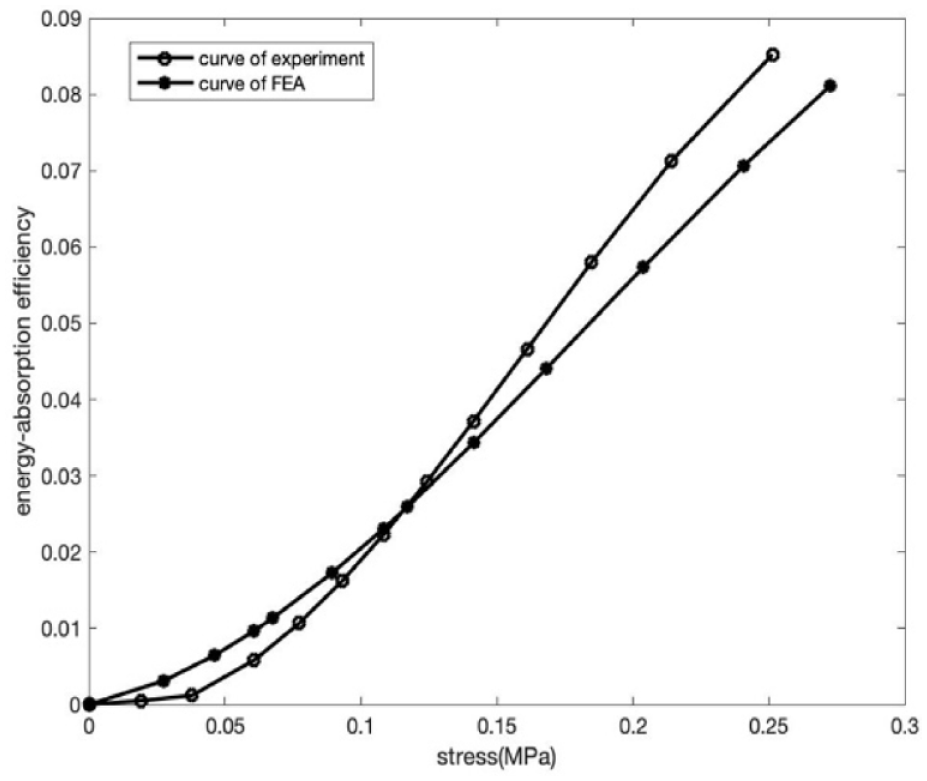
The energy-absorption efficiency curve for FEA and the experimental results.
It is clearly shown that a nearly parallel variation trend of efficiency–stress curves is shown. The energy-absorption efficiency is increased with the increase in deformation in the 20% strain, and it also has a promising potential for energy absorption. The mean deviation of the difference between the energy-absorption efficiency curve for FEA and experimental results is equal to 6.70 E−06. It is used to validate the accuracy of the FEA simulation curve, which demonstrates that the energy-absorbed efficiency diagram can be a useful tool to understand the validation of the model on the compression behaviors of composites at each point within 20% strain.
The result of FEA testing is shown in Figure 6. The deformation of composites was caused in both the vertical and horizontal directions in the simulation according to the properties of the composites because there were no constraints at the side of composites. This phenomenon also confirmed the actual experimental results. It was obvious that the external load was evenly absorbed by the composites with a relatively slight value of stress, in which a light deformation was caused on the top and bottom surfaces of composites and a distinct deformation was generated for silicone rubber under external force. It can also be observed that the stress was mainly supported by the spacer yarn during the compression process. In order to further analyze the compression mechanism of composites, five increment steps were picked from the simulation process, as shown in Figure 6.
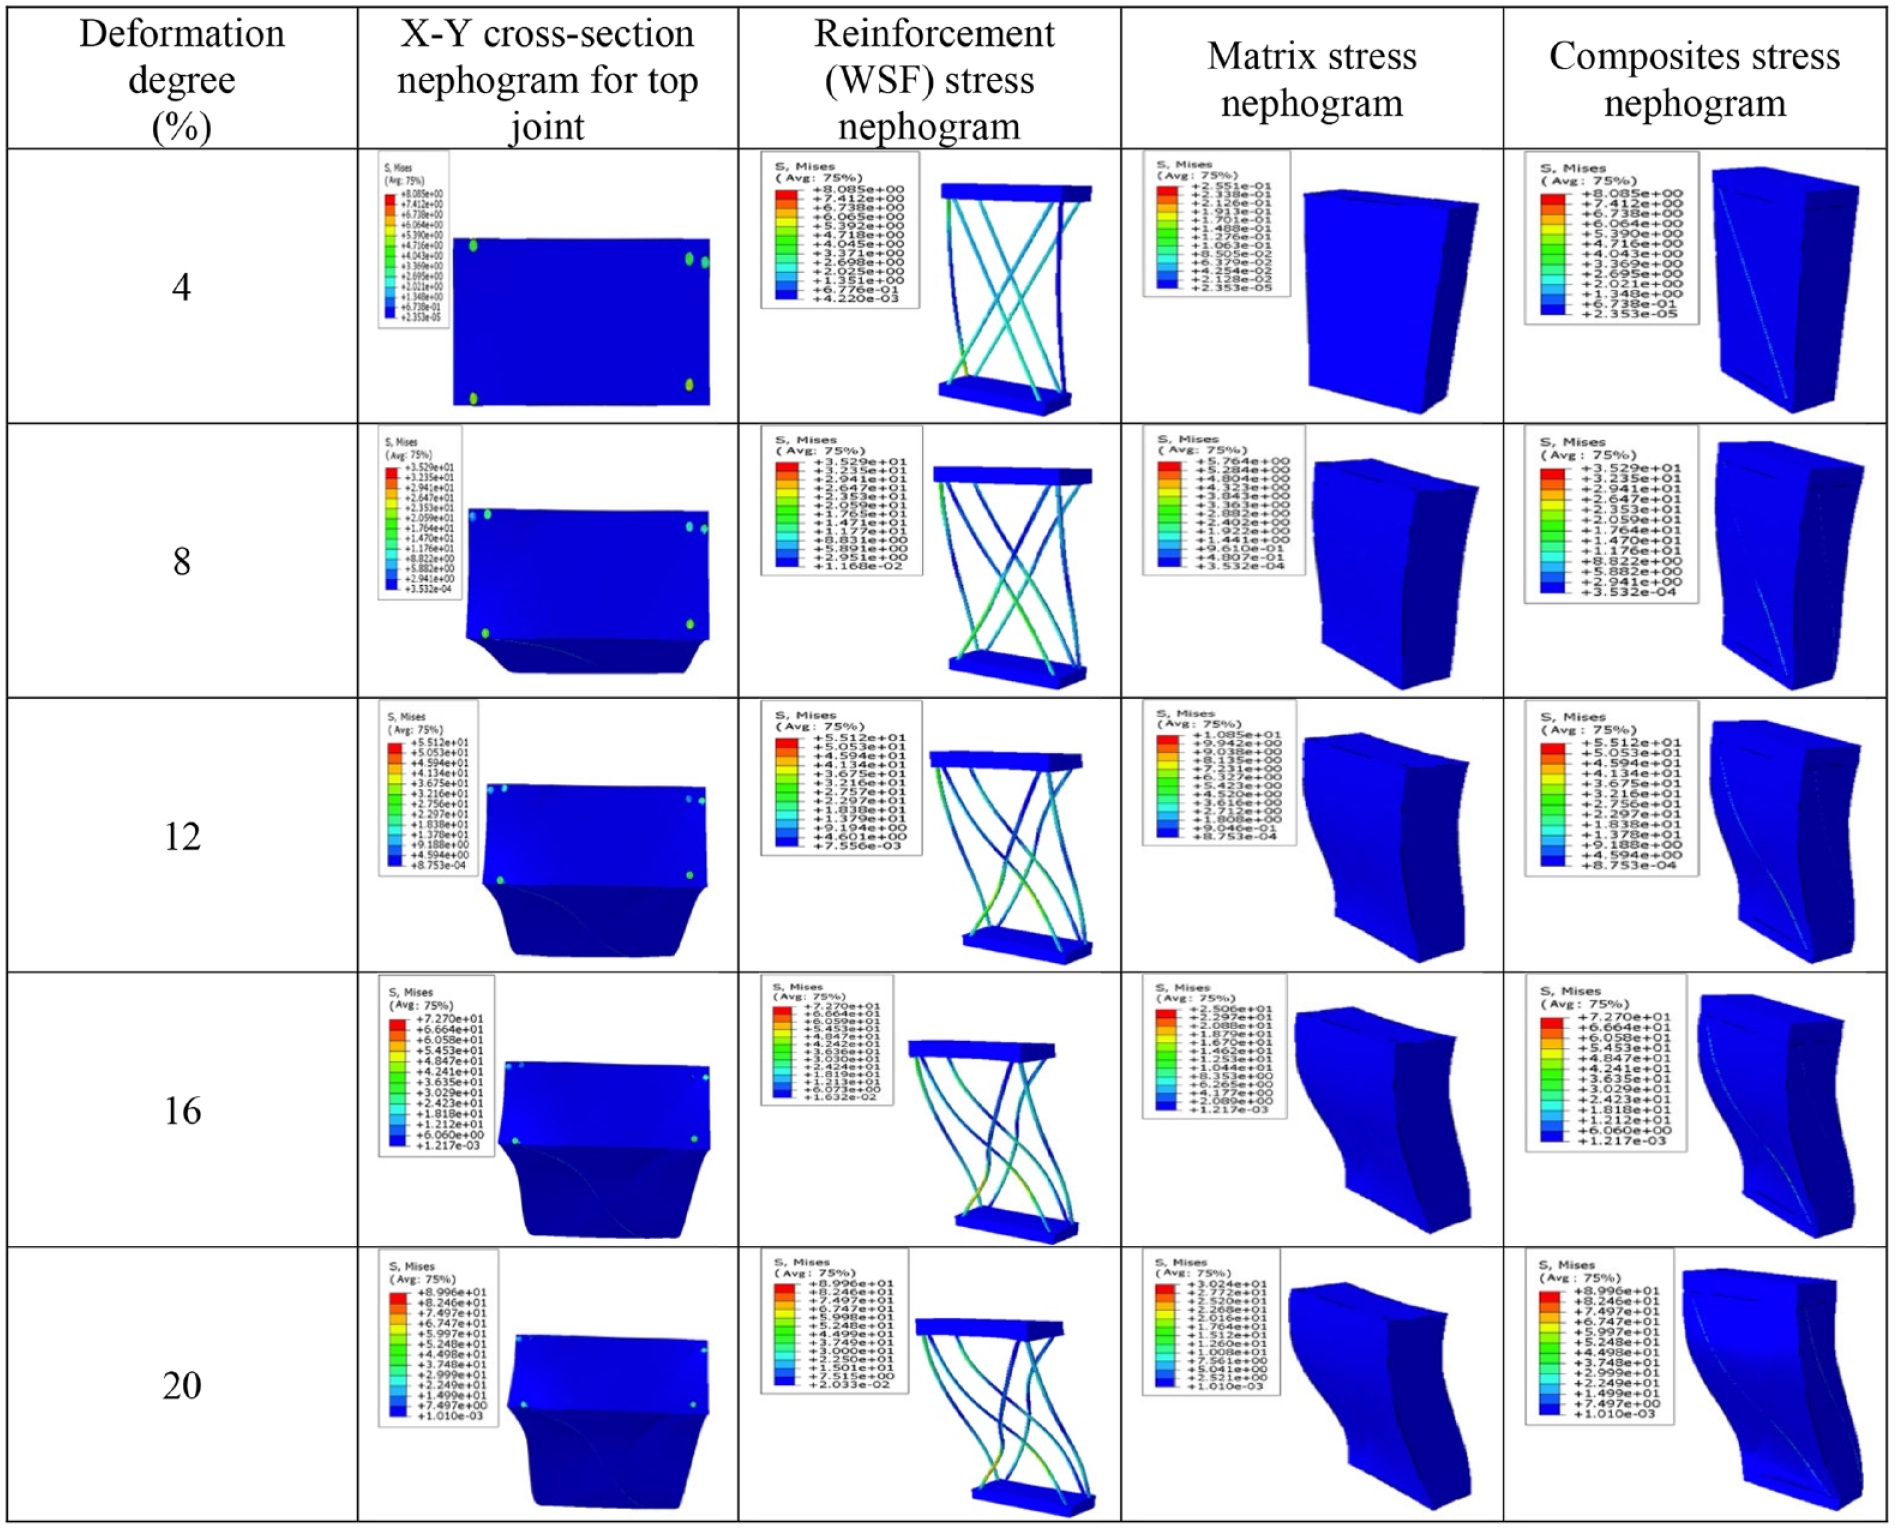
Stress evolution for FEA simulation.
It can be shown from Figure 6 that the stress energy absorbed by spacer yarn is close to that of solid planes. The external load was mainly absorbed by spacer yarn with relatively small deformation when the external load was applied to composites at a constant speed. This is due to the greater compression modulus of spacer yarn compared with that of silicone rubber. As for the spacer yarns, the stress absorbed by the bottom side was greater than the stress absorbed by the upper part of the spacer yarn. Thus, it was concluded that the spacer yarn was the primary load-bearing part within 20% deformation of composites. In the previous analysis, the compression performance of composites can be readily designed by controlling the material property and the axial thickness distribution of spacer yarns. At the same time, the content and distribution of the matrix in the composite are also affected by the parameters of the spacer yarn. Finally, the compression feature of composite can be synthetically optimized from the coupling between the spacer yarn and the matrix with lower cost. Moreover, it can also be seen from the FEA simulation results that the deformation of the representative volume element was generated in both longitudinal and transverse directions. On the other hand, the composite can be processed as an array of representative volume elements. Finally, the difference between FEA and experiment results was caused by the coupling of adjacent representative elements.
The stress–strain curve for composites compression test and the stress–strain curve obtained by FEA are compared in Figure 7. This reveals that the experimental compressive stress–strain is generally in good agreement with the curve created by FEA. In order to verify the accuracy of FEA simulation results, the relative error is calculated from the middle nine points of the compression curves for FEA and experimental results. The physical error in the experiment can be effectively avoided by those points. Finally, the value of the relative error is equal to 1.613%. However, some deviations can also be observed. This is due to the fact that the composites were assumed to be the ideal elastomer, and the deformation of composites completely complied with Hooke’s law when the FEA was used for calculation. At the same time, it is supposed that the cross-section of spacer yarn is round and constant in the compression process. On the other hand, the defects of the spacer filament such as the variation of cross-section for spacer filament and the non-uniform thickness along the fiber’s length direction were not considered. However, in the actual compression process, the compressive deformation of composites did not absolutely comply with Hooke’s law. Furthermore, the influence of spacer yarn unevenness and the deformation of the cross-section acted on the deformation of composites, which gradually increased with an increase in compressive deformation. In addition, a minimum cycle of the composites was selected for analyzing the process of modeling. The cycle was considered as an individual that had no interaction with other cells which were employed to simplify the FEA model. Under actual compression processing, the coupling effect between extrusion and friction from adjacent cells would affect the deformation of composites. Meanwhile, the relative movement between the composite monolayers would be generated to influence the evenness of stress distribution between monolayers of composites. The deformation of composites simulated by FEA was mainly generated along the vertical direction of the composites, resulting in there being no relative displacement in the composites’ horizontal direction and no friction between spacer yarns and their neighbors during the compression process, which is the opposite of the actual situation. Therefore, due to the neglect of the elements described above, deviations between the curve established by experimental results and the curve calculated from FEA can be found.
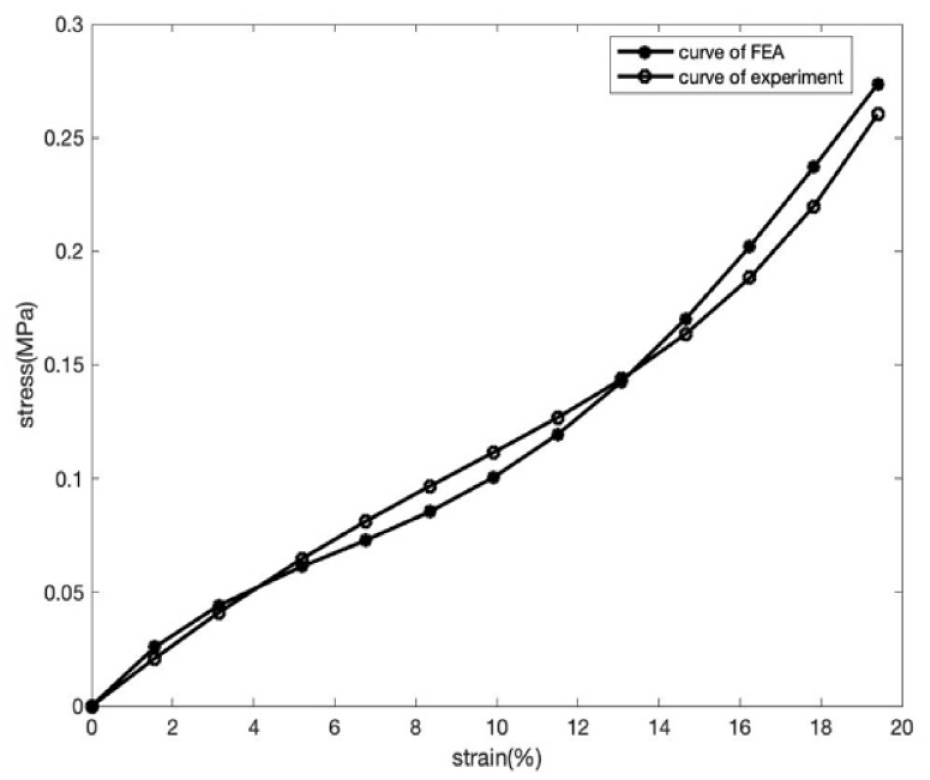
The compression curves for FEA and experimental results.
Conclusion
In this study, the compression behavior in the 20% strain of silicone-rubber-matrix composites reinforced by WSF for cushioning applications has been completely investigated. It can be observed from the compression energy absorption efficiency diagram that the silicone-rubber-matrix composites reinforced by WSF have outstanding energy absorption capacity, and the energy absorption efficiency of composites for cushioning application can be effectively enhanced when the WSF is used as a reinforcement structure. The composites also have outstanding sensitivity to deformation, which can help to optimize the compression performance of composites composed of WSF in designing and producing.
The FEA model of composites was established based on the parameters of geometry and performance of composites. Furthermore, the simulated results by the FEA model were compared with the experimental ones to verify the accuracy of the model. The simulated results showed that the compressive FEA model had good agreement with the experimental results, indicating that the compression performance of composites can be effectively simulated by the FEA method for understanding the compression mechanism of composites and optimizing the composites for cushioning applications. Moreover, a meso-mechanical analysis of the composite can be obtained and the experimental cost can be efficiently reduced by the FEA modeling.
Footnotes
Declaration of conflicting interests
The author(s) declared no potential conflicts of interest with respect to the research, authorship, and/or publication of this article.
Funding
The author(s) received no financial support for the research, authorship, and/or publication of this article.