
Abstract
To identify stem cells in salivary glands, label-retaining cells (LRCs) were established in rat submandibular glands. Developing and regenerating glands were labeled with bromodeoxyuridine (BrdU). To cause gland regeneration, the glands were injured by duct obstruction. BrdU LRCs were observed in all the parenchymal structures except for the acinus of the glands labeled during regeneration. Among these LRCs, a few, but not many, expressed neither keratin18 (K18; an acinar/duct cell marker) nor α-smooth muscle actin (αSMA; a myoepithelial cell marker), and thus were putative stem cells. These (K18 and αSMA)neg LRCs were invariably observed in the intercalated duct and the excretory duct. In the intercalated duct, they were at the proximal end bordering the acinus (the neck of the intercalated duct). Next, to test the above identification, gland extirpation experiments were performed. LRCs were established by labeling developing glands with iododeoxyuridine (IdU) in place of BrdU. Removal of one submandibular gland forced the IdU-LRCs in the remaining gland to divide. They were labeled with chlorodeoxyuridine (CldU). The (K18 and αSMA)neg LRCs in the neck of the intercalated duct and in the excretory duct did not change in number or in IdU label. The CldU label appeared in these cells and then disappeared. These results indicate that the (K18and αSMA)neg LRCs have divided asymmetrically and are thus considered salivary gland stem cells.
S
In consideration of the continued turnover of constituent cells and the potential replacement of damaged cells, it is conceivable that stem cells are present in salivary glands (Denny et al. 1997). Indeed, a recent culture study has shown that acinar, duct, and myoepithelial cells are generated from single epithelial cells from rat submandibular glands (Kishi et al. 2006). Although the details of this type of epithelial cell are unknown, after a single administration of 3H-thymidine (3H-TdR), intercalated ducts of these glands have been labeled much more frequently than have acini and granular ducts, segments of striated ducts adjacent to intercalated ducts that are peculiar to rodents (Srinivasan and Chang 1975; Zajicek et al. 1985). The number of intercalated duct labels decreased with time and, concurrently, the number of acinar and granular duct labels increased significantly (Zajicek et al. 1985; Man et al. 2001). Immunohistochemistry showed the presence of proteins specific to the embryonic progenitors of the acinar cells in some intercalated duct cells (Moreira et al. 1990, 1991; Man et al. 1995). These facts suggest that the intercalated duct is a compartment of stem/transit cells and feeds new cells into the acinus and granular duct.
It is generally difficult to identify and purify stem cells because of the lack of universal markers. However, stem cells have been successfully shown to be label-retaining cells (LRCs) in epithelial tissues such as epidermis, hair follicle, cornea, and small intestine (Bickenbach 1981; Cotsarelis et al. 1989, 1990; Taylor et al. 2000; Potten et al. 2002). The fact that stem cells divide significantly slower than do transit cells is not an adequate explanation for the mechanism underlying the establishment of LRCs (Potten et al. 2002). The pivotal mechanism is that stem cells selectively segregate the same DNA strands (template or immortal DNA strands) to themselves during asymmetric cell divisions (Cairns 1975; Merok et al. 2002; Potten et al. 2002) (Figure 1). In the label-retaining experiments, 3H-TdR is administered while stem cells undergo expansionary symmetric cell division associated with tissue development and regeneration. Each stem cell generates two stem cell daughters (one of them is depicted at the top of Figure 1) whose newly synthesized DNA strands are labeled with the isotope. At the next asymmetric cell division, the labeled strands that are selected as templates (indicated by the solid line in the top cell in Figure 1) are transferred to the new stem cell and are permanently retained in the stem cell line as long as asymmetric cell division continues. In contrast, the labeled strands that are not selected as templates (indicated by the dotted line in the top cell in Figure 1) are transferred to the transit cell daughter. They are diluted by random DNA strand segregation during subsequent cell divisions and become undetectable after a long tracing period.
The aim of this study was to identify stem cells in salivary glands. Rat salivary glands develop both pre- and postnatally (Redman 1987; Ogawa 2003). The adult glands can regenerate after various injuries such as partial extirpation and duct obstruction (Hanks and Chaudhry 1971; Tamarin 1971). By taking advantage of these unique properties, we established LRCs in the submandibular glands. Both developing and regenerating glands were labeled with synthetic nucleosides. Among the LRCs established, stem cells were distinguished from non-stem cells by using lineage markers of salivary gland cells.
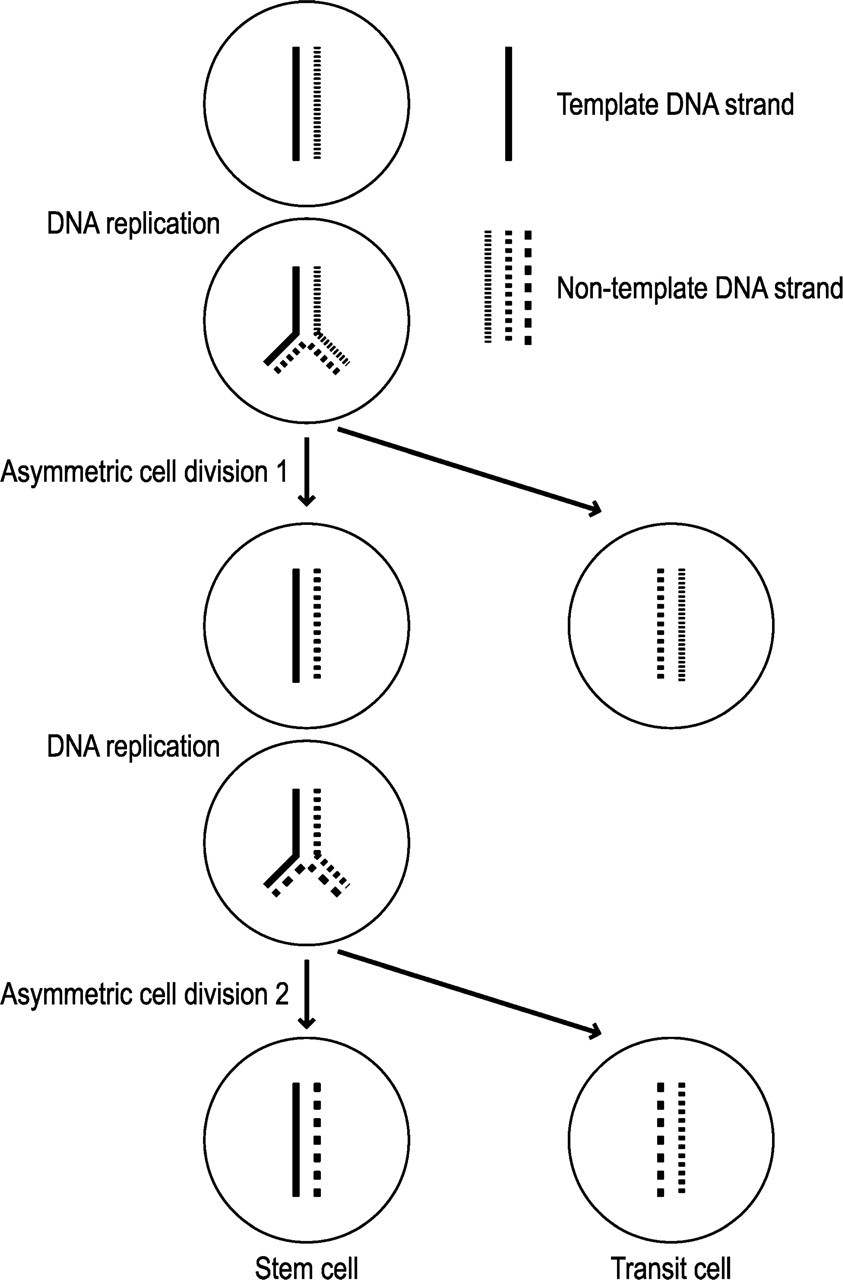
Diagram showing the segregation of template and non-template sister DNA strands in one chromosome. All the chromosomes behave this way. At each asymmetric cell division, the template strand is selectively retained by the daughter stem cell, whereas the non-template strand is segregated to the daughter cell destined to enter the transit compartment. Only the label introduced to the template strand persists in the stem cell line.
Materials and Methods
Wistar rats were purchased (Nihon Dobutsu; Osaka, Japan) and housed in a room with controlled temperature and humidity, with lights on at 6:00 AM and off at 6:00 PM daily. Except for the suckling period, the rats were maintained on a standard laboratory diet and tap water ad libitum. Only male rats were used in this study. Before the study, all experiments were reviewed and approved by the Osaka University Graduate School of Dentistry Intramural Animal Use and Care Committee.
Establishment of LRCs in Submandibular Glands
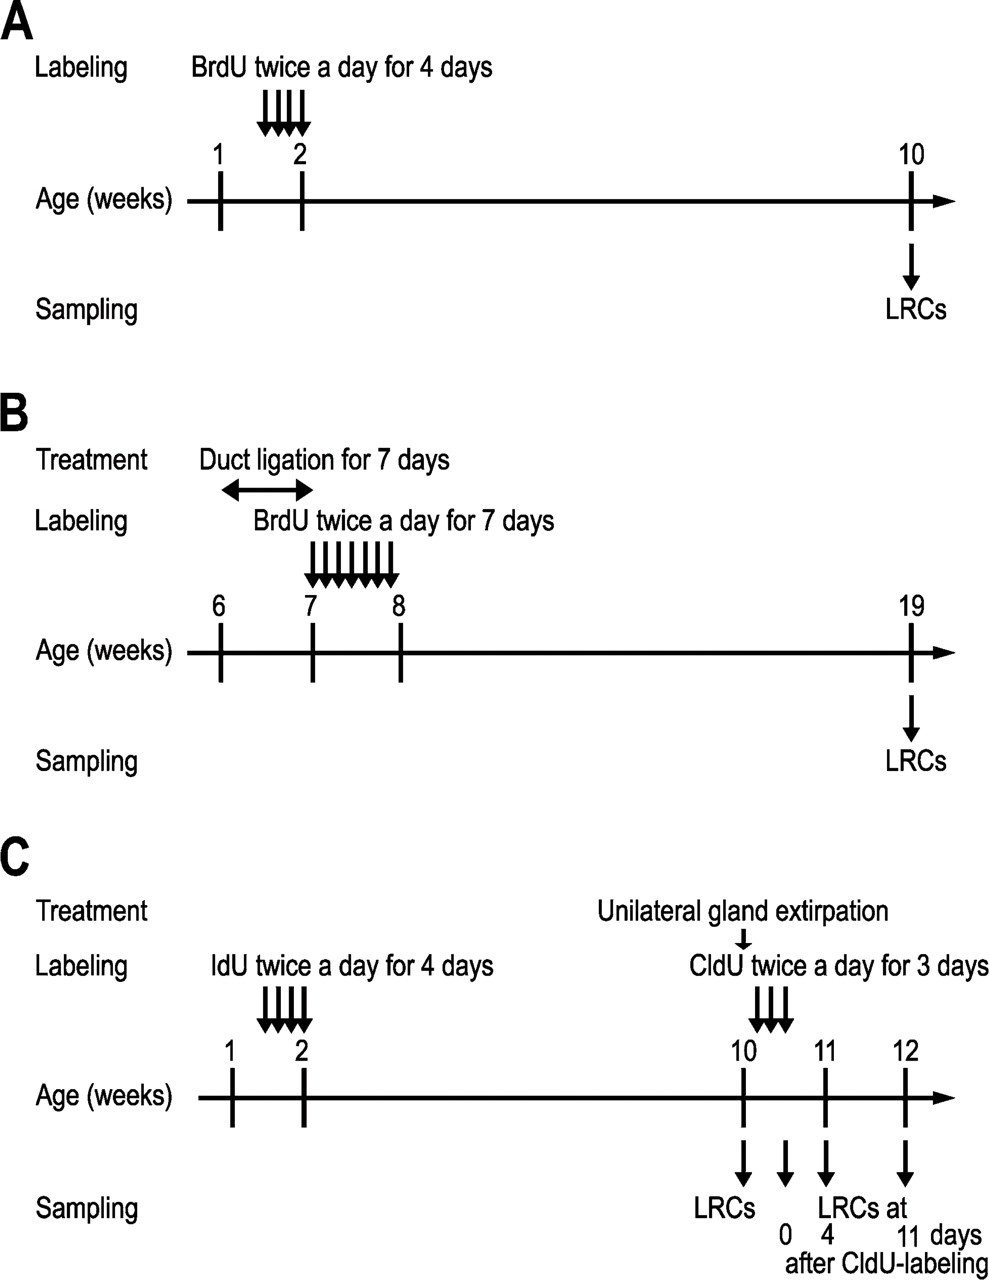
Schematic outline of the experimental procedures. Establishment of label-retaining cells (LRCs) in submandibular glands by labeling during development (
Unilateral Extirpation of Submandibular Glands
LRCs were established by injections of 5-iodo-2′-deoxyuridine (IdU; MP Biochemicals, Solon, OH) at a dose of 57.5 mg/kg to 12 pups, as described above (Figure 2C). Eight weeks later, three animals were killed, and the submandibular glands were removed. The remaining animals were anesthetized with pentobarbital sodium, and the right submandibular and sublingual glands were extirpated. Beginning the next day, the animals were IP injected with 42.5 mg/kg of 5-chloro-2′-deoxyuridine (CldU; Sigma) twice a day (at 9:00 AM and 7:00 PM) for 3 consecutive days. They were either killed immediately or at 4 or 11 days after administration of CldU (3, 7, and 14 days after extirpation), and the remaining submandibular glands were removed.
Immunohistochemistry
All procedures were performed at room temperature unless otherwise noted. The submandibular glands were fixed in methacarn and embedded in paraffin. Sections (6 μm thick) were made from each tissue block, mounted on silane-coated glass slides, deparaffinized, and rehydrated. One section from each set of sections was stained with hematoxylin and eosin to assess the histology. The remaining sections were used for immunoperoxidase or immunofluorescence histochemistry. Before being processed for immunohistochemistry, all sections were treated for DNA denaturation with 2 N HCl for 30 min, rinsed thoroughly with running water, and immersed in distilled water. We used four anti-BrdU antibodies to detect DNA labels: mouse monoclonal Bu20a (Dako; Glostrup, Denmark) and sheep polyclonal anti-BrdU (Abcam; Cambridge, UK) for BrdU, mouse monoclonal B44 (Becton Dickinson; Mountain View, CA) for IdU, and rat monoclonal BU1/75 (Serotec; Oxford, UK) for CldU.
The sections were thoroughly rinsed with PBS at 4C after each reaction except for that with B44. After the reaction with B44, the sections were rinsed with 0.01 M phosphate buffer (pH 7.2) containing 0.5 M NaCl and 1% Tween 20 for 1 hr at 4C to eliminate possible cross-reactivity with CldU (Aten et al. 1992; Maslov et al. 2004).
In the staining of IdU, CldU, and lineage markers, the sections were stained for CldU first. After blocking with normal rabbit serum (1/100 in PBS-BSA) for 30 min, the sections were reacted with an immune complex overnight at 4C. The immune complex was prepared as described above, except that Alexa Fluor 594 conjugated rabbit antibody to rat immunoglobulin (Molecular Probes) was substituted for the biotinylated goat antibody. Final concentrations of the rat antibody, rabbit antibody, and rat serum in PBS-BSA were 1/200, 1/100, and 1/50, respectively. Next, the sections were stained for IdU. The sections were sequentially reacted with mouse B44 antibody (1/200 in PBS-BSA) overnight at 4C, biotinylated rabbit antibody to mouse immunoglobulin (1/500 in PBS-BSA containing 1% normal rat serum) for 30 min, and Alexa Fluor 488 conjugated streptavidin (1/500 in PBS; Molecular Probes) for 30 min. Finally, the staining for lineage markers was performed. The sections were sequentially reacted with the mixture of mouse antibodies to K18 and αSMA, described above, overnight at 4C, the mixture of biotinylated antibodies, described above, for 30 min, and Alexa Fluor 488–conjugated streptavidin (1/500 in PBS) for 30 min.
After each reaction, as described above, the sections were thoroughly rinsed with PBS except for that with B44. After the reaction with B44, the sections were rinsed with phosphate buffer with a high salt concentration. After the final rinse, they were coverslipped with Vectashield (Vector Laboratories, Burlingame, CA) and examined with a Zeiss Axioplan fluorescence microscope or a Zeiss LSM 510 confocal laser scanning microscope (Zeiss; Jena, Germany).
Cell Count and Statistical Analysis
Five fields were randomly selected from each section and photographed. Each field was rectangular (340 × 430 μm) and contained at least 800 epithelial cells. Labeled and unlabeled nuclei in the field were counted, and the percentage of labeled nuclei was calculated. The results were analyzed by one-way ANOVA, followed by the Fisher protected least significant difference (PLSD) post hoc comparison. Differences were considered statistically significant when
Results
LRCs in the Rat Submandibular Glands
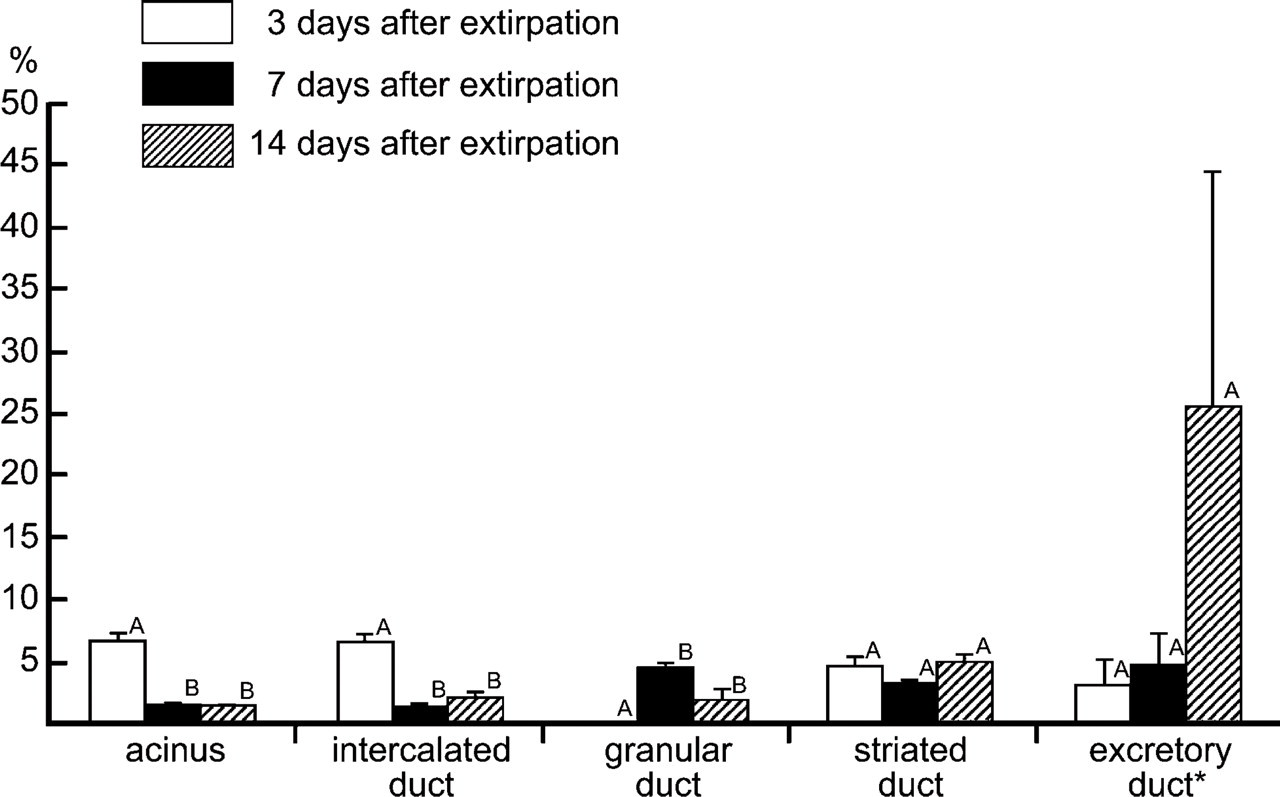
Rat submandibular glands were labeled with BrdU during development and regeneration. To label the glands during development, BrdU was administered to 11-day-old rats for 4 consecutive days. The submandibular glands were excised 8 weeks later. All the glands contained LRCs at a rate of occurrence of 1.2% of the parenchymal cells. They were observed in all the parenchymal structures: the rate was 0.5% in the acinus, 6.7% in the intercalated duct, 0.4% in the granular duct, and 1.2% in the striated duct (Figure 3). The rate in the intercalated duct was significantly higher than the rates in the other structures. The LRCs were randomly distributed in these structures (Figures 4A and 4B). Their labels were variable: some were strong and uniform, and others were weak and granular (Figure 4B).
To label the glands during regeneration, glands of adult rats were injured by ligation of the main excretory duct. One week later, when the ligature was removed, the glands were very small (<30% of the size of contralateral untreated glands). Starting the same day, BrdU was administered for 1 week. Eleven weeks later, when the glands were excised, they were still smaller than were the contralateral glands (∼50% of the size of contralateral glands) and hard in consistency. Microscopically, they were composed of glandular tissues and thick connective tissues (Figure 4C). Each glandular tissue contained well-formed acini, intercalated ducts, and striated ducts. The granular ducts, however, were far less developed than were those in the contralateral glands (Figure 4D). In the Figure 4 legend and the following paragraph, we tentatively call these glands “regenerated glands.”
LRCs were observed in all the regenerated glands (1.1% of all the parenchymal cells) but not in the contralateral glands. In the regenerated glands, LRCs were seen in all the parenchymal structures except for the acinus. Their rate of occurrence was significantly low in the granular duct (0.3%; Figure 3). There was no significant difference between the rate in the intercalated duct and that in the striated duct (3.6% vs. 4.3%; Figure 3). The LRCs were randomly distributed in these structures (Figure 4E). Again, their labels were variable from strong (uniform) to weak (granular). Although the number of excretory ducts was very small in the tissue sections, counting of the limited samples revealed that the LRC rate was 1.9% in the glands labeled during development and 3.1% in the regenerated glands (Figure 3).
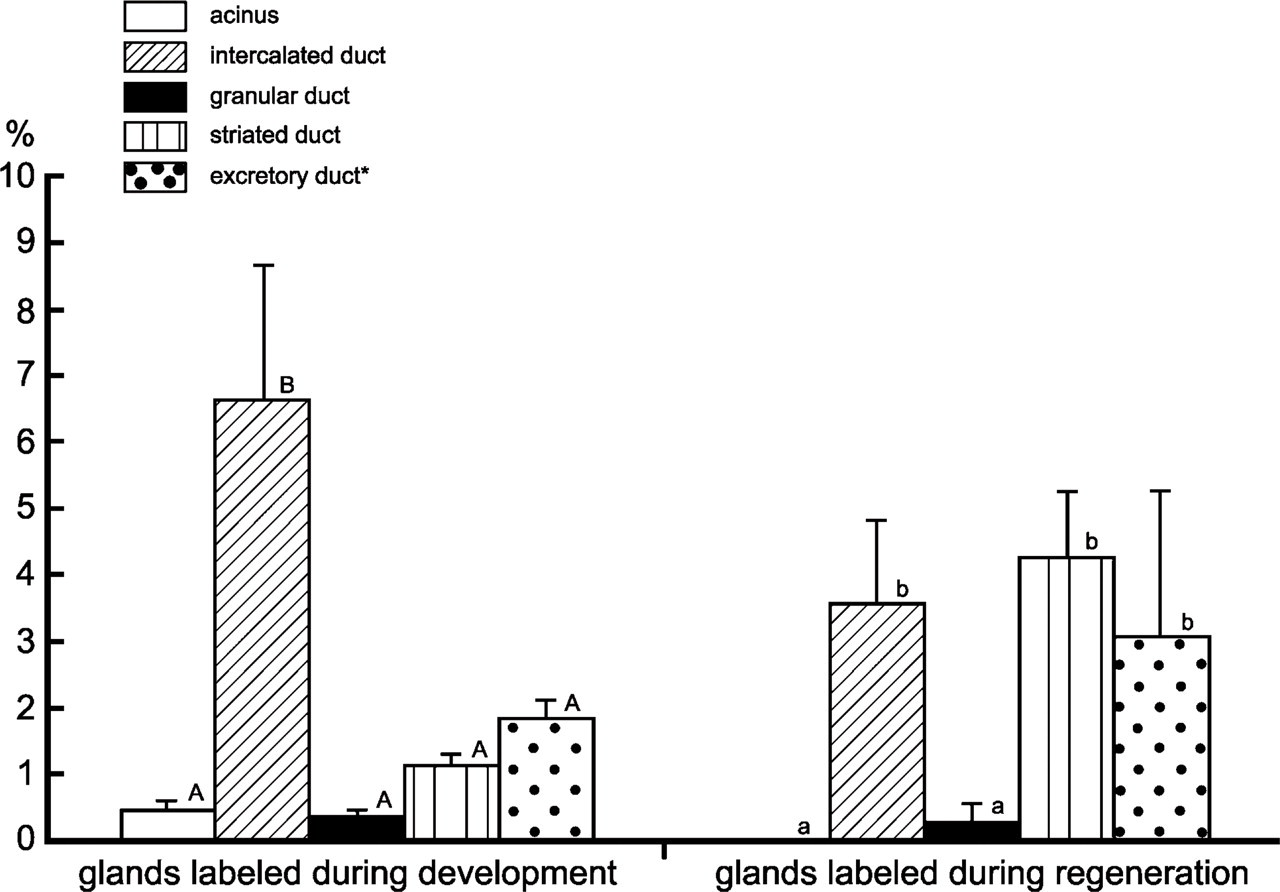
Mean frequency (±SEM) of bromodeoxyuridine (BrdU) LRCs in each parenchymal structure of rat submandibular glands. Values not sharing a letter within each experimental group differ significantly (
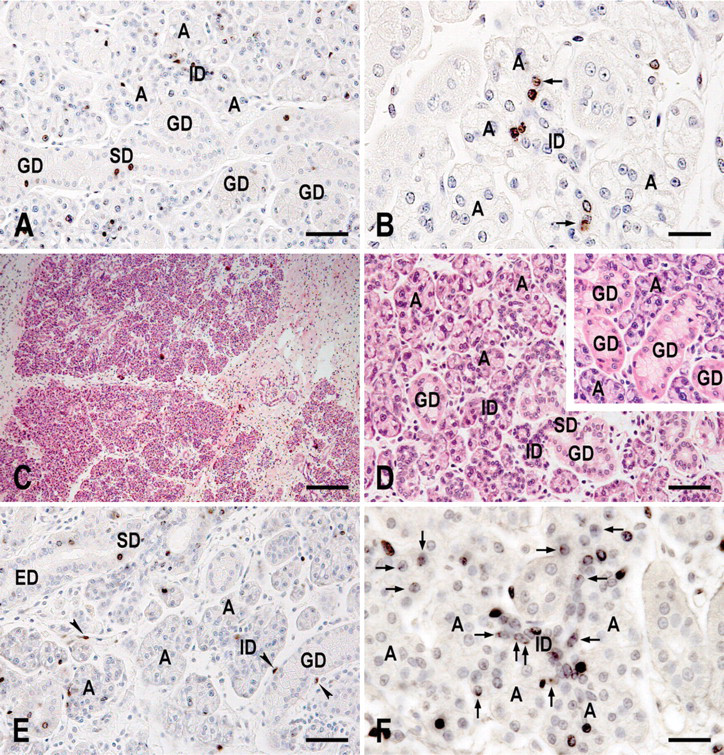
Rat submandibular glands. Glands labeled with BrdU during development (
Expression of Lineage Markers by LRCs
In rat salivary glands, several proteins are specifically expressed by particular cell(s). K18 is specific to acinar and duct cells, whereas αSMA is specific to myoepithelial cells (Ogawa 2003; Ogawa et al. 2003). Tissue sections were reacted with a mixture of mouse antibodies to these lineage marker proteins. These proteins were revealed by red fluorescence. The sections were also reacted with sheep antibody to BrdU that was revealed by green fluorescence. Thus, it was possible to determine whether the LRCs expressed these lineage markers. In the preliminary study using only a biotinylated rabbit anti-mouse immunoglobulin, K18 staining in acinar cells was extremely weak. To enhance the staining, we added a biotinylated antibody to mouse IgG1, the isotype of anti-K18 antibody. Although many of the LRCs expressed the lineage markers [(K18 and/or αSMA)pos], a few were negative for the markers [(K18 and αSMA)neg]. BrdU labels were strong and uniform in the nuclei of the (K18 andαSMA)neg LRCs (Figure 5). In contrast, they were weak and granular in most of the nuclei of the (K18 and/or αSMA)pos LRCs (Figures 5A and 5B, arrows). The (K18 and αSMA)neg LRCs were observed in the intercalated duct and the excretory duct. In the intercalated duct, they were localized to the proximal end adjacent to the acinus (the neck of the intercalated duct by Batsakis 1990) (Figures 5A and 5C).
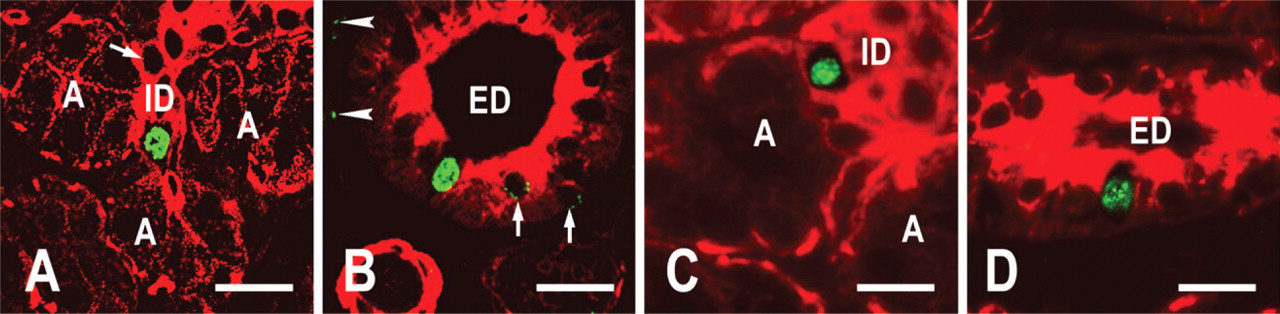
Rat submandibular glands. Glands labeled with BrdU during development (
LRCs After Unilateral Gland Extirpation
LRCs were established by labeling developing glands with IdU instead of BrdU. When one gland was extirpated, CldU was administered for 3 days. The remaining glands were obtained at 3, 7, and 14 days after gland extirpation. IdU and CldU are distinguished from each other by two antibodies against BrdU: B44 and BU1/75. The former recognizes IdU but not CldU, whereas the latter recognizes CldU but not IdU (Aten et al. 1992). In contrast, the other anti-BrdU antibodies such as Bu20a and the sheep antibody do not distinguish between IdU and CldU (Aten et al. 1992; unpublished data). IdU and CldU were administered at a molar dose equal to that of BrdU so that these synthetic nucleosides labeled the dividing cells with efficacy similar to that of BrdU (Vega and Peterson 2005). Indeed, the LRCs established by labeling with IdU were similar to those established by labeling with BrdU both in number and in distribution. The rate of occurrence of the IdU-LRCs was 0.6% in the acinus, 4.5% in the intercalated duct, 0.3% in the granular duct, 1.1% in the striated duct, and 2.3% in the excretory duct (cf. glands labeled during development in Figure 3).
The number of IdU-LRCs increased after gland extirpation (Figure 4F). The labels of many LRCs were weak. They were observed as a few small granules (Figure 4F, arrows) and were often difficult to recognize. Consequently, we were unable to identify the exact number of LRCs. In contrast, the CldU labels were strong enough to be recognized throughout the experimental period and thus were tracked (Figure 6). Immediately after labeling (3 days after extirpation in Figure 6), CldU-labeled nuclei appeared in all the parenchymal structures except for the granular duct. At 4 days after labeling (7 days after extirpation in Figure 6), the number of CldU-labeled nuclei decreased significantly in the acinus and the intercalated duct. At this same time, they appeared in the granular duct. During the following week, the number of CldU-labeled nuclei in each structure did not change significantly. Although the results of the excretory duct are not shown in Figure 6 because of their scarcity, counting of the limited samples revealed that the rate of occurrence of the CldU-labeled nuclei increased from 3 (3.2%) to 14 days (25.7%) after extirpation.
Mean frequency (±SEM) of chlorodeoxyuridine (CldU)-labeled cells in rat submandibular glands after unilateral gland extirpation. Values not sharing a letter within each parenchymal structure differ significantly (
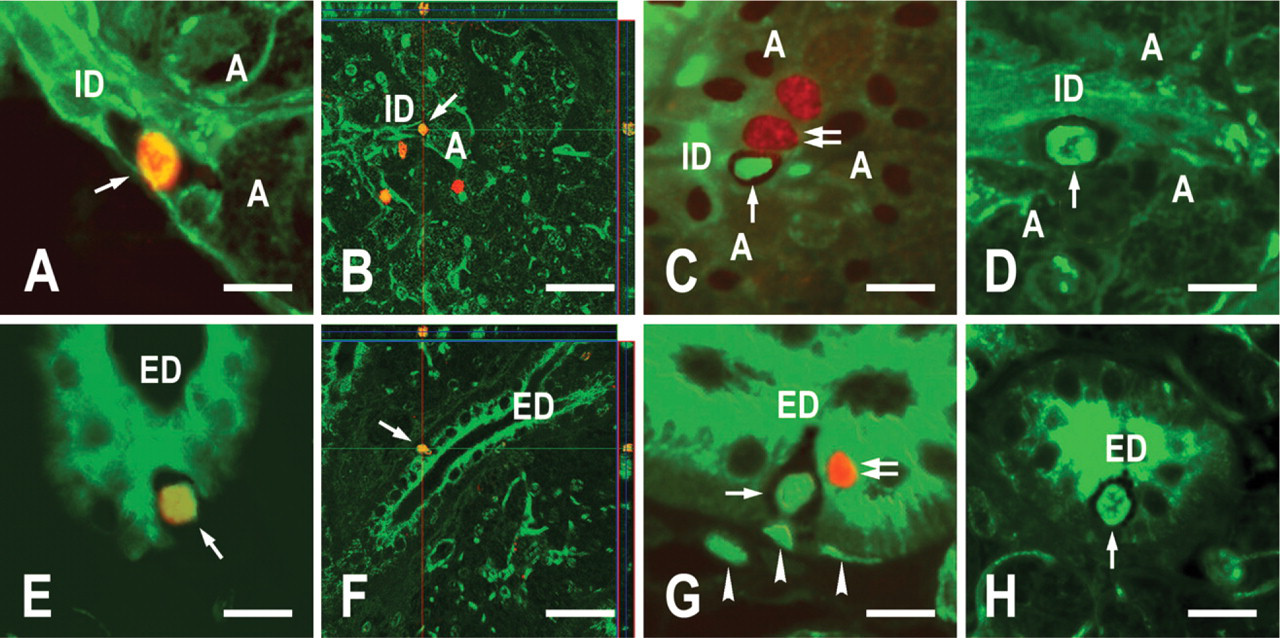
Immunofluorescence histochemistry was performed to examine two LRC types. IdU and lineage markers were revealed by green fluorescence, and CldU was revealed by red fluorescence. Thus, the (K18 and αSMA)neg LRCs were cells with a green fluorescent nucleus and a non-fluorescent cytoplasm, whereas the (K18 and/or αSMA)pos LRCs expressed a green fluorescent nucleus and a green fluorescent cytoplasm. The number of the (K18 and/or αSMA)pos LRCs increased after gland extirpation. Their IdU fluorescence became weaker: their granular fluorescence (cf. Figure 5B) became a smaller amount and finer. In contrast, the (K18 and αSMA)neg LRCs, which were consistently localized to the excretory duct and the neck of the intercalated duct, did not appear to change either in number or in quality of IdU fluorescence (Figure 7). Both before and after gland extirpation, we encountered the (K18 and αSMA)neg cells with strong and uniform IdU labels once in 1–2 × 200 fields in the intercalated duct and once in 10–15 structures in the excretory duct (no statistical difference was observed between each of the experimental groups). When images of green fluorescence were merged with those of red fluorescence, both the LRCs and the non-LRCs expressed red fluorescence in their nuclei. The LRCs included both (K18 and/or αSMA)pos and (K18 and αSMA)neg types. The (K18 and αSMA)neg LRCs expressed red fluorescence immediately after administration of CldU (3 days after extirpation; Figures 7A, 7B, 7E, and 7F). However, the red fluorescence was no longer observed in these cells 7 and 14 days after gland extirpation (Figures 7C, 7D, 7G, and 7H). At 3 and 7 days, non-LRCs with a red nucleus and a green cytoplasm [(K18 and/or αSMA)pos CldUpos non-LRCs] were often juxtaposed with the (K18 and αSMA)neg LRCs (Figures 7C and 7G).
Discussion
To identify stem cells in salivary glands, LRCs were established in rat submandibular glands and were labeled with BrdU during development and regeneration. Developing glands were labeled during the second postnatal week and excised 8 weeks later. Development of rat submandibular glands starts at 14 days in utero and continues after birth (Redman 1987; Ogawa 2003). Both proliferation and differentiation remain active until 3–4 weeks after birth (Chang 1974; Alvares and Sesso 1975; Srinivasan and Chang 1975). All the parenchymal structures appear during the first 6 weeks (Jacoby and Leeson 1959; Srinivasan and Chang 1975). Thereafter, although development of the granular duct continues for several months, the glands are quiet with respect to proliferation, although slightly more active than those of fully matured animals (Jacoby and Leeson 1959; Srinivasan and Chang 1975). Thus, after 6 weeks, the glands would not be suitable for the establishment of LRCs. Indeed, the regeneration experiment showed that, without being injured, glands at 7 weeks did not yield LRCs.
For regeneration of rat submandibular glands, the glands of 6-week-old animals were injured by ligation of the main excretory duct. This has been shown to cause marked reduction of gland size, partly by apoptotic diminution of the gland cells (Takahashi et al. 2004). On removal of the ligature, regeneration takes place through proliferation and differentiation of the residual cells (Tamarin 1971; Takahashi et al. 2004). Reconstruction of the gland structure requires at least 2 months (Tamarin 1971). During the first week after removal of the ligation, we labeled the glands. Eleven weeks later, we excised them. Although the granular ducts were far less developed than were those in the contralateral untreated glands, regeneration in these glands had proceeded well.
LRCs were observed in all the parenchymal structures of the glands labeled during development. Except for those in the acinus, LRCs were also observed in the glands labeled during regeneration. They were phenotypically divided into two types: a majority type expressing the salivary cell lineage markers [(K18 and/or αSMA)pos] and a minority type without the lineage markers [(K18 and αSMA)neg]. Between these two types, the latter LRCs may not yet have committed themselves in differentiation toward the acinar, duct, or myoepithelial cell. In other words, they may be salivary gland stem cells. This idea is consistent with the fact that the (K18 and αSMA)neg LRCs were invariably observed in the intercalated duct and the excretory duct. In the intercalated duct, they were localized to the proximal end. It is well known that stem cells reside in restricted sites in a tissue (e.g., the bulge region of the hair follicle for epidermal stem cells and near the base of the crypt for small intestinal stem cells) (Spradling et al. 2001; Potten et al. 2003). In these sites or niches, self-renewal and progeny production of stem cells are controlled by neighboring cells and extracellular substances (Spradling et al. 2001).
Rat submandibular glands at 3 (
The (K18 and αSMA)neg LRCs but not the (K18 and/or αSMA)pos LRCs were suggested to be salivary gland stem cells. Because self-renewal is the hallmark property of stem cells (Smalley and Ashworth 2003), we next examined whether the (K18 and αSMA)neg LRCs divide asymmetrically. LRCs established by labeling with IdU were forced to divide by unilateral gland extirpation, which causes compensatory hyperplasia of the remaining gland (Yagil et al. 1985; Schwartz-Arad et al. 1991). CldU was administered during the first 3 days after gland extirpation. The (K18 and αSMA)neg LRCs in the remaining glands remained in the neck of the intercalated duct and in the excretory duct. Although we did not pursue each individual cell, thorough examinations of the tissue sections convinced us that these cells were unchanged either in number or in IdU label. These results can be interpreted in two ways: (1) the (K18 and αSMA)neg LRCs were static and did not divide or (2) the (K18 and αSMA)neg LRCs divided asymmetrically and thus were dynamic. The former explanation is unlikely because these LRCs were labeled with CldU. Because the CldU label was observed immediately after the nucleoside administration but not later, the following events should have happened: (a) during CldU administration, the (K18 and αSMA)neg LRCs divided (asymmetric cell division 1 in Figure 1) and incorporated CldU into their newly synthesized DNA strands (CldU was incorporated into the strand indicated by the dotted line in the third stem cell in Figure 1); (b) thereafter, the (K18 and αSMA)neg LRCs went through the second cell division (asymmetric cell division 2 in Figure 1) and released the CldU-labeled strands (as indicated by the right dotted line in the transit cell at the bottom of Figure 1); and (c) during these cell divisions, the (K18 and αSMA)neg LRCs retained IdU-labeled old strands (template strands) (indicated by the solid line in all the stem cells in Figure 1). (K18 and/or αSMA)pos CldUpos non-LRCs juxtaposed with the (K18 and αSMA)neg LRCs would be their immediate progeny. In contrast to the (K18 and αSMA)neg LRCs, the number of (K18 and/or αSMA)pos LRCs increased and their IdU labels weakened. They incorporated CldU into their nuclei. Therefore, the (K18 and/or αSMA)pos LRCs divided symmetrically and diluted their IdU labels by random DNA strand segregation; in other words, they should not be stem cells.
This study indicated that there are two types of stem cells in the rat salivary gland. One is in the intercalated duct and the other is in the excretory duct. The intercalated duct stem cells are localized to the proximal end, an ideal site to generate both duct and acinus. The intercalated duct has been suggested as a source of the acinus and the granular duct (Srinivasan and Chang 1975; Zajicek et al. 1985; Moreira et al., 1990, 1991; Man et al. 1995, 2001). At 3 days after unilateral gland extirpation, CldU-labeled nuclei appeared in all the parenchymal structures except for the granular duct. They appeared most frequently in the acinus and the intercalated duct. At 7 days, the labeled nuclei decreased significantly in these structures, whereas they appeared in the granular duct. Thus, it may well be that dividing transit cells generated from intercalated duct stem cells differentiate toward acinar cells first and then toward granular duct cells. Previously, the number of acinar cells increased during the first 3 days and then dropped to a level plateau by 7 days, whereas the granular duct cells rose sharply during the second week (Schwartz-Arad et al. 1991). Considering that there were no signs of necrosis and inflammation, the newly generated acinar cells would have been eliminated by apoptosis between 3 and 7 days (Schwartz-Arad et al. 1991).
This study did not provide any suggestions regarding maintenance of the other structures by the intercalated duct stem cells and the roles of the excretory duct stem cells. Two types of stem cells, however, would be supported by recent discoveries that tumors are derived from cells with stem cell properties (Lapidot et al. 1994; Bonnet and Dick 1997; Al-Hajj et al. 2003; Singh et al. 2004). Based on a morphological comparison between tumor cells and normal cells, salivary gland tumors have been classified into two groups: tumors derived from intercalated duct and those derived from excretory duct (Eversole 1971; Regezi and Batsakis 1977).
In conclusion, for the first time, LRCs were established in salivary glands. Many LRCs were not considered in the role of stem cells, indicating that the chase periods used in this study were not sufficient for the elimination of their labels. A few LRCs, however, were considered to be stem cells. The LRC technique in combination with lineage marker immunohistochemistry will be used to find protein(s) specific to salivary gland stem cells.