
Abstract
Recent evidence suggests that the PRL-1 and −2 phosphatases may be multifunctional enzymes with diverse roles in a variety of tissue and cell types. Northern blotting has previously shown widespread expression of both transcripts; however, little is known about the cell type-specific expression of either gene, especially in human tissues. Therefore, we investigated expression patterns for PRL-1 and −2 genes in multiple normal, adult human tissues using in situ hybridization. Although both transcripts were ubiquitously expressed, they exhibited strikingly different patterns of expression. PRL-2 was expressed heavily in almost every tissue and cell type examined, whereas PRL-1 expression levels varied considerably both between tissue types and between individuals. Widespread expression of PRL-1 and −2 in multiple organ systems suggests an important functional role for these enzymes in normal tissue homeostasis. In addition, the variable patterns of expression for these genes may provide distinct activities in each tissue or cell type.
Keywords
T
PRL-1, the first identified PRL family member, was initially characterized and named for its expression in a number of proliferating cell types including rat liver during hepatic regeneration (Mohn et al. 1991; Diamond et al. 1994), mouse liver cells and NIH3T3 mouse fibroblasts stimulated by a primary mitogen (Diamond et al. 1996; Columbano et al. 1997), rat cerebral cortex following transient forebrain ischemia (Takano et al. 1996), and multiple human tumor cell lines (Diamond et al. 1994; Wang et al. 2002a). Further indicating a role for PRL-1 in cellular growth and proliferation, it has been found that PRL-1 phosphatase activity is required for progression of cells through mitosis (Wang et al. 2002a), and that overexpression of either PRL-1 or −2 in cells leads to accelerated entry into S phase (Werner et al. 2003). Additionally, all three PRL enzymes have been linked to cellular transformation and tumorigenesis (Cates et al. 1996; Wang et al. 2002b; Bardelli et al. 2003; Zeng et al. 2003; Wu et al. 2004).
Although these results are all consistent with a role for the PRL enzymes in cell growth, analysis of the normal tissue expression of PRL transcripts revealed all three genes to be predominantly expressed in terminally differentiated tissues such as skeletal muscle (Diamond et al. 1994; Zeng et al. 1998; Matter et al. 2001), brain (PRL-1) (Diamond et al. 1994), and cardiac muscle (PRL-3) (Matter et al. 2001). Consistent with this pattern of PRL expression, Diamond et al. (1996) noted high levels of PRL-1 protein in the differentiated villus but not in the proliferating crypt enterocytes of rat intestine and high levels of PRL-1 mRNA in confluent differentiated CaCo2 cells, but little to no expression in proliferating CaCo2 cells. Guo et al. (2003) found the PRL-1 gene to be significantly overexpressed in more differentiated parous breast tissues as compared with proliferative nulliparous breast tissues. Scarlato et al. (2000) found that PRL-1 mRNA is upregulated in oligodendroglial progenitor cells that are capable of terminal differentiation in comparison to immature oligodendroglial progenitors, which do not terminally differentiate.
Together these results suggest a dual role for the PRL gene family in regulation of both cellular proliferation and differentiation. Consistent with this notion, PRL-1 mRNA was predominantly expressed in proliferating chondrocytes in early development of mouse embryos but was localized primarily to differentiated, hypertrophic chondrocytes in later stages of development (Rundle and Kappen 1999). PRLs have also been implicated in more complex biological processes including embryonic development (Rundle and Kappen 1999; Kong et al. 2000), angiogenesis (Guo et al. 2004), cardiomyopathy (Matter et al. 2001), cell movement (Zeng et al. 2003), and sexual differentiation in the brain (Carter 1998).
Whereas multi-tissue analysis has revealed PRL-3 expression to be largely confined to heart and skeletal muscle in normal tissues (Zeng et al. 1998; Matter et al. 2001), PRL-1 and −2 are reported to be more widely expressed (Montagna et al. 1995; Zeng et al. 1998; Rundle and Kappen 1999; Kong et al. 2000). Given that the biological effects of the PRL enzymes may be tissue specific, characterization of the tissues and cell types that express PRL-1 and −2 is important to elucidating the physiological function of the normal genes and to understanding their roles in the pathogenesis of disease. However, studies of normal PRL-1 or −2 expression, to date, have been limited largely to animal systems and to human cell line or tissue Northern blots. To our knowledge, no study has yet described the cell type-specific expression patterns of any of the PRL genes in a diverse panel of human tissues. Therefore, we sought to characterize the cellular localization and tissue distribution of PRL-1 and −2 mRNA in a broad range of normal adult human tissues using in situ hybridization (ISH). With non-radioactive ISH, we detected some level of PRL-1 and −2 message in nearly all human tissues studied, confirming reports of their ubiquitous expression. Our results also show that the two genes display distinct expression levels and patterns from one another, as well as distinct patterns of expression among different tissues, supporting a potential multi-functional role for these genes in normal cellular regulation.
Materials and Methods
Tissue Procurement
Samples of normal human tissues consisting of postmortem tissue specimens, surgical biopsy samples, and surgically resected organs were obtained from the Cooperative Human Tissue Network, National Disease Research Interchange, and Indiana University School of Medicine, Department of Pathology. Samples were collected in accordance with the guidelines of Indiana University with approval from the Indiana University-Purdue University Indianapolis Institutional Review Board. Specimens were fixed in 10% neutral-buffered formalin, processed, and embedded in paraffin. Five-μm-thick serial sections were cut and mounted on Fisherbrand Superfrost/Plus slides (Fisher Scientific; Pittsburgh, PA). Tissues included adrenal gland (n=3), appendix (n=3), bladder (n=5), brain (n=7), breast (n=18), cervix (n=5), colon (n=6), eye (n=3), gallbladder (n=1), heart (n=5), kidney (n=18), liver (n=6), lung (n=10), lymph node (n=6), ovary (n=12), pancreas (n=20), parathyroid (n=1), placenta (n=2), prostate (n=20), skeletal muscle (n=9), skin (n=3), duodenum (n=4), jejunum (n=4), spleen (n=10), stomach (n=7), testis (n=5), thyroid (n=4), tongue (n=2), and uterus (n=8).
Oligonucleotide Probes
Specific 45-mer oligonucleotide probes for PRL-1 and −2 mRNA were designed using Oligo Primer Analysis Software (Molecular Biology Insights; Cascade, CO). Oligonucleotide sequences were verified using a BLAST search of EMBL and GenBank databases to ensure that there was no significant homology with other mRNA species. Probes were custom synthesized by Midland Certified Reagent Company Inc. (Midland, TX) and were labeled with fluorescein isothiocyanate (FITC) at both the 5′ and 3′ ends. PRL-1 (5′-GGC CAA CAG AAA AGA AGT GCA CTG AGG TTT ACC CCA TCC AGG TCA-3′) and PRL-2 (5′-TGG CAA ATA AAA AGT GTG AGC GTG CGT GTG AGT GTG ATG GGG AAA-3′) antisense probes are complementary to nucleotides 150-194 and 19-63 of the human PRL-1 (GenBank U48296) and PRL-2 (GenBank U48297) mRNA sequences, respectively. Corresponding control, sense oligonucleotides for PRL-1 and −2, were also generated. PRL probes were chosen from a region covering all known transcript variants.
Slot-blot Hybridization
Slot-blot hybridization was performed to verify specificity of the oligonucleotide probes. PRL-1 cDNA and PRL-2 cDNA, both cloned in pUC19 vectors (Cates et al. 1996), and PRL-3 cDNA, cloned in a pET-15b vector (a gift from Millenium Pharmaceuticals; Cambridge, MA), were linearized with BamHI. Linearized DNA samples of 100, 50, 10, and 5 ng each were denatured by the addition of 0.4 M NaOH and 10 mM EDTA and by heating for 10 min at 100C. Samples were then neutralized with an equal volume of cold 2 M ammonium acetate, pH 7.0. Two hundred μl of each denatured DNA solution was spotted on a nitrocellulose membrane (Protran; Schleicher and Schuell Bioscience, Keene, NH) using a Bio-Dot SF Microfiltration Apparatus (Bio-Rad; Hercules, CA) according to the manufacturer's instructions. Samples were immobilized on the membrane using a Stratalinker UV Crosslinker 1800 (Stratagene; La Jolla, CA). Slot-blots were prehybridized for 30 min at 37C in prewarmed PerfectHyb Plus hybridization buffer (Sigma; St Louis, MO), followed by hybridization with FITC-labeled oligonucleotide antisense probes for PRL-1 and −2, diluted to 100 ng/ml in prewarmed PerfectHyb Plus buffer. Hybridization was allowed to proceed overnight at 37C. Posthybridization, membranes were washed two times for 5 min each in 2X SSC + 0.1% SDS at room temperature, followed by one 20-min wash in 0.5X SSC + 0.1% SDS at 37C, and a 5-min wash at room temperature in TBST (50 mM Tris-HCl, 150 mM NaCl, pH 7.6, plus 0.05% Tween-20). Prior to detection, membranes were blocked for 2 hr with 3% BSA in TBST and additionally for 30 min with Serum Free Protein Block (Dako; Carpinteria, CA). FITC-labeled probes were detected for 30 min using a mouse anti-FITC primary antibody (Dako) diluted 1:1000 in Dako Antibody Diluent, followed by Dako LSAB2 Peroxidase Link and Peroxidase Conjugated Streptavidin Label (10 min each). Reactions were visualized using the Dako DAB substrate chromogen system. Development was allowed to occur for 5 min, and the reactions were stopped by rinsing membranes in TBST followed by distilled water. Membranes were washed three times, 5 min each, in TBST, between each step of the procedure.
Non-radioactive ISH
Paraffin sections were dewaxed in xylene and rehydrated through a graded series of ethanol (100%, 95%, and 75%) to water. Sections were permeabilized with 200 μl of 10 μg/ml, nuclease-free Proteinase K (Sigma). Optimal length of time for Proteinase K digestion was determined empirically for each tissue type (data not shown). Deproteination reaction was stopped by washing slides two times, 3 min each, in Nanopure (Chesterland, OH) ultrapure water. Slides were subsequently dehydrated by sequential washes in 95% ethanol and 100% ethanol and allowed to air dry for 1 hr at room temperature. Tissue sections were hybridized with 750 ng/ml PRL-1, −2, or control probe in PerfectHyb Plus (Sigma) hybridization buffer, sealed with parafilm, and hybridized 12-14 hr at 37C in a humidity chamber. Coverslips were dislodged and nonspecifically bound probe was removed by soaking slides for 5 min each in two changes of 2X SSC plus 0.1% SDS at room temperature. Slides were then washed stringently in prewarmed 0.5X SSC + 0.1% SDS at 37C for 20 min, followed by a 10-min rinse in TBS (50 mM Tris-HCl, 150 mM NaCl, pH 7.6) + 0.1% SDS at room temperature.
Histochemical Detection
Detection of hybridized probe was performed by standard immunohistochemical techniques using a catalyzed signal-amplification procedure. All staining steps were performed on a Dako Autostainer at room temperature, and slides were rinsed for 5 min in TBST + 0.05% Tween-20 between each step of the procedure. Nonspecific background staining was blocked by incubation with Dako Serum-Free Protein Block for 30 min, followed by a 30-min incubation with mouse anti-FITC primary antibody (Dako), and diluted to 22 μg/ml in Dako Antibody Diluent. Bound primary antibody was detected using the labeled streptavidin-biotin method (LSAB2; Dako) combined with the Renaissance Tyramide Signal Amplification (TSA Biotin; PerkinElmer Life Sciences, Boston, MA) kit. Briefly, slides were incubated sequentially with Dako LSAB2 Peroxidase Link for 30 min, Dako LSAB2 Label for 10 min, biotinyl tyramide (TSA Biotin System) diluted 1:50 in 1X amplification diluent for 10 min, and Dako LSAB2 Label again for 10 min. Antibody complexes were visualized using 3,3′-DAB substrate (Chromogen System; Dako) as the chromogenic substrate. Development was allowed to proceed for 2 to 5 min and was stopped by rinsing the slides in distilled water. Following immunohistochemical detection, sections were counterstained briefly with 1X Lerner's hematoxylin, dehydrated through graded alcohols, cleared in xylene, and coverslipped with permanent mounting media (Fisher).
Controls
Several positive and negative controls were used to confirm the specificity of the ISH signal. All controls were performed on serial sections of the same tissues as hybridized with the labeled PRL-1 and −2 probe, following the ISH procedures described above. Positive controls included (a) verification of the hybridization and detection procedure by hybridization of the PRL-1 and −2 antisense probes to a normal pancreas tissue (case #032,098) known to be positive for PRL-1 and −2 mRNA and (b) hybridization of tissues with a fluorescein-conjugated Poly d(T) probe (Novocastra Laboratories; New Castle upon Tyne, UK) to assess the preservation and integrity of the mRNA in each sample. Negative controls consisted of (a) omission of the oligonucleotide probes from the hybridization mixture, (b) substitution of the specific antisense probe with an equivalent concentration of labeled sense probe, (c) hybridization using a cocktail of randomly generated, FITC-conjugated, oligonucleotide sequences (NCL-CONTROL; Novocastra) to assess binding of nonspecific sequences, and (d) RNase pretreatment of tissue sections to demonstrate specificity of the signal for single-stranded RNA. For RNase pretreatment, RNase solution was prepared by diluting RNase A (RNase A; Sigma) in TE buffer (20 mM Tris, pH 7.5, 1 mM EDTA) to a final concentration of 250 μg/ml. Control sections were incubated with 200 μl RNase solution or TE buffer only for 2 hr at 37C and were subsequently washed three times for 5 min each in ultrapure water, immediately prior to tissue dehydration and probe hybridization.
Analysis of ISH Results
Evaluation of all slides was performed under brightfield microscopy. All sections of a particular tissue type were stained and analyzed in a single run and are therefore directly comparable. Tissue distribution, localization pattern, intensity of staining, and percentage of positive cells were evaluated by two investigators (GES and CMD) in a blinded fashion. Localization pattern was evaluated as cytoplasmic, nuclear, or perinuclear. Staining intensity was classified according to the following scale: (-) absent, (+/-) barely detectable, (+) weak, (++) moderate, and (+++) strong. In cases of heterogeneous staining, the average intensity across the section was taken as the score. Also, in a few cases where a patient sample was stained twice, the case was given a mean score based on evaluation of the two sections. Percentage of positive cells was estimated as the number of stained cells per total number of cells counted. To confirm reproducibility of the analysis, 25% of the slides were randomly chosen and scored twice. Duplicate slides gave similar results.
Results
Specificity of Oligonucleotide Probes
To verify that the PRL-1 and −2 oligonucleotide probes were specific for their complementary sequences, a BLAST search was performed against the EMBL and GenBank databases. Neither sequence displayed significant similarity to any other known mRNA species. For confirmation that the labeled PRL-1 and −2 probes were not cross-hybridizing with sequences from closely related family members, slot-blot hybridization was carried out on PRL-1, −2, and −3 cDNA targets. Both antisense probes displayed a high degree of specificity for their target mRNA sequences (Figure 1) with minimal cross-reactivity. In addition, variable ISH expression patterns of PRL-1 and −2 and reduced levels of both transcripts in tissues known to heavily express PRL-3 (heart) suggested specificity of the probes for their respective targets. Therefore, we concluded that the probes were of sufficient specificity to accurately detect their appropriate PRL-1 or −2 transcripts.
ISH Controls
Several controls were used to confirm specificity of the staining signal and viability of the tissue mRNA. No specific hybridization was detected when tissue sections were hybridized with a control sense probe specific to PRL-1 or −2, a randomly generated “nonsense” oligonucleotide sequence, or in the absence of probe. In addition, pretreatment of slides with RNase A abolished the hybridization signals, indicating that staining was specific to RNA. A positive signal using a poly d(T) probe was detected in all cases, demonstrating the presence of mRNA in each sample (control data not shown).
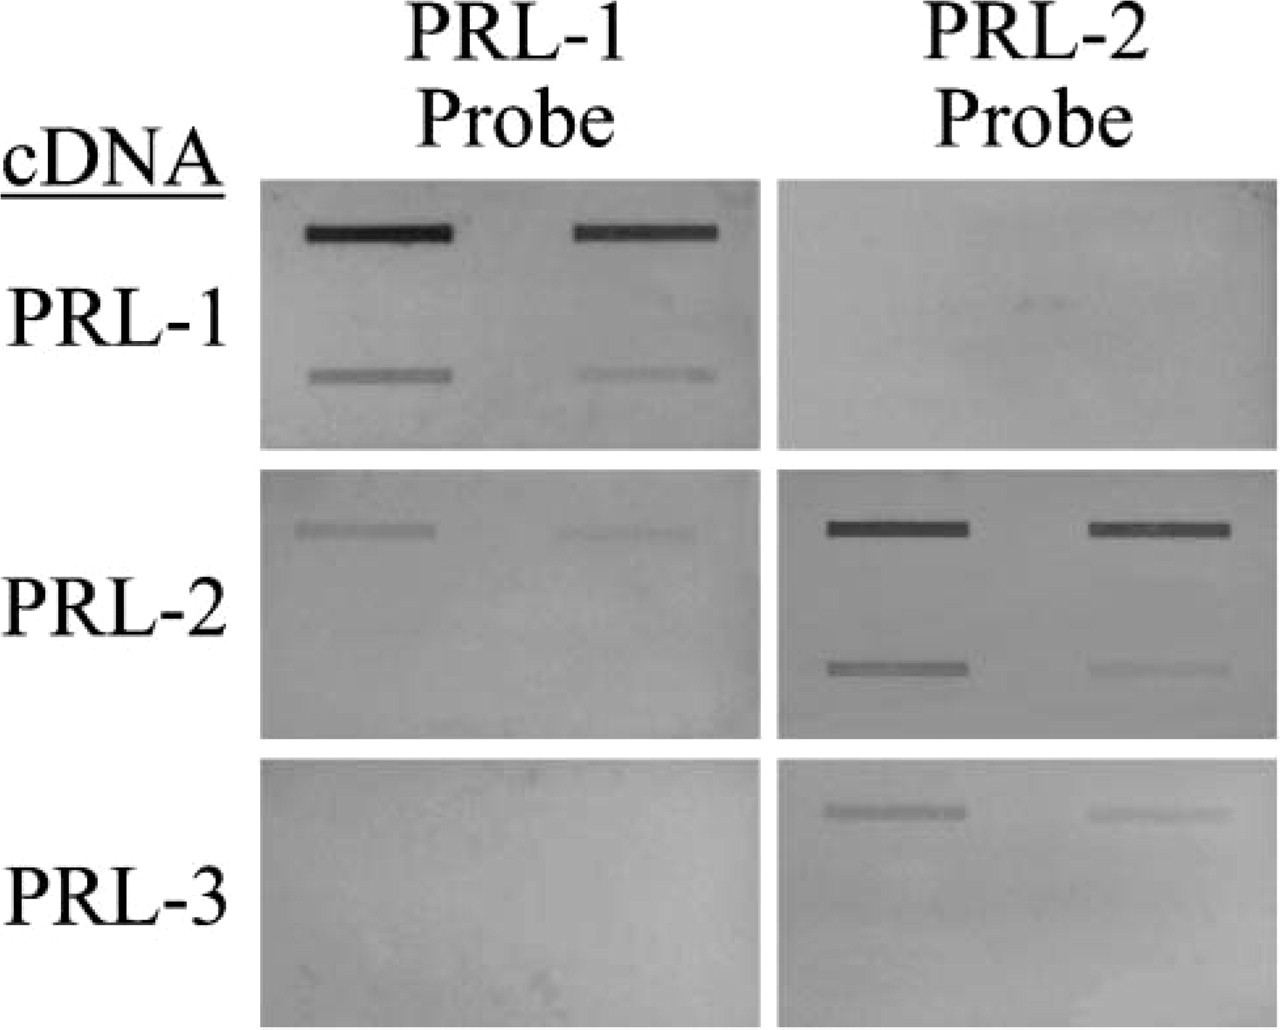
Specificity of the PRL-1 and −2 oligonucleotide probes. Denatured PRL-1, −2, and −3 cDNA were spotted onto a nitrocellulose membrane in various amounts and hybridized with PRL-1 or −2 FITC-labeled oligonucleotide probes. Clockwise from the upper left of each panel are 100, 50, 5, and 10 ng of spotted cDNA. Hybridized probe was detected using standard immunohistochemical techniques. Both probes displayed a high degree of specificity for their respective targets.
Expression Patterns of PRL-1 and −2 in Normal Human Tissues
Cellular localization and tissue distribution of PRL-1 and −2 mRNA were examined in zinc formalin-fixed, paraffin-embedded human tissues using non-isotopic ISH. ISH revealed widespread nuclear expression of both transcripts in histologically normal tissues. PRL-2 was generally expressed at higher levels than PRL-1. In addition, whereas PRL-2 was expressed at moderate to high levels in all tissues and most cell types examined, expression of PRL-1 was much more variable. Distribution and expression levels of PRL-1 and −2 in various tissues are described below and are further summarized in Table 1.
Skin
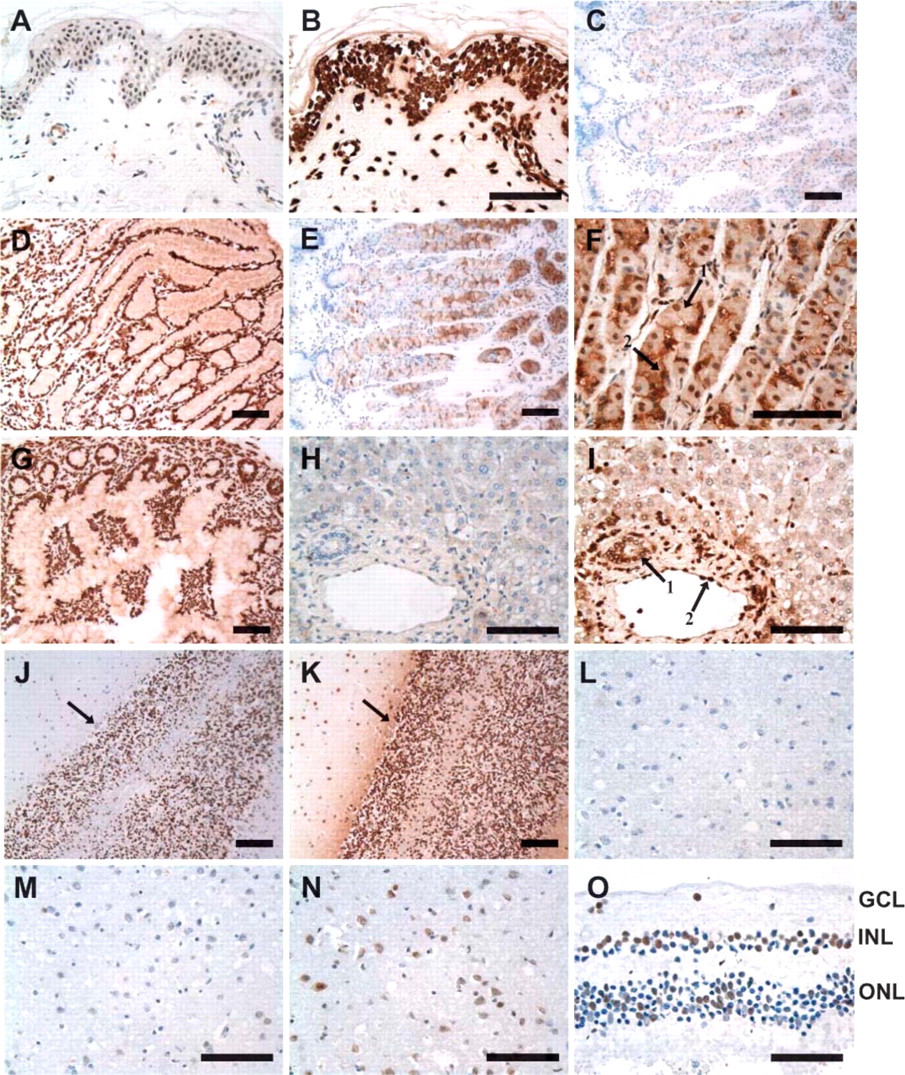
Intense and widespread expression of PRL-2 mRNA was observed throughout the epidermis (Figure 2B) and in the skin appendages. All epithelial cells in the coiled secretory portion of the eccrine sweat glands and within the hair follicles demonstrated heavy staining for this transcript (not pictured). Abundant expression was also observed in the fibroblasts of the dermis (Figure 2B) and in the endothelial cell layer of the tissue microvas-culature. Expression of PRL-1, however, was more variable. One patient case expressed PRL-1 transcripts at similar levels to those observed for PRL-2, whereas in two of three cases, PRL-1 was expressed at a lower intensity. In these cases, PRL-1 transcripts were localized to all epithelial cells of the dermal appendages (not shown) but to a smaller percentage of cells within the epidermis and dermis (Figure 2A).
Gastrointestinal Tract
Moderate expression of PRL-1 and strong expression of PRL-2 were noted in the stratified squamous epithelium of the tongue, whereas neither transcript was detected in the taste buds of the circumvallate papillae. PRL-1 message was also absent from the sublingual salivary glands, but scattered staining at a moderate intensity was observed for PRL-2. In the stomach, PRL-1 expression varied from mild to heavy, depending on the region analyzed. Staining for PRL-1 was generally weak to absent in the mucous producing cells of the cardiac and body (Figure 2C) mucosa, but moderate to heavy in the pyloric mucosa (Figure 2D). PRL-1 expression in the parietal and chief cells varied from patient to patient with expression limited to a small number of cells in some cases (5-10%) and more widespread expression in others (90-95%). Expression in these cell types tended to be both nuclear and cytoplasmic, with the most frequent expression occurring closer to the base of the gastric glands. PRL-2 was heavily expressed in all regions of the stomach. As with PRL-1, the strongest expression of PRL-2 occurred toward the base of the gastric glands (Figure 2E), and both cytoplasmic and nuclear staining were noted in the parietal and chief cells (Figure 2F).
Average PRL-1 and −2 mRNA expression in normal human tissuesa
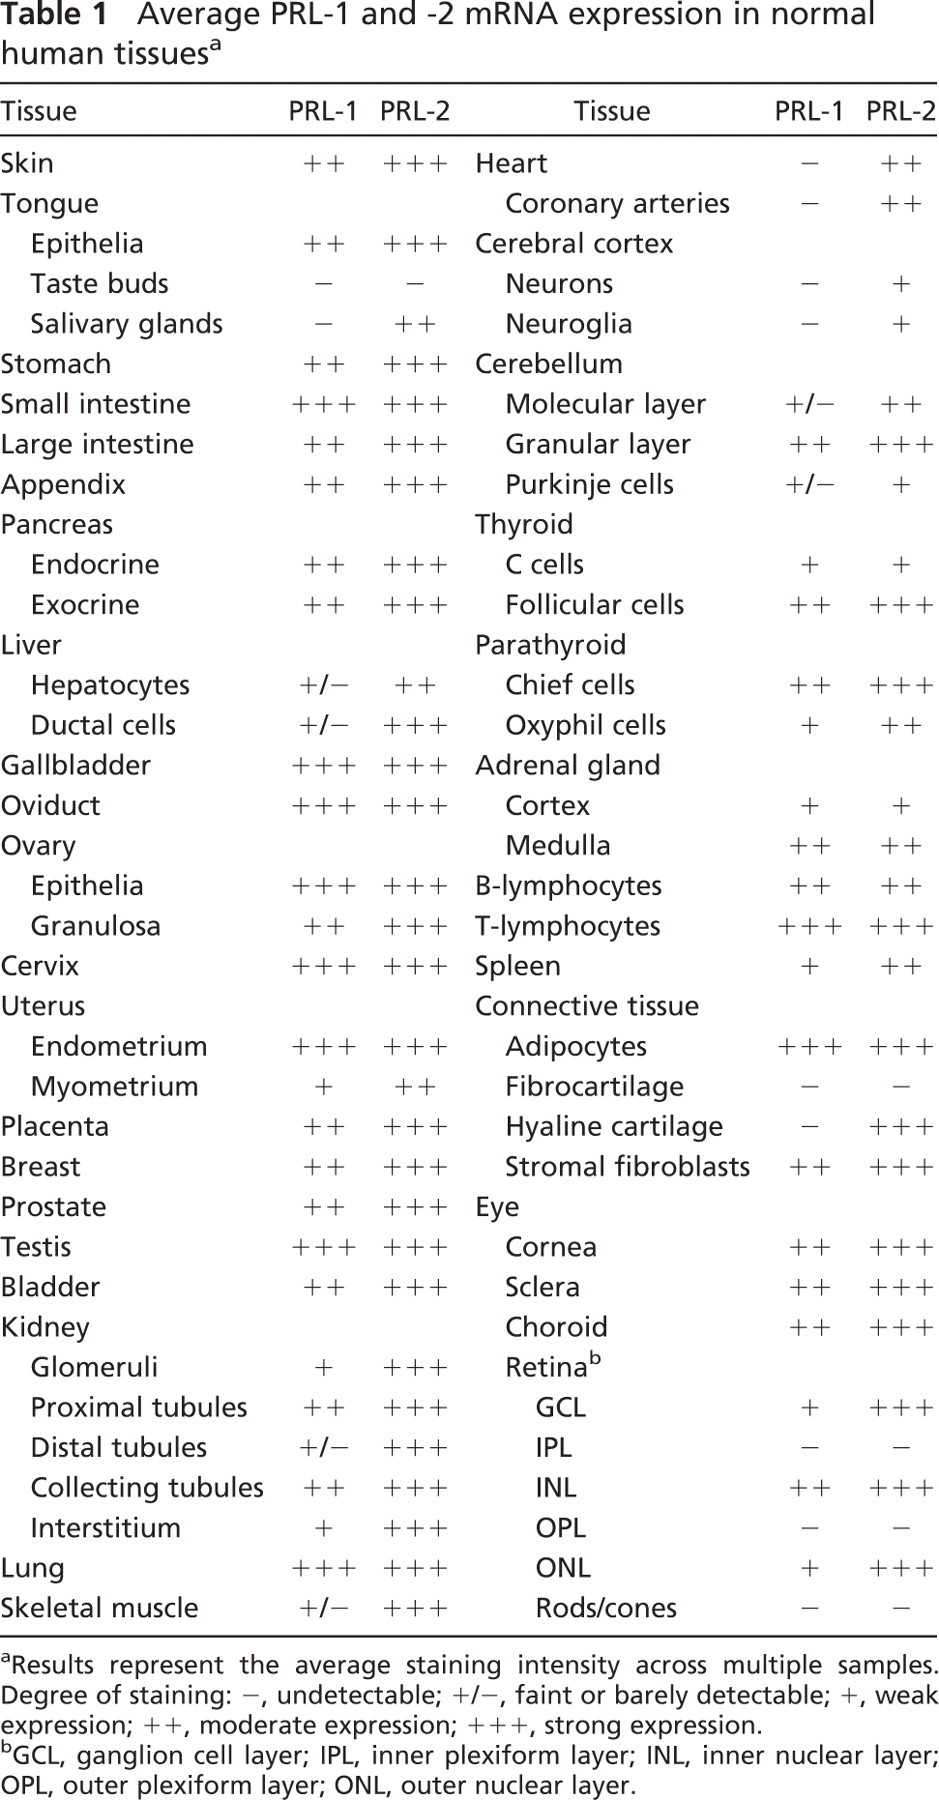
Results represent the average staining intensity across multiple samples. Degree of staining: -, undetectable; +/-, faint or barely detectable; +, weak expression; ++, moderate expression; +++, strong expression.
GCL, ganglion cell layer; IPL, inner plexiform layer; INL, inner nuclear layer; OPL, outer plexiform layer; ONL, outer nuclear layer.
Both PRL-1 and −2 transcripts were expressed at a high intensity in the small intestine (Figure 2G). Equivalent levels of expression were noted in the villous epithelium, crypt epithelium, and muscularis mucosae of the duodenum and jejunum and in the Brunner's glands of the duodenum. PRL-2 was also heavily expressed in the muscularis and the vasculature. PRL-1, however, was found at slightly lower levels in these structures. PRL-2 expression in the colon mirrored that of the small intestine with heavy expression noted throughout the organ. PRL-1 expression was moderate and, as in the stomach, the percentage of stained cells was case dependent, ranging from 30% in one case to 95-100% in others. Similar patterns of expression were seen in the appendix where PRL-1 was moderately expressed and PRL-2 was heavily expressed in the mucosal epithelium and submucosa.
Exocrine and endocrine portions of the pancreas both stained strongly for PRL-1 and −2 mRNA expression. PRL-1 staining was mixed, with ∼20-25% of acinar and islet cells displaying heavy expression and 75-80% cells expressing more moderate levels in each case. Ductal epithelial cells, on the other hand, always displayed high levels of PRL-1 transcript. The pancreatic vasculature also stained strongly for PRL-2 and at a slightly lower intensity for PRL-1. Expression in the pancreas was noted to be both nuclear and cytoplasmic for both markers. In normal liver, a large degree of interindividual variation was again noted for PRL-1. Hepatocytes in four of six cases examined were negative for PRL-1 message (Figure 2H). In the remaining cases, 25-50% of the hepatocyte nuclei were strongly positive. In most cases, PRL-1 expression was low to undetectable in the bile duct epithelia and varied from weak to moderate in the vasculature. PRL-2 message was expressed strongly in ∼50% of hepatocyte nuclei, whereas the hepatocyte cytoplasm revealed only weak or mild expression. Bile duct epithelia displayed moderate to strong hybridization for PRL-2, and blood vessels stained intensely (Figure 2I). Gallbladder mucosa and microvasculature were highly positive for both PRL-1 and −2 mRNA. Lymphocytes throughout gut-associated lymphoid tissue also hybridized strongly for both transcripts. A large degree of interindividual variability was seen in the staining intensity and number of positive lymphocytes for PRL-1.
Central Nervous System
Expression of PRL-1 and −2 in the brain was heaviest in the granular layer of the cerebellum followed by cell bodies within the molecular layer. Purkinje cells displayed faint cytoplasmic expression for PRL-1 and mild cytoplasmic expression of PRL-2 (Figures 2J and 2K). PRL-1 was absent from the neurons outside the cerebellum in most cases (Figure 2L), whereas PRL-2 expression in the neurons of the cerebral cortex varied from absent or weak to strong expression, depending on the sample and region analyzed (Figures 2M and 2N). Expression in glial cells and capillary endothelial cells was also generally absent for PRL-1 and varied for PRL-2.
Sense Organs
In the eye, PRL-1 and −2 messages were localized to the outer nuclear, inner nuclear, and ganglion cell layers of the retina. Whereas PRL-2 was expressed heavily throughout the nuclei and cell bodies in each of these layers, PRL-1 expression was mild to moderate and found in only a limited number of cell bodies and nuclei, with predominantly nuclear expression (Figure 2O). Both transcripts were also present in the vascular endothelial cells, fibroblasts, and lymphocytes of the choroids, in the corneal epithelium and endothelium, and in the fibroblasts of the cornea and sclera. In the corneal epithelium, PRL-1 predominantly stained the more apical layers of cells. PRL-2 was expressed heavily in each of the named structures, whereas PRL-1 expression was generally mild to moderate and more diffuse. Only the endothelial cell layer of the cornea strongly expressed the PRL-1 transcript.
Female and Male Reproductive Tracts
In the ovary, PRL-1 expression was highest in the surface epithelium and oviduct. Hybridization was mild to heavy in the stroma, follicular cells, corpus luteum, and vasculature, each varying considerably on a case-by-case basis. PRL-2 expression was consistently heavy in all structures of the ovary but slightly less intense in the stromal cell nuclei and vascular endothelium than in the epithelial cells. PRL-1 and −2 showed parallel patterns of expression in the cervix. Both were expressed highly in the epithelial and stromal components of the ectocervix and endocervix as well as in the tissue vasculature. Placental chorionic villi also demonstrated abundant expression of both messages, with moderate staining observed for PRL-1 and heavy staining for PRL-2. Glandular epithelium of the uterus exhibited pronounced expression of PRL-1 and −2. Myometrial smooth muscle and endometrial stroma also displayed consistently moderate to high expression of PRL-2 mRNA, whereas variable levels of PRL-1 mRNA were observed. In 50% of the cases, no PRL-1 expression was observed in the myometrium, whereas in the other half of cases, PRL-1 myometrial expression was moderate to intense. Endothelial cells within the uterine vasculature strongly expressed both PRL-1 and −2.
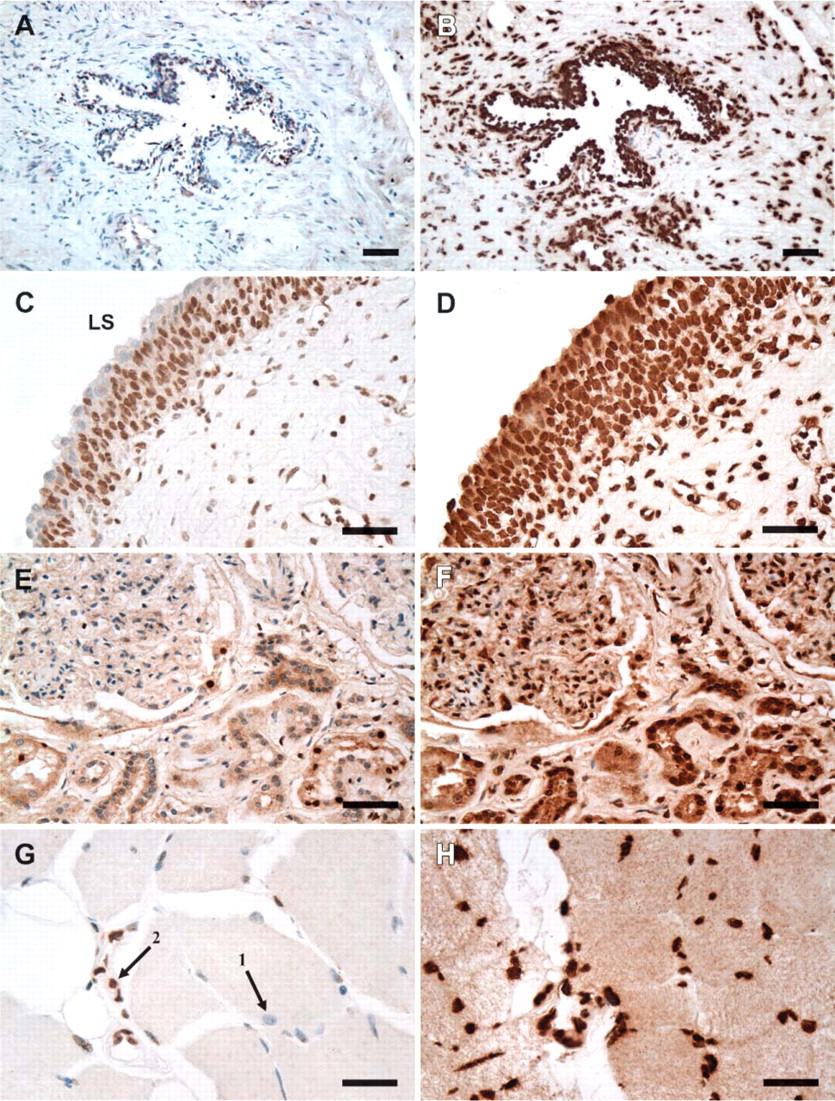
Both transcripts were also abundant in the glandular epithelium and the vasculature of the breast. Whereas PRL-1 expression in the mammary duct varied slightly among individuals, mRNA was generally expressed at moderate to high levels. Within the stroma of the breast, tissues hybridized with PRL-1 displayed a more scattered and variable staining. Here expression varied from absent to heavy, depending on the individual. PRL-2 was always expressed heavily in both the mammary ducts and stromal fibroblasts. A similar trend was observed in the prostate, where PRL-1 expression in both the prostatic glands and stroma displayed a large degree of interindividual variation. Positive staining for PRL-1 was apparent in all cases studied, but the staining intensity varied from barely detectable to strongly positive. On average, staining of the glandular epithelium was moderate, whereas staining of stromal fibroblasts was mild and more diffuse (Figure 3A). PRL-2 expression was heavy in both the epithelium and fibroblasts of all cases examined (Figure 3B). In the testis, expression of each transcript was heavy in the seminiferous tubules with staining of the Sertoli cells, primary spermatogonia, and mature spermatocytes. Leydig cells in the interstitium also expressed both transcripts strongly. Stromal fibroblasts and the vasculature of the testes stained moderately for PRL-1 and heavily for PRL-2 mRNA expression.
Urinary System
In the urinary system, PRL-2 was again found to be consistently and heavily expressed, whereas PRL-1 expression varied in amount and intensity. In the urinary bladder, PRL-1 mRNA was expressed at weak to moderate levels in the urothelium, with the strongest expression occurring in the intermediate and basal cell layers (Figure 3C). Weak to moderate expression of PRL-1 was also noted in the stromal fibroblasts, smooth muscle nuclei, and vasculature of the bladder. Hybridization of PRL-1 in the kidney was extremely variable, with expression ranging from weak to strong in different patient samples. Some level of PRL-1 expression was detected in the proximal convoluted tubules, collecting tubules, glomeruli, interstitial cells, and vascular elements in all patient cases (Figure 3E). The percentage of PRL-1 positive cells, in each case, varied from as low as 30% to as high as 95%. In all but two cases, PRL-1 was also expressed in the distal convoluted tubules. Generally, expression was highest in the proximal tubules and collecting tubules followed by the interstitium, glomeruli, and distal tubules. In contrast to PRL-1, PRL-2 was expressed at high levels in all components of the urinary bladder (Figure 3D) and kidney (Figure 3F).
Moderate and diffuse expression of PRL-1 mRNA (
Respiratory System
Heavy nuclear staining of PRL-1 and −2 was observed in the alveolar and bronchiolar epithelia with PRL-1 expression in pneumocytes being slightly less intense than its expression in the bronchiolar epithelium. Endothelial cells within the lung vasculature also displayed heavy expression of both transcripts.
Skeletal Muscle and Heart
Skeletal muscle nuclei stained weakly, if at all, for PRL-1 message, whereas cells of the endomysium, perimysium, and vasculature stained heavily for the transcript (Figure 3G). PRL-2 expression, on the other hand, was high in the skeletal muscle nuclei and muscle fibers, in addition to the surrounding support tissue and vasculature (Figure 3H). The epicardium, myocardium, and endocardium of normal heart were all generally negative for PRL-1 gene expression. Likewise, in the coronary arteries, faint PRL-1 expression was found in only one of five cases. PRL-2 expression in the heart was stronger than PRL-1 but much less intense than the PRL-2 expression levels observed in other organs. Cardiac cell nuclei stained moderately for PRL-2, whereas epicardial and endocardial components stained only lightly. All layers of the coronary arteries moderately expressed PRL-2.
Endocrine Tissues
Follicular epithelial cells in the thyroid expressed moderate levels of PRL-1 and high levels of PRL-2 transcripts. C-cells expressed both transcripts mildly. The oxyphilic and chief cells of the parathyroid were both positive for PRL-1 and −2 expression, with slightly higher expression occurring in the chief cells and with stronger expression of PRL-2 than of PRL-1. It was noted that staining for both transcripts in the oxyphilic cells was nuclear, whereas expression in chief cells was mostly cytoplasmic. Adipocytes within the gland stained intensely for both transcripts. Mild to moderate expression of both PRL-1 and −2 were noted in the adrenal cortex and medulla.
Lymphoid Tissues
Both B- and T-cell areas of the lymph node strongly expressed PRL-1 and −2 transcripts, with moderate staining of B cells and heavy expression in T cells. In the spleen, PRL-1 expression was less intense and more variable. Three of ten samples tested were negative for PRL-1, whereas the remaining seven samples expressed mRNA mildly and diffusely in the splenic cords, venous sinuses, and lymphoid follicles. The fibrocollagenous capsule and microvasculature of the organ expressed PRL-1 message at more moderate levels. PRL-2 was expressed in all samples and generally displayed a moderate staining intensity in the red and white pulp areas of the spleen and strong intensity within the capsule.
Connective Tissues
In general, adipocytes stained heavily for both PRL-1 and −2 transcripts. Tendon fibrocartilage, on the other hand, was negative for each. Hyaline cartilage was commonly negative for PRL-1, whereas chondroblast and chondrocyte nuclei and the territorial matrix of the lacuna were strongly positive for PRL-2. Fibroblasts in all tissues stained heavily for PRL-2, whereas PRL-1 expression in fibroblasts varied widely among tissue types and between individual samples within a tissue type.
Discussion
A detailed knowledge of the cellular distribution of PRL-1 and −2 gene expression in different human tissues and cell types is essential to understanding both the role of these proteins in normal tissues and their potential involvement in the pathogenesis of disease. The present study is the first report describing the cell-specific pattern of expression for either PRL-1 or −2 in a variety of human tissues. Previous studies have shown preferential expression of PRL-3 in the heart and skeletal muscle of normal tissues (Zeng et al. 1998; Matter et al. 2001); thus, PRL-3 transcripts were not examined here.
Results obtained show widespread distribution of PRL-1 and −2 in tissues from the major organ systems. PRL-1 expression was more variable and generally less intense than the level of PRL-2 expression in the same tissue or cell types. Only in the pyloric region of the stomach, small intestine, gallbladder, oviduct, testis, lung, and adipose tissue were levels of PRL-1 expression equivalent to PRL-2 in both intensity and total number of positive cells. PRL-1 expression was most abundant in the duodenum, jejunum, gallbladder, testis, lung, adipose, skin appendages, lymph node, oviduct, cervix, surface epithelium of the ovary, and endometrial glands of the uterus. Moderate expression of PRL-1 was seen in several other tissues and cell types including the skin and tongue epithelium, colon, appendix, pancreas, breast, placenta, prostate, bladder, and the eye. Lowest levels of PRL-1 expression were found in the liver and skeletal muscle, and no PRL-1 message could be detected in the taste buds, salivary glands, heart, coronary arteries, cerebral cortex, or cartilage.
Moderate expression of PRL-1 mRNA and strong expression of PRL-2 mRNA in the glandular epithelia of the prostate (
In the urinary bladder, PRL-1 appeared to be localized to the more immature, intermediate, and basal cell layers of the uroepithelium and not to the more differentiated and highly specialized superficial cell layer. It would be interesting to examine the colocalization of PRL-1 with the cytokeratins (CKs) and/or uroplakins, which can serve as markers of urothelial cell proliferation and differentiation. For example, CK20 is restricted mainly to the superficial layer of the urothelium, whereas CK13 is present only in the basal and intermediate layers (Mallofre et al. 2003; Varley et al. 2004). Such studies could help to elucidate a specific role for PRL-1 in this tissue type.
A large degree of interindividual variation was noted for PRL-1 in some tissues, most notably skin, stomach, liver, pancreas, breast, prostate, bladder, and kidney. Such differences could be attributed to allelic variants, environmental factors, lifestyle factors, and/or homeostatic control mechanisms. Differential expression in the breast, for example, could be a factor of the donor's reproductive history because Guo et al. (2004) found that PRL-1 is significantly overexpressed in parous breast tissue, which has been stimulated to differentiate during pregnancy.
In contrast to PRL-1, PRL-2 mRNA was found in almost every cell type examined, and the majority of tissues exhibited intense expression of the transcript. More moderate levels of PRL-2 were observed in the salivary glands, heart, coronary arteries, adrenal gland, spleen, and uterine smooth muscle. Purkinje cells of the cerebellum and C-cells of the thyroid demonstrated weak expression of the PRL-2 transcript. Only the taste buds of the tongue, fibrocartilage of the tendon, and photoreceptors and cell processes of cells within the retina were negative for PRL-2 expression. In the liver, PRL-2 was heavily expressed in the hepatocytes, but only 40-50% of hepatocyte nuclei were positive for expression. In comparison, 95-100% of cells were generally positive for expression in other tissues. In the cerebral cortex, PRL-2 expression in neurons and glial cells varied from specimen to specimen and between different sections within the same specimen. When expressed, PRL-2 levels in the cortex varied from weak to moderate. A more extensive analysis of PRL-2 expression in various areas of the brain and cerebral cortex may reveal region-specific localization patterns.
These results are generally consistent with previous reports on PRL-1 or −2 mRNA expression in human tissues. In a panel of cDNA libraries from adult hematopoietic tissues, Gjorloff-Wingren et al. (2000) noted ubiquitous expression of both transcripts with PRL-1 always expressed at equivalent or lower levels than PRL-2. Using multiple tissue Northern blots, Montagna et al. (1995) and Zhao et al. (1996) also reported widespread PRL-2 expression with moderate to high levels of PRL-2 transcripts in all tissue types examined. Additionally, Zhao et al. reported comparatively low levels of three PRL-2 variants in the liver. Our data both confirm and expand on this finding by suggesting that the lower levels of PRL-2 observed in the liver are not due to reduced PRL-2 expression across all cells, but rather to a smaller percentage of cells actually expressing the gene.
Comparison of our results with patterns of PRL-1 and −2 expression in other species reveals further similarities. The current study showed PRL-1 transcripts to be barely detectable in normal adult human liver or skeletal muscle and completely undetectable in the heart. In agreement with these findings, several researchers have reported a virtual absence of PRL-1 gene transcription in the liver of normal adult rats (Diamond et al. 1994,1996; Peng et al. 1999). In addition, Northern analysis, ISH, and immunohistochemistry have all consistently shown an absence of both PRL-1 mRNA and protein in murine heart tissue (Diamond et al. 1994; Rundle and Kappen 1999; Kong et al. 2000). Studies using ISH have also indicated an absence of PRL-1 in mouse skeletal muscle (Rundle and Kappen 1999). Northern analysis, on the other hand, has shown heavy expression of PRL-1 in rat skeletal muscle tissue (Diamond et al. 1994). Our analysis in human skeletal muscle tissues agrees with both findings, revealing a strong reactivity of the connective tissue and vasculature directly surrounding the muscle cells, whereas the muscle fibers and nuclei themselves were generally negative. PRL-2 was heavily expressed in human skeletal muscle, but weakly expressed in the brain cerebral cortex. In accordance with these results, Zeng et al. (1998) found heavy expression of PRL-2 in mouse skeletal muscle and comparatively low expression in the mouse brain.
In several cases, patterns of PRL-1 mRNA expression also appear to correlate well with reports of PRL-1 protein expression. For example, we found that PRL-1 mRNA expression in the regions of the stomach closest to the esophagus was weak, whereas expression in regions more distal to the esophagus was high. Further, our analysis showed decreased levels of PRL-1 mRNA in the colon as compared with the duodenum and jejunum. Kong et al. (2000) noted a lack of PRL-1 protein expression in the esophagus of the adult rat and found a gradient of PRL-1 protein expression within the small intestine, with highest levels of expression observed in the proximal intestine (duodenum and jejunum) and lower levels evident in the more distal ileum. Together these results suggest that PRL-1 may be differentially expressed along the longitudinal axis of the digestive tract, increasing from esophagus and cardiac stomach to pyloric stomach and proximal small intestine, then decreasing again in the distal intestine and the colon. Such spatial differences in PRL-1 expression suggest a specialized role for the enzyme within the digestive tract.
Variable expression of PRL-1 protein has also been observed along the crypt-villus axis of the intestine. Diamond et al. (1996) and Kong et al. (2000) each reported significantly greater expression of PRL-1 protein in villus enterocytes than in crypt enterocytes. In the current study, however, we observed heavy expression of PRL-1 mRNA throughout both villus and crypt enterocytes. Although some of these observations could be explained by species-specific patterns of expression, such differences between mRNA and protein levels also raise the possibility that PRL-1 expression may be regulated posttranscriptionally.
In conclusion, the present results help to define the basal gene expression of the PRL-1 and −2 phosphatases in adult human tissues and provide a foundation for the recognition and interpretation of the changes in these patterns that may be associated with cancer or other disease states. Widespread tissue distribution of PRL-1 and −2 mRNA suggests a fundamental biological function for these enzymes. Whereas PRL-2 was highly expressed in the majority of tissues examined, PRL-1 expression was highly variable. PRL-1, therefore, appears to be regulated spatially in a cell type- and tissue-specific manner in the adult. Both transcripts showed widespread expression in both proliferating and quiescent normal cells, indicating that each tissue or cell type may display a unique physiological response to these genes. Further studies aimed at elucidating the specific substrates and other interacting molecules for the PRL enzymes will help clarify the specific cellular functions of PRL-1 and −2 and provide insight into their varied expression patterns in human tissues.
Footnotes
Acknowledgements
This work was supported in part by Public Health Service, NIH Grant CA-72450 (to PLC and SKR) and by an Indiana University Cancer Center-Cathy Peachey Foundation grant (to PLC).