
Abstract
Rat and mouse femur and tibia fracture calluses were collected over various time increments of healing. Serial sections were produced at spatial segments across the fracture callus. Standard histological methods and in situ hybridization to col1a1 and col2a1 mRNAs were used to define areas of cartilage and bone formation as well as tissue areas undergoing remodeling. Computer-assisted reconstructions of histological sections were used to generate three-dimensional images of the spatial morphogenesis of the fracture calluses. Endochondral bone formation occurred in an asymmetrical manner in both the femur and tibia, with cartilage tissues seen primarily proximal or distal to the fractures in the respective calluses of these bones. Remodeling of the calcified cartilage proceeded from the edges of the callus inward toward the fracture producing an inner-supporting trabecular structure over which a thin outer cortical shell forms. These data suggest that the specific developmental mechanisms that control the asymmetrical pattern of endochondral bone formation in fracture healing recapitulated the original asymmetry of development of a given bone because femur and tibia grow predominantly from their respective distal and proximal physis. These data further show that remodeling of the calcified cartilage produces a trabecular bone structure unique to fracture healing that provides the rapid regain in weight-bearing capacity to the injured bone.
Keywords
B
Because size, shape, and material properties of adult bones are determined early in life and are to a large part controlled by genetic factors (Richman et al. 2001; Jepsen et al. 2003; Lang et al. 2005), it is important to understand how these intrinsic developmental factors affect skeletal tissue morphogenesis and influence bone healing. However, this can only be accomplished by determining if there are specific developmental mechanisms that affect callus morphogenesis and how these mechanisms might vary in response to extrinsic factors such as the inflammatory response associated with a bone injury, the application of pharmacological compounds that affect various skeletal cell types, and/or the mechanical environment to which the healing bone is subjected. As a first step in approaching such questions, a quantitative definition of the spatial geometry of skeletal tissue morphogenesis during normal fracture healing must be defined. Only after this first step can the intrinsic developmental mechanisms that affect tissue morphogenesis be placed in context to specific extrinsic factors that affect initial tissue formation and subsequent healing. Furthermore, by defining spatial patterns of initial tissue morphogenesis, the relative importance of the later events of tissue resorption and remodeling can be placed in context to the final stages of the regeneration of the preinjury structure of the bones.
In this study we conducted a histomorphometric analysis of the temporal progression of fracture healing in both mouse and rat femur and compared these analyses between the femora and tibiae in mice. We defined the spatial patterns of endochondral vs intramembraneous formation and the subsequent patterns of tissue resorption and remodeling. To link histologic changes with the pattern of matrix gene expression critical to the repair process, we demonstrated that the three-dimensional (3D) pattern of collagen type I and II mRNA expression was able to be reconstructed from in situ hybridizations (ISH) of these mRNAs. These later results provide the basic analytical bridge between the cellular and molecular processes that form and maintain skeletal tissues and the geometric and material nature of the callus tissue that produces its mechanical properties. The data further demonstrate that the spatial arrangement of various tissues within the callus develop and heal in an asymmetrical pattern. Asymmetry of the endochondral bone formation in the femur and tibia recapitulates the original asymmetrical pattern of growth activity of the physes of the bone that is fractured.
Materials and Methods
Production of Simple Transverse Fractures
Animal research was conducted in conformity with all federal and USDA guidelines, as well as a protocol approved by the Institutional Animal Care and Use Committee. Seven- to 9-month old male Sprague Dawley rats (n=5 per group) weighing 449 ± 39 g were used. In experiments assessing mice, 8-to 10-week-old male C57BL/6J mice (n=5 per group) were used. All rats were purchased from Harlan Bioproducts (Indianapolis, IN), and all mice were purchased from Jackson Laboratories (Bar Harbor, ME). Closed, simple, mid-diaphy-seal, transverse fractures of the rat femurs were produced as described by Bonnarens and Einhorn (1984). Mouse tibia fractures were produced as previously described (Kon et al. 2001), whereas femur fractures were generated by inserting the intramedullary pins retrograde through the distal condyle of the femur and stabilizing in the major trochanter. Radiographic assessment of the fractures was performed immediately after fracture and at the time of euthanasia. Fractures not occurring in the mid-diaphysis or those that were excessively comminuted were not used in the study. Dependent on the experimental conditions and as noted within specific figures, animals were euthanized by CO2 asphyxiation at 7, 10, 12, 14, 21, or 35 days postfracture. At the time of euthanasia, fracture callus specimens were harvested and carefully cleaned of muscle and soft connective tissue. Callus dimensions were measured at this time in anterior-posterior and medial-lateral dimensions using an electronic caliper (#R163-7251006C; Maryland Metrics, Baltimore, MD).
Tissue Fixation, Decalcification, Embedding, and Sectioning
For histological assessments, bones with a small amount of surrounding muscle and soft tissues were fixed for 2 days in 4% paraformaldehyde in phosphate-buffered saline at 4C. Specimens were completely decalcified in 14% w/v EDTA changed three times per week for ~2-3 weeks while shaking at 4C. Specimens were rinsed and placed in ice-cold PBS for final processing. After decalcification, the intramedullary pin was removed and the anatomic center of the callus was determined from the X-ray measurements as the point of the fracture.
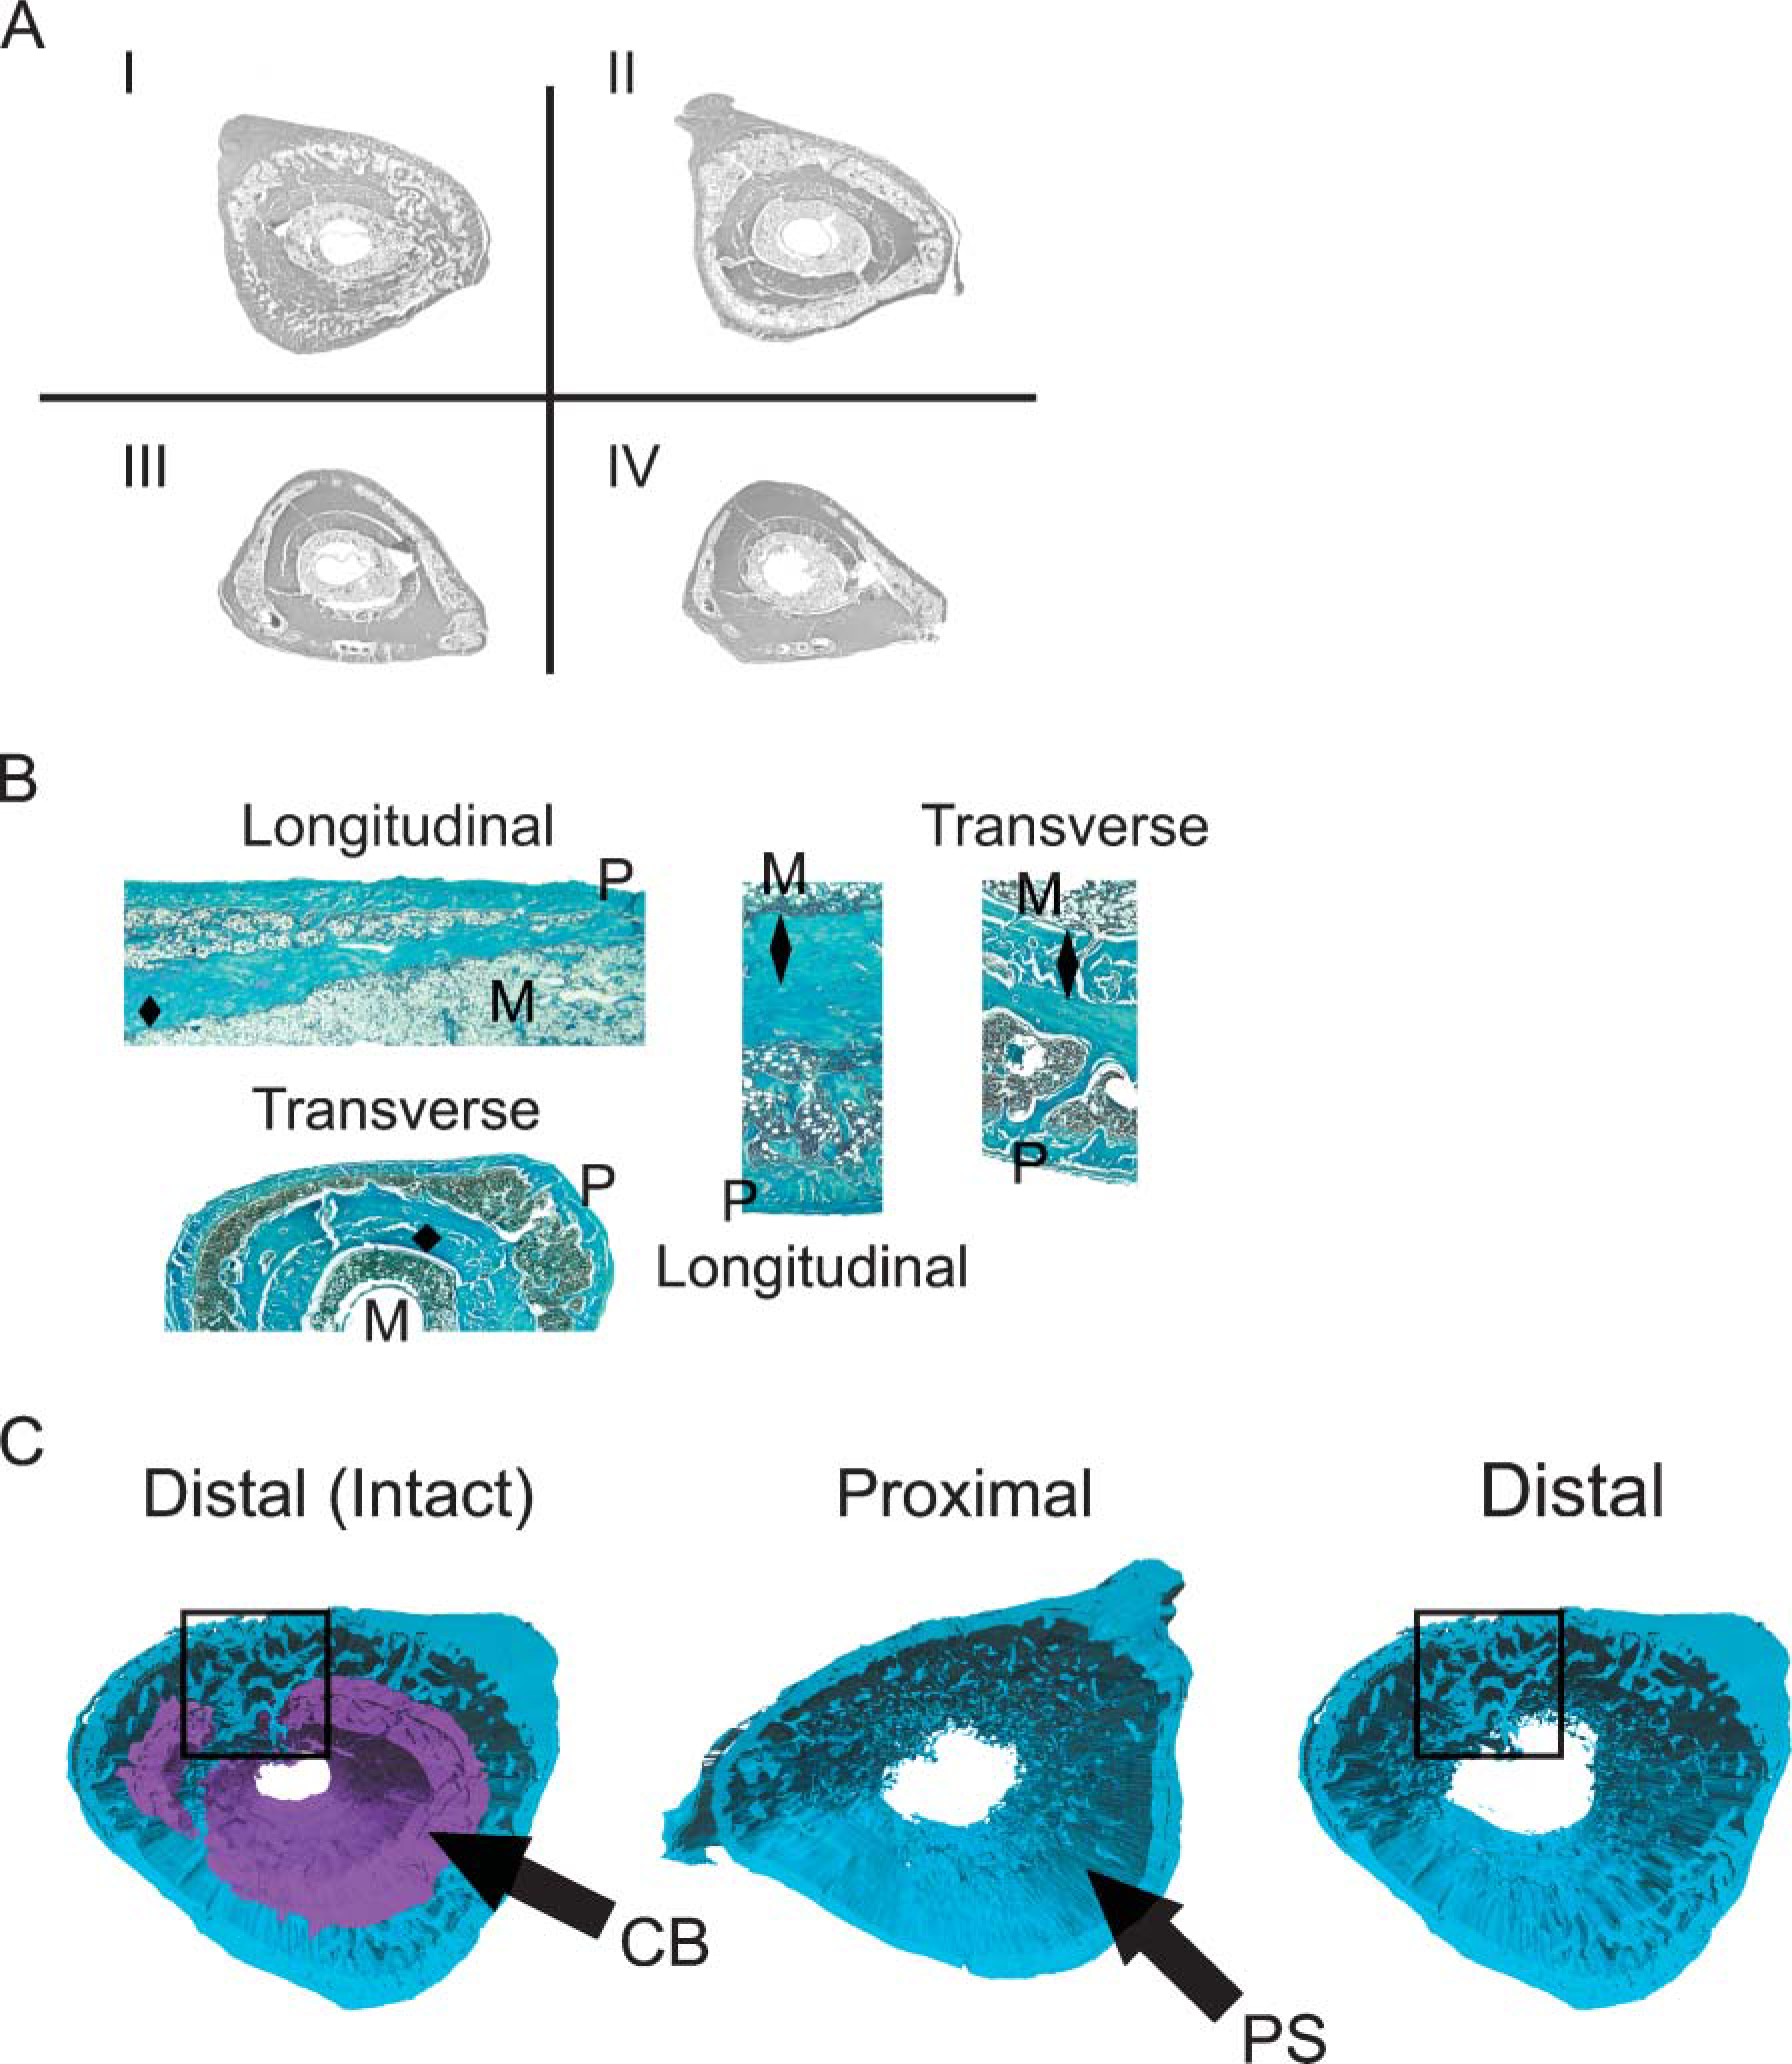
The following approach was used for embedding and sectioning because special care must be taken to keep track of exact positions within the tissue from which sections are obtained to accurately reconstruct the tissue. For femur or tibia, respectively, the bones were trimmed before embedding the fracture callus, such that either the distal or proximal joints are left in place as proximal/distal anatomic references. After dehydration in graded concentrations of ethanol to 100%, specimens were transferred to xylene and embedded in a stepwise manner under vacuum in 50% xylene paraffin, then 100% paraffin. At the time of embedding the rat bones, callus tissues were cut transversely with a sharp scalpel at two points 5-mm proximal and 5-mm distal to the center of the fracture callus. Another cut was then made at the center as determined from the X-ray assessments, thereby creating two half-callus specimens. The two halves of the rat callus were positioned in a single block of low-melt paraffin with the fracture facing the cutting surface. Mouse calluses were embedded intact with the distal end (femur) and proximal end (tibia) facing the cutting surface. A counting microtome was used such that the total linear distance that has been sectioned through a block can be monitored. At each 100-μm segment, 20 5-μm-thick paraffin sections were cut and placed on poly-L-lysine-coated slides, dried overnight, and either used immediately or stored at 4C. A schematic of the segmentation scheme that was used for obtaining uniformly spaced serial sections is seen in Figure 1.
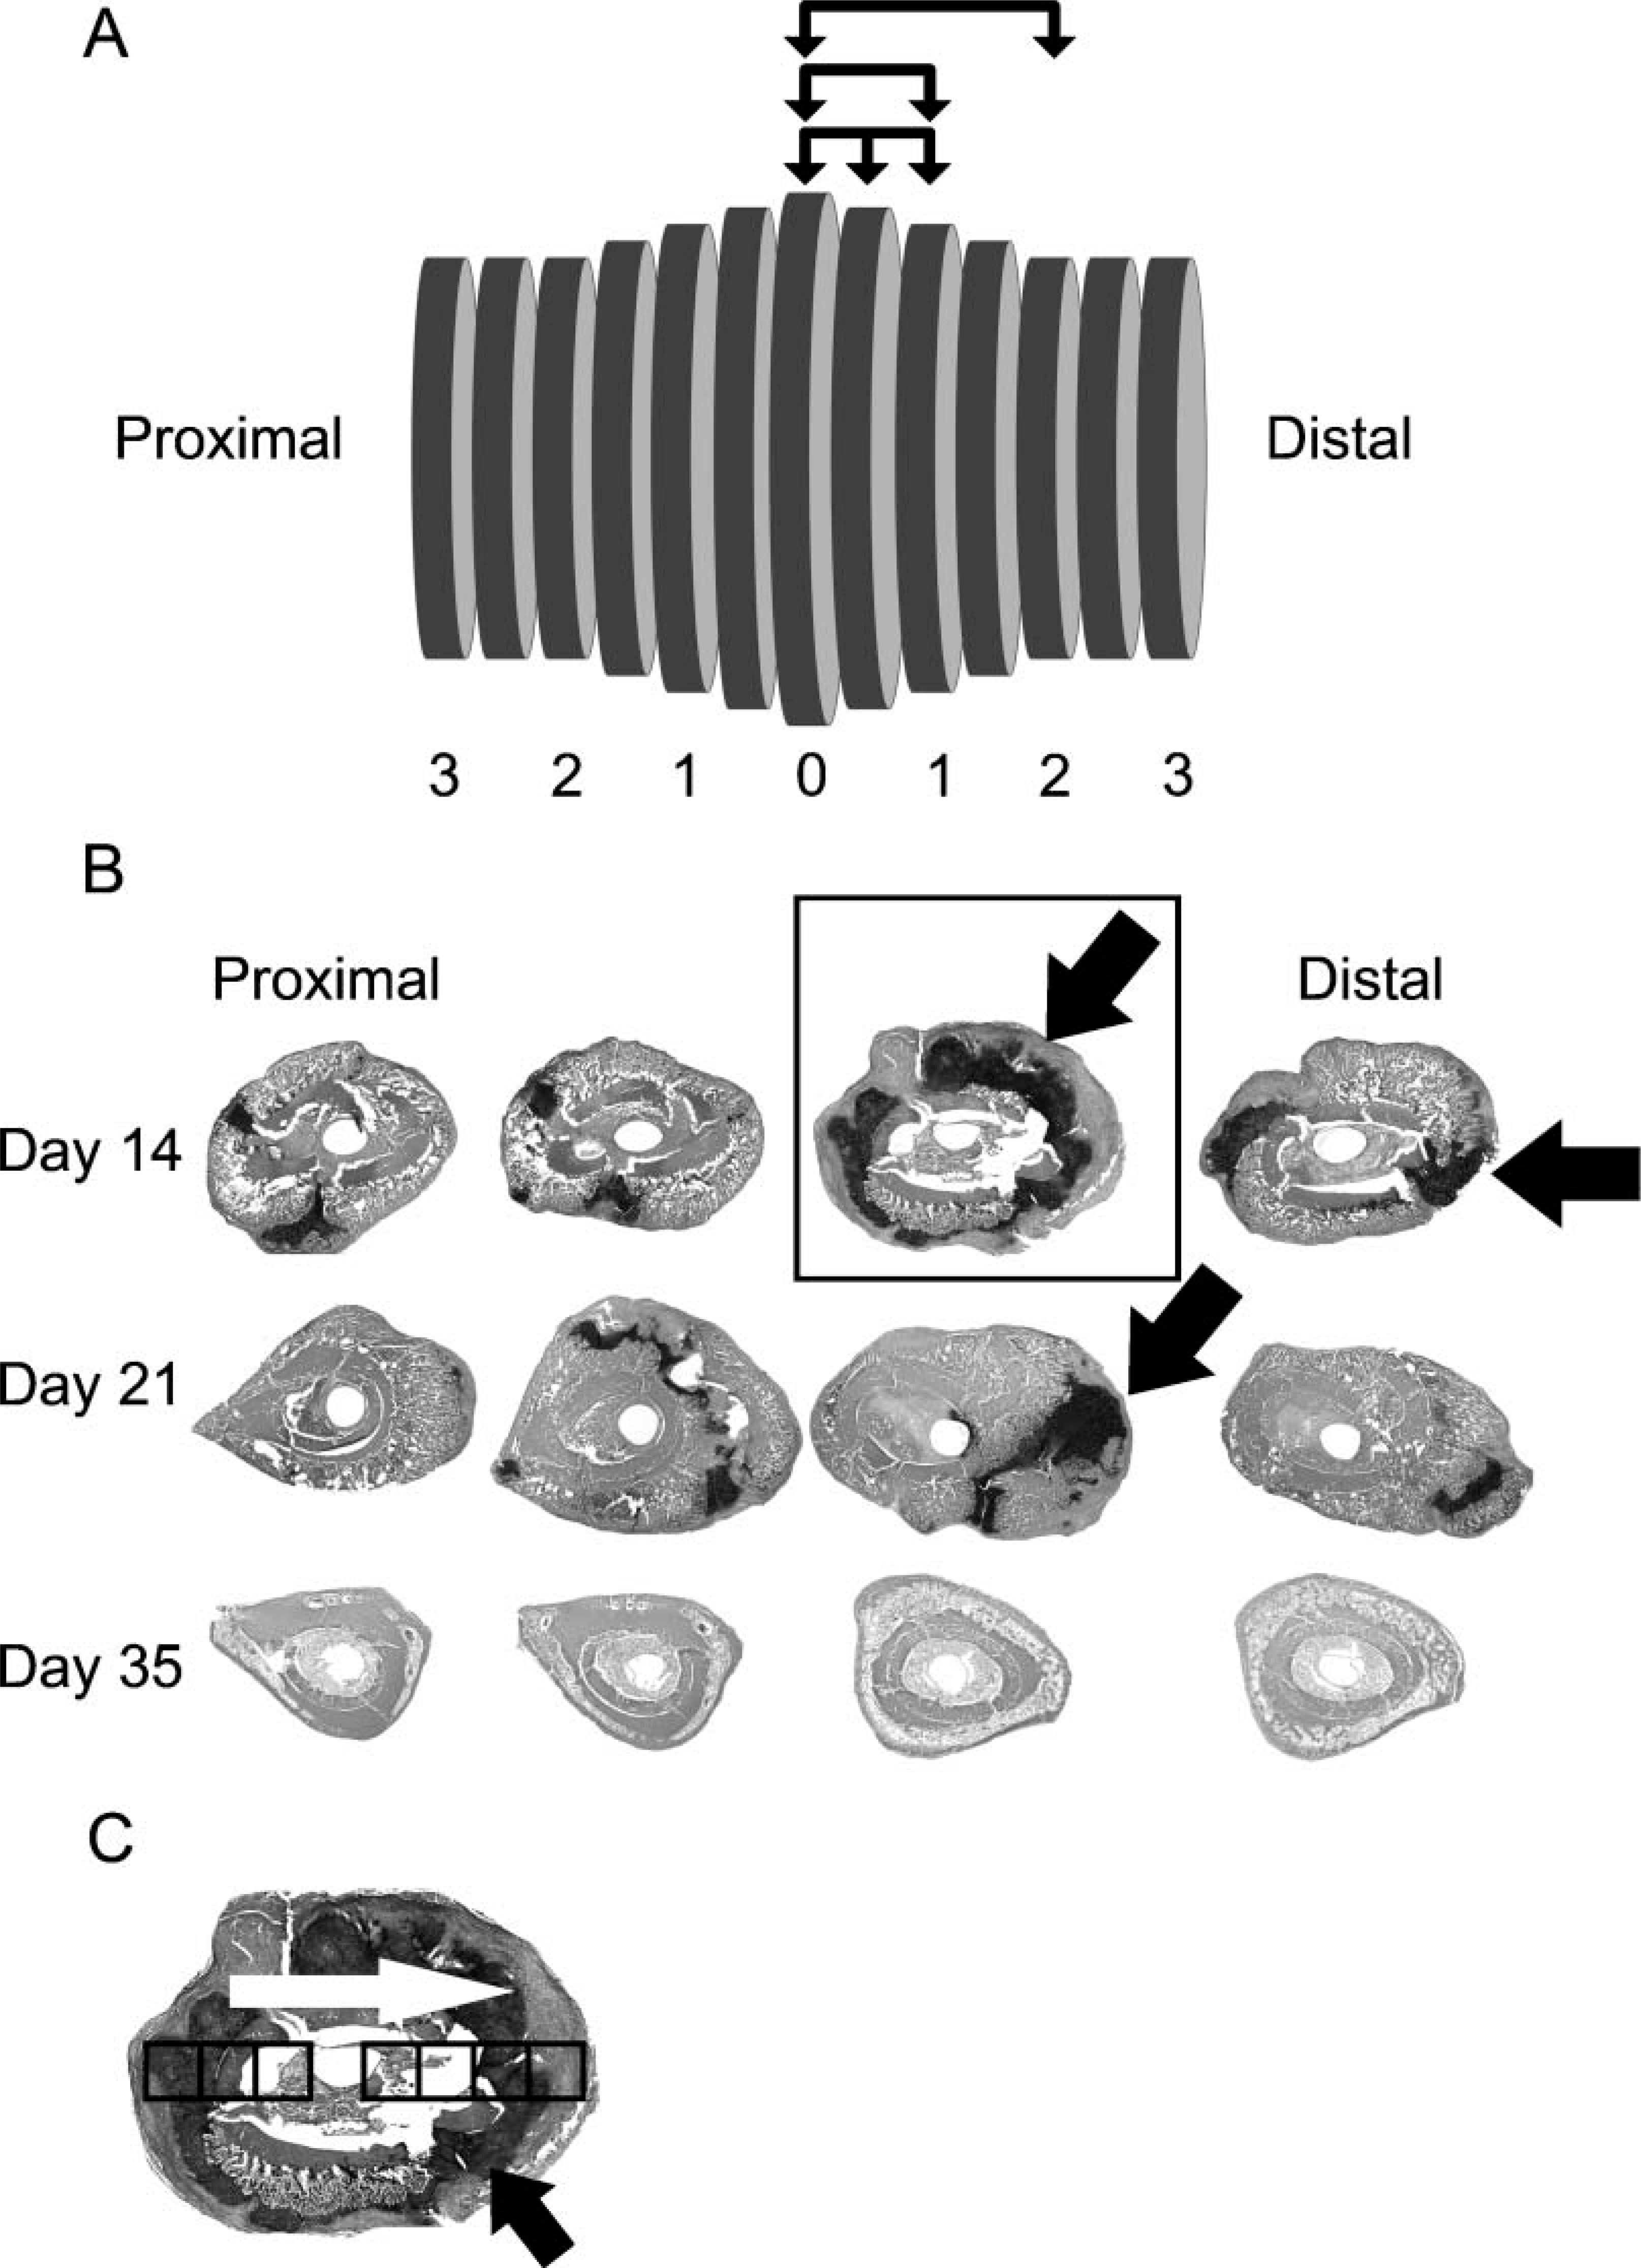
Diagram of the approach used for histological sampling of a fracture callus. (
Staining Methods and Image Collection
Sections were stained with Safranin O/fast green as previously described (Armed Forces Institute of Pathology Laboratory 1992) to discriminate mature cartilage from bone and non-cartilage connective tissues (Gerstenfeld et al. 2003a). Tartrate-resistant acid phosphatase (TRAP), a marker for osteoclasts, was detected using an azo-dye coupling method with fast red violet LB salt (F-3381; Sigma, St Louis, MO), replacing the fast red TR salt. Each section was photographed with an Olympus BX51 light microscope (Olympus; Tokyo, Japan) attached to a digital camera at X10.25 and downloaded into an Image-Pro Plus for Windows program (Media Cybernetics, Inc.; Silver Spring, MD). Using a color-match program, the total area of cartilage (red) and bone (green) was initially identified using a filter range of 573.9 μm-5.74e + 03 μm. Afterwards, colored-matched areas defining specific tissues were individually assessed, and final areas were hand traced. Mean values for various tissue types were calculated for specimens sampled from each bone and then used to create group means, standard deviations, and standard errors both with respect to time after fracture and animal group. Microscopic images for TRAP-stained sections were captured as described above, and micrographs were taken using the X20 objective and downloaded onto an Image-Pro Plus Version 4.1.0.0 for Windows program. Using a color-match program, osteoclasts from each photograph were quantified using a spot filter and a predefined pixel value that defined the lower and upper dimensions for the spots counted.
Histomorphometric Parameters and Sampling Scheme
Examined histomorphometric indices were as previously described (Gerstenfeld et al. 2005). In this study, cartilage areas (Cg/Ar), void areas (V/Ar) (inclusive of empty space and hematopoietic elements), total osseous tissue (TOT/Ar) (inclusive of the original cortical bone that was present prior to the fracture new cortical bone, trabecular bone, and lining cells), and osteoclast density (Oc/Ar) were examined. Abbreviations, nomenclature, and unit measurements are in accordance with the currently used standards for histomorphometry of intact bone and previously defined (Eriksen 1986; Parfitt et al. 1987; Gerstenfeld et al. 2005). Three rat or five mouse bones were used for each time point used for histomorphometric analysis. Each rat callus was divided into ~60 segments spaced 100-μm apart with half the segments taken proximal and the other half distal to the fracture, whereas each mouse callus was divided into 14 segments spaced 250-μm apart, again which were equally distributed with seven on the proximal side and seven on the distal side of the fracture. Segments were enumerated as the distance from the anatomic center of the callus as defined by the fracture and are denoted in distances proximal or distal from the center. Each segment contained a group of 20 serial 5-μm sections. One section from each segment was then analyzed by various staining methods or by ISH. In this manner, the entire length of each callus was used for multiple types of quantitative measurements or for molecular assessments. In the case of the comparison between tibiae and femora, comparisons were made at the center and at 1000-μm proximal and distal to the center. Representative low-magnification sections taken from 1000-μm increments across a rat femur callus and stained for cartilage are seen in Figure 1B.
For TRAP-stained multinucleated cells, multiple micrographs were collected from contiguous microscopic fields across a single section, such that when overlapped with each other they completely spanned the transverse width of the callus (Figure 1C). Mean values of TRAP-positive cells per callus group were calculated from measurements taken from seven segments (see below) spaced at 1000-μm increments across the total longitudinal distance of each callus (n=37-49 micrographs per callus). The numbers from the multiple images per segment were combined, and specimen means were calculated to create group means, standard deviations, and standard errors.
Statistical Methods
The following approach was used to assess statistical variability and to determine the best method for sampling histological measurements from sections found within the various segments across a callus. First mean values for individual measurements for cartilage, total osseous tissues, void areas, and osteoclast numbers were obtained from sections from every segment across the calluses (~60 sections for rat and ~14 sections for mouse). These means were then used to define a reference value for each of the measurements. A 95% confidence interval (CI) was calculated around each reference value and was then used to define the minimal number and spacing of the segments from which sections should be sampled per callus to accurately predict each of the histomorphometric parameters. A schematic representation of how the minimal number of segments and their spacing from which sections should be sampled is presented diagrammatically in Figure 1. For example, in one type of approach that was assessed, sections were sampled within every segment, then every second, every third, etc. starting with the central segment and going in the proximal and distal directions. Progression of the increments in sampling between segments is denoted by the positions of the arrows in the overlined segments in the figure. Mean values for each of the primary anatomic measurements were then computed for the various groupings of segments and compared with the 95% CI for the respective reference values of each of the measurements. From these statistical analyses, it was determined that taking sections from segments that are not greater than 500-μm apart and using a uniform spacing along the longitudinal axis of the callus accurately predicts measurements within the 95% CI of the references for tissue composition measurements of the whole callus. When assessing values between individual segments or when osteoclasts counts were obtained, 1000-μm increments can be used. In a different sampling approach, progressively larger numbers of segments were sampled from the fracture. Thus, the first two, four, six, etc. segments around the fracture were sampled. In this approach, no fewer than eight segments on each side of the fracture (total of 16 sections) were needed to accurately predict tissue compositions. All measurements presented here were therefore obtained from the former method of sampling in which sections were taken from 500-μm-spaced segments.
ISH
Five-μm-thick sections were placed on poly-L-lysine or 15% Bond-fast glue (Manco; Avon, OH)-coated slides, dried overnight, and used immediately or stored at 4C. Both antisense and sense control, 35S-labeled, cRNA probes were used for hybridization. Linear cDNA sequences were incubated with either T7 or SP6 RNA polymerase in the presence of 35S-UTP (New England Nuclear; Boston, MA), unlabeled nucleotides, 10 mM DTT, and Rnasin RNase inhibitor (Promega; Madison, WI). Labeled cRNA probes were purified using mini Quick Spin RNA columns (Roche Diagnostics; Indianapolis, IN).
Prehybridization
Slides were deparaffinized in xylenes followed by rehydration in graded ethanol solutions, rinsed in 0.85% NaC1 (5 min) and 1X PBS (5 min), and treated with proteinase K (20 μg/ml) for 8 min at 37C. Slides were dipped successively in 1X PBS (5 min), 4% paraformaldehyde (5 min), acetylated in 0.25% acetic anhydride in 100 mM triethanolamine (10 min), washed in 1X PBS (5 min), 0.85% NaC1 (5 min), dehydrated in graded ethanol solutions, and air dried.
Hybridization
Hybridization solution contains 50% deionized formamide, 0.3 M NaCl, 20 mM Tris-HC1 (pH 7.5), = mM Na2EDTA (pH 8.0), 10% dextran sulfate, 1X Denhardt's solution, 0.5 mg/ml total yeast RNA, and 100 mM DTT. 35S-labeled cRNA probes were heated at 80C for 2 min and placed on ice. Hybridization solution containing 35S-labeled probe at 5 × 10⁴ cpm/μl was added to each slide in a 50- to 60-μl volume, a plastic HybriSlip (Research Products International; Mt. Prospect, IL) was placed on each slide, and the slides were incubated at 52C for 16 hr. After hybridization, slides were washed in 5X SSC for 30 min at 50C, 2X SSC with 50% deionized formamide for 20 min at 65C, and rinsed twice in 10X STE, 10 min each, at 37C. Slides were then treated with a 20 μg/ml solution of RNase A (Pharmacia Biotech; Piscat-away, NJ) for 30 min at 37C, washed in 2X and 0.1X SSC for 5 min each, dehydrated in graded ethanol, and air dried.
Autoradiography
Air-dried slides were dipped in Kodak NTB-2 emulsion (Eastman Kodak; Rochester, NY), drained, air dried for 1 hr, and placed in a light-proof container with desiccant at 4C for 2-3 weeks. Slides were developed in Kodak D-19 developer, fixed in Kodak fixer, and counterstained with Safranin-O/fast green.
3D Reconstructions
3D reconstructions were performed using the Amira 3.0 software system for 3D visualization data analysis and 3D geometric reconstruction (Visual Concepts GmbH, Konrad-Zuse-Zentrum (ZIB) Research Institute; Berlin, Germany). All image modifications were performed in Adobe Photoshop Software (San Jose, CA). To use the color recognition operations employed during the 3D reconstruction process, soft tissue areas surrounding the exteriors of the calluses were digitally removed from individual images by hand tracing tissue perimeters in the Photoshop program and cutting these areas from the images. Amira 3.0 3D reconstruction software is unable to recognize multi-channel images acquired initially, but subsequent grayscale outputs yield enough contrast to differentiate the tissues of interest. To maximize the color contrast differentials within a grayscale image, the color differentials were first digitally extracted to optimize staining contrasts. Because areas of mature cartilage tissue stained bright red with Safranin O/fast green, areas were hand traced and the green channel was first extracted from the primary RGB image, thereby enabling the cartilage to be easily contrasted as black areas in separate grayscale images. This high degree of contrast in the green channel makes this staining property ideal for accurate measurements using image-thresholding techniques. For cortical bone measurements and image discriminations these areas were outlined in each slice using a manual segmentation tool. Once individual images were modified, they were imported into Amira software program and the slices manually aligned using edge-to-edge matching of the edges from the surgical pinhole in the marrow cavity using Amira's slice alignment editor. The slice aligner permits user visualization of two consecutive slices at a time, each exhibiting opposite contrast. This yields a 50% gray image representing two perfectly matched, overlapping images. The editor allows for both slices to be aligned with the previous or the next slice, as well as the ability to manipulate the entire stack of slices to center the field of view within a bounding box.
To visualize 3D surfaces, different tissues were labeled or ‘segmented’ using the segmentation editor in the software program. Individual sets of labels were created for cartilage, cortical bone, the callus as a whole, and for the space between the trabeculae. The segmentation editor allows for both manual and automated segmentation. For most tissues it was possible to use the automated segmentation to label slices using thresholding. Thresholding provides a simple and fast method of labeling without false positive results. False positives were easily identified by comparing the labeled images with the originals. The non-resampled stack of slices is used for this, and the labels are later resampled to maximize accuracy.
3D spatial distribution of collagen type I- and II-expressing cells in the healing fracture calluses were visualized using ISH. To simplify reconstructions of the collagen I and II ISH, a color select was performed for these markers in Adobe Photoshop 5.5 using darkfield images. As with the color staining, this pre-optimization of the images was used to enhance the color differentials in the grayscale images. A binary image is produced through thresholding, thereby simplifying the segmentation process. Separate stacks of slices for collagen I and II ISH images were inserted into the existent stacks generated from the three renderings of the light images, paying careful attention to the spatial coordinates to ensure proper overlap.
Volumes were obtained from each reconstructed surface using an automated volume measurement function in Amira. Scale was determined by comparing the known width of each image with the measurement determined by Amira for the width of the bounding box. A stage micrometer was used to determine the actual width of each image in Image-Pro Plus. The scale was thus determined as being 100 μm = 1.32 Amira Units; hence, 1 Amira Unit3 = 0.000 435 mm3.
Results
Quantitative Analysis of the Spatial Morphogenesis of Skeletal Tissue Development
Temporal progression of skeletal tissue morphogenesis during healing of rat femur fracture calluses from 14 to 35 days was assessed by comparing the mean percent composition of cartilage and total osseous tissues averaged across sections taken from segments collected across the entire length of the callus (Figure 2A). These measurements give an overall index of the type of developmental mechanisms of bone formation (endochondral vs intramembraneous) that are being used to form new bone tissues. Peak period of chondrogenesis based on these percentages was seen at 14 days, at which time ~15% of the total tissues was cartilage. Thereafter, this tissue diminishes to ~2.0% by day 35. This decrease largely reflects the cartilage resorption as the chondrocytes undergo hypertrophic development and apoptosis. Although it has generally been assumed that cartilage makes up a very high percentage of the tissue content of a fracture callus, the cartilagenous component comprised only ~10-15% of the total tissue content of femur callus tissues at 14 days postfracture, which is when the callus reaches peak size. In contrast, the amount of osseous tissue represents 75% of the total tissue composition of the callus and increases overall to ~83% as the callus remodels. Whereas initially at day 14 most of the bone tissue in the callus is from the original cortices, at later times almost all of the osseous tissues are derived from the primary bone formation from the endochondral processes or secondary bone formed as the original cortical tissues are remodeled.
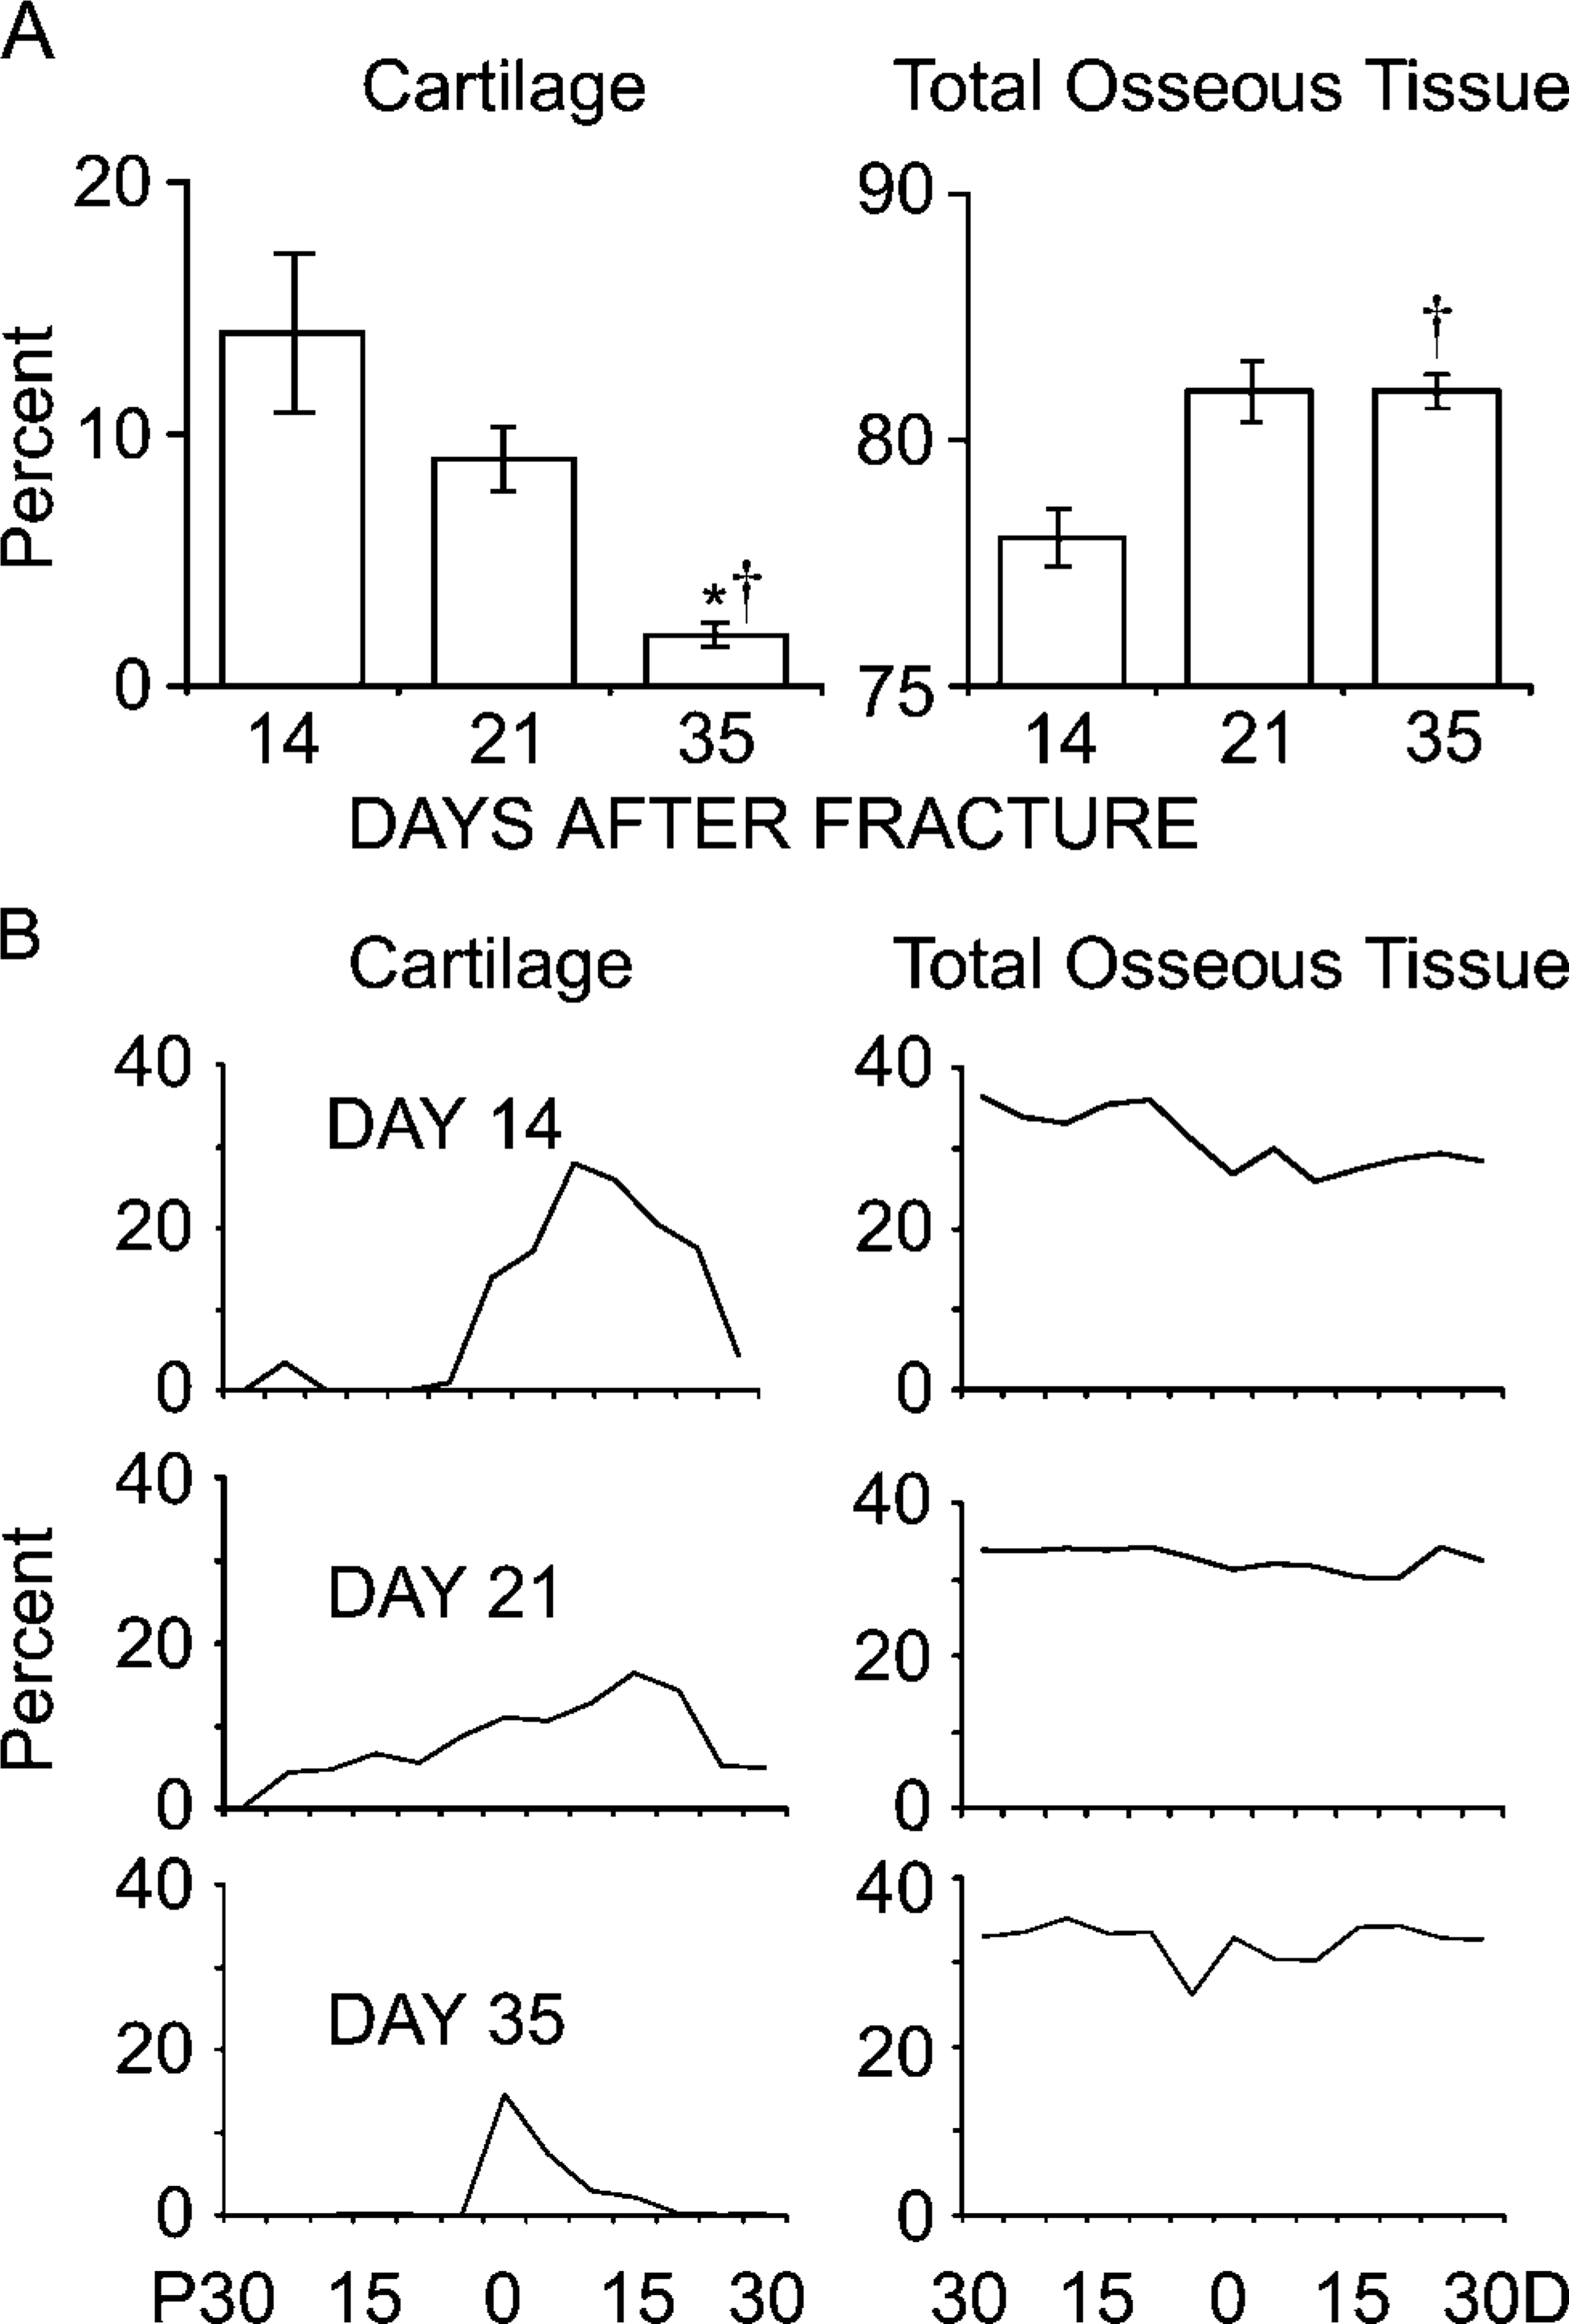
Comparisons of the histomorphometric measurements of skeletal tissue formation of rat femur calluses 14, 21, and 35 days postfracture. (
Whereas data in Figure 2A are the mean tissue compositions within the entire callus, proximal to distal distribution of the various tissues within the callus is depicted in Figure 2B. The most striking aspect of these data was that the formation of cartilage tissues takes place in an asymmetrical manner in the femur with more cartilage formed on the distal than on the proximal sides relative to the fracture. Comparison of the measurements between the spatial distribution of cartilage tissue formation to that of where osseous tissues are formed at later time points demonstrates that the spatial asymmetry of the initial endochondral distribution directs both the spatial pattern of new bone formation and the subsequent patterns of tissue remodeling and secondary bone formation (Figure 3-5).
Progression of resorption and remodeling of both cartilage tissue and primary bone tissue can be assessed by measurements of void space including the bone marrow cavity, hematopoietic elements, and empty, unstained space that forms as callus morphogenesis progresses (Figure 3A). In this context, measurement of void areas provides a retrospective spatial picture of where remodeling already occurred. Initially, void areas were observed at the sites most proximal and distal to the fracture. However, as healing proceeded, areas of remodeling progressed inward and were seen flanking the regions adjacent to the fracture at the center of the callus where areas of cartilage still persisted. This is seen in particular by the larger void areas that flank the areas that remain as cartilage (compare bottom panel Figure 2B to the bottom panels of Figure 3A). Data shown in Figure 3B also show that the total area taken up by the marrow elements remains fairly constant at days 14 and 21 suggesting that, in this period, bone and cartilage formation are balanced against resorption. At later times the mineralized cartilage and original cortical bone tissues are remodeled, and the void space increases as these areas become primarily trabecular bone.
The spatial pattern of tissue remodeling was further examined by assessing osteoclast density (OC/Ar) throughout the callus using TRAP staining for multinucleated cells (Figure 3C). Detailed data from 21- and 35-day calluses are presented because very few TRAP cells were seen at 14 days. Comparison between the spatial distributions of osteoclasts/chondroclasts to the areas of the voids provides a retrospective picture of the spatial pattern of mineralized cartilage resorption. Thus, areas containing the highest density of osteoclasts are situated toward both the proximal and distal edges of the callus with a high density in the areas where mineralized cartilage is undergoing resorption. As these areas are remodeled, they will be replaced with void areas and trabecular bone. From a quantitative perspective there is almost a 5:1 ratio in the total density of osteoclasts/chondroclasts during the active periods of cartilage remodeling at day 21 than during primary and secondary bone remodeling that predominates at day 35. By 35 days, osteoclast distribution throughout the callus is relatively uniform except at the most proximal edges.
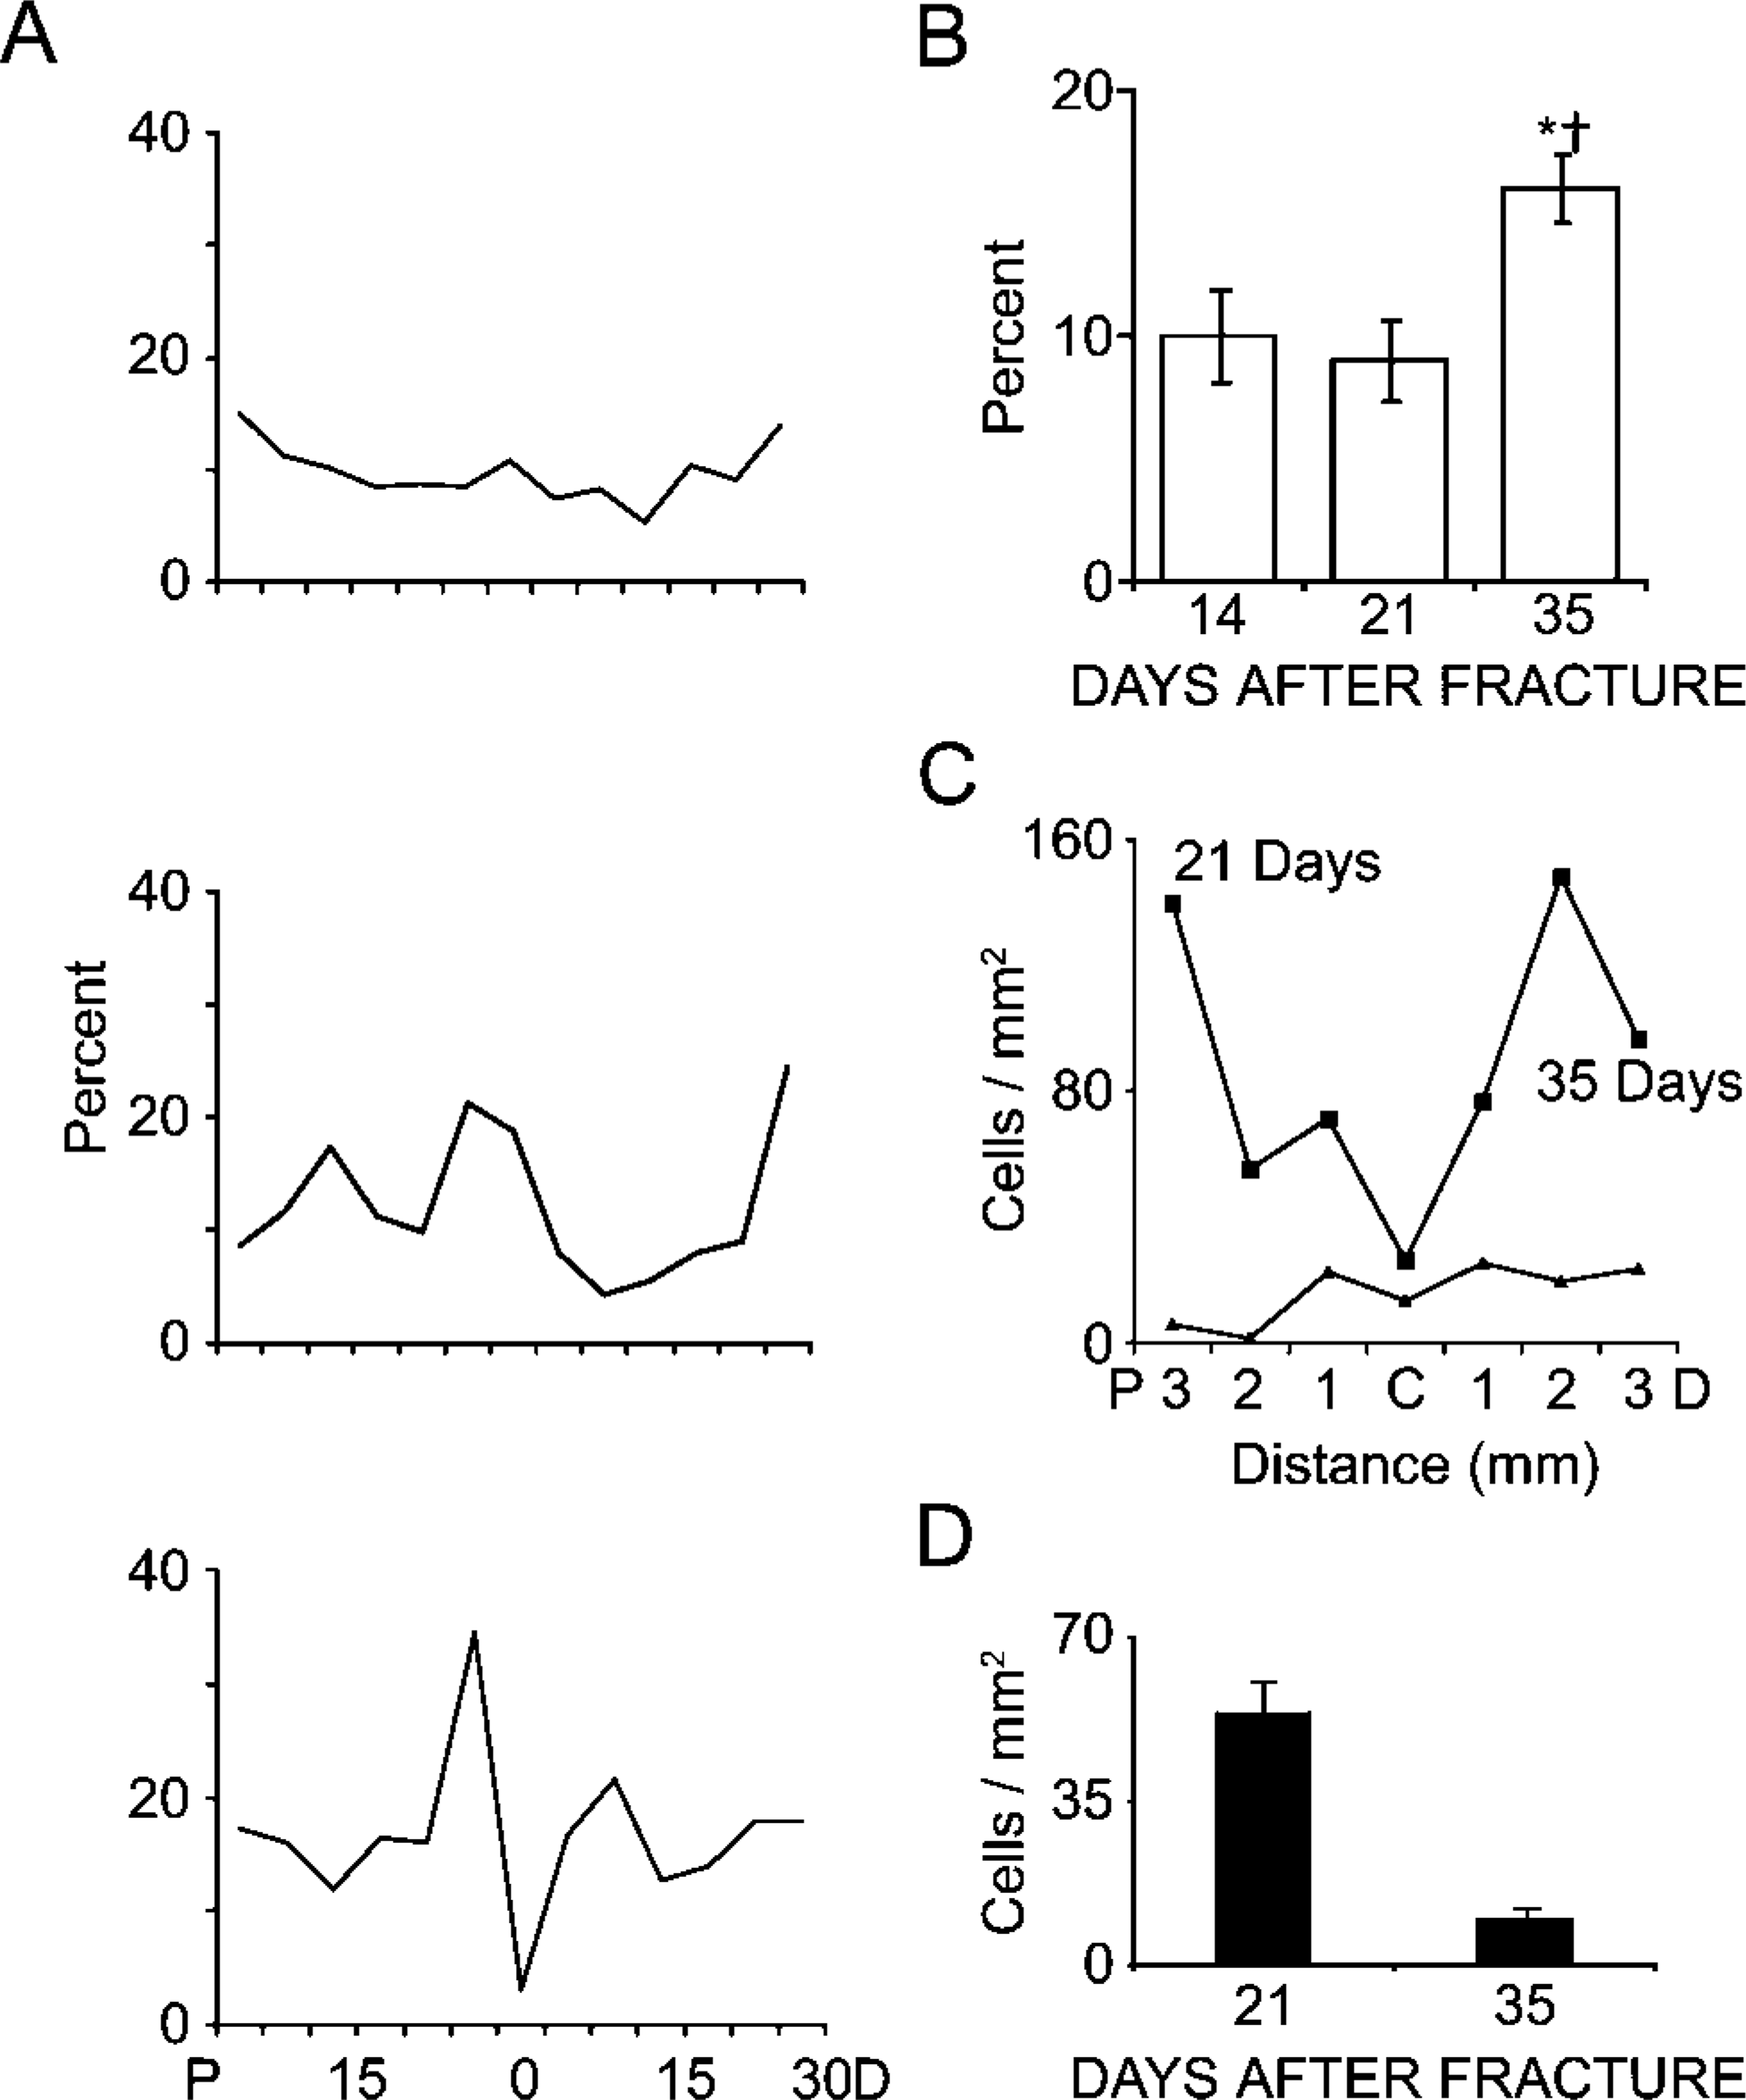
Comparisons of histomorphometric measurements of skeletal tissue remodeling for rat femur calluses at 14, 21, and 35 days postfracture. (
3D Reconstruction of Callus Morphogenesis
3D reconstructions of rat fracture calluses were generated from histological sections taken of 14-day rat femur calluses at ~100-μm increments (all 60 sections) spanning ~6 mm (Figure 4A). Four representative slices, two from the proximal and two from the distal halves of the fracture callus, are presented in Figure 4B. 3D renderings of these data validate the two-dimensional compositional assessments and illustrate the asymmetrical manner in which the majority of the cartilage within the callus formed distal to the fracture. The comparison of how closely the two-dimensional compositional analysis matches those that are extrapolated from the volumes of the 3D renderings is presented in Table 1. As can be seen from this comparison, both sets of data present almost identical determinations of the tissue compositions of the callus.
A second reconstruction of a different 14-day callus is seen in Figure 4C. However, this rendering was stretched so that a 1.5:1.0 aspect ratio is presented to depict the asymmetry of the tissue in a more exaggerated manner. Two separate anatomic perspectives viewing the tissue from either the medial or lateral surfaces again show asymmetry in cartilage development in the proximal and distal orientations but extend the analysis into the medial/lateral, posterior/anterior dimensions as well. It is interesting to note that these analyses show that the cartilaginous component of the callus follows the spatial pattern of the fracture. This later result would suggest then that the signals initiating the repair either arise from the marrow or are released from the injured bone matrix around the fracture and that the spatial morphogenesis of endochondral bone formation is regulated in part by the spatial pattern of the fracture itself. The asymmetrical proximal to distal configuration of the endochondral bone formation within the callus continues to be observed throughout the rest of the bone-healing period as seen in the 3D renderings of the callus at 21 days, with very little cartilage now remaining on the proximal side of the fracture (Figure 4D).
The spatial morphogenesis of the primary trabecular bone that arises in conjunction with the resorption of the mineralized cartilage tissues is seen in the reconstruction of a 35-day postfracture callus (Figure 5). One of the most striking features of these reconstructions was that the spatial geometry of primary trabecular bone that forms reflects that of the original central space of the callus that was occupied by cartilage. At these later times the cartilage was replaced with trabeculated bone tissue and marrow surrounded by an outer and inner shell of new bone (Figure 5A). This unique tissue structure is exemplified by the set of higher magnifications in Figure 5A, presenting both longitudinal and transverse views of this fracture callus. This outer cortical shell is formed as new bone grows over the cartilage and becomes the new periosteal margin adjacent to the muscle. The inner shell is formed by a new surface of bone that has developed on top of the original cortex and is part of the original periosteal response (Figure 5A). In the longitudinal view the edge of the callus is seen where the original bone bifurcates into these two surfaces of bone. It is also interesting to note that, as this new inner shell of bone grows over the old cortical bone, the original cortical bone undergoes extensive remodeling (Figure 5A).
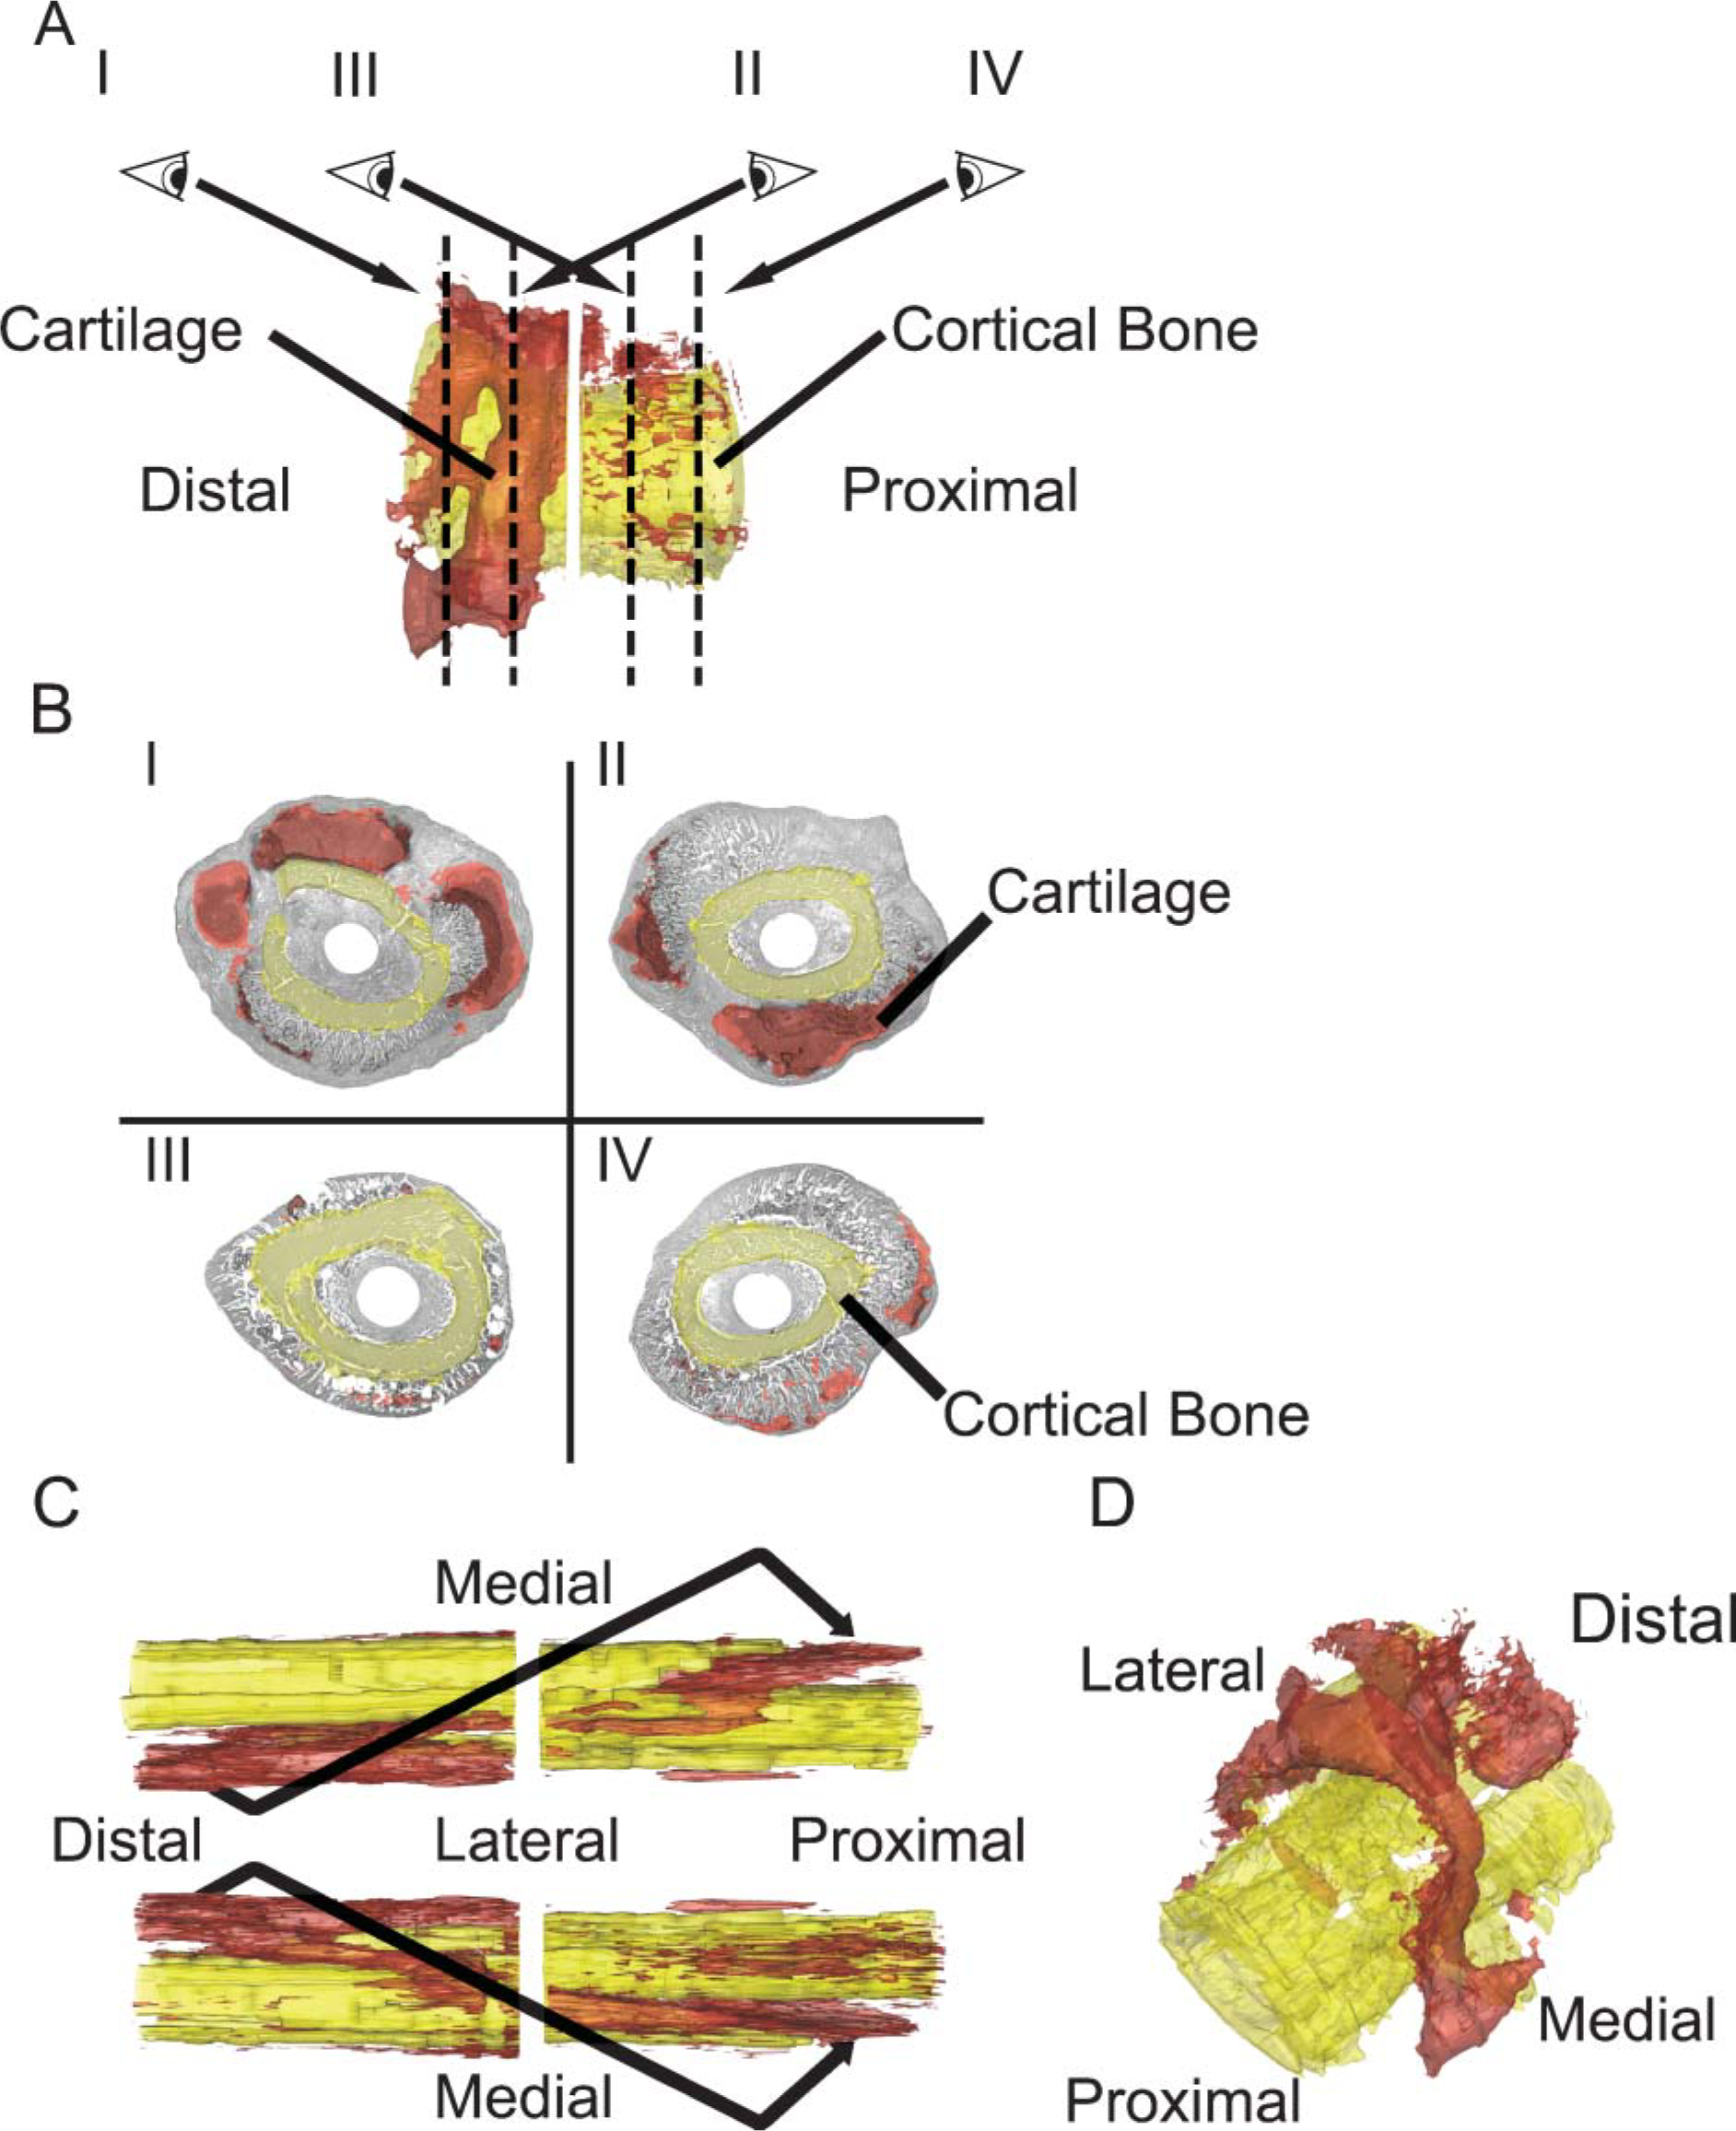
Reconstruction of a rat femoral fracture callus 14 days postfracture. Three-dimensional (3D) reconstructions were made from serial sections taken every 100 μm. (
Reconstructions of rat fracture calluses at 35 days. (
Comparison of two- and three-dimensional compositional analyses
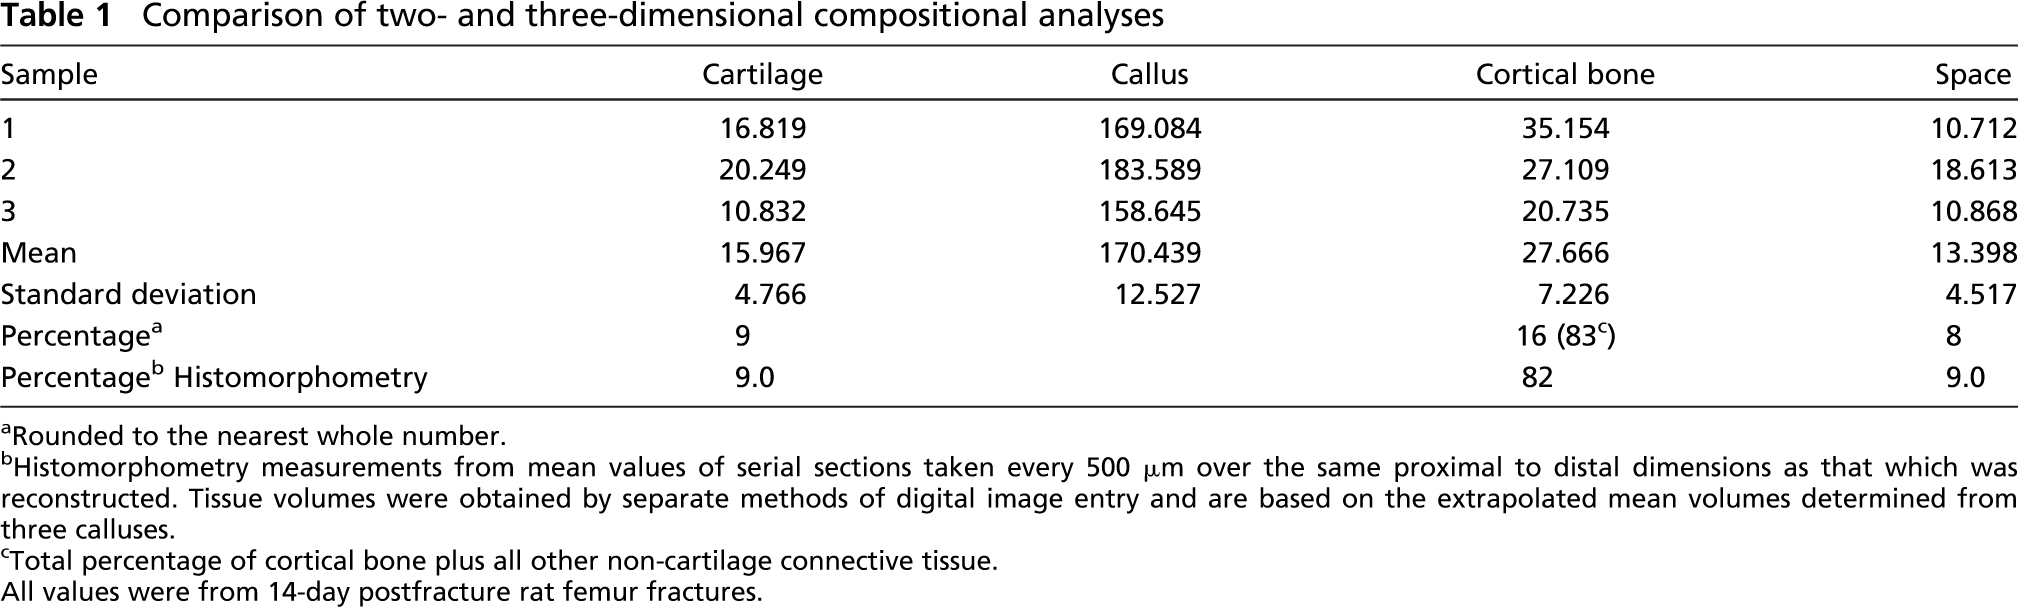
Rounded to the nearest whole number.
Histomorphometry measurements from mean values of serial sections taken every 500 μm over the same proximal to distal dimensions as that which was reconstructed. Tissue volumes were obtained by separate methods of digital image entry and are based on the extrapolated mean volumes determined from three calluses.
Total percentage of cortical bone plus all other non-cartilage connective tissue. All values were from 14-day postfracture rat femur fractures.
3D renderings of the reconstructions of a rat femur callus at 35 days postfracture are seen in Figures 5B and 5C. Four sections from representative segments are presented in Figure 5B, whereas reconstructions are seen in Figure 5C. The reconstructions demonstrate that, as remodeling progresses, the original cortical tissue that lies under the new bone surface undergoes resorption. The interface between the old and new bone also is the site where the new blood vessels grow. Eventually, as both the original cortices and the new layer of bone are completely remodeled they are replaced with a continuous volume of trabeculated bone underlying the new cortical shell (Figure 5C). The proximal to distal asymmetry of the bone formation continues to be obvious during this phase of callus morphogenesis as seen in the cross-sectional views. Thus, there is a very small amount of trabeculated bone bridging the inner and outer shells of cortical bone in the proximal view but an extensive network of trabeculated bone when viewed from the distal orientation.
3D Reconstruction of the Spatial Pattern of Collagen mRNA Expression
Using ISH, the spatial pattern of collagen type I and II gene expression was 3D reconstructed as a means of identifying the spatial patterns of biological activity of specific populations of cells in the callus tissue. For these studies, murine femur fractures were generated. Both light- and darkfield images show the fidelity of ISH for the col1a1 and col2a1 mRNAs (Figures 6A and 6B). The intense and very specific localization of the two probes with respect to either bone lining cells on the nascent trabecular surfaces or at the interface with chondrocytes adjacent to these surfaces is shown.
In Figures 6C-6F the murine femur fracture callus was reconstructed using sections taken from segments spaced at ~250-μm increments spanning ~3 mm of the callus. These panels depict the reconstruction of the cortical bone (pseudocolored in yellow) in relation to cartilage (pseudocolored in red) (Figure 6C) and the expression of col1A1 (pseudocolored blue) and col2a1 (pseudocolored purple) in these tissues (Figures 6E and 6F). An end-on image is shown to provide confirmation of the alignment of serial reconstructions based on the position of the medullary pin (Figure 6D). Mouse femoral fracture callus showed the distal-lateral asymmetrical distribution of cartilage similar to that observed for the rat femur. As expected, areas of col2a1 expression were spatially aligned with the cartilage. Expression of col2a1 was confined to the central areas around the fracture but not the areas of callus more peripheral to the fracture. In contrast, col1a1 expression was uniformly seen on either side of the fracture and was distinctly excluded from the regions over the fracture. The col1a1 expression was spatially adjacent to all of the areas where cartilage was observed and col1a1 was expressed in a mirror-like fashion on opposite surfaces from cartilage.
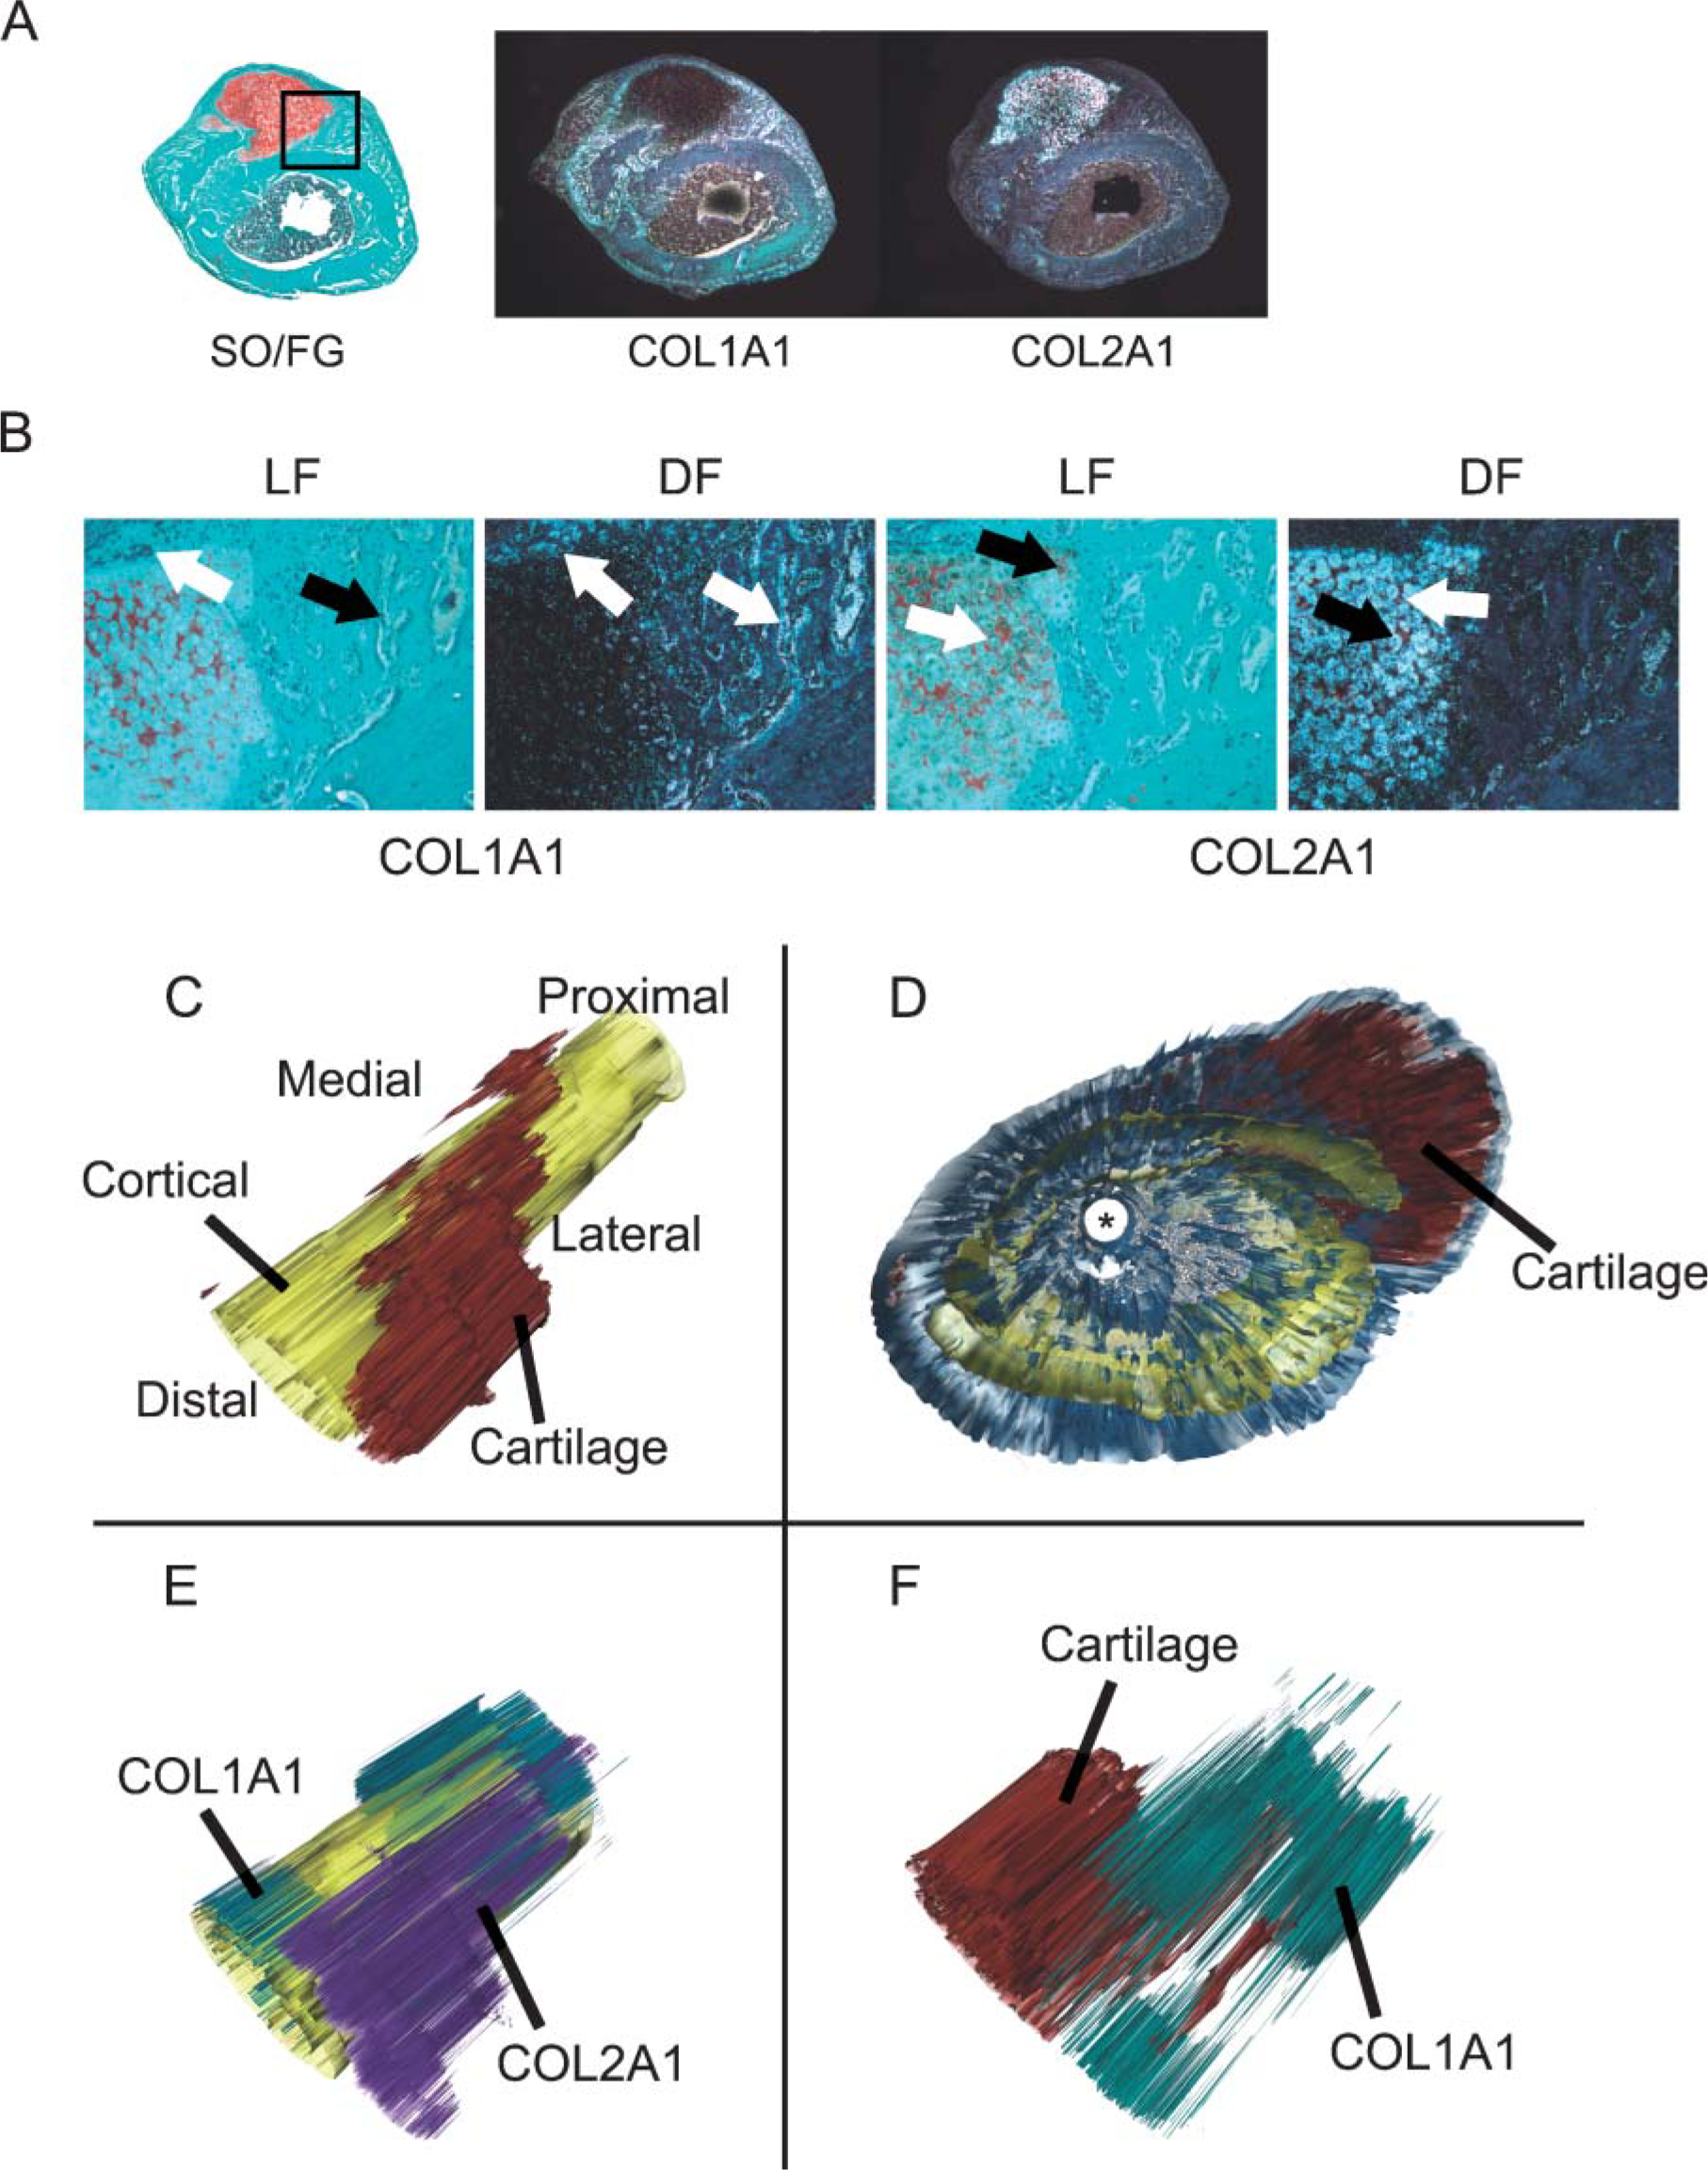
3D reconstruction of mouse femur fractures and collagen types I and II gene expression. (
The final aspect of these studies examined whether individual long bones would show similar proximal to distal asymmetrical patterns of endochondral bone formation or if such patterning was unique to a given long bone. In this study, callus tissue compositions were compared in murine femur fractures to those of the tibia (Figure 7). Fractures were made and fixed in an identical manner and assessed at roughly the same period after fracture. As can be seen in Figure 7, tibia factures showed an inverse picture of tissue distribution vs that of the femur with the majority of the endochondral bone formation (cartilage) seen in proximal and central segments of the callus relative to the fracture. Conversely, the pattern of osseous tissue formation showed the opposite spatial asymmetry demonstrating that the tibia followed the same spatial mechanisms of bone healing but just in an inverted and longitudinal morphogenetic pattern to that of the femur.
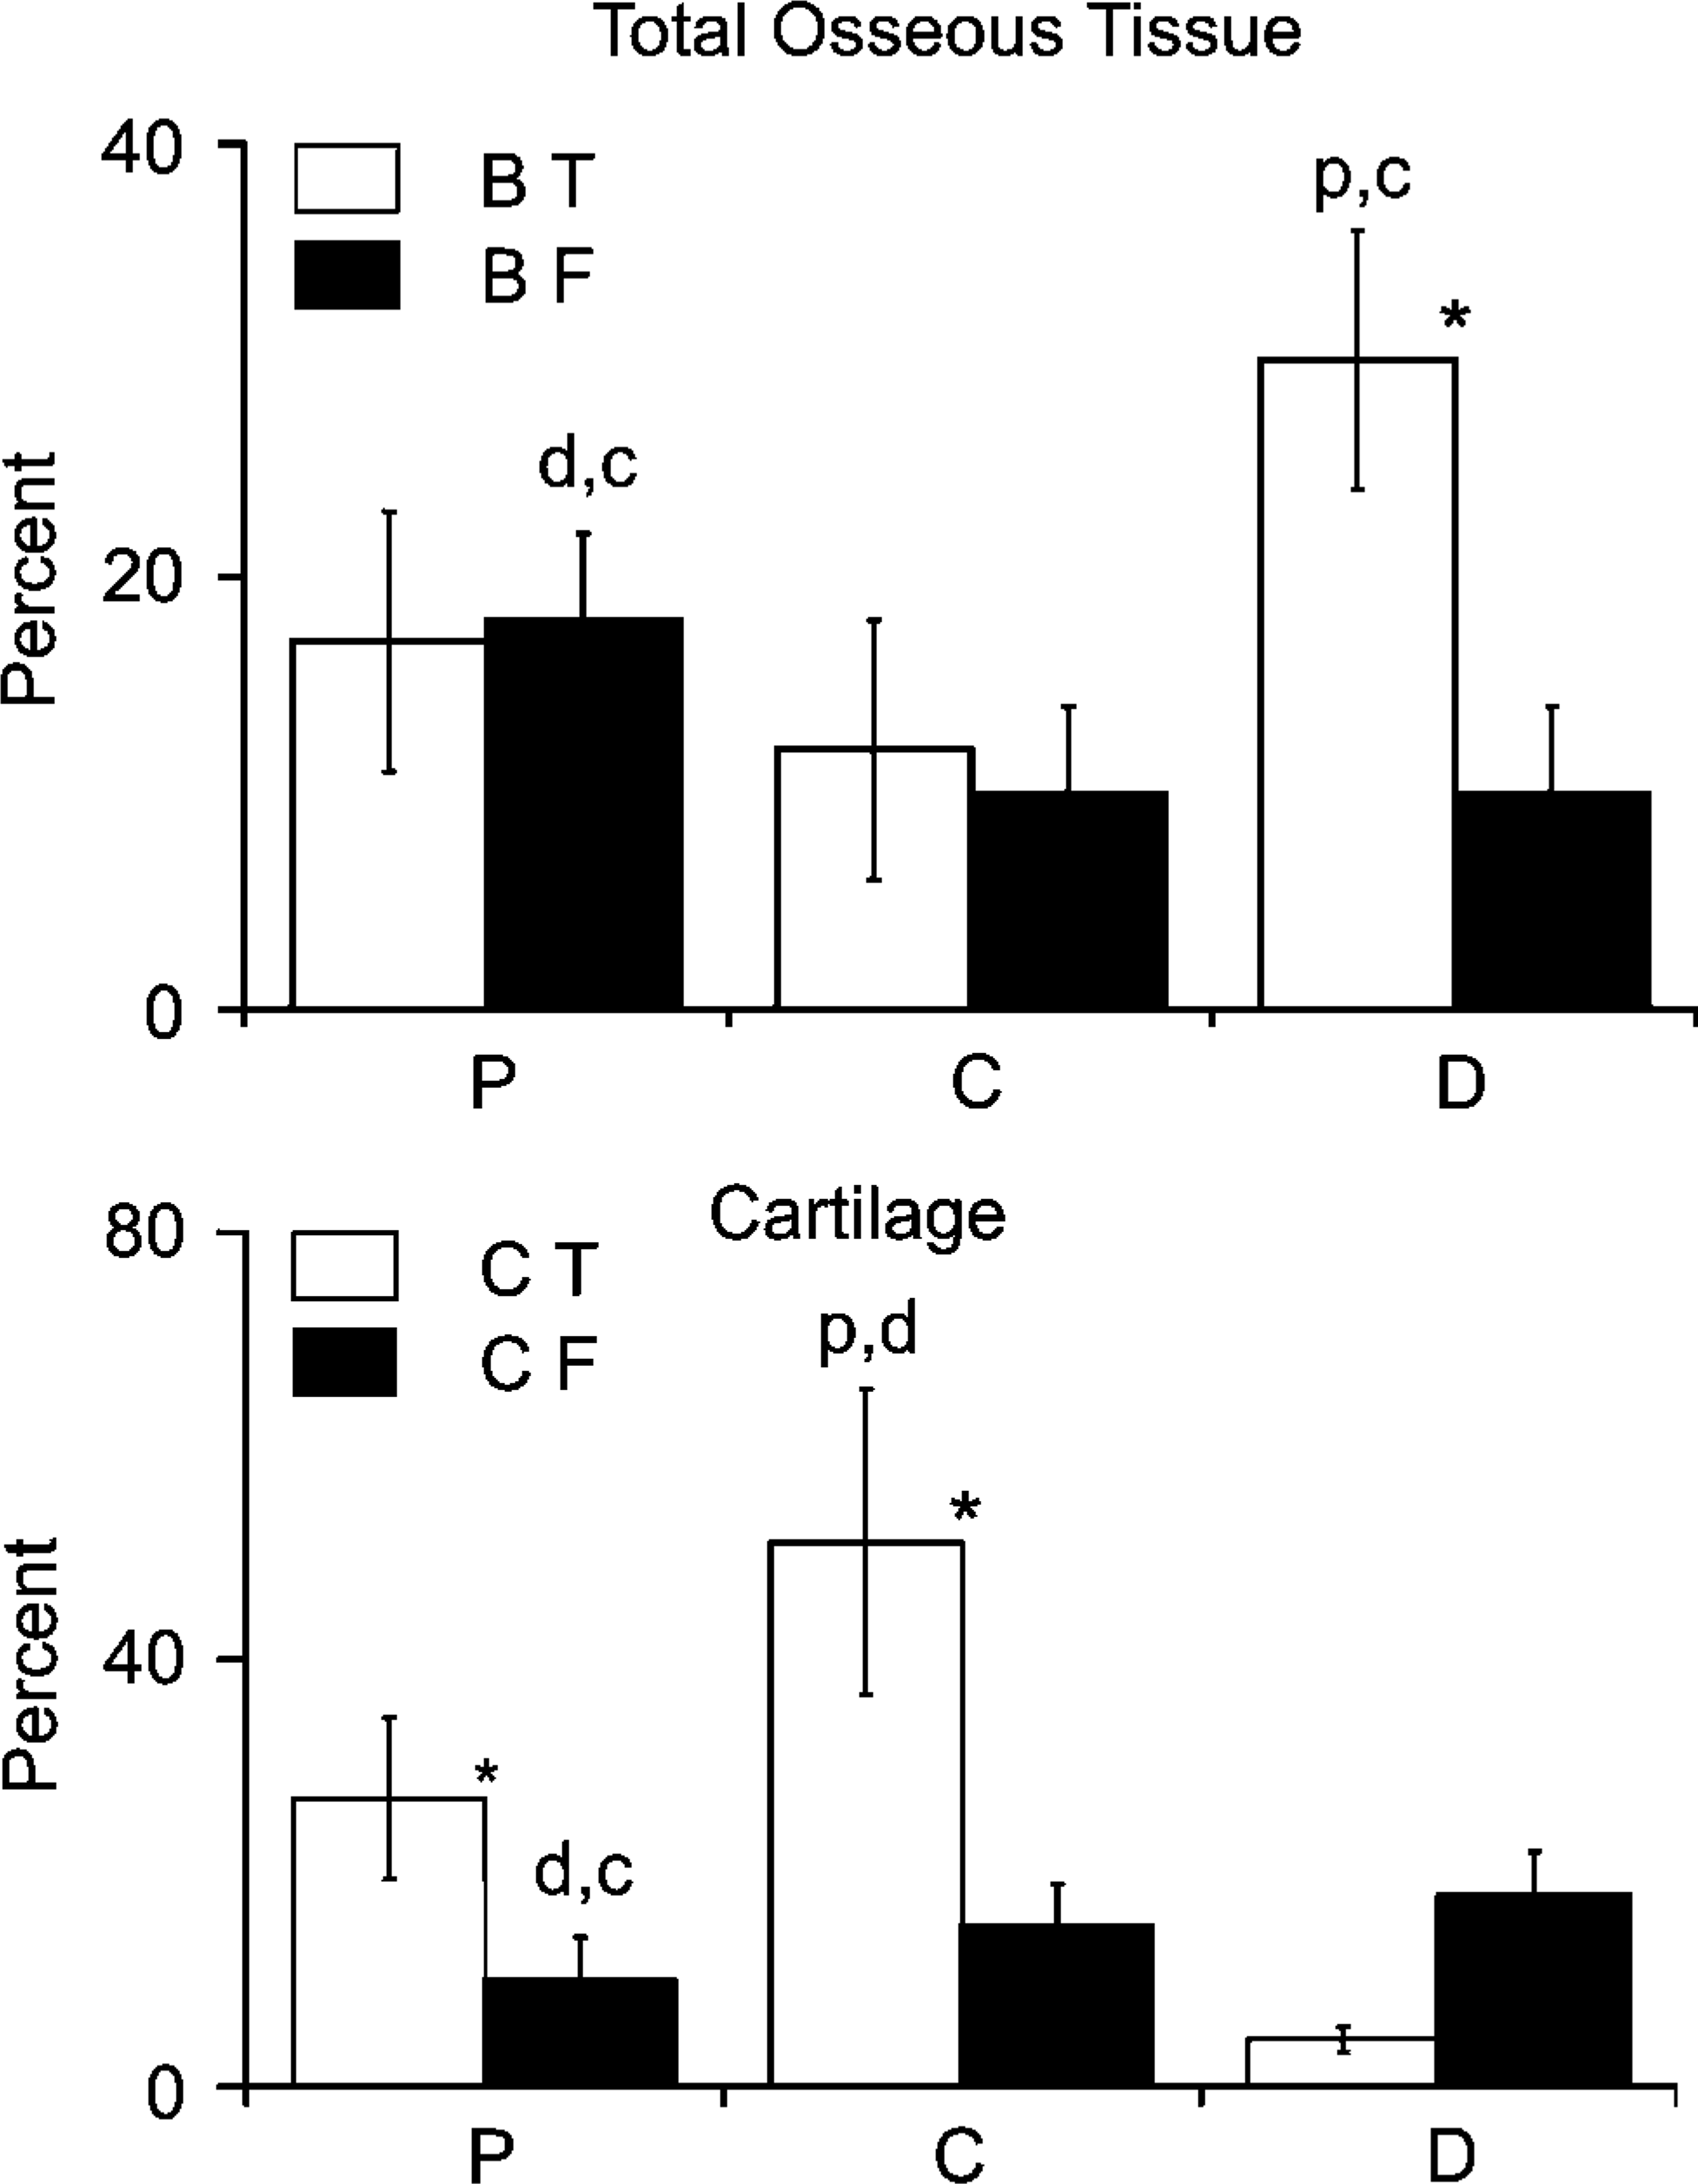
Comparative analysis of the tissue compositions in femur vs tibia calluses. (Upper panel) Percentage compositions of bone tissues in the external portion of the callus. BT, bone in the tibia; BF, bone in the femur. (Lower panel) Percentage compositions of cartilage tissues in the external portion of the callus. CT, bone in the tibia; CF, bone in the femur. Error bars denote 1 SD. P, compositions at 1000 μm proximal from fracture. D, compositions at 1000 μm distal from fracture. C, compositions at center at site of the fracture. All values were n=5 mice. ∗ p<0.05. Intergroup (tibia to femur) comparison between matched segments. Position of letters above a bar refers to the intragroup variation in composition. (d,c) p<0.05 between distal and center to proximal, (p,c) between proximal center to distal, and (p,d) p<0.05 between proximal and distal to center.
Discussion
Although it is generally accepted that endochondral bone formation during fracture healing recapitulates many of the molecular events that control embryological and postnatal growth (Ferguson et al. 1999; Einhorn and Lee 2001; Gerstenfeld et al. 2003b), the well-defined linear spatial arrangements that define tissue morphogenesis during bone growth are not as easily discernable within a fracture callus. The question then arises of how the events of spatial morphogenesis intrinsic to long-bone development either remerge during fracture healing or are different from bone growth.
Most histological assessments of fracture callus formation have used longitudinal sections (sagittal or coronal) that have lead to a simplistic view of callus morphogenesis as a uniform ring of cartilage that initially forms around the fracture (Edwards et al. 2003). However, many long bones are ellipsoid or have flattened surfaces, and these configurations affect the spatial parameters of morphogenesis. Indeed, in the course of our attempts to perform histomorphometric analyses of fracture healing, we observed that measurements of cartilage and bone composition, as well as measurements of callus sectional area, varied tremendously among longitudinal sections (Gerstenfeld et al. 2005). To circumventthese problems, a segmental, transverse sampling method was used in the experiments reported in this study.
The most striking finding of our studies was the unique spatial patterning of endochondral bone formation seen during fracture healing. Spatial patterning in the callus tissue formation suggests that there is a much greater complexity among biological and biomechanical factors that initiate and regulate the endochondral processes than previously understood. One may speculate that this inherent structural complexity is reflected in the much greater number of uniquely expressed mRNAs in the fracture callus compared with unfractured bone, as determined by large-scale transcriptional profiling (Wang et al. 2006). This variability may also be the cause of the greater statistical variation in the biomechanical properties of endochondral fracture callus at early time points after fracture than at later times (Einhorn et al. 2003; Gerstenfeld et al. 2003a; Alkhiary et al. 2005). The most likely explanation for this variation in the mechanical properties of fracture calluses is related to the anisotropy produced by spatial irregularities in the formation of callus tissues. Finally, it may be speculated that the complexity of the endochondral process makes the transition through this phase of bone healing an extremely sensitive index of the progression of normal healing. Indeed, delays or failures to progress through the chondrogenic stages of fracture healing have been associated with the development of delayed and non-unions in both clinical studies (Ekholm et al. 1995) and investigations in animals (Simon et al. 2002; Zhang et al. 2002; Gerstenfeld et al. 2003c).
Two of the most interesting findings from the present studies are the reproducible asymmetrical pattern by which cartilage develops during callus formation and the spatial mechanisms by which the callus is remodeled back to its prefracture size. In the case of the spatial pattern of cartilage tissue development, our analyses demonstrated that the majority of the cartilage formed in both femur and tibia fracture calluses in a longitudinally asymmetrical pattern unique to the given long bone. In the femur, endochondral bone formation was predominantly distal to the fracture, whereas in the tibia it was proximal to the fracture. The asymmetrical pattern of development also appeared to be conserved across species in both mice and rats because femur fracture calluses developed in the same asymmetrical manner. As to the role of intrinsic vs extrinsic factors controlling the unique pattern of tissue formation in the callus, it is important to note that femurs of several mammalian species appear to grow predominantly from the distal physis (Pritchett 1992; Kuhn et al. 1996; Farnum et al. 2003), whereas the tibia grows preferentially from its proximal physis (Kuhn et al. 1996). These data suggest that the proximal to distal distribution of cartilage formation in fracture calluses may be an intrinsic feature of the way skeletal organ originally formed and subsequently grows and extends this to how fracture calluses repair after injury. In future studies it will be necessary to examine how other bone-specific intrinsic features such as blood supply, soft tissue, or muscular coverage (Richman et al. 2001; Utvag et al. 2003) as well as extrinsic mechanisms such as mechanical demand are related to tissue healing. Indeed, one of the most important extrinsic factors is the biomechanical environment, which has been shown both through theoretical considerations (Carter et al. 1988,1991) and empirical experimentation to be crucial to cartilage development (Le et al. 2001; Claes et al. 2002; Cullinane et al. 2002,2003; Smith-Adaline et al. 2004). The second aspect to discuss regarding these data is the spatial pattern by which woven bone is first formed and then remodeled to its original cortical dimensions. It is, therefore, interesting to note that the initial asymmetry in tissue formation subsequently affected the spatial patterns of cartilage resorption and primary trabecular bone formation. Chondrocyte maturation and subsequent resorption was initiated from the edges most distant from the fracture and progressed inward with regions flanking the proximal femur fracture undergoing resorption first followed by those areas distal to the fracture. Once the cartilage component of the callus has been resorbed, there are two new surfaces of bone: an inner surface that has grown over the original cortex and an outer thinner layer that has encapsulated the callus and forms the new interface with the periosteum. Thus, a trabecular structure is seen bridging these surfaces in the space that was occupied by cartilage. Because the outer shell is located far from the geometric center of the bone, it will be responsible for the majority of weight bearing (van der Meulen et al. 2001). This outer shell is connected to the original cortex via trabecular-like struts that provide sufficient support in order to stabilize the fracture. This represents an efficient mechanism, using minimal material, to rapidly restore biomechanical stiffness and strength and allows for remodeling on internal surfaces. A similar pattern of morphological expansion has been observed during the early phase of rapidly growing animals such as inbred mice (Price et al. 2005). In this context it is interesting to note that vertebrae bodies use an identical structure to carry loads with a thin cortical shell supported on an extensive inner trabecular network of bone.
The final aspect of the secondary tissue remodeling worth mentioning is that the basic structural mechanism used to remodel the callus is inverted from those of transverse bone growth. Unlike long-bone expansion where there is a balance between periosteal appositional growth and bone resorption at the endosteal surface, remodeling of fracture callus uses different and unique spatial mechanisms to model and must, by some mechanism, remodel from the outer surface inward, balancing external removal with the addition of bone on internal surfaces. This aspect of fracture healing is perhaps the most structurally complicated, and the ability to construct a simple model to explain how this takes place is very challenging. As noted from these results, more bone forms distal to the fracture site during femoral healing and proximal to the fracture site in the tibia. Further investigations will be required to better understand the complex interplay of each of these processes.
Footnotes
Acknowledgements
This work was supported by Grants AR-047045 (to LCG) and AR-0409920 (to TAE) from the National Institute of Arthritis and Musculoskeletal and Skin Diseases, National Institutes of Health, Bethesda, MD, and Department of Defense Grant DAMD17-03-1-0576 (to LCG). Institutional support was provided by the Department of Orthopaedic Surgery, Boston University School of Medicine, Boston, MA.