
Abstract
Intracellular recording and dye filling are widely used to correlate the morphology of a neuron with its physiology. With laser scanning confocal microscopy, the complex shapes of labeled neurons in three dimensions can be reconstructed rapidly, but this requires fluorescent dyes. These dyes are neither permanent nor electron dense and therefore do not allow investigation by electron microscopy. Here we report a technique that quickly and easily converts a fluorescent label into a more stable and electron-dense stain. With this technique, a neuron is filled with Neurobiotin or biocytin, reacted with fluorophore-conjugated avidin, and imaged by confocal microscopy. To permit long-term storage or EM study, the fluorescent label is then converted to a stable electron-dense material by a single-step conversion using a commercially available ABC kit. We find that the method, which apparently relies on recognition of avidin's excess biotin binding sites by the biotin–peroxidase conjugate, is both faster and less labor intensive than photo-oxidation procedures in common use. The technique is readily adaptable to immunocytochemistry with biotinylated probes, as we demonstrate using anti-serotonin as an example.
Keywords
T
Laser scanning confocal microscopy (confocal microscopy) is particularly useful in neuroanatomy because its high Z-axis resolution of preregistered images enables rapid 3-D reconstruction of labeled neurons (Deitch et al. 1990a,1991; Turner et al. 1991; Sun et al. 1993,1995,1996; Tolbert et al. 1996). Moreover, digital 3-D image stacks of labeled neurons offer unprecedented possibilities for visualizing and measuring neurons in three dimensions using various image-processing techniques (Chen et al. 1995). Offsetting these advantages, confocal microscopy is normally restricted to fluorescent signals, which pose problems such as bleaching and fading, although it is possible to convert fluorescent dyes into an electrondense form for EM by photo-oxidation (Maranto 1982). However, this technique is tedious, because preparations must be processed section by section, and hazardous, because it exposes the fluorescence microscopist to a potentially dangerous chromogen, 3,3′diaminobenzidine (DAB). Another method combining confocal microscopy and fluorescence with immunogold for EM has been reported (Sun et al. 1995; Tolbert et al. 1996). The poor penetration of immunogold markers, however, limits that method to sections less than 80 μm in thickness.
Various dyes are available for intracellular staining and back-filling of neurons. Among these, horseradish peroxidase (HRP) (Muller and McMahan 1976), Lucifer Yellow (Stewart 1981), biocytin (Horikawa and Armstrong 1988), and Neurobiotin (Kita and Armstrong 1991) are widely used. Because of its high molecular weight, HRP is difficult to inject and diffuses slowly. Lucifer Yellow has good recording stability and high quantum efficiency, but it leaks easily from the cell and confers high resistance on the electrode (Tasker et al. 1991). In contrast, several studies demonstrate the superiority of Neurobiotin and biocytin over other dyes. These two biotin-derived substances yield low-resistance electrodes, are easy to inject, have low toxicity to the recorded cell (Tasker et al. 1991), and remain within the cell for extended periods without leaking (Kita and Armstrong 1991). Consequently, they can often be used to combine intracellular filling with immunocytochemistry, e.g., to characterize the putative transmitter of the filled neuron. These dyes also mass-fill neurons by anterograde- (King et al. 1989) or back-filling (Sun et al. 1993), in the same way as can HRP, but with much shorter diffusion times. The high affinity and specificity of the biotin–avidin reaction makes the biotin labeling method extremely sensitive, and the signal can be histochemically amplified in various ways. Moreover, the avidin that detects either biotin dye can be conjugated to different markers (different fluorophores for LM, HRP or gold particles for LM and EM), so that the staining is highly flexible.
The present technique uses Neurobiotin or biocytin as label. It easily converts a fluorescently labeled neuron into a more permanent form to allow its visualization by both confocal microscopy and EM. Moreover, it can be combined with electrophysiological studies of the same neuron. Using biotinylated probes, the method can also be extended to locate various products within cells by means of biotinylated antibodies or DNA/RNA probes. For example, serotonin is a widespread neuromodulator in insects (Kloppenburg and Hildebrand 1995; Mercer et al. 1995,1996; Pyza and Meinertzhagen 1996), and antibodies to serotonin stain extensive arborizations in the insect brain (Näs-sel 1987) that provide a test case for the method.
Part of this work has previously been reported in abstract form (Sun et al. 1996).
Materials and Methods
Animals
The moth Manduca sexta (Lepidoptera, Sphingidae) and the housefly Musca domestica (Diptera, Muscidae) were used for these experiments. Manduca were reared on an artificial diet, under previously described conditions (Bell and Joachim 1976; Sanes and Hildebrand 1976). Adult white-eye mutant Musca were reared in laboratory cultures as previously described (Fröhlich and Meinertzhagen 1982).
Back-filling of Neurons
Neurobiotin or biocytin was used to label neurons in both species as previously reported (Sun et al. 1995,1996,1997). Neurons to be labeled were damaged by cutting their axons. The nerve was then exposed to distilled water for 1 min to open the damaged neurites, and a drop of biotin solution [a few crystals of Neurobiotin in sodium phosphate-buffered saline (PBS, 0.01 M, pH 7.4), concentration <0.2%] was placed over the cut area. The entire animal was then placed in a humidified chamber for 5–20 min and the area of the cut immediately flushed with saline to wash out the excess biotin. The brain was then dissected out and processed as described below.
Intracellular Labeling of Neurons
An isolated head preparation was used for intracellular labeling of antennal-lobe neurons in Manduca. Briefly, the frontal cuticle and muscles of the head were removed to expose the antennal lobe. The head was then removed from the body and secured with insect pins in a recording chamber in which the head was superfused constantly with saline (Pichon et al. 1972). The neurons were filled intracellularly as previously described (Matsumoto and Hildebrand 1981) with Neurobiotin (Vector Labs; Burlingame, CA) or with biocytin (Molecular Probes; Eugene, OR). The tips of the glass micropipettes were filled with either 4% Neurobiotin in 1 M KCl or 3% biocytin in 0.5 M KCl in 0.05 M Tris buffer (pH 7.4), and the shafts were filled with 2 M KCl. After stably impaling the neuron, dye was ionophoresed into the cell with a current of 2–10 nA (depolarizing for Neurobiotin; hyperpolarizing for biocytin) passed for 5–30 min.
Tissue Processing
After dye injection or mass-labeling of neurons, the brain was immediately dissected out and fixed at 4C for 0.5–2 hr in fresh, cold fixative containing 4% paraformaldehyde, 0.24% glutaraldehyde, and 0.2% saturated picric acid in 0.1 M sodium phosphate buffer (PB; pH 7.4). The brain was then embedded in 7% low melting-point agarose and sectioned at 100 μm with a Vibratome (TPI; St Louis, MO).
Detection of Labeled Neurons
Labeled neurons were rendered fluorescent by incubating in a Cy3-conjugated streptavidin (Jackson ImmunoResearch Labs; West Grove, PA) solution (0.5 μg/ml of PBS) for 3 hr to overnight. Detergent was not used. Sections were then mounted without dehydration in Vectashield (Vector Labs).
Confocal Microscopy
Labeled neurons were imaged with a Bio-Rad MRC 600 (Richmond, CA) or with a Zeiss LSM 410 (Oberkochen, Germany) confocal microscope, both equipped with krypton/argon laser sources. Tissue was usually imaged with a × 20 (NA 0.75) Nikon objective (Bio-Rad) or with a × 25 (NA 0.8) multi-immersion objective (Zeiss). Optical sections, usually at consecutive intervals of 1–2 μm, were imaged through the depth of the labeled neurons and saved as image stacks. Collapsing this stack using the summation (Bio-Rad) or transparent (Zeiss) options on the confocal software onto a single plane generated a two-dimensional reconstruction of the labeled neuron. The image stack was also reconstructed in 3-D with appropriate software, to define areas of interest in the neuron. Although the effects of laser illumination on fixed tissue are not known, to prevent possible ultrastructural damage we tried to minimize both the scanning time and the laser intensity.
Converting the Intracellular Label to an Electron-dense Product
After confocal microscopic observation, sections were transferred to PBS and incubated overnight in an avidin–biotin–peroxidase complex (ABC Elite; Vector Labs) solution, washed with PBS, preincubated with DAB (0.25% in PBS) for 15 min, and finally reacted with DAB and H2O2 (0.01% in DAB solution) for 5–10 min. After such reaction, the labeled neurons became dark and the fluorescent label was no longer visible. Tissue prepared in this way was observed by LM and, if necessary, could be kept for long periods of time or prepared for EM.
Plastic Embedding
For EM, tissue was osmicated in 0.5% OsO4 in PB (0.1 M, pH 7.4) for 15 min, dehydrated, and infiltrated with Poly/ Bed (Polyscience; Warrington, PA). The sections were flat-embedded between Aclar sheets (Ted Pella; Redding, CA). Although image quality was somewhat impaired by the thickness of the slices and the density of osmication, it still enabled the filled cells to be identified from LM through the slice. Selected Vibratome sections containing the labeled neuron were cut out and glued with epoxy to a Poly/Bed blank cast from an inverted BEEM capsule (Polyscience) from which the nose had been cut off and with the cap snapped on. This provided a surface exactly perpendicular to the cylinder of the block to facilitate further confocal scanning.
Defining the Depth of Areas of Interest from Confocal Microscopy
Although the depth of a structure within the block could be estimated with the microscope stage, greater precision was achieved with confocal microscopy. For this, the block was trimmed as small as possible to help locate the area of interest for EM. The section was faced in the ultramicrotome, yielding a smooth surface, and the block held in a specially fabricated brass slide with a hole at its center, to view with the confocal microscope. This arrangement allowed a slight tilt of the surface of the block, to bring it parallel with the image plane, a critical prerequisite for determining the depth (d) of the stained cell. The confocal microscope stage and Z-axis motor were both calibrated and the reproducibility of each was carefully checked to provide accurate depth information. The surface of the block was easily defined by the strong confocal reflecting mode, giving d = 0 μm. Then the actual depth of a particular region of the cell was read from the output of the Z-axis motor, using either the reflecting mode or the transmission detector. With the light osmication used, it was possible to image the entire depth of a 100-μm slice.
Once the depth of a particular region was defined, the epoxy block was thin-sectioned through the entire slice or down to the correct depth by counting the requisite number of semithin sections. Thin sections were collected on Formvar-coated slot grids or thin-bar copper grids and post-stained with aqueous uranyl acetate and lead citrate. Thin sections were examined with either a JEOL JEM-1200EX or a Philips 201C EM. Selected labeled processes were photographed, usually at magnifications between X1500 and X15,000.
Application of the Method to Immunocytochemistry
An immunocytochemical protocol using an antibody against serotonin (Incstar; Stillwater, MN) was used as described previously (Sun et al. 1993), except that a biotinylated secondary antibody was used to introduce biotin to the stained neuron. The neuron was detected first with Cy3-conjugated streptavidin (for confocal microscopy) and then with DAB as described above (for EM study).
Results
Intracellular labeling of neurons with biotin was routinely used in our systems (Sun et al. 1995). For backfilling, surgically accessible nerves were easily labeled with either biocytin or Neurobiotin. However, Neurobiotin was preferred because it dissolved more readily in water than biocytin and apparently traveled faster within the cell. Neurons were filled after nerves were placed in biotin solution for only 5–20 min. Longer times were unnecessary and often resulted in higher background staining. Because both markers traveled rapidly within the cell, it was not necessary to allow extra time for diffusion within the cell, at least for fills extending up to 3 mm from the site of the nerve cut. The label was able to travel in both anterograde and retrograde directions.
Converting the Fluorescent Marker to an Electron-dense Form
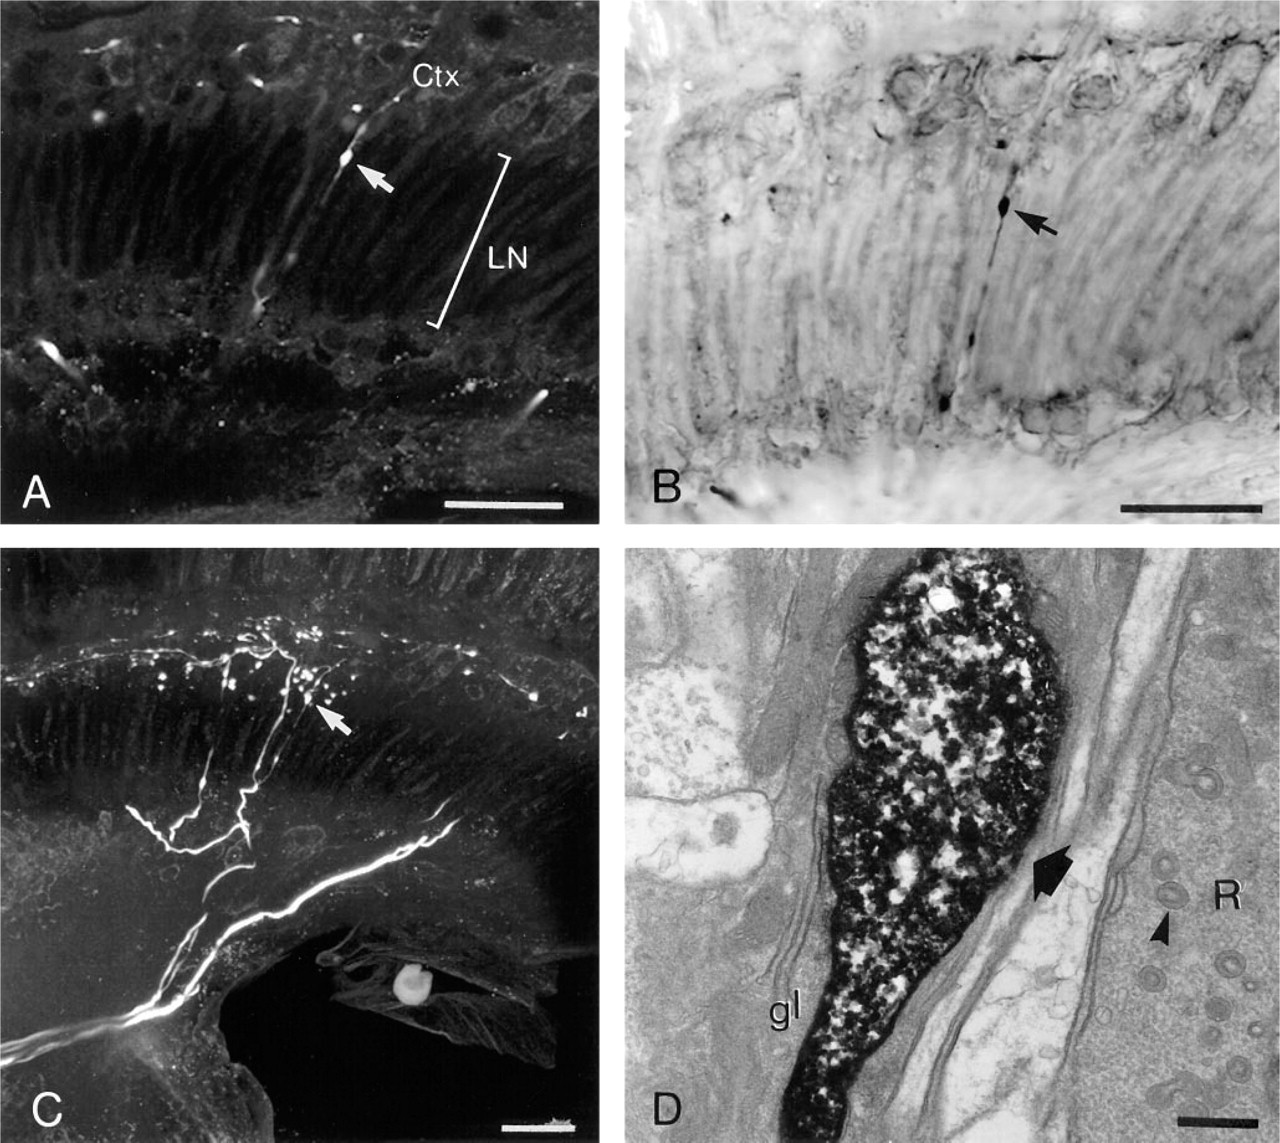
After confocal microscopy, we converted the fluorescent label to an electron-dense form by treating stained tissue with the ABC kit using DAB (Figure 1). A mass-filled antennal nerve was visualized with fluorescence-conjugated streptavidin (Figures 1A and 1C), which was then converted to electron-dense material, visible both in brightfield microscopy (Figure 1B) and in EM (Figure 1D). The reaction was highly specific. Although fluorescence was no longer detected after the conversion, comparing the pattern of fluorescence staining (Figure 1A) with that of DAB (Figure 1B) showed that the reaction was restricted to the fluorescently stained neurons.
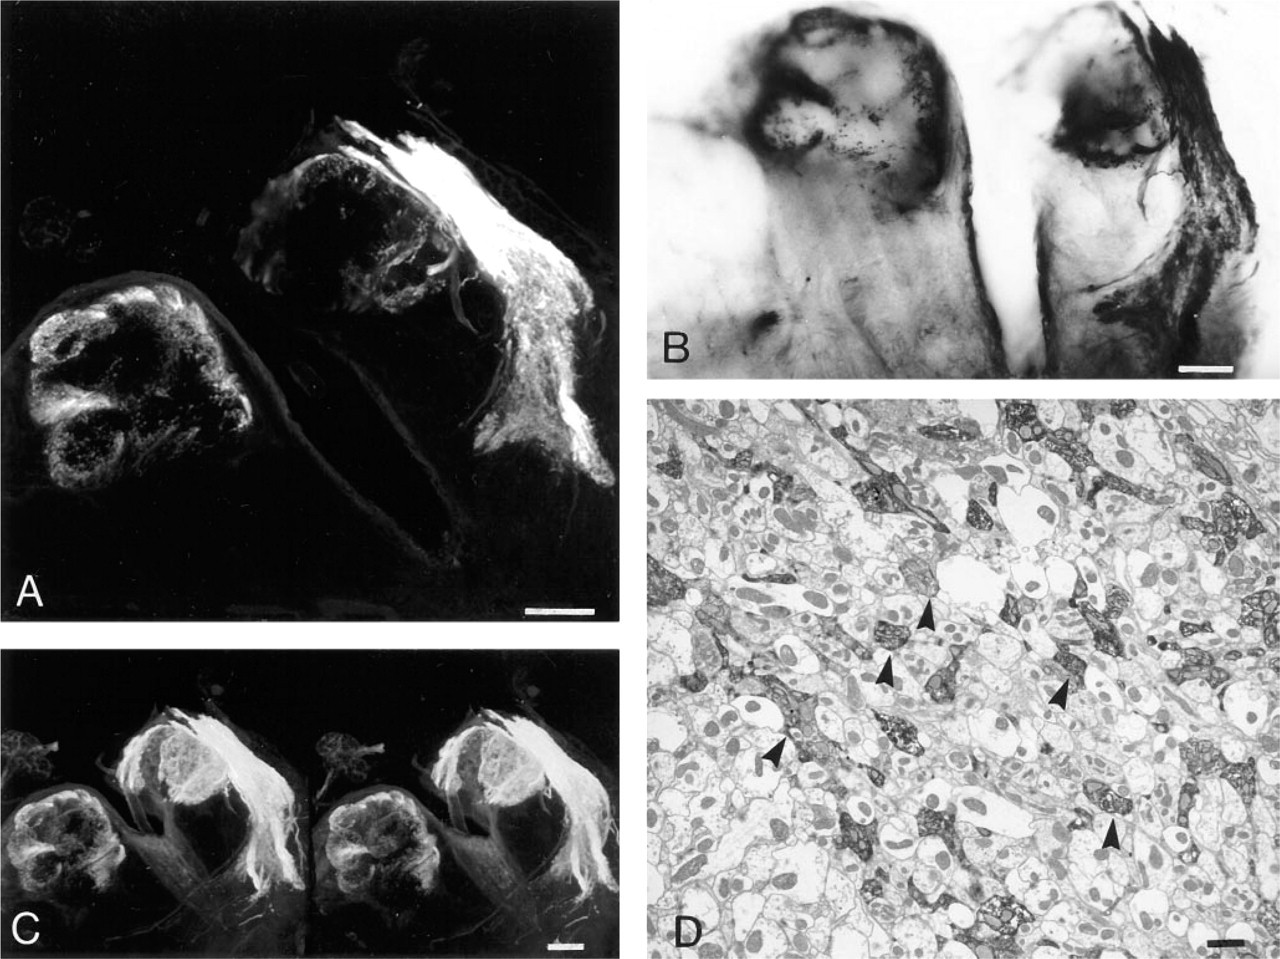
Antennal nerve in Musca mass-filled with Neurobiotin showing the DAB conversion. (
Confocal Image Stacks Reveal the 3-D Morphology of Neurons
The collapsed projection of the original image stack was used to derive a view of stained neurons comparable with conventional camera lucida drawings. A Neurobiotin-labeled neuron that ramified in both ipsi- and contralateral regions of the protocerebrum of the fly's brain provides an example (Figure 2). Stereo-pair and 3-D reconstructions provided corresponding 3-D views of the same image stack (Figure 2A), defining regions of particular interest, such as varicosities on axon terminals. The depths of the corresponding optical sections in the 3-D stack gave the depths of the varicosities in the image stack (Figures 2B and 2C). After conversion, the same varicosities were identified in a digital montage of brightfield images of the labeled neuron (Figure 2D) to yield an image directly comparable with the original confocal image reconstruction (Figure 2A).
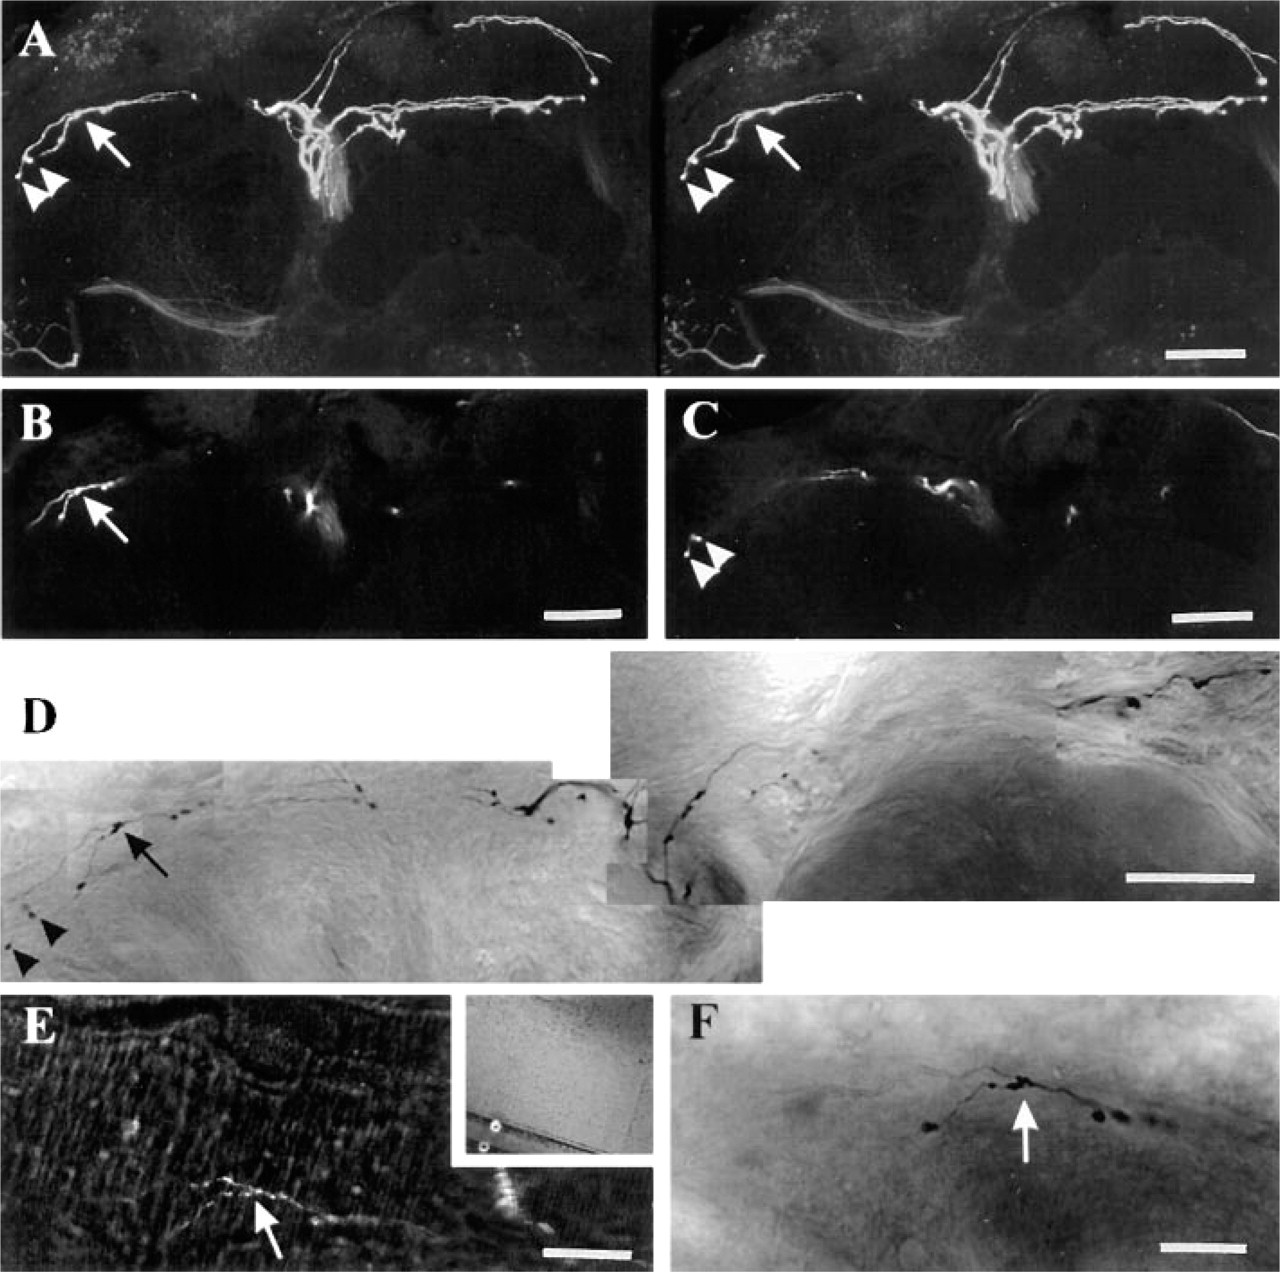
Neurobiotin-stained neuron in 100-μm Vibratome slice. Stereopair images (
Determining the Depth of Areas of Interest Within the Epoxy Block Using Confocal Microscopy
To locate particular areas within an epoxy block, depth information was confirmed by using either the reflecting mode of confocal microscopy or the transmitted light detector. Although the poor quality of reflectance images did not allow another 3-D reconstruction of the stained neurons, they were usually sufficient to locate areas of interest when compared with the original confocal image stack.
The surface of the block and the depth of the area of interest were directly read from the confocal Z-axis motor (Figures 2E and 2F), leaving only small inaccuracies due either to refractive index mismatch between the objective and the plastic or to mechanical inaccuracies of the microscope stage. Further inaccuracies arose from the section thickness calibration of the ultramicrotome. To compensate for these inaccuracies once the correct depth was defined, we collected a few more micrometers of thin sections both above and below the predicted area of interest.
Correlating Ultrastructure with the 3-D Morphology of a Neuron
In addition to depth information, the shapes of the labeled profiles themselves were used to correlate ultra-structure with LM detail. It was sometimes difficult, however, to compare a 70-nm thin section with a 1–2-μm optical section. Although it was possible to create small 3-D reconstructions of several EM sections to compare with the confocal image, the task of making this comparison was made easier by trimming off unwanted tissue. In this particular example, when we compared the ultrastructure of the varicosities at 24.5 μm (Figure 3) and at 4.5 μm (Figure 4) with the corresponding confocal images, there was sufficient similarity to confirm a correlation. The thin sections at 23 μm (Figure 3E) and at 26 μm (Figure 3F) demonstrated that at the first level the profile of the particular branch had not yet appeared in the section, whereas at the second level it had already disappeared, thus circumscribing the varicosity to within a 3-μm slice (Figures 3A-3D). Thus, there was good agreement between these thin-section depths and the original depth of the varicosity (24.5 μm on the Z-axis). The correlation was also clear between the images from both LM and EM for the two varicosities at 4 μm (Figure 4).
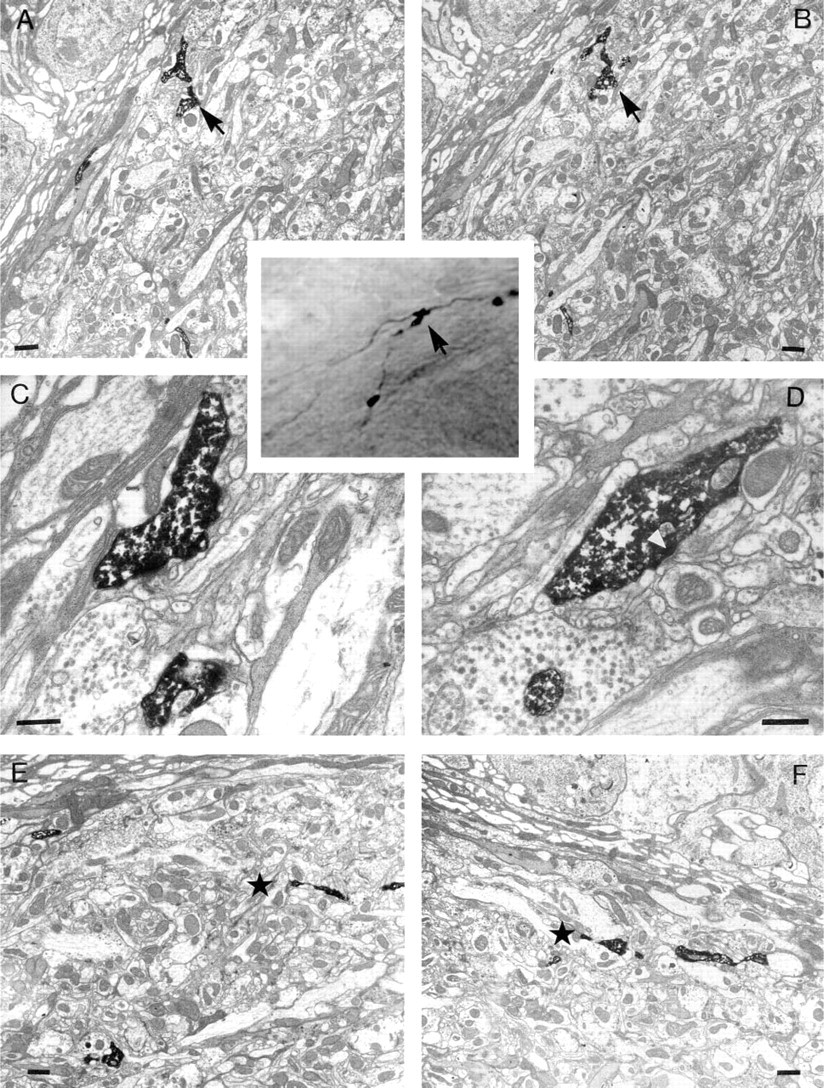
Ultrastructure of a varicosity at 24.5 μm. Low magnification EMs (
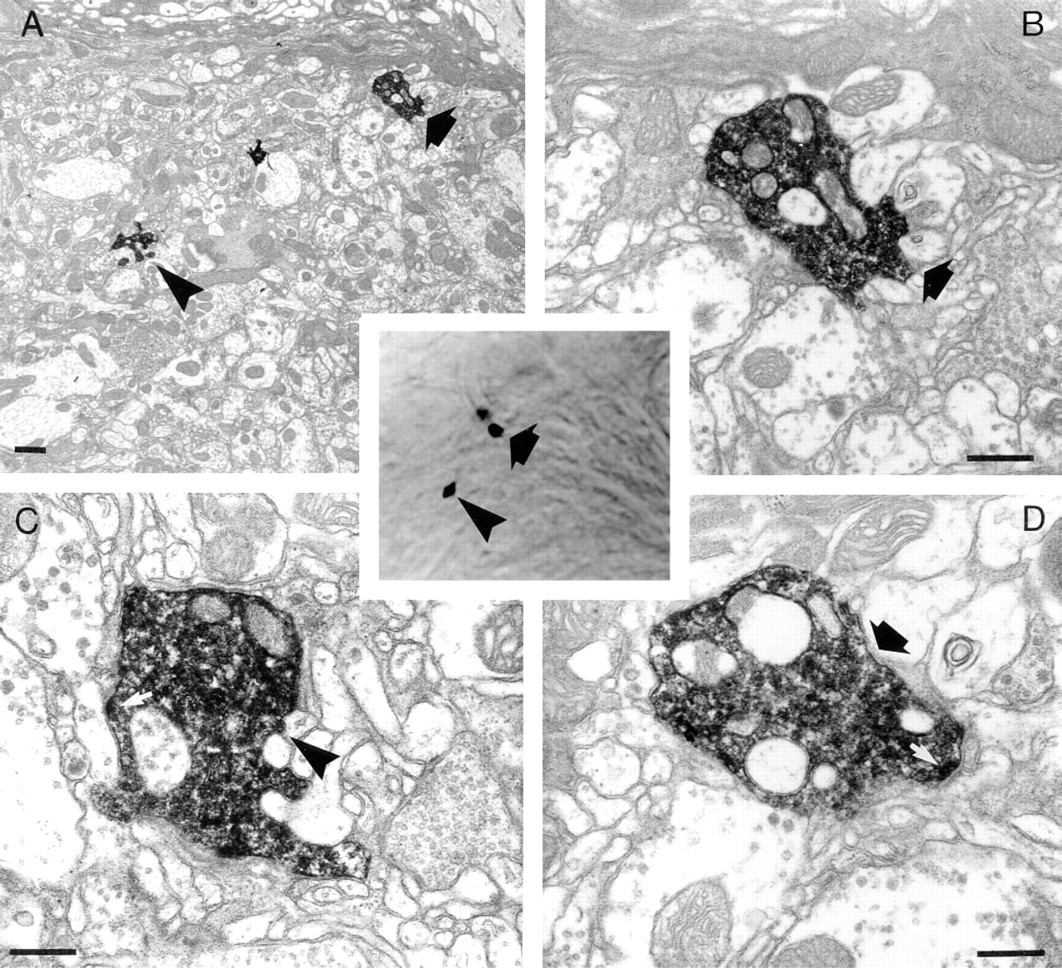
Ultrastructure of two varicosities at 4 μm separately identified (arrow, arrowhead, respectively). (
The Mechanism of the Conversion Technique
The method used in this study was discovered empirically. Because the mechanism of the conversion technique is not fully understood, several experiments were conducted to explore it further. In theory, after fluorescence-conjugated avidin binds to biotin in the labeled neuron, there should be no biotin available for binding with the ABC complex. Two possibilities (not mutually exclusive) could explain how the method worked: (a) there was still unbound biotin remaining after avidin labeling; and (b) the ABC complex could bind directly to fluorescently tagged avidin. We suspect that the second possibility may have been more likely because (a) after incubation of the tissue with Cy3-conjugated avidin followed by confocal-microscopic examination, incubation of the same sections with avidin conjugated to a second fluorophore produced no significant double staining; and (b) incubation in fluorescent-conjugated avidin with detergent for an extended period (up to 72 hr) failed to abolish the ABC–DAB staining. Finally, (c) the ABC complex ought to be much larger than avidin or streptavidin molecules alone. Therefore, unbound biotin not accessible to fluorescent-conjugated avidin, if indeed there were some, should also not be accessible to the ABC complex. On the other hand, because each avidin has four biotin binding sites, remaining unbound biotin binding sites could be recognized by free biotin conjugated to the ABC complex. The ABC complex is believed to be a matrix of avidin and biotinylated peroxidase complex, which might contain free biotin. We propose that this free biotin binds to the available biotin binding sites of the fluorescent-conjugated avidin. Evidence to support this proposal came from the following experiment. After we observed the fluorescent stain by confocal microscopy, sections incubated with Component B alone of the ABC kit, which contained biotin-conjugated peroxidase only, also yielded staining when reacted with DAB as a substrate, albeit weaker than that with ABC complex. This indicated that the free biotin-binding sites of fluorescently conjugated avidin were still capable of binding biotin.
Other Applications of the Method
Taking advantage of biotinylated probes, we used the above method to combine confocal microscopy and EM in the same way as for biotin-stained neurons, using an antibody specific to serotonin as an example.
Several large serotonin-immunoreactive neurons arborize to the first neuropil of the fly's visual pathway, the lamina. Although most of these fibers ramify in the cortex of the lamina, which is devoid of synaptic connections, there were a number of varicosities along the length of the fiber penetrating the neuropil area of the lamina, parallel to the unit cartridges (Figure 5). This raised the possibility that such varicosities may have formed synaptic connections in the neuropil. By confocal microscopy, the varicosities were easily identified and their neurites readily reconstructed in 3-D (Figure 5C). Using the ABC–DAB conversion method, the very same preparation was studied with EM to investigate the ultrastructure of a particular varicosity (Figure 5D). No synaptic specialization was detected.
Discussion
We report here a technique for converting the fluorescence label of biotin-filled neurons into permanent form. The technique is both easy and fast. It can be used with intracellular recording and staining to correlate 3-D information about ultrastructure and electrophysiology of a single neuron. The method, linking a neuron's ultrastructure to 3-D information about its arborization, is greatly facilitated by confocal microscopy.
The 3-D arborization of a neuron supports its connections within a neuronal network (Macagno et al. 1973; Harris and Stevens 1988), and determines its cable properties (Rall et al. 1992). Furthermore, the arborization is an exquisite morphological signature of the neuron, serving as a taxonomic feature (Rowell 1989) to distinguish the neuron from others, often with greater clarity than electrophysiological responses. Correlating information about a neuron's branches with the ultrastructural characteristics of identified regions, especially the sites of synaptic connection, is particularly useful for understanding the function of a neuron and the role that it plays within the network. However, the correlations established by various alternative methods mostly require tedious 3-D reconstruction, and because only part of the neuron's surface is actually devoted to synaptic contacts, much of a reconstruction may not actually yield valuable information. These are problems that our method was developed to overcome.
Comparisons with Other Methods Combining Confocal Microscopy with EM
Although confocal microscopy offers powerful views of the 3-D branching patterns of neurons, the incompatibility of staining methods for confocal microscopy and EM is still a major obstacle for localizing synaptic contacts to particular identified branches. To provide a compatible combination, various methods have already been developed to convert fluorescent labels to electron-dense material. These include (a) photo-oxidation of the fluorescent signal (Maranto 1982); (b) combination of immunogold and fluorescent dyes (Sun et al. 1995); (c) injection of a fluorescent marker conjugated to another EM-detectable marker (Hill and Oliver 1993); and (d) using an antibody against a fluorescent marker that can be subsequently localized by electron-dense staining for EM (Taghert et al. 1982). Methods a and b were discussed previously, whereas c and d require additional steps. The method described in this article compares favorably with these existing methods, and an independent report indeed confirms our experience, but is mentioned only briefly without singling out the method or its mechanism (Kawaguchi and Kubota 1996). Alternatively, the reflecting mode of confocal microscopy can be used to image neurons filled with nonfluorescent stains (Deitch et al. 1990b) to allow direct EM study, but in this mode images are generally of low quality (Figure 2E) and are seldom used for 3-D reconstruction. This mode is therefore not an alternative to combined con-focal microscopy and EM.
Penetration Problems
A standard problem with cytochemical and histochemical methods for EM study is the promotion of maximal penetration of large molecules while retaining good tissue preservation. This problem is caused mostly by crosslinking fixatives, such as glutaraldehyde. In our case, reduction of the concentration of glutaraldehyde appears to enable the large ABC molecular complex to penetrate up to the section thickness used here (100 μm) (Figures 1 and 2D). Tissue of greater thickness exceeds the maximal working distance of the objectives used (130 μm) and therefore was not tested. We therefore undertook no further permeabilization of the tissue to enhance the penetration of reagents, even though the Vectashield mountant and/or laser scanning may have helped the penetration of such large molecules.
Extending the Technique to Other Systems
Neurobiotin and/or biocytin have been widely used as neuronal markers in species as widely divergent as the rat (Horikawa and Armstrong 1988; Kita and Armstrong 1991) and insects (Malun 1991; Mesce et al. 1993; Sun et al. 1995,1996,1997). Therefore, the technique described here should be applicable in many other systems, with the following conditions. Neurobiotin or biocytin must first be used to label the neuron and, unlike fluorescent markers, these stains require tissue processing to visualize the filled neuron. This requirement is offset by the versatility of biotin molecules for intracellular recording and staining. The widespread application of the biotin–avidin system in immunocytochemistry and molecular biology means, for example, that when combined with biotinylated probes this method should be largely applicable in these areas also, as we show with immunoreactivity to anti-serotonin.
Footnotes
Acknowledgements
Supported by an award from the University of Arizona, Center for Insect Science to XJS, grants to IAM (NIH EY-03592, NSERC OPG 0000065), to LPT and JGH (NIH NS-28495), and to JGH (NIH AI-23253).
The contents of this publication are solely the responsibility of the authors and do not necessarily represent the official view of the NIH.
We thank Patty Jasma, Dr A. A. Osman, Lesley Varney, and Maggie Klonowska for technical assistance.