
Abstract
Myosin heavy-chain (MHC) isoforms are major structural components of the contractile apparatus of the heart muscle. Their spatio-temporal patterns of expression have been used as a tool to dissect cardiac development and differentiation. Although extensively investigated, controversy still exists concerning the expression patterns of atrial (AMHC), ventricular (VMHC), and cardiac myosin heavy-chain (CMHC) during development in the heart. In this study, we describe that probe length, probe concentration, and staining time in the non-radioactive in situ hybridization procedure seriously influence the observed pattern of MHC expression and the subsequent interpretation, explaining the divergent opinions in the field. Using a variety of external and internal controls for the in situ hybridization procedure, we demonstrate that both AMHC and VMHC are expressed throughout the entire heart tube during early development. During subsequent development, VMHC becomes restricted to the ventricles, whereas AMHC remains expressed in the atria, and, at substantially lower levels, is detected in the ventricles. These results are discussed in the context of methodological constraints of demonstrating patterns of gene expression. This manuscript contains online supplemental material at http://www.jhc.org. Please visit this article online to view these materials.
D
The fundamental structure of sarcomeric myosin is identical in all species with cross-striated muscles, including birds (Bandman and Rosser 2000). Myosin consists of two heavy-chain subunits (each with a molecular mass of ∼200 kDa) and two pairs of light-chain subunits (molecular mass ranging from 18 to 26 kDa) (for reviews, see Swynghedauw 1986; Warrick and Spudich 1987; Weiss and Leinwand 1996). The MHC proteins are encoded by a multigene family, which comprises more than 30 members in chicken and ∼10 members in mammals (Leinwand et al. 1983; Wydro et al. 1983; Robbins et al. 1986; Radice et al. 1989). In chicken, ten distinct sarcomeric MHC isoforms have been described to date, of which seven have been reported to be expressed in the heart, designated as atrial, ventricular, cardiac, slow tonic, neonatal fast skeletal, slow skeletal 2, and embryonic skeletal MHC (González-Sánchez and Bader 1985; Bisaha and Bader 1991; Yutzey et al. 1994; Oana et al. 1998; Croissant et al. 2000; Machida et al. 2000a,b,2002; Matsuoka 2003). In this study, we focus on the developmental patterns of expression of atrial (AMHC), ventricular (VMHC), and cardiac (CMHC) myosin heavy chain.
At both the gene and protein levels, the expression patterns of AMHC and VMHC have been studied extensively. With respect to AMHC, data are not yet conclusive. Several studies suggest that AMHC is initially expressed throughout the entire linear heart tube and becomes confined to the atrial chambers and the peripheral ventricular conduction system in the formed heart (de Jong et al. 1988b; Oana et al. 1998; Bao et al. 1999; Franco et al. 2002). Other studies have reported that from the outset, the expression of AMHC is restricted to the atria (Yutzey et al. 1994; Machida et al. 2000a; Berdougo et al. 2003). Although there seems to be consensus with respect to the overall expression pattern of VMHC in the heart—that it is initially expressed throughout the entire heart and becomes downregulated in the atria—details differ (Sanders et al. 1984; de Jong et al. 1987,1988b; Machida et al. 2000b; Matsuoka 2003). Also, with respect to the expression patterns of AMHC and VMHC outside the heart, the published reports differ. VMHC is reported to be expressed in the forming somites and skeletal muscles, in which the expression is either transient (Bisaha and Bader 1991; Yutzey et al. 1994; Croissant et al. 2000) or long-lasting (de Jong et al. 1988a,b). AMHC was reported to be not expressed in the somites (Yutzey et al. 1994) or to be present in the somites (de Jong et al. 1988a,b; Oana et al. 1998). CMHC, the most recently cloned MHC, was reported to be exclusively expressed throughout the entire myocardium of the heart at all developmental stages (Croissant et al. 2000). Because of this unique expression pattern, CMHC was and is used as a tool to discriminate cardiac and skeletal muscle cells both in vivo and in vitro (Marvin et al. 2001).
Although it has been argued that the differences in expression patterns may be due to different probes and/or conditions used in non-radioactive in situ hybridization, these patterns have led to different interpretations of the underlying developmental mechanisms. To clarify this point and to contribute to the understanding of the biology of these systems, we prepared different probes, compared their sequences, and evaluated their expression patterns using different staining conditions. A qualitative and a quantitative PCR analysis on dissected cardiac components of different developmental stages provided an independent assessment of the MHC expression patterns. These analyses revealed that CMHC is not a unique MHC, but is the 5′ part of VMHC. Taking into account the effects of probe length, probe concentration, and staining time in the nonradioactive in situ hybridization procedure, we now show that both AMHC and VMHC mRNA are initially expressed throughout the entire linear heart tube and become confined during subsequent development to the atria and ventricles, respectively. These observations were confirmed by PCR analysis. Recommendations for proper conditions for non-radioactive in situ hybridization analysis are presented.
Materials and Methods
Tissues
Fertilized chicken eggs were obtained from a local hatchery (Drost BV; Nieuw Loosdrecht, The Netherlands), incubated at 38.5C in a moist atmosphere, and automatically turned every hour. After the appropriate incubation times, embryos were isolated and staged according to Hamburger and Hamilton (HH) (Hamburger and Hamilton 1951). The tissue samples were collected and directly frozen on dry ice for RNA isolation or fixed for in situ hybridization in 4% paraformaldehyde (PFA) dissolved in phosphate-buffered saline (PBS; 150 mmol/L NaCl and 10 mmol/L Na3PO4, pH 7.4) for 4 hr at room temperature.
PCR Analysis
Total RNA was isolated from the atria, ventricles, and outflow tract (OFT), and the trunk, which represents the body without heart, limbs, and head, of HH16 and HH30 chicken embryos using the RNeasy Mini or Midi Kits according to the manufacturer's protocol (QIAGEN Benelux BV; Venlo, The Netherlands). cDNA was prepared from 1 μg (HH16) or 1.5 μg (HH30) total RNA using Superscript II Reverse Transcriptase (Invitrogen; Breda, The Netherlands) and a mixture of the gene-specific reverse primers for AMHC, CMHC, VMHC, and GAPDH (Table 1).
This cDNA was used as a template in an end-point PCR analysis after 25 cycles with the same reverse primers and the appropriate forward primer (Table 1). To evaluate whether the various myosins are expressed in the different tissue samples, the PCR products were resolved in a 2% agarose gel. To quantitatively assess the expression levels of AMHC and VMHC, the cDNA was used in real-time PCR experiments using a Lightcycler in combination with the Lightcycler Fast Start DNA Master SYBR Green 1 kit (Roche; Almere, The Netherlands) and the specified primers (Table 1). The LinRegPCR method (Ramakers et al. 2003) was used for quantification. Expression levels of AMHC and VMHC genes were calculated relative to the housekeeping gene GAPDH.
Oligonucleotides
F, forward; R, reverse.
Non-radioactive In Situ Hybridization on Sections
The non-radioactive in situ hybridization procedure was performed, in general, as described previously (Moorman et al. 2001), with small adaptations. Fixed embryos were dehydrated in a graded alcohol series and embedded in paraplast. Twelve-μm-thick sections were prepared and mounted onto aminoalkylsilane-coated slides. After deparaffinization and hydration, sections were incubated with 20 μg/ml proteinase K dissolved in PBS for 2-12 min, depending on the developmental stage, at 37C. The proteinase K activity was blocked by rinsing the sections in 0.2% glycine in PBST (PBS + 0.1% Tween20) for 5 min. After two washes in PBS for 5 min, the sections were postfixed for 20 min in 4% PFA and 0.2% glutaraldehyde in PBS, followed by two washes in PBS for 5 min. Before prehybridization, a hydrophobic barrier was drawn around each individual section using an ImmEdge pen (Vector Laboratories; Burlingame, CA). This barrier allows treatment of each individual section with a different RNA probe. After prehybridization for at least 1 hr at 70C in hybridization mix [50% formamide, 5X SSC (20X SSC; 3 M NaCl, 0.3 M tri-sodium citrate, pH 4.5), 1% blocking solution (Roche), 5 mM EDTA, 0.1% 3–[(3-Cholamidopropyl) dimethylammonio]-1-propanesulfonate (Sigma; Steinheim, Germany), 0.1 mg/ml heparin (BD Biosciences; Erembodegem, Belgium), and 1 mg/ml yeast total RNA (Roche)], a digoxigenin (DIG)-labeled probe was added to the hybridization mix in a final concentration series of 0.001 to 10 ng/μl. After overnight hybridization, the sections were rinsed with 2X SSC, followed by three washes with 50% formamide, 2X SSC, pH 4.5, at 65C for 15 min, and finally, three washes in PBS at room temperature. Subsequently, the sections were incubated for 1 hr in 2% blocking solution in PBST, followed by overnight incubation in 2% blocking solution in PBST containing 100 mU/ml anti-DIG Fab fragment covalently coupled to alkaline phosphatase (AP) (Roche). Probe binding was visualized using nitro blue tetrazolium chloride and 5-bromo-4-chloro-3-indolyl-phosphate, toluidine-salt as the chromogenic substrate for anti-DIG-AP, according to the manufacturer's protocol (Roche). After staining times of 1 to 128 hr at room temperature, the color development was stopped by rinsing in double-distilled water. The sections were dehydrated in a graded ethanol series, rinsed in xylene, and embedded in Entellan.
Whole-mount In Situ Hybridization
Fixed embryos were dehydrated in a graded methanol series in PBST and stored in 100% methanol at −20C until further processing. At the start of the experiment, embryos were rehydrated in a graded methanol series in PBST. After removal of all extra embryonic membranes, opening the thoracic wall, and puncturing the brains, the embryos were digested with 10-20 μg/ml proteinase K dissolved in PBST for 15-30 min, depending on the developmental stage (Moorman et al. 2001). The remainder of the procedure is similar to the in situ hybridization procedure on sections as described above.
RNA Probes and Probe Synthesis
VMHC and AMCH probes were kindly provided by Dr. Yutzey (Bisaha and Bader 1991; Yutzey et al. 1994). The CMHC cDNA sequence was amplified from an HH30 chicken heart cDNA library using the forward primer 5′-TTT TGG CAT GGA CCT CCA GG-3′ and the reverse primer 5′-TTA CCA AGA GTG CAT CCC GGC G-3′ (Biolegio BV; Malden, The Netherlands) (Croissant et al. 2000). The PCR product was cloned into pGEM-T-easy PCR (Promega Benelux BV; Leiden, The Netherlands) and verified by sequence analysis. A cardiac Troponin I probe was used to visualize all cardiomyocytes (Houweling et al. 2002).
DIG-labeled antisense RNA was produced by in vitro transcription using DIG RNA labeling mix (Roche, Cat. no. 11277073910) according to the manufacturer's instructions. After the labeling reaction, the template DNA was digested using RQ-DNase (Promega), phenol was extracted, and the labeled RNA probe was precipitated. The probe was dissolved in 10 mM Tris-HCl and 1 mM EDTA, pH 7.6 and its concentration measured (ND-1000 spectrophotometer; NanoDrop Technologies, Wilmington, DE). The generated antisense probes include specific (MHC) and vector sequences: long AMHC, 2385 nucleotides (nt) long, includes 30 nt of vector sequences; short AMHC, 293 nt long, includes 10 nt of vector sequences; long VMHC, 2966 nt long, includes 305 nt of vector sequences; CMHC probe (medium VMHC probe), 1012 nt long, includes 122 nt of vector sequences; short VMHC, 314 nt long, includes 64 nt of vector sequences.
Image Acquisition and Image Processing
Whole-mount embryos were photographed using an Olympus DP12 camera (Olympus; Zoeterwoude, The Netherlands) coupled to a Leica MZFLIII stereomicroscope (Leica; Rijswijk, The Netherlands). Images of sections were taken by using the same camera mounted on a Zeiss Axiophot microscope (Zeiss; Oberkochen, Germany) equipped with differential interference contrast optics. A flatfield correction was applied to the images of the sections using a user-written macro in PMIS 4.1 (www.gkrcc.com).
For measurement of the staining intensity, optical density (OD) images were acquired as recently described (Ruijter et al. 2004). In short, a Photometrics cooled CCD camera (Tucson, AZ) with a 12-bit dynamic range (1317 × 1035 pixels) attached to an Axiophot microscope, a stabilized power supply, a 580 nm bandpass filter, and an infrared-blocking filter was used. The digital transmission images were converted into OD images by calculating the negative logarithm of the transmission image divided by an image of the light source. This conversion implicitly corrects background shading. The OD images were stored as 8-bit images (pixel value is 250X OD value) with a final format of 658 × 517 pixels. This binning step serves to reduce photon noise.
For every region of interest, the staining intensity in the OD image was measured using the image analysis program NIH Image (free download from www.nimh.nih.gov). A customized macro program allowed the user to click on the regions of interest and to key in a tissue identification code. The macro then calculated the mean OD value of a circular field (5 pixels diameter) and assigned this value to the identified tissue. In each section, independent measurements of intensity of staining of each probe in each region of interest were made at two different locations. Because the correlation coefficient between these duplicate measurements was at least 0.977, the mean of these two measurements was deemed a reliable estimate for the OD value of each tissue.
Results
Sequence Comparison
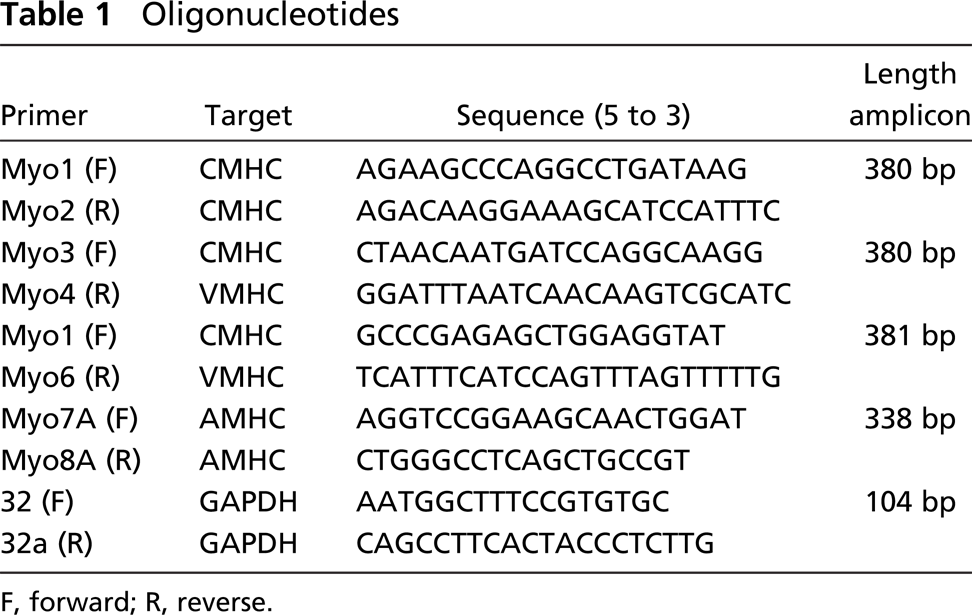
Before starting the analysis of the patterns of expression of the MHC mRNAs in the developing chicken embryos, the reported cDNA sequences of AMHC and VMHC presented in GenBank were retrieved. The entire sequence of CMHC (2700 bp) was retrieved from the original publication (Croissant et al. 2000). Moreover, the different cDNA constructs used to generate antisense RNA probes—long and short probes for both AMHC and VMHC and a PCR-cloned CMHC probe—were sequenced from both ends and included in the comparison. The full-length AMHC (AB004801) and VMHC (AB032197) sequences were selected and compared with the other sequences using pair-wise (bl2seq; http://www.ncbi.nlm.nih.gov/blast/bl2seq/wblast2.cgi) and multiple sequence alignment tools (ClustalW; http://www.ebi.ac.uk/clustalw/). The shorter AMHC and VMHC cDNA sequences showed at least 97% sequence identity with the respective full-length AMHC or VMHC clones (see online supplementary Figures 1-3).
The full-length AMHC and VMHC sequences showed an overall identity of 69% (Figure 1A). Comparison of the sequences used in the various VMHC probes to AMHC, and vice versa, revealed very limited overlap using the short probes; 44% of the sequence of short AMHC is identical to VMHC, and 34% of the short VMHC probe matches AMHC (Figure 1B). This is because these probes include the 3′ untranslated regions of these mRNAs—119 nt in the VMHC probe and 61 nt in the AMHC probe. The long probes, which are predominantly in the translated region of the mRNA, show like the full-length sequences, 67-69% sequence identity (Figure 1B). This level of identity between the different probes and their closest relatives should, in principle, prevent cross-hybridization in the in situ hybridization procedure, taking into account that the hybridization is performed at 70C in a hybridization mix containing, among others, 50% formamide and 5X SCC (Moorman et al. 1993). In this respect, it is of relevance to note that only stretches of sequences larger than 50 bp showing 100% identity might result in cross-hybridization (Moorman et al. 2000,2001). Inspection of the sequences used in this analysis revealed that such stretches were not present in any of the probes.
Alignment of the CMHC sequence revealed 99% identity to the 5′ end of the full-length VMHC cDNA sequence (positions −7 to 2693 relative to AB032197) (Figure 1A). No significant sequence identity was found between CMHC and an earlier reported 3258 bp VMHC cDNA clone (X59552; positions 2750-6008 relative to AB032197) (Stewart et al. 1991) (Figure 1A). Between these two clones, a gap of 57 bp is present with respect to full-length VMHC (positions 2694-2749). This finding strongly suggested that CMHC is encoded by the 5′ part of the VMHC gene. This is, however, in contrast to an earlier report (Croissant et al. 2000), in which it was concluded that CMHC is encoded by a separate member of the MHC gene family because of the absence of homology with any other MHC cDNAs known at that time and its unique spatiotemporal expression pattern.
A possible, although unlikely, explanation for this discrepancy might be that the reported full-length VMHC cDNA clone (AB032197) is a chimera of CMHC and the earlier reported VMHC generated during the construction of the cDNA library. To rule out this possibility, PCR analysis was performed on cDNA with a forward primer (Myo3) that anneals to the 3′ end of CMHC and a reverse primer (Myo4) that anneals to the 5′ end of the earlier reported VMHC cDNA clone (X59552) (Figure 1A). As control three primer pairs, which detect the 5′ part of CMHC (Myo1/2), the 3′ part of VMHC (AB032197) (Myo5/6), and the 3′ part of AMHC (AB004801) (Myo7A/8A), were used in parallel (Figure 1A). The three control PCR products were of the expected size, revealed the expected sequence, and showed the correct tissue distribution (Figure 1C). PCR products were formed with none of the primer pairs in the minus-RT controls (data not shown). As expected from our sequence comparison analysis, primer pair Myo3/4 revealed a PCR product of 381 bp (Figure 1C) and the expected sequence, as revealed by directly sequencing the PCR product (Figure 1D). Taken together, these data demonstrate that CMHC is the 5′ part of VMHC, of which the 3′ end is located 57 bp upstream of the earlier reported 3′ VMHC (X59552) cDNA clone.
Finally, we compared both the full-length VMHC and CMHC sequences to the chicken genome present in the ensemble library (http://www.ensembl.org/Gallus_gallus/index.html), revealing a near-perfect match (99%) to a region on chromosome 1 only. Full-length VMHC is encoded by 42 exons, with the ATG start codon at position 81,549,202 in exon 1 and the TAA stop codon at position 81,505,461 in exon 42. The last two nucleotides of full-length VMHC were not found in the genomic sequence, suggesting that they are derived from the cloning vector or primers used to prepare the cDNA. The CMHC sequence is encoded by the first 23 exons of the same gene and ends at position 81,526,253. This analysis further supported the notion that CMHC is not encoded by a separate gene but is the 5′ part of VMHC.
In the remainder of the article, the CMHC probe will, therefore, be referred to as medium VMHC, because its length is intermediate between the short and long VMHC probes (Figure 1B).
mRNA Levels of VMHC and AMHC
At stages HH16 and HH30, the mRNA levels of AMHC (primers Myo7A/8A) and VMHC (primers 5/6), relative to the household gene GAPDH, were determined by quantitative PCR analysis in cDNA prepared from total RNA isolated from the atria, ventricles, OFT, and trunk.
Sequence comparison and PCR analyses. (
For easy comparison, the AMHC expression levels were calculated relative to the expression level in the atria at stage HH30 (Figure 1E). At HH16, the expression level of AMHC is highest in the atria, 8-fold lower in the ventricle, and 25-fold lower in the OFT, suggesting that AMHC mRNA is expressed in a steep gradient that is highest at the inflow tract and lowest in the OFT. Between HH16 and HH30, the AMHC expression levels increase 4-fold in the atria, almost 3-fold in the ventricles, and 7-fold in the OFT. The level of AMHC mRNA in the sample derived from the trunk is very low, but significant, and was not found to change significantly between HH16 and HH30.
The same strategy was used to evaluate the expression level of VMHC mRNA, but here the expression level found in stage HH30 ventricles was set to 100 (Figure 1F). At HH16, the expression level of VMHC was found to be highest in the ventricle, slightly, although significantly, lower in the OFT, and more than 3-fold lower in the atria. Between HH16 and HH30, the expression level of VMHC increased more than 2-fold in the ventricle and slightly, although significantly, in the OFT. The expression level of VMHC mRNA was found to decrease almost 3-fold in the atria between HH16 and HH30, documenting the downregulation of VMHC mRNA in the atria during development. Like the AMHC expression level, the VMHC expression level in the trunk was found to be very low at HH16 and did not change significantly at HH30.
Effect of Probe Length and Concentration on the Staining Pattern
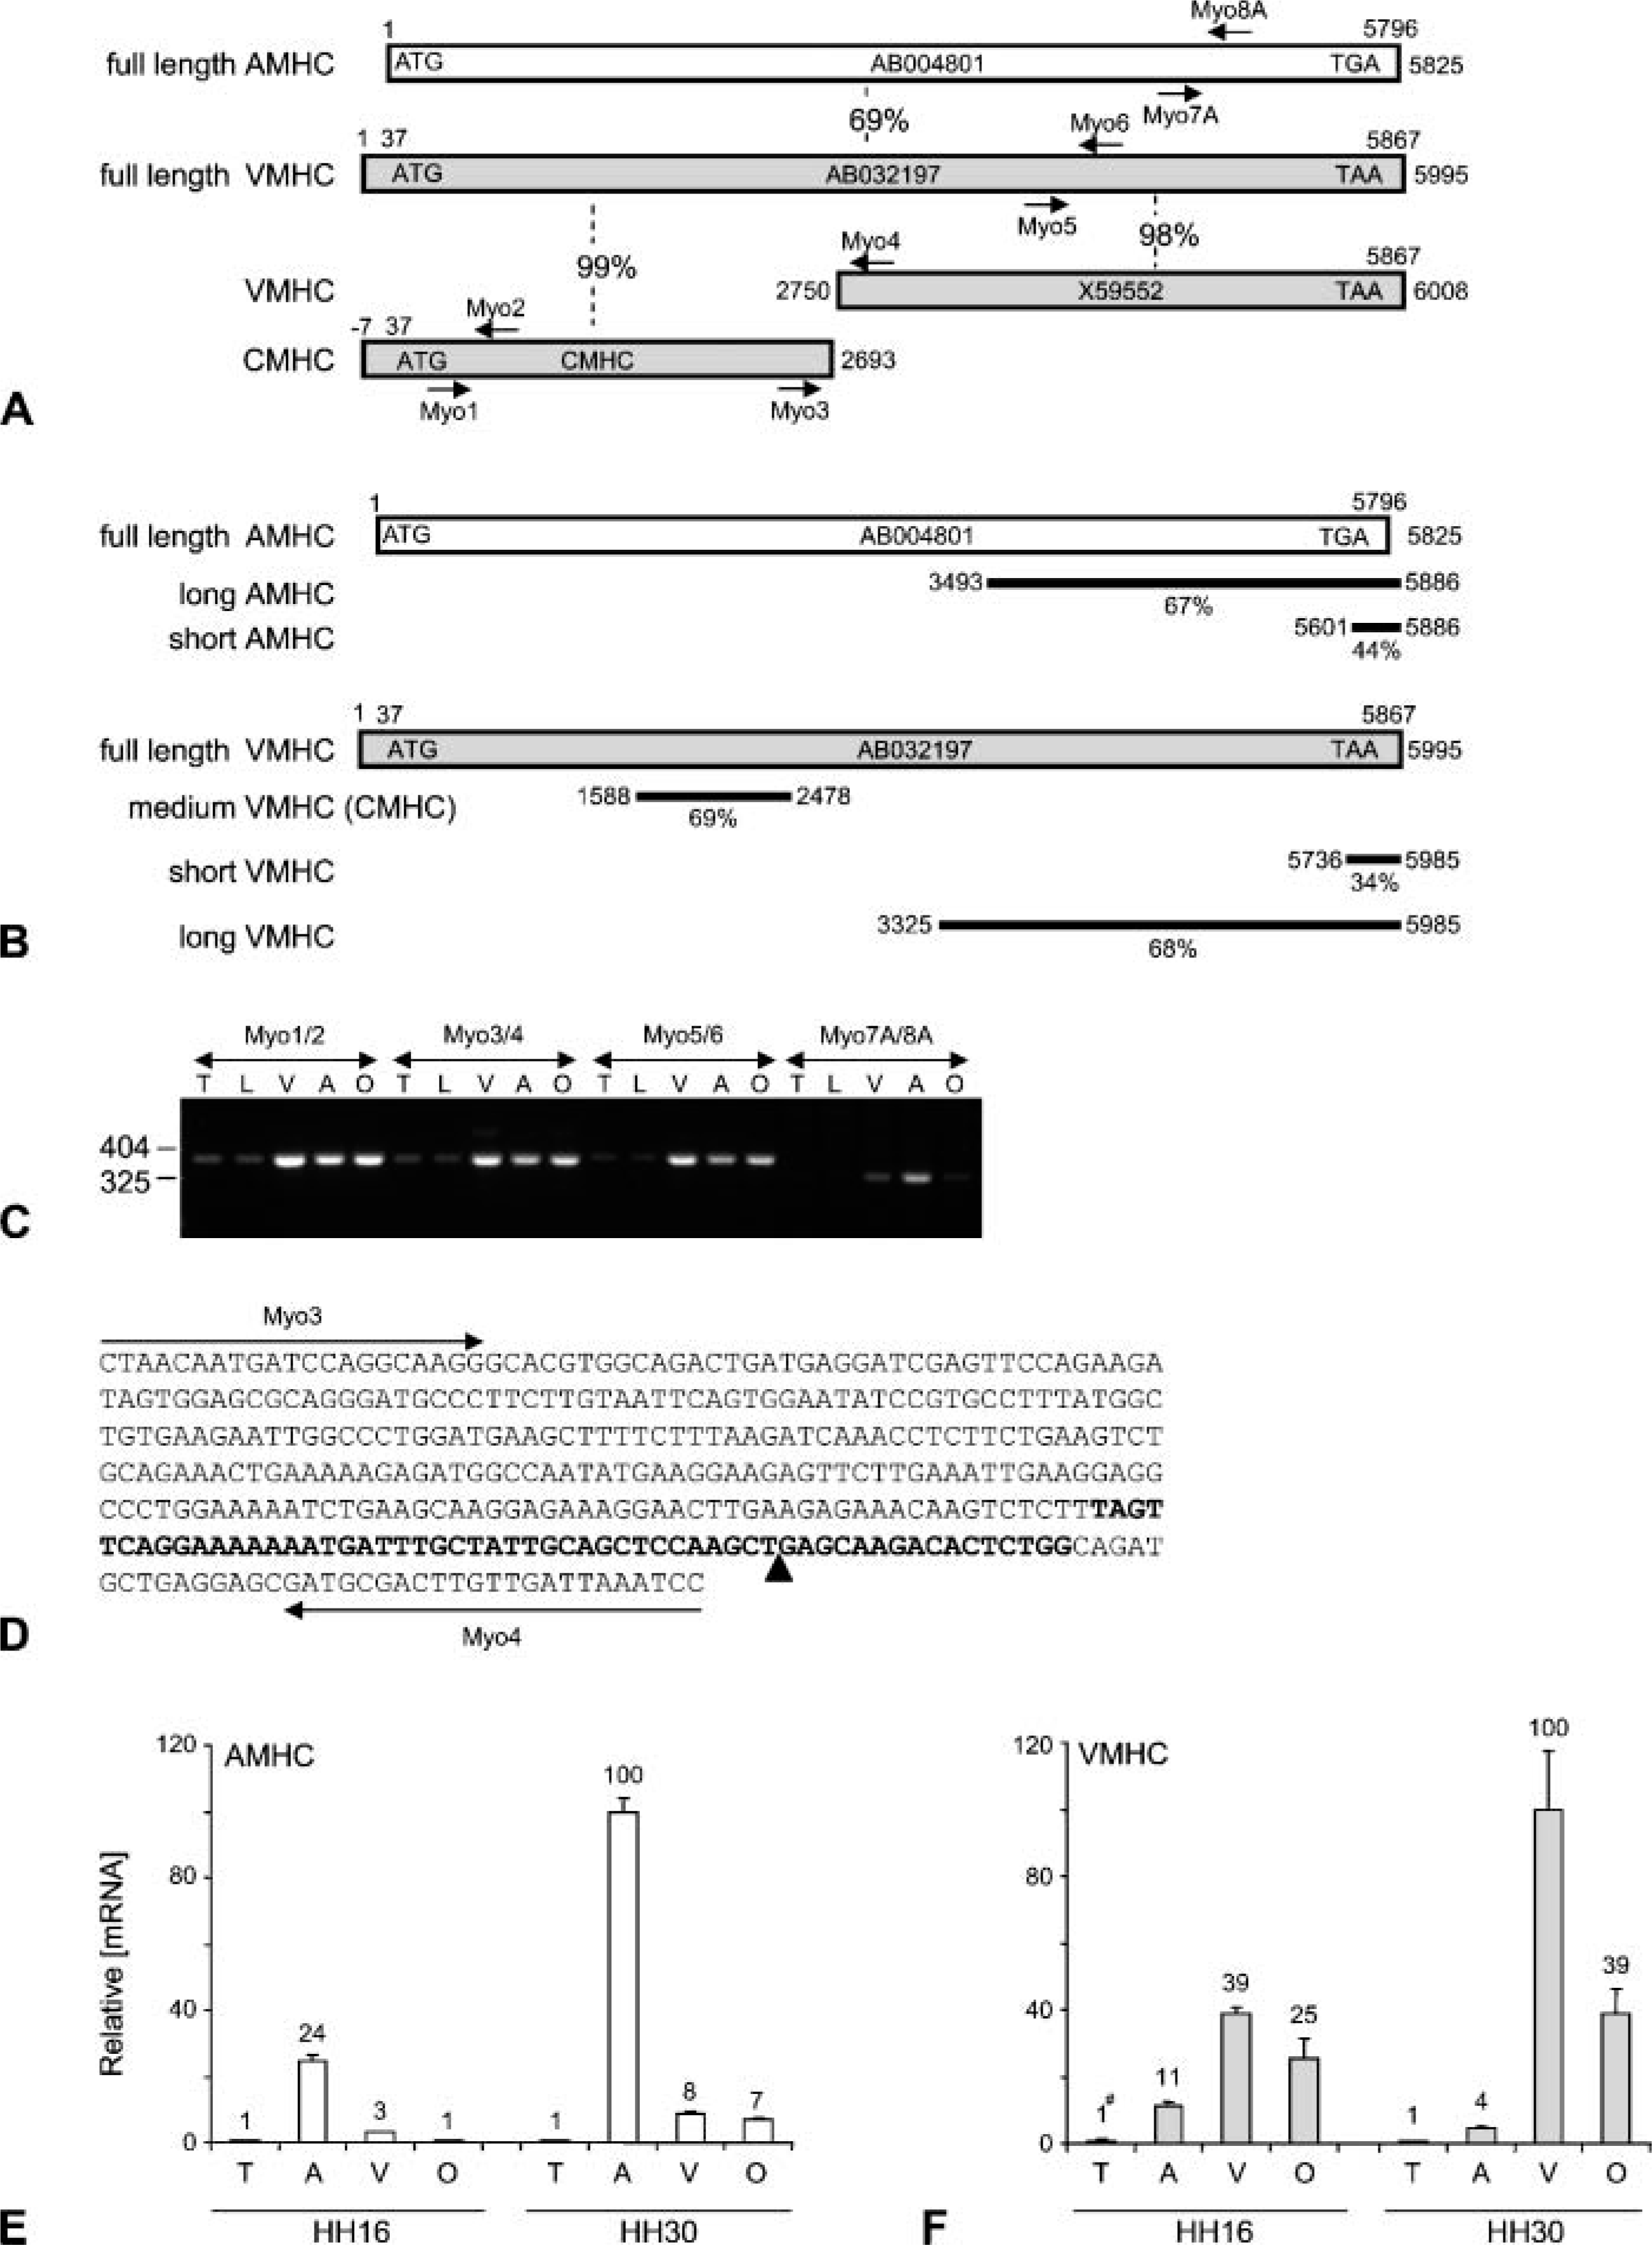
Prior to the analysis of the expression patterns of AMHC and VMHC using non-radioactive in situ hybridization, we compared the reported staining protocols (Yutzey et al. 1994; Oana et al. 1995; Bao et al. 1999; Croissant et al. 2000; Franco et al. 2002). The most variation was observed in the sequences included in the probe, the probe concentration, and the staining time, i.e., the visualization of the hybridized probe. In the first experiment, we assessed the effect of probe length and probe concentration on the staining pattern. In this in situ hybridization experiment, serial sections of an HH30 embryo were processed in parallel for three VMHC probes and two AMHC probes of different lengths (Figure 1B). Moreover, each probe was tested in a concentration series from 0.001 to 10 ng/μl in the hybridization mix and visualized using a fixed staining time of 16 hr (Figure 2).
Although we realize that the non-radioactive in situ hybridization analysis, in principle, is not a quantitative assay, it is can be used to compare staining intensities of one target mRNA within one hybridization experiment using serial sections of one embryo. Even at the lowest probe concentration tested (0.001 ng/μl), very faint staining is observed in the atria using the AMHC probes or in the ventricle using the three VMHC probes. At the highest concentration for each probe (10 ng/μl), all tissues start to stain blue. Because AMHC and/or VMHC have never been reported to be expressed in neural tube, we consider color development in the neural tube to be nonspecific background staining. Taking this into account, it should be concluded that a probe concentration of 10 ng/μl is too high for each tested probe. At the intermediate concentrations, not only does the staining intensity in the atria, with respect to the AMHC probes, and in the ventricles, with respect to the VMHC probes, increase, but also other components of the heart, the somites, and the skeletal muscle start to appear. An important issue is whether the observed expression patterns are the result of specific hybridization of the investigated mRNA species, cross-hybridization with related mRNA species, or nonspecific probe binding.
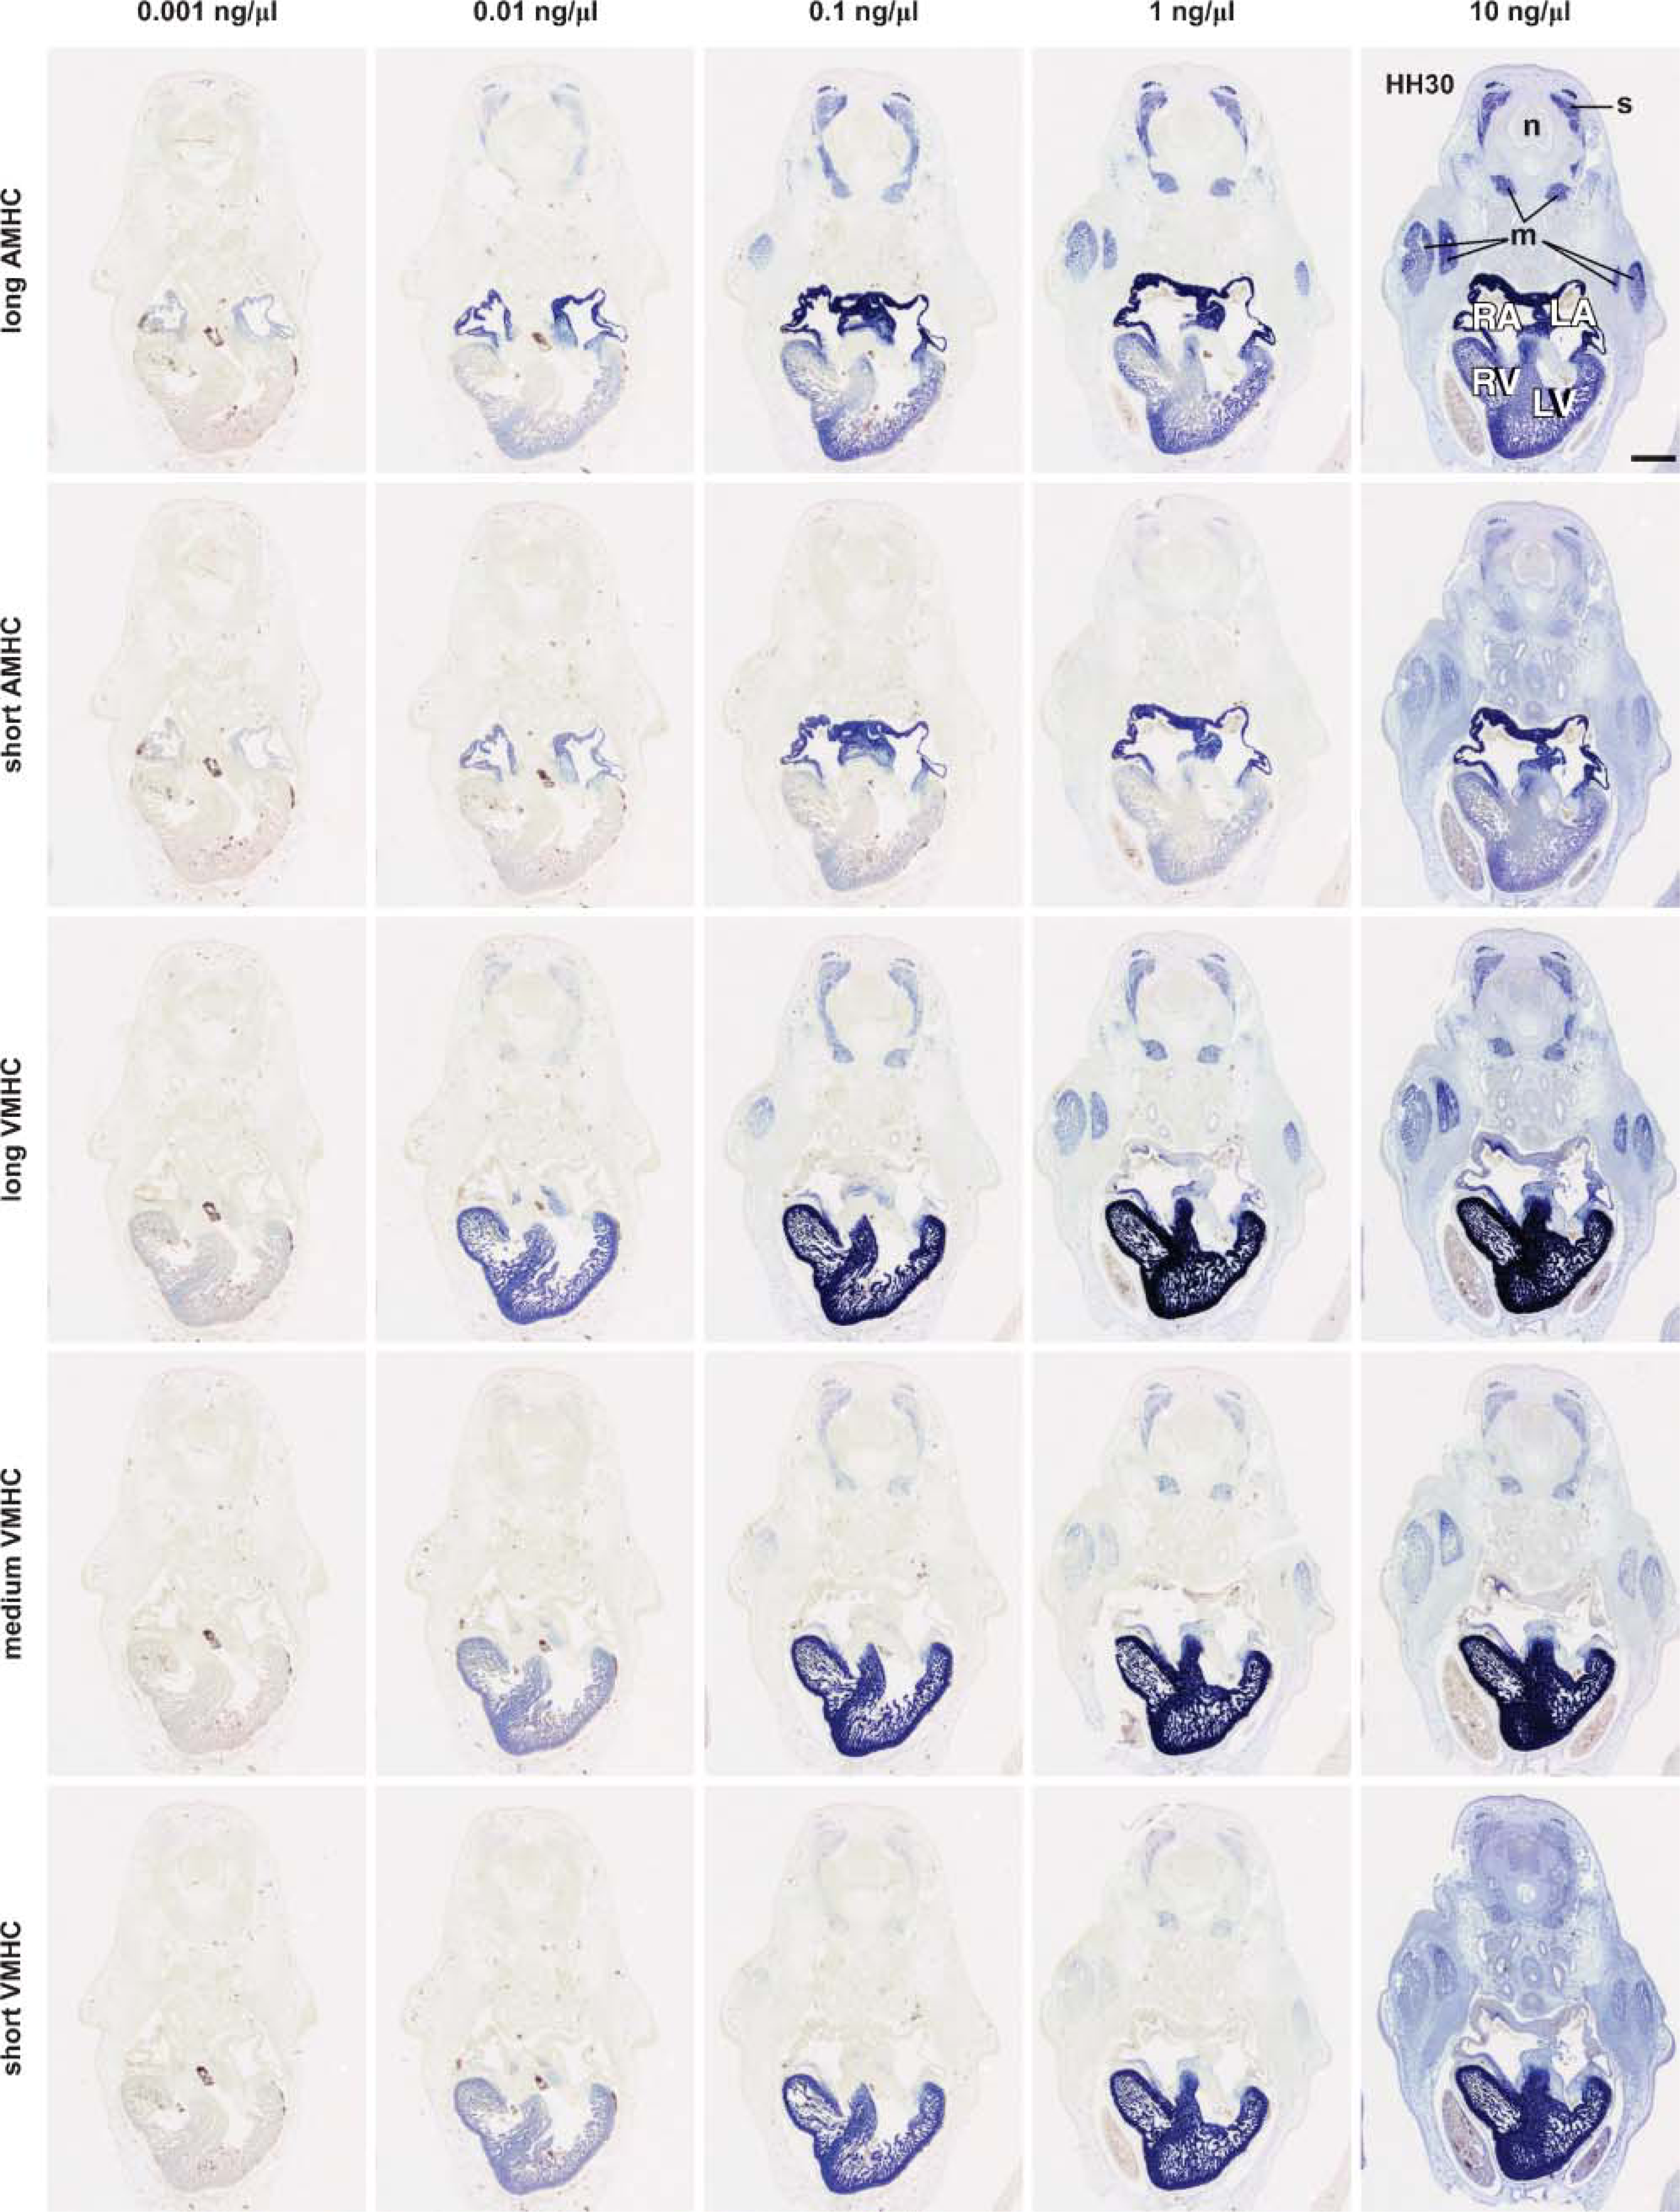
To aid in the interpretation of the different staining intensities and patterns, optical density (OD) measurements were performed in the different parts of the HH30 embryo for the different probes. The measured OD values were plotted against the molar concentration of uridine in each probe in the hybridization mix to normalize for probe length and sequence differences (Figures 3A, 3C-3E).
To assess general nonspecific tissue background, the ODs were measured in the neural tube (Figure 3A). Tissue background was found to be low, equal, and constant for all five probes up to 1 mM uridine (average ± SD: 0.053 ± 0.006). At a uridine concentration of 10 mM, the measured OD values are significantly (p<0.01) higher than those in the average tissue background for the five different probes. From these observations, we inferred that the OD values obtained at probe concentrations higher than 1 mM uridine are the result of nonspecific binding of probe to tissue and should not be used. Therefore, this probe concentration was omitted from further analysis.
The tissue background measured in the respective sections was subtracted from the OD values measured in the atrial and ventricular myocardia and the somites (Figures 3C-3E). To further facilitate the interpretation of the graphs, two dashed lines were added. The lower dashed line identifies the OD level above which the OD values are significantly higher than tissue background (p<0.01), and the upper dashed line (at OD 0.8) identifies the level above which it is technically impossible to measure reliable OD values because of saturation of the staining.
The staining intensity observed in the atria (Figure 3C), using the different probes and probe concentrations, showed that both AMHC probes significantly stain the atria at the lowest concentration tested (0.001 mM). This staining increases in log-linear fashion, with the staining intensity of the long AMHC probe becoming saturated at the highest concentration. None of the three VMHC probes significantly stains the atria at the tested concentrations, except for the long VMHC probe at the highest concentration. The low expression level of the long VMHC probe could not be reproduced (see next section; Figure 3F) which suggests that the atrial concentration of VMHC mRNA is at the detection limit of the non-radioactive in situ hybridization procedure or that VMHC mRNA expression is restricted to small regions in the atria. The latter idea is in line with the very low expression level (4% of the ventricular level) found in the quantitative PCR analysis (Figure 1E).
Effect of different probe concentrations and probe lengths on the staining pattern on sections of HH30 chicken embryos. In one single in situ hybridization session, all sections were treated uniformly, except that the probe concentration of the five differentprobes ranged from 0.001 to 10ng/μl in the hybridization mix. The serial sections were 12 μm thick and prepared from one HH30 embryo. The staining time of all sections was 16 hr. The probes used in this analysis are specified in Figure 1B. Abbreviations: LA, left atrium; LV, left ventricle; m, skeletal muscle; n, neural tube; RA, right atrium; RV, right ventricle; s, somite. Bar = 500 μm.
Optical density (OD) measurements of the staining intensities measured in serial sections of HH30 embryo (Figure 2 and Figure 4). In all graphs, the measured OD values are plotted on the y-axis. These OD values are plotted against the logarithm of the normalized probe concentration, being the molar concentration of uridine molecules in the probe in the hybridization mix (
In ventricular myocardium (Figure 3D), all three VMHC probes showed already-significant staining at the lowest concentration tested (0.001 mM), after which the staining increased in log-linear fashion. However, the staining becomes already saturated at 0.1 mM using the long probe and at 1 mM using the medium probe. The short probe does not reach saturation. AMHC can also be detected in ventricular myocardium but is expressed at a much lower level than in atrial myocardium. The long AMHC probe does not show significant staining at the lowest concentration, but becomes significant at 0.01 mM and increases subsequently in log-linear fashion. As expected, the graph obtained for the short AMHC probe is shifted one magnitude to the right, reflecting the almost 10-fold size difference between the long and short AMHC probes. These observations are in agreement with the quantitative PCR analysis (Figures 1E and 1F).
Because the expression of AMHC and/or VMHC mRNA in the somites is a point of controversy, we analyzed the staining intensity of all probes in the somites (Figure 3E). Both the long AMHC and VMHC probes start to show significant staining at a concentration of 0.01 mM. Using the medium or short VMHC probe, the staining becomes significant at 0.1 mM, whereas the short AMHC probe does not reach significant staining levels at any of the concentrations tested. These observations suggest that both AMHC and VMHC mRNA are expressed in the developing somites, but at very low levels. This conclusion is underscored by the observation of very low mRNA levels of AMHC and VMHC observed in the quantitative PCR analysis (Figures 1E and 1F).
Effect of Color Development Time on the Staining Pattern
The staining intensity and pattern are dependent not only on the uridine concentration in the probe but also on the staining time used to allow the DIG-bound AP to convert its chromogenic substrate into a visible precipitate. To test the effect of different staining times, an in situ hybridization experiment was performed, in which all HH30 serial sections were hybridized with a probe at a concentration of 1mM uridine but in which the staining times were varied from 1 to 128 hr. As expected, longer staining times resulted in more-intense staining for each of the five probes (Figure 4). Again, to aid in the interpretation of the staining intensities and patterns using the different probes, OD measurements were obtained in different tissue components and plotted against the staining time (Figures 3B, 3F-3H).
To assess the effect of prolonged staining times on the development of tissue background, the OD values of the neural tube were determined at the different time points (Figure 3B). The OD values were low, equal, and constant for all probes up to 16 hr of staining (average ± SD: 0.051 ± 0.004), after which they were found to gradually increase, depending on the probe length. The long probes showed the highest tissue background (Figure 3B). Because of this occurrence of nonspecific tissue background at staining times longer than 16 hr, these data were excluded from further analysis. In the graphs of the background-corrected OD values (Figures 3F-3H), we included a dashed line at the level above which the values are significantly higher than background (p<0.01) and a second dashed line (at OD 0.8) to identify the level above which the measurements are technically no longer reliable.
In atrial myocardium, both the short and long AMHC probes show significant staining intensity after 1 hr of staining, after which the staining intensities increase in log-linear fashion (Figure 3F). The staining of the long AMHC probe becomes saturated after 4 hr. With the VMHC probes, the OD values never reach significance in atrial myocardium (Figure 3C). As stated above, this absence of staining is in line with the very low levels of VMHC mRNA found in the quantitative PCR analysis, and appears to be too low to be detected by the non-radioactive in situ hybridization procedure.
The staining intensities found in the ventricular myocardium with either of the three VMHC probes revealed OD values significantly higher than those of tissue background (Figure 3G) after staining for only 1 hr. The staining intensity of the short VMHC probe increases in log-linear fashion up to 16 hr of staining, whereas the staining intensities using the medium and long VMHC probes become saturated after 8 and 2 hr, respectively. The expression levels of AMHC in the ventricle are much lower than the levels of VMHC. This is reflected by the observation that the OD values using the long AMHC probe required staining for 2 hr to become significantly higher than tissue background, whereas the short AMHC probe required staining times of 4 hr and longer. With prolonged staining times, the staining intensity increases in log-linear fashion for both AMHC probes.
In the somites, both the long AMHC and VMHC probes show low but significant staining after 1 hr (Figure 3H). The intensity of the staining gradually increased with longer staining times. The medium VMHC probe showed a staining intensity at tissue background level for up to 4 hr, whereas both short probes required 16 hr of staining to exceed background level. Taken together, these observations suggest that both AMHC and VMHC mRNA are expressed in the developing somites at low but similar levels.
Expression Patterns of AMHC and VMHC mRNAs during Heart Development
The experiments described in the previous sections show that nonspecific probe binding and background staining can be avoided with a probe concentration equivalent to 1 mM uridine and a staining time of 16 hr. Under these conditions, the observed staining results can be interpreted as being specific for the used probes, and were, therefore, used to examine the patterns of expression of AMHC and VMHC on whole-mount embryos (Figure 5) and on sections (Figure 6). Because the aim of the present experiments was to establish the expression patterns, we used the long AMHC and VMHC probes. For comparison, the entire myocardium present in the developing heart was visualized using a probe to cardiac Troponin I (Figures 5A-5E).
At the linear heart tube stage (HH11), AMHC mRNA is expressed at high levels in the myocardium of the inflow tract and at low levels throughout the myocardium of the heart tube (Figures 5A and 5F). When chamber formation is well under way at HH16, AMHC mRNA is expressed at high levels in the atrial myocardium and at low levels in the remainder of the heart, with slightly higher expression in the myocardium of the OFT (Figures 5G and 5H; 6A). Just prior to septation at HH25, AMHC mRNA is detected at the highest level in the atria, at a lower level in the distal OFT myocardium, and at very low level or absent from the ventricles using whole mounts (Figure 5I). Serial sections confirm these observations and show that AMHC mRNA is expressed at very low levels in the trabeculae (Figures 6C and 6E). At the end of septation (HH30), whole-mount in situ hybridization suggests that the expression pattern is similar to that found at HH25 (Figures 5I and 5J). Serial sections show that AMHC mRNA is not restricted to the forming atria but is also expressed in the forming myocardial sleeves around the pulmonary (not shown) and caval veins (Figure 6E). Outside the heart, AMHC expression is observed at low levels in the somites and forming skeletal muscles (Figures 5G and 5H).
VMHC mRNA (Figures 5K-5O) is expressed throughout the entire myocardial component of the forming conditions used, the staining of the ventricles is saturated, it is clear that the expression levels in the atria are lower at HH16 (Figure 6B) and HH25 (Figure 5N and Figure 6D). Moreover, at HH16, VMHC mRNA is detected in the somites (Figures 5L and 5M). Whole-mount analysis shows that at HH30, VMHC mRNA is expressed abundantly in the ventricles and OFT and that it is almost absent from the atrial myocardium (Figure 5O). Serial sections show that the VMHC mRNA is not homogeneously expressed at low levels in the entire atrial myocardium, but that it is expressed only in the myocardial component of the venous valves, in the myo-cardial cap on top of the fused atrioventricular canal (AVC) cushions, and in the cardiomyocytes forming the muscular atrioventricular canal septum. VMHC mRNA is absent from the trabeculated and smooth-walled dorsal atrial myocardium (Figure 6F). The low expression level of VMHC found in the quantitative PCR (Figure 1F) is, therefore, due to the fact that small parts of the atria express VMHC and might also underlie the finding that that OD values measured at a probe concentration of 1 mM uridine and a staining time of 16 hr are not reproducibly higher than background (Figure 3C).
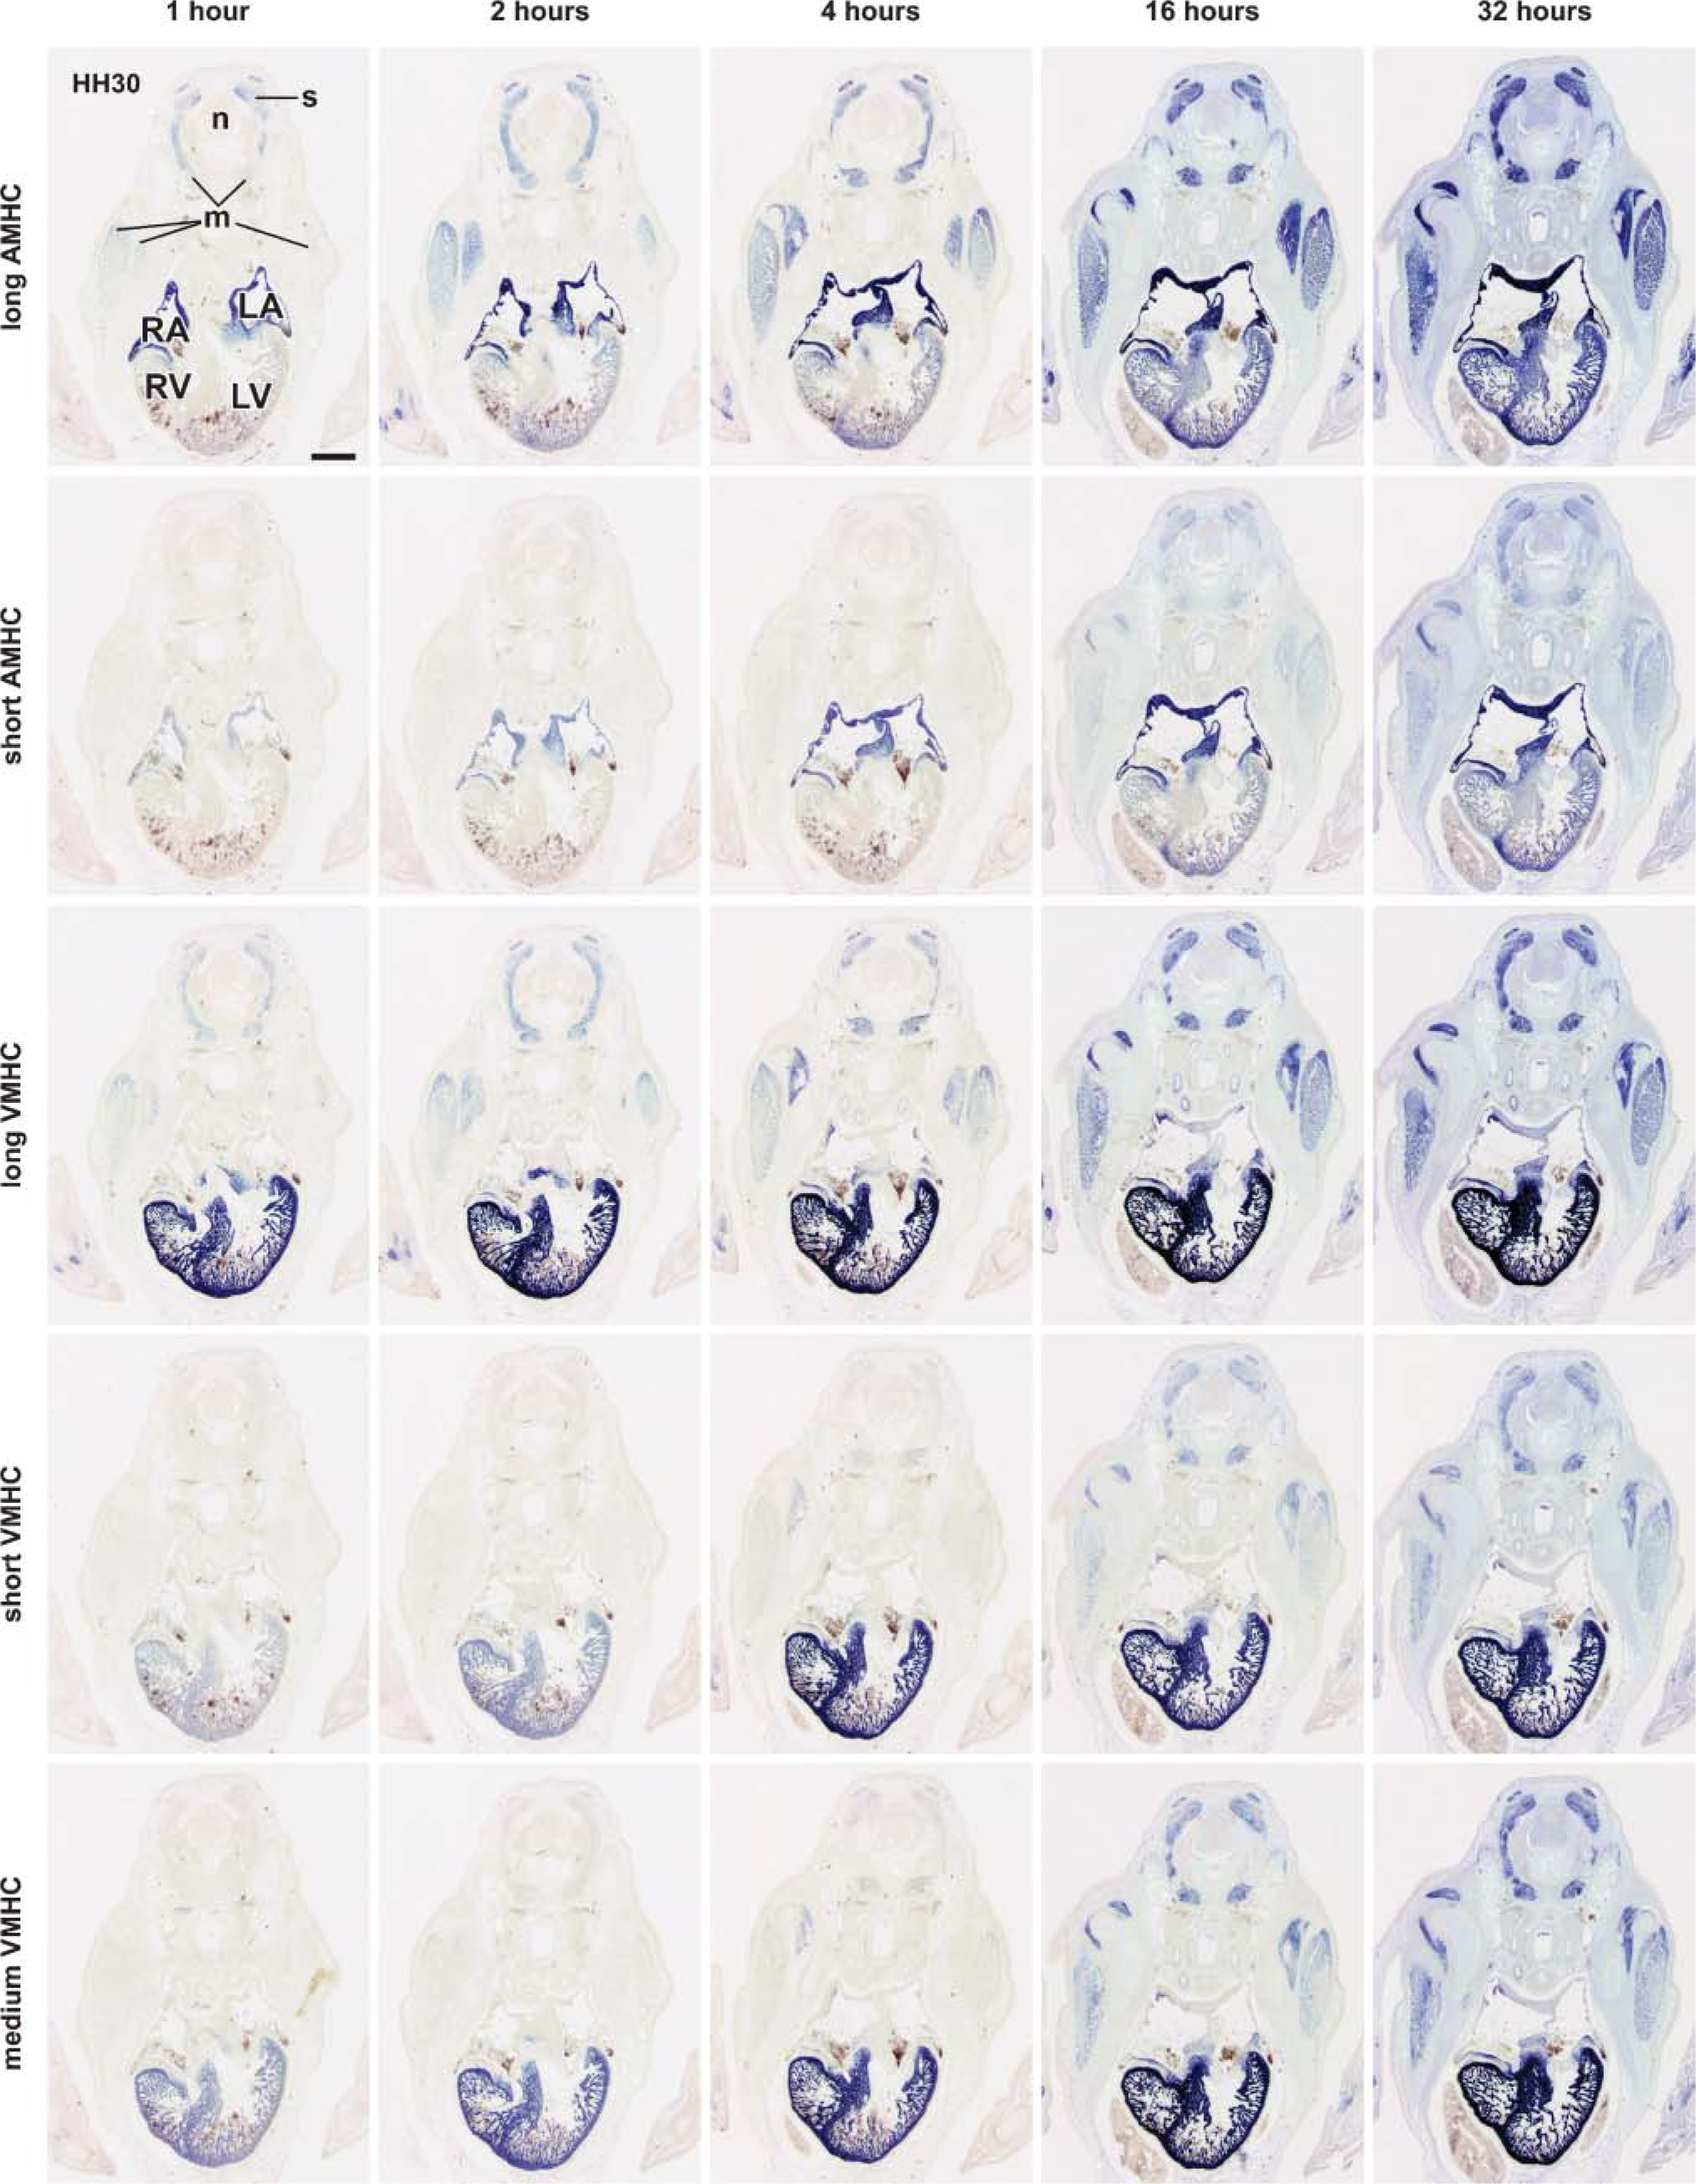
Effect of different staining times on the staining pattern on sections of HH30 chicken embryos. In one single in situ hybridization session, serial sections of HH30 chicken embryos were processed in parallel, with a probe concentration of 1 mM uridine in each of the five different probes in the hybridization mix. At the end of the hybridization experiment, the staining reaction was initiated on all sections, and after various incubation times, the reaction was stopped. The staining patterns obtained at 64 and 128 hr of staining are not shown. The probes used in this analysis are specified in Figure 1B. Abbreviations: LA, left atrium; LV, left ventricle; m, skeletal muscle; n, neural tube; RA, right atrium; RV, right ventricle; s, somite. Bar = 500 μm.
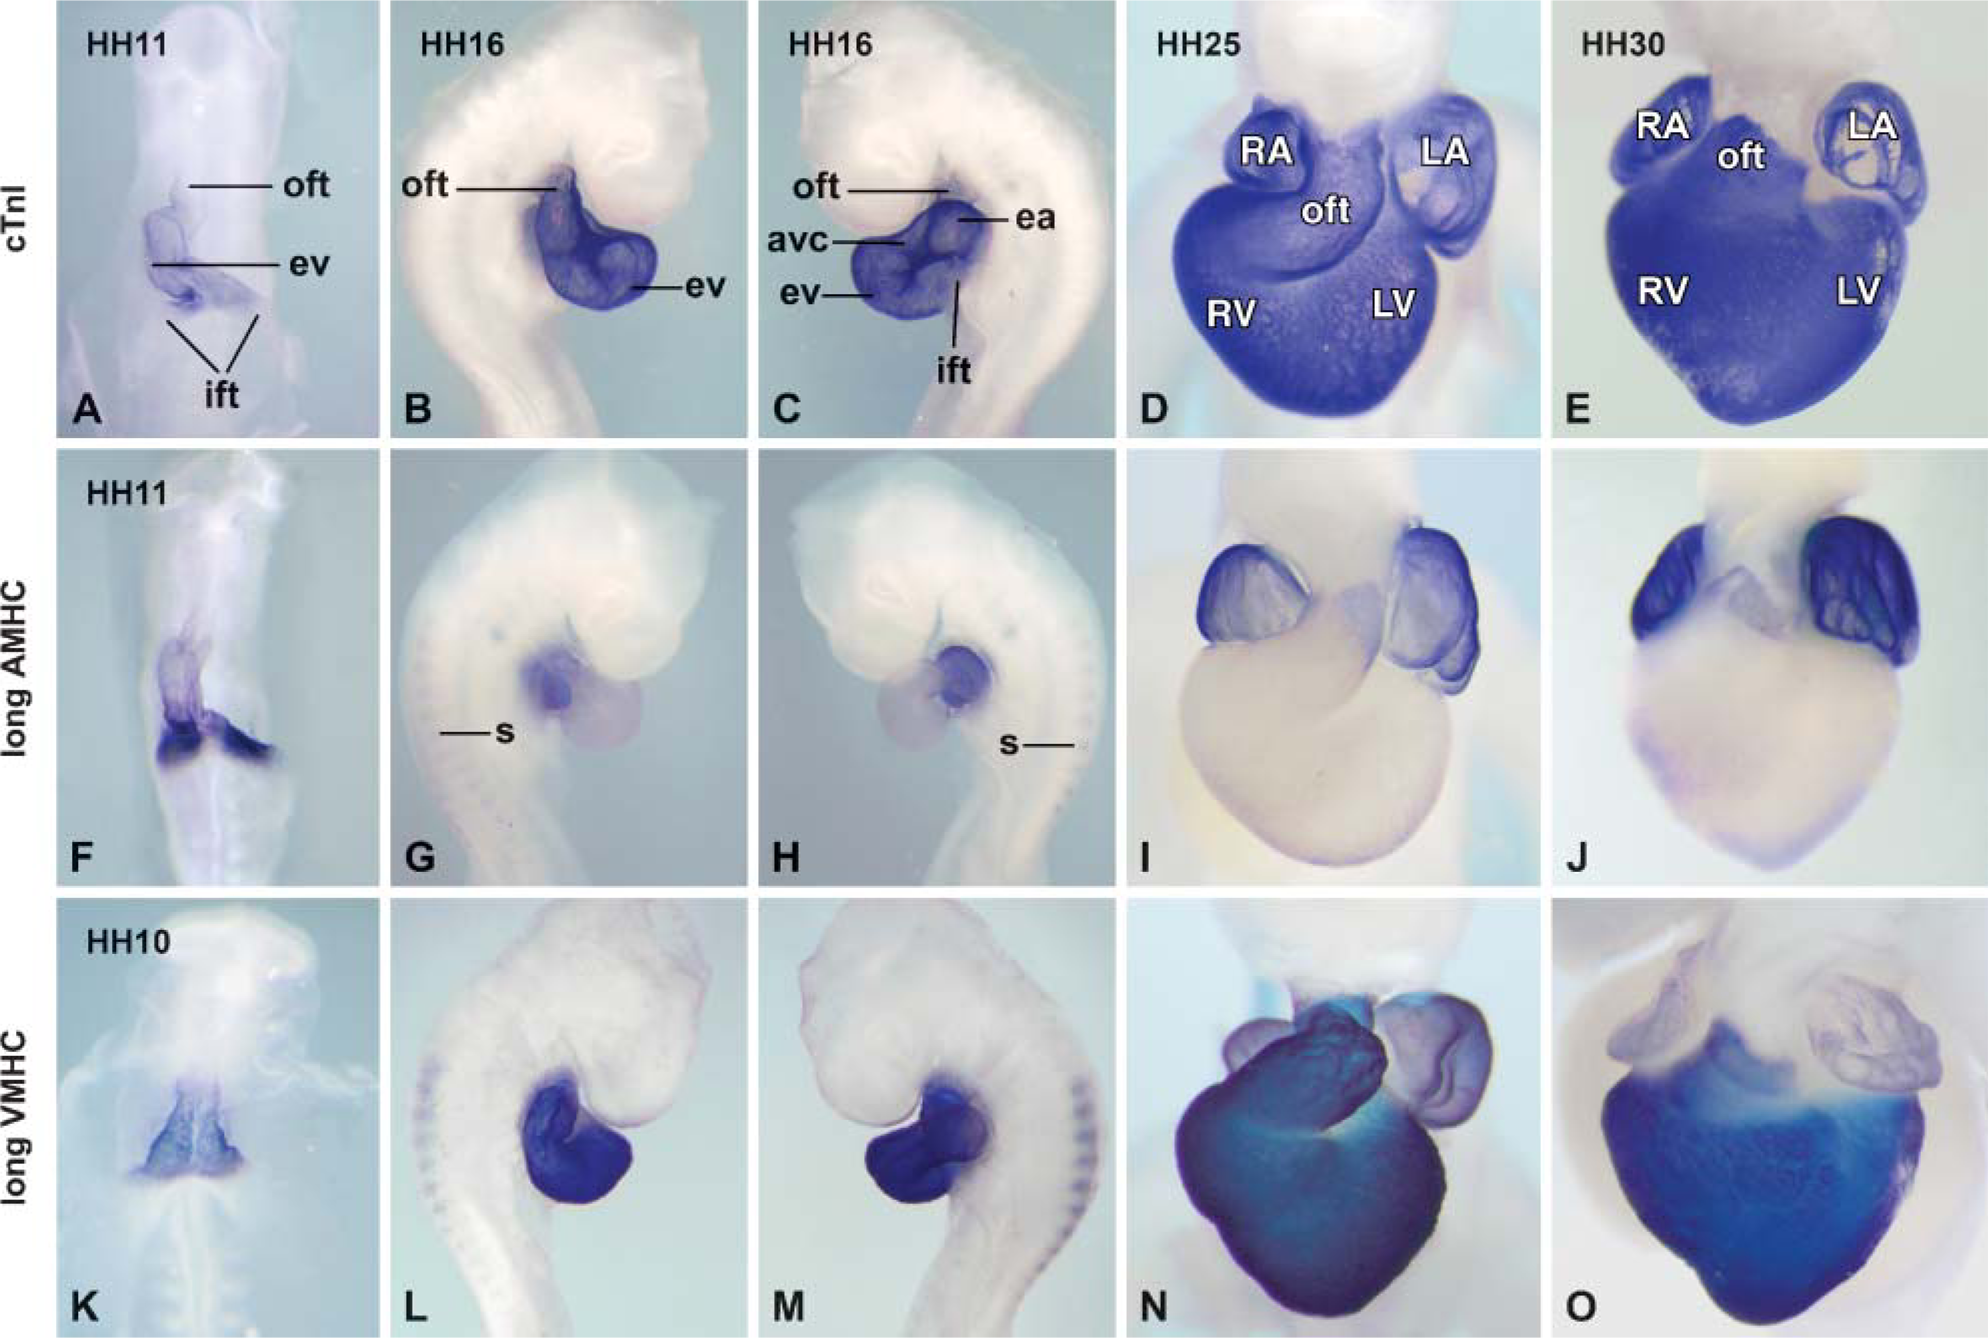
Whole-mount in situ hybridization analysis showing the staining pattern at different developmental stages ranging from HH10 to HH30 using the cardiac Troponin I (cTnI)probe (
Discussion
The molecular mechanism underlying induction and formation of the atrial and ventricular chambers within the linear heart has been a topic of discussion for several decades. The expression of MHC genes has been extensively used to describe the formation of the cardiac chambers (Sartore et al. 1978; Sanders et al. 1984; de Jong et al. 1987,1990; Yutzey et al. 1994; Agarkova et al. 2000; Siedner et al. 2003; Narolska et al. 2005). With the identification of chamber-specific/enriched transcription factors, the expression patterns of the MHC genes gained a renewed interest, especially when ectopic expression of these transcription factors is involved in the regulation of the gene expression program related to the forming atrial or ventricular chambers (Yutzey et al. 1994; Bao et al. 1999; Morkin 2000; Berdougo et al. 2003; Miller et al. 2003; Wick et al. 2003; James et al. 2005). The most widely used MHC species are atrial, ventricular, and cardiac MHC (AMHC, VMHC, and CMHC, respectively). AMHC is frequently used as a marker for atrial chamber formation, VMHC as a marker for ventricular chamber formation, and CMHC as a marker for heart muscle cell formation. However, controversies persist; some authors continue to claim that AMHC and VMHC are restricted to their cardiac compartments from the outset, whereas others suggest that AMHC and VMHC are initially expressed throughout the entire heart tube and later become progressively restricted to their specific cardiac compartments (de Jong et al. 1988b; Yutzey et al. 1994; Oana et al. 1998; Bao et al. 1999; Croissant et al. 2000). CMHC was claimed to be expressed exclusively in the cardiomyocytes at all developmental stages, whereas AMHC and VMHC were reported to be also expressed to various extents outside the developing heart in the developing somites and skeletal muscles (Oana et al. 1998; Croissant et al. 2000). The current sequence comparison shows that the reported CMHC cDNA clone is not encoded by a separate MHC gene but is in fact the 5′ portion of the VMHC gene. This conclusion was further underscored by the PCR and sequence analysis. Moreover, analysis of its expression pattern showed the pattern of CMHC to be similar to that of VMHC. Therefore, CMHC cannot be considered to be a unique marker for all forming heart muscle cells.
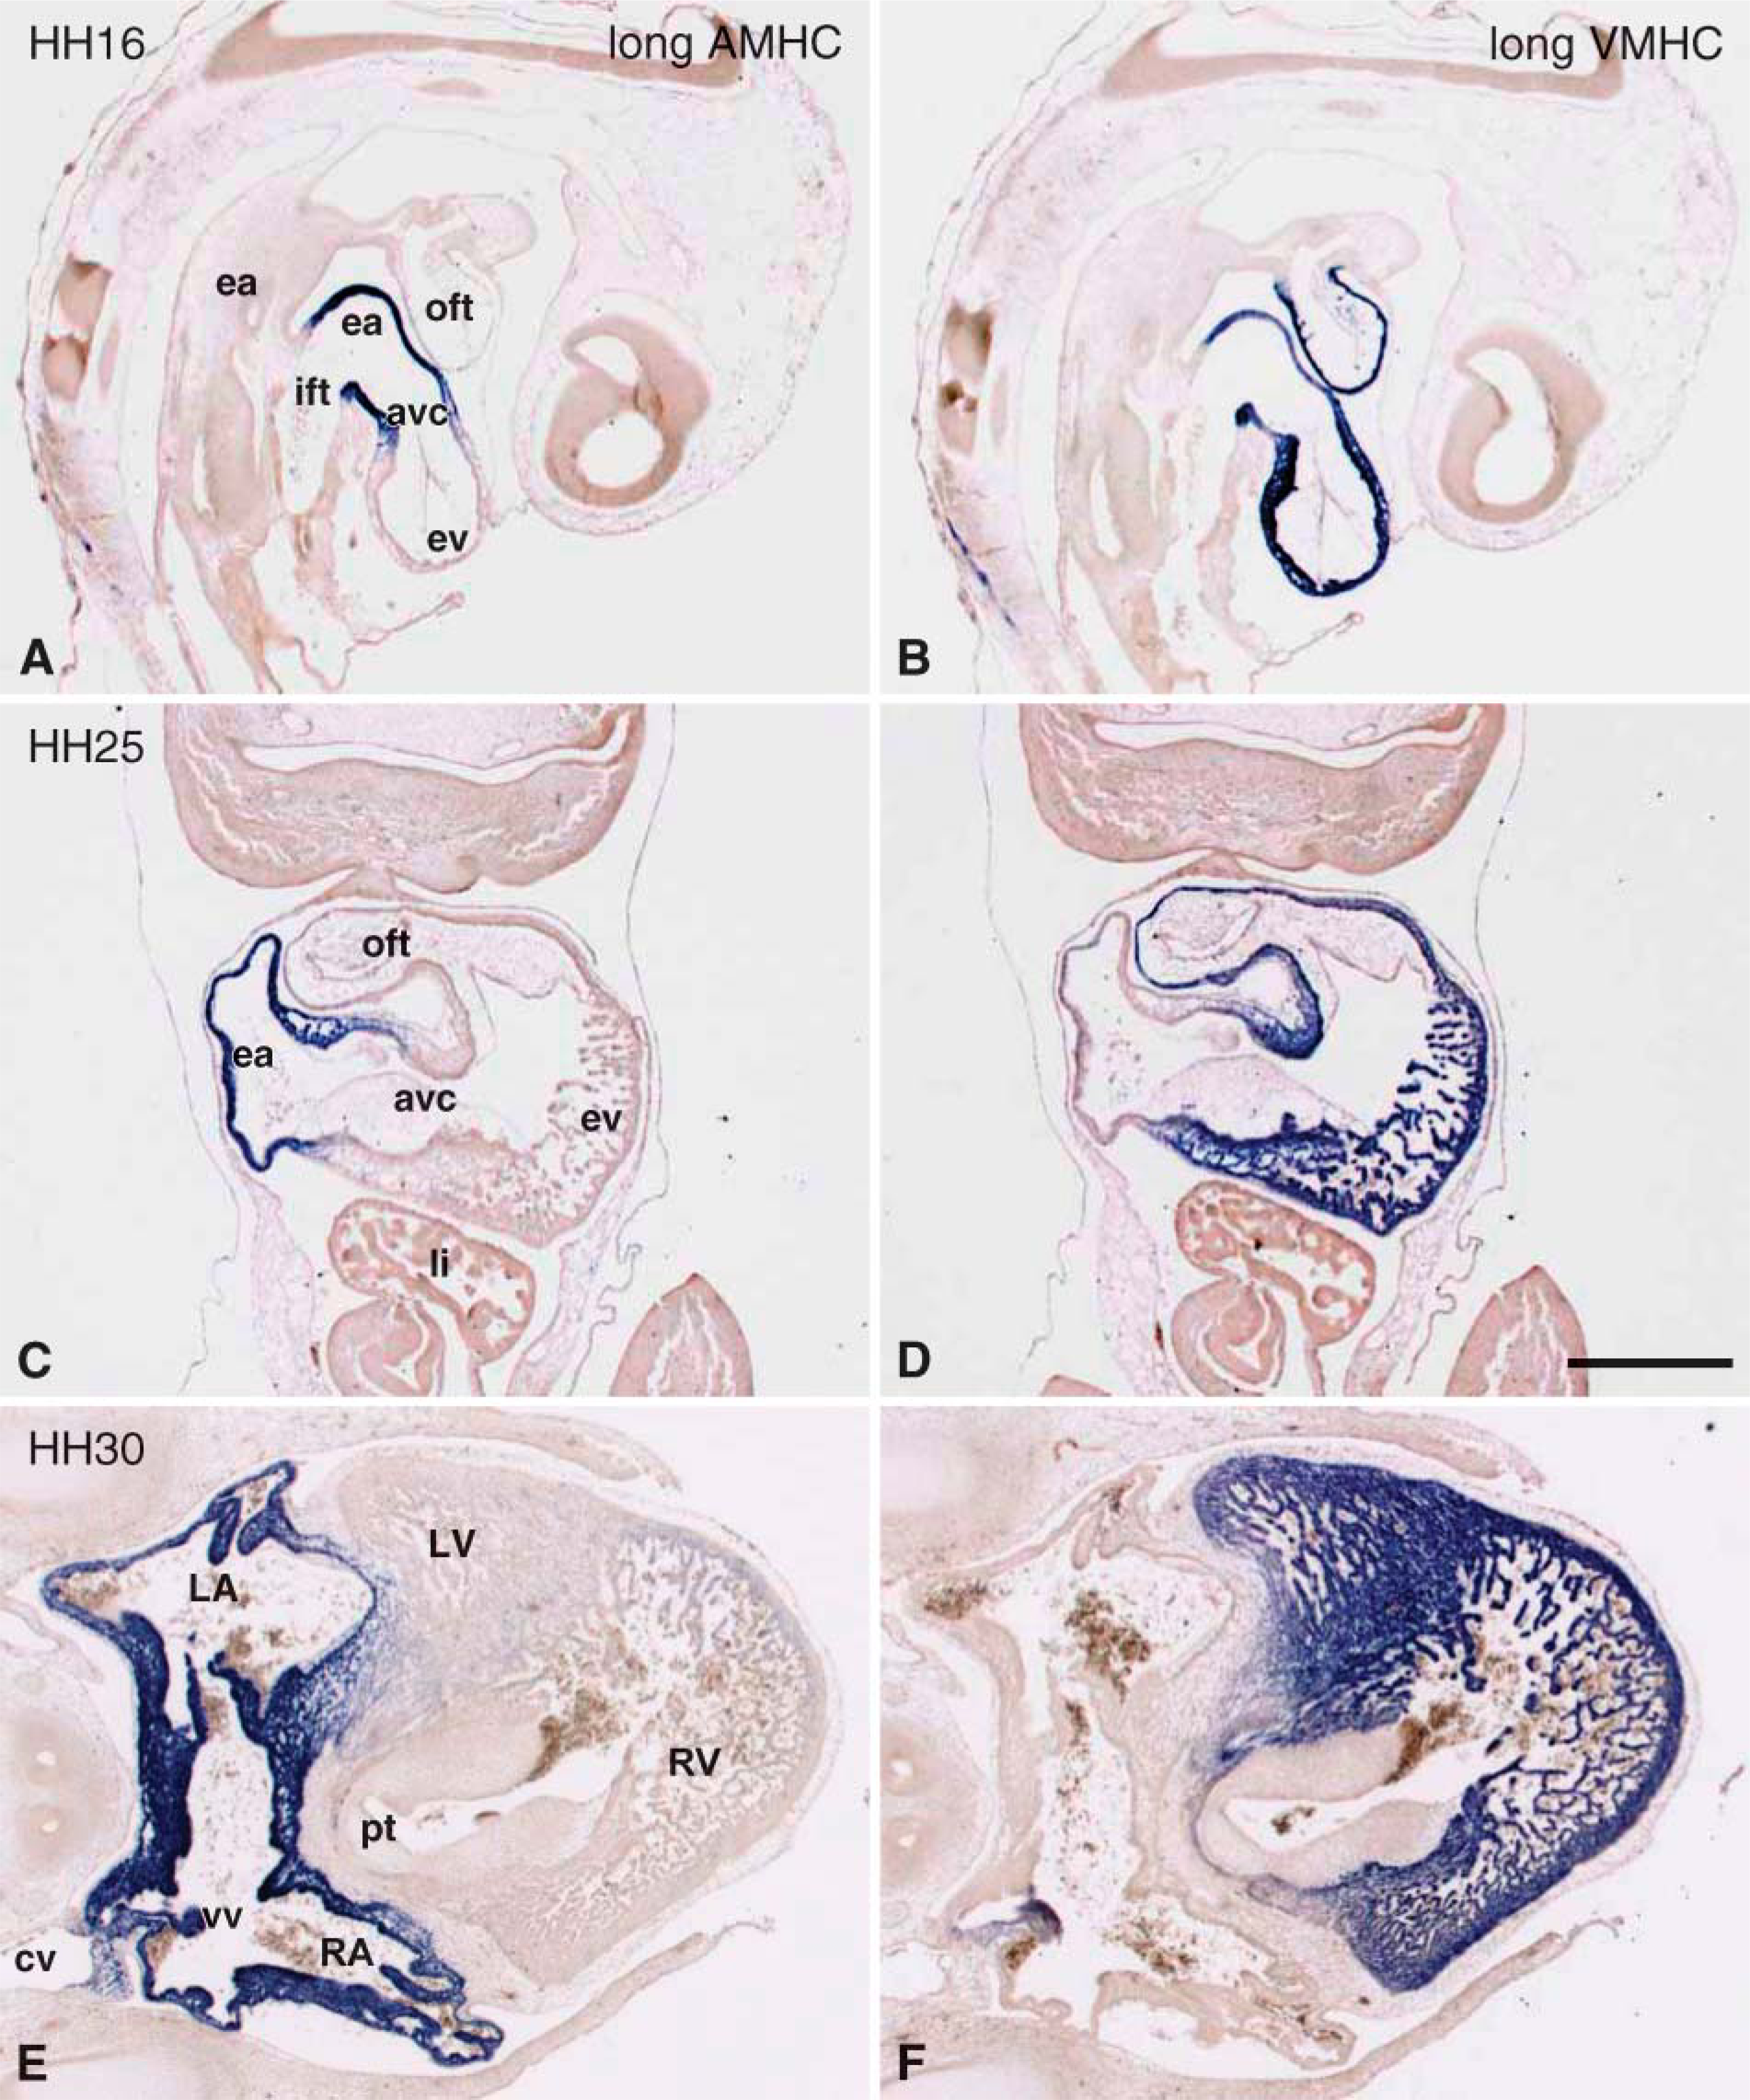
In situ hybridization analysis on serial sections showing the staining pattern at HH16, HH25, and HH30 using the long AMHC probe (
From a developmental view, it is important to know whether a gene is initially expressed in all cardiomyocytes and subsequently downregulated in specific compartments or whether it has never been expressed in the heart tube and needs to become transcriptionally activated in a specific compartment. Activation of a gene that is expressed at low levels might, in its most simple option, be an activation of a rate-limiting transcription factor or a downregulation of a potent inhibitor, whereas induction of a gene in a compartment in which it has never been expressed may require genomic remodeling before it can become transcribed. In a developmental context, therefore, it is of crucial importance to resolve the controversies concerning the pattern of expression of MHCs in the developing heart.
Strengths and Limitations of the Non-radioactive In Situ Hybridization Procedure
Our comparison of the AMHC and VMHC sequences showed that the overall identity between AMHC and VMHC was less than 70% and that there are no stretches of 50 nt showing 100% identity, which is sufficiently low to prevent cross-hybridization between the MHC species under the hybridization conditions in the in situ hybridization procedure (Moorman et al. 2000,2001).
It has been argued that differences in the in situ hybridization procedure might underlie the reported differences in the patterns of expression of AMHC and VMHC mRNA during cardiac development. Therefore, VMHC and AMHC probes of different lengths were prepared and used to determine the developmental patterns of expression of AMHC and VMHC mRNA using different probe concentrations (Figure 2 and Figure 3) and staining times (Figure 3 and Figure 4).
The current analyses revealed that independent of the length of the probe used, nonspecific probe binding and background staining can be avoided when the uridine concentration of the probe in the hybridization mix does not exceed 1 mM and the staining time does not exceed 16 hr. Moreover, using probes of different lengths, we observed that longer probes, which contain more unique sequences, have a higher sensitivity but reach the maximum optical density more quickly than do shorter probes. Short probes compensate for their lower sensitivity with a large dynamic range. Thus, when the mere expression of a gene in different tissues needs to be established, unique sequences should be included into the probe as much as possible and the sections should be stained for 16 hr. However, when the aim is to establish the pattern of expression and relative differences between levels of expression of a gene of interest in different tissues, various staining times need to be evaluated to asses the time at which the staining becomes saturated, evidenced by an OD higher than 0.8 (see Figures 3F and 3G).
The observation that increasing probe concentrations lead to increasing staining intensity for most probes (Figures 3C-3E) indicates that at these probe concentrations, not all target molecules in the sections, have hybridized. Therefore, the probe concentration, not the target availability, is the limiting factor in nonradioactive in situ hybridization, in contrast to the recommendations for radioactive in situ hybridization (Jonker et al. 1997). The discrepancy may be related to the small probe sizes that are needed in radioactive in situ hybridization (Moorman et al. 2001). For the quantitative radioactive in situ hybridization procedure, a probe concentration of 15 pg/μl, almost 100-fold lower than in the current study, was found to lead to saturated hybridization (Jonker et al. 1997). This discrepancy in required probe concentrations signifies that the hybridization efficiency of the DIG-labeled probes used in the current study is much lower than the hybridization efficiency of the probes labeled radioactively. Saturating probe concentrations cannot be used in non-radioactive in situ hybridization because concentrations higher than 1 mM uridine, which is equivalent to ∼1 ng/μl, were found to lead to a significant increase of nonspecific tissue background. This necessitates that for the analysis of high target concentrations, e.g., VHMC and AMHC RNA in the ventricle and atria, respectively, non-radioactive in situ hybridization will always be carried out with limiting probe concentrations. Note that increasing the hybridization time may lead to complete hybridization. This is, however, not recommended, because in that situation, it is still the probe concentration, not the target availability, that determines the signal intensity.
The OD levels observed for the expression of AMHC in the ventricular myocardium, using the long AMHC probe (Figure 3D), and for the expression of AMHC and VMHC in the somites, using the long AMHC or VMHC probes, do not increase as steeply at 0.1 and 1 mM uridine as at the lower concentrations. This observation suggests that at these higher probe concentrations, the limited target availability determines the staining intensity in these tissues. Such a titration of tissue-bound targets with different probe concentrations, and a further analysis of the kinetics of incomplete hybridization, may open an alley into the quantitative interpretation of staining intensities in non-radioactive in situ hybridization.
Expression Pattern of AMHC
In the linear heart tube, AMHC mRNA is expressed in a steep gradient, which is highest at the inflow tract (Figure 5F). This observation is in line with earlier reports using in situ hybridization and immunohistochemistry using monoclonal antibodies specific to AMHC (de Jong et al. 1988b; Bao et al. 1999). At HH16, when formation of the cardiac chambers is well under way, in situ hybridization shows that AMHC mRNA expression is high in the atria and sinus venosus and tapers off in the atrioventricular canal, with very low if any expression in the embryonic ventricle and OFT (Figures 5G and 5H and Figure 6A). These findings were substantiated by quantitative PCR analyses, showing that the level of expression of AMHC mRNA is 8-fold lower in the ventricle and almost 25-fold lower in the OFT than in the atria (Figure 1E). During subsequent development, the expression level of AMHC mRNA increases 4-fold in the atria, 3-fold in the ventricles, and 7-fold in the OFT at HH30 (Figure 1E). In situ hybridization showed that at this stage, AMHC mRNA expression is high in the atria, and mainly restricted to the trabeculations in the ventricular compartment (Figure 6F).
Together, the in situ hybridization and quantitative PCR data suggest that in the ventricle, AMHC mRNA expression is specifically upregulated in the trabecular myocardium and either remains constant or is downregulated in the compact myocardium. In summary, our findings demonstrate that rather than being confined to the atrial compartment from the onset of its expression, AMHC mRNA is initially expressed throughout the entire heart tube and becomes gradually restricted to and upregulated in the atria and trabeculations of the ventricle during development.
Also, with respect to the expression of AMHC mRNA in the forming somites and skeletal muscles, controversy exists (de Jong et al. 1988a,b; Bisaha and Bader 1991; Yutzey et al. 1994; Oana et al. 1998). Here, using in situ hybridization (Figures 5G and 5H) and quantitative PCR (Figure 1E), we show that AMHC mRNA is expressed at low levels in the somites. This conclusion is in agreement with earlier S1-nuclease mapping studies (Oana et al. 1998) and immunohistochemical analyses (de Jong et al. 1988b).
Expression Pattern of VMHC
VMHC mRNA is initially expressed throughout the entire heart tube (Figure 5K). Whole-mount staining of HH16 chicken embryos suggests an equally strong staining throughout the entire heart (Figures 5L and 5M). Analysis of the expression pattern on sections, however, shows that VMHC mRNA is expressed at a lower level in the atria than in the ventricle and OFT (Figure 6B). This finding is in line with the quantitative PCR analysis (Figure 1F). With development, the expression of VMHC mRNA becomes downregulated in most of the atrial myocardium. Significant expression remains in the venous valves, the cap on top of the fused AVC cushions, and the muscular atrioventricular septum (Figure 1F and Figure 6F). This remaining expression accounts for the low level of VMHC mRNA found in the quantitative PCR analysis (Figure 1F). Like AMHC, VMHC mRNA expression was also observed outside the developing heart in the somites and subsequently in skeletal muscle cells (Figure 2, Figure 4, and Figure 5).
In conclusion, this study settles the long-lasting controversies concerning the differences in the patterns of expression of AMHC and VMHC. Both mRNA species are initially expressed throughout the entire heart tube; AMHC shows a steep gradient, with the highest expression at the inflow of the heart, and VMHC is expressed more homogenously. With subsequent development, AMHC becomes restricted predominantly to the atria and VMHC to the ventricles. Outside the heart, both AMHC and VMHC are expressed in the forming somites and skeletal muscle cells, albeit at very low levels. Furthermore, we show in this study that CMHC is not transcribed from a separate gene, but from the VMHC gene. Having settled these issues, it is now possible to focus on the understanding of the molecular mechanisms (i) underlying the initially observed caudo-cranial gradient of expression of AMHC and (ii) regulating the downregulation of AMHC and VMHC gene expression in specific cardiac compartments, rather than on searching for factors that induce the expression of AMHC and VMHC in the other compartments during heart development.
Footnotes
Acknowledgements
S.S., A.C.H., A.A.M.B., A.F.M.M., and M.J.B.vd.H. were financially supported by Netherlands Heart Foundation grant M96.002, and A.T.J.K. was financially supported by IOP Genomics Center grant IGE01019.