
Abstract
Histidine decarboxylase (HDC) and vesicular monoamine transporter 2 (v-MAT2) are involved in the biosynthesis and storage of histamine. DOPA decarboxylase (DDC) is involved in the biosynthesis of a variety of amines and shares a high degree of homology with HDC. HDC and v-MAT2 immunoreactivities (IR) have recently been detected in well-differentiated neuroendocrine tumors (WDNETs) and poorly differentiated neuroen-docrine carcinomas (PDNECs) of various sites and have been proposed as general endocrine markers. We evaluated HDC and v-MAT2 IR in a series of 117 WDNETs and PDNECs from different sites. Western blotting analysis was performed to verify the specificity of anti-DDC and anti-HDC antibodies. Real-time RT-PCR was performed using specific probes for HDC and DDC on 42 cases, examined also for DDC IR. HDC and v-MAT2 IR were observed in the majority of WDNETs and PDNECs of all sites and HDC-IR cases were always also DDC-IR. In contrast, high levels of HDC mRNA were detected only in the gastroenteropancreatic WDNETs, which did not show increased DDC mRNA levels. On the other hand, bronchial carcinoids and lung PDNECs showed high DDC mRNA levels, but nearly undetectable HDC mRNA levels. Western blotting analysis showed a cross-reaction between anti-HDC and anti-DDC antibodies. HDC should not be considered as a general endocrine marker and HDC IR in bronchial carcinoids and PDNECs of the lung can probably be attributed to a cross-reaction with DDC.
Keywords
N
In the last few years, the availability of antibodies directed against HDC and v-MAT2 has provided useful tools for the detection of the histaminergic phenotype in normal and neoplastic neuroendocrine cells (Erickson et al. 1996; Dartsch et al. 1999). In particular, it has been demonstrated that v-MAT2 and HDC are specific markers of gastric enterochromaffin-like (ECL) cells, which are known to produce histamine (Dartsch et al. 1999; Eissele et al. 1999; Rindi et al. 2000). Recently, an IR for HDC and v-MAT2 has been detected in NETs other than ECL cell tumors, such as bronchial and intestinal carcinoids, medullary carcinoma of the thyroid, pheochromocytoma, pancreatic NETs, and small-cell lung carcinoma (SCLC) (Jakobsen et al. 2001; Graff et al. 2002; Matsuki et al. 2003; Tanimoto et al. 2004). As a consequence, both v-MAT2 and HDC have been proposed as markers of neuroendocrine differentiation, in addition to traditional general neuroendocrine markers such as synaptophysin, chromogranins, neuron-specific enolase, etc.
HDC belongs to a family of pyridoxal-5′-phosphate (PLP)-dependent decarboxylases and, as such, it shares a large PLP-dependent domain with other enzymes including DOPA decarboxylase (DDC) (Rivera et al. 2000). DDC is a key enzyme in the biosynthesis of dopamine, serotonin, and catecholamines, all known to be produced in normal and neoplastic neuroendocrine cells (Solcia et al. 2000; Medina et al. 2003). To date, no conclusive gene expression analysis of HDC and DDC has been performed on a large series of NETs, and no validation of the immunohistochemical (IHC) results reported above is currently available.
The aims of this study were (a) to evaluate the expression of HDC, DDC, and v-MAT2 proteins in both well-differentiated NETs (WDNETS) and poorly differentiated neuroendocrine carcinomas (PDNECs) using IHC; (b) to verify the specificity of the anti-HDC antibody using Western blotting analysis; and (c) to quantify HDC and DDC mRNA expression levels using a real-time RT-PCR assay in a subset of NETs, using archival paraffin-embedded tumor tissues.
Materials and Methods
Patients and Samples
One hundred and seventeen NETs from 117 patients who underwent surgical or endoscopic resection between 1982 and 2004 were obtained from the files of the Section of Anatomic Pathology, Department of Human Morphology, University of Insubria-Ospedale di Circolo, Varese, Italy and the Section of Anatomic Pathology of the European Institute of Oncology, Milan, Italy. Fifty one tumors were WDNETs (9 gastric, 5 ileal, 9 pancreatic, 7 bronchial, 6 adrenal pheochromocytomas, 12 extra-adrenal paraganglioma, and 3 thyroid medullary carcinomas) and 66 were PDNECs (11 colorectal, 11 gastric, 6 esophageal, 13 small-cell and 8 large-cell pulmonary, 4 prostatic, 3 urinary bladder, 6 cutaneous Merkel cell, 1 cervical, 1 endometrial, 1 parotid gland, and 1 rhinopharyngeal).
In addition, a panel of normal tissues was selected to provide normal controls for molecular analysis. In detail, samples from 7 gastric oxyntic mucosae, 5 ileal mucosae, 7 pancreata, and 17 lungs were selected from 36 different patients who underwent surgery for diseases unrelated to NETs.
Table 1 shows the clinicopathological features of the 117 NETs, which were diagnosed and classified according to WHO criteria (Solcia et al. 2000), including the use of IHC stainings for general (synaptophysin, neuron-specific enolase, CD56, and chromogranin A) and specific (peptides and monoamines) neuroendocrine markers.
Immunohistochemistry
IHC looked at the expression of HDC and v-MAT2 in the 117 NETs and of HDC in the 36 normal tissues. Moreover, the tumor and normal samples analyzed with quantitative real-time RT-PCR were also studied with the anti-DDC and the anti-c-Kit (CD117) antibody. c-Kit is a marker for mast cells, known to express HDC but unidentifiable with anti-HDC antibodies (Dartsch et al. 1999).
IHC was performed on 3-μm-thick sections obtained from paraffin blocks and collected on poly-L-lysine-coated slides using the standard ABC-peroxidase technique. The primary antibodies employed were polyclonal anti-HDC (Eurodiagnostica; Malmö, Sweden) raised in rabbit against human recombinant HDC produced in Escherichia coli, working dilution 1/4000; polyclonal anti-v-MAT2 (Chemicon; Temecula, CA) raised in rabbit against a synthetic peptide from the intracellular C-terminal region of human v-MAT2, working dilution 1/500; polyclonal anti-DDC antibody (United States Biologicals; Swampscott, MA) raised in rabbit against human recombinant DDC produced in E. coli, working dilution 1/1000; and polyclonal anti-c-Kit (CD117) (Dako; Copenhagen, Denmark) raised in rabbit against a C-terminal peptide (amino acids 963-976), working dilution 1/100. Before incubating with anti-HDC, anti-DDC, and anti-c-Kit antibodies, antigen retrieval was performed by heating the sections in a microwave oven for 10 min in citrate buffer at pH 6.
As for the anti-v-MAT2 antibody, specificity controls consisted of the absorption with 10-20 nM of the related antigen, the omission of the first layer, and the use of control tissue known to bear or not to bear the antigen. In addition, the sequence of the immunogenic peptide (CTQNNIQSYPI-GEDEESESD) was the same as that used in previous studies (Erickson et al. 1996; Eissele et al. 1999; Jakobsen et al. 2001; Anlauf et al. 2003) in which the antibody specificity was tested by staining transfected cells and by absorption with the immunogenic peptide (Erickson et al. 1996). Moreover, when checked in the BLAST database (http://www.ncib.nlm.nih.gov/BLAST/Blast.cgi), this sequence did not show significant alignments with the sequences of other proteins, v-MAT1 included.
Absorption tests for the anti-HDC and anti-DDC antibodies were performed by the manufacturers, as written on the data sheets.
For evaluation of HDC, DDC, and v-MAT2 IR, a semi-quantitative score was used and the percentage of IR neoplastic cells was estimated. A case was scored as positive when at least 5% of neoplastic cells were IR. The number of mast cells was indicated as the number of c-Kit IR mast cells × 10 high power fields (HPF) (X400).
Western Blotting
A commercially available purified human recombinant DDC expressed in E. coli was employed (United States Biologicals). In addition, frozen tissue specimens from two cases of pulmonary PDNECs (case no. 82 and no. 84 in Table 1) were available for Western blotting analysis. The tissues were homogenized in PBS containing 0.2 mM DTT using a potter. The extracts were centrifuged at 12,000 × g for 15 min at 4C and the pellet was discarded. Protein quantification in the supernatants was obtained by the Bradford method (BioRad; Hercules, CA). The protein extract was separated by SDS-PAGE and blotted onto a nitrocellulose membrane using a semi-dry apparatus (BioRad). After transfer, the blots were stained with Ponceau S (Sigma; St Louis, MO) to confirm equal protein loading. We planned two experiments, the first using 3 μg of the commercial DDC protein and 20 μg of the protein extract obtained from the two tumors and the second using 0.3 μg of the DDC protein and 2 μg of the protein extract. Protein band immunodetection was performed with polyclonal rabbit anti-HDC (dilution 1:5000; Eurodiagnostica) and polyclonal rabbit anti-DDC (dilution 1:5000; United States Biologicals) as the primary antibodies (described in the Immunohistochemistry section) and horseradish peroxidase-conjugated bovine anti-rabbit IgG as the secondary antibody (dilution 1:15,000; Santa Cruz Biotechnology, Santa Cruz, CA). Bands were visualized by using enhanced chemoluminescence (Super Signal; Pierce, Rockford, IL) as specified by the manufacturer.
Analysis of HDC and DDC Transcripts
To verify specificity of the IHC analysis with the anti-HDC antibody, the expression of HDC and DDC transcripts was determined by real-time PCR in normal and tumor tissues of the stomach, ileum, pancreas, and lung. In particular, we included a total of 36 normal specimens (previously described) in the study with the aim of detecting the basal expression level of HDC and DDC genes in normal tissues from the four selected sites. In this selection, oxyntic and ileal mucosae also served as positive controls for the expression of HDC (histamine-producing ECL cells in oxyntic mucosa) and DDC [serotonin-producing enterochromaffin (EC) cells in ileal mucosa].
A total of 47 tumors were selected for the molecular study by considering the availability of the tissue for RNA extraction, and these were 21 pulmonary PDNECs, 5 ileal WDNETs, 7 bronchial WDNETs, 7 gastric, and 7 pancreatic WDNETs (cases with asterisk in Table 1).
RNA Extraction and cDNA Synthesis
Total RNA was isolated from 2-5 × 8-μm paraffin sections using a modification of the method described by Bijwaard et al. (2001). Briefly, the samples were deparaffinized by adding 1 ml of xylene for 10 min three times and washing three times with 1 ml of absolute ethanol. After each step, the tissue was collected by centrifugation at 12,000 × g for 5 min. After the final ethanol wash, the pellet was air dried, resuspended in 200 μl of RNA lysis buffer (20 mM Tris-HCl pH 8, 20 mM EDTA pH 8, 2% sodium dodecyl sulfate, and 4 mg/ml of proteinase K in DEPC-treated H2O) and incubated overnight at 60C until the tissue was completely lysed. RNA was purified from the digested tissue by TRIzol (Gibco/Life Technologies; Gaithersburg, MD) according to the manufacturer's instructions. After isopropanol precipitation and 70% ethanol washing, the RNA pellet was air dried, hydrated in 50 μl of MilliQ H2O (Millipore; Bedford, MA), and stored at −80C.
The RNA was reverse transcribed with random primers using the High-Capacity cDNA Archive Kit (Applied Biosystems; Foster City, CA) according to the manufacturer's protocol, with the addition of RNase inhibitor (Ambion; Austin, TX) at a final concentration of 0.4 U/μl. Samples were incubated at 25C for 10 min, 37C for 2 hr, and stored at 4C.
Real-time Quantitative PCR
Real-time quantitative PCR analyses for HDC and DDC mRNAs were performed in 96-well plates using the ABI PRISM 7000 Sequence Detection System (SDS) instrument and software (Applied Biosystems). Intron-spanning primers and probes were purchased from Applied Biosystems (Taq Man Gene Expression Assays; HDC: Hs00157914_m1; DDC: Hs00168031_m1) as 20X formulations of unlabeled sequence-specific primers and 6-FAM dye-labeled MGB probes. PCR was performed with the TaqMan Universal Master Mix (Applied Biosystems) according to the manufacturer's protocol, using 5 μl of cDNA in a total volume of 25 μl. AmpliTaq Gold was activated by incubation for 10 min at 95C, and each of the 45 PCR cycles consisted of 15 sec at 95C for cDNA denaturation and 1 min at 60C for both the annealing and the extension steps. In each run, samples were determined in duplicate, and a no-template control was always included to exclude cross-contaminations. To verify that RT-PCR signals derived from RNA rather than genomic DNA, a control of non-retrotranscribed RNA was tested in parallel (no-RT control).
Calculation of Relative Expression
The relative expression of mRNA species was calculated using the comparative CT method described previously (Livak and Schmittgen 2001).
All data were normalized for quantity of RNA input by performing measurements of an endogenous reference gene, β-GUS (β-glucuronidase; Applied Biosystems). β-GUS was selected from a panel of six “housekeeping” genes (18s, RNaseP, HPRT, β2m, CYC, β-GUS) constitutively expressed across a wide range of tissues because it showed the lowest level of expression variability in the five representative tumors tested (one pulmonary PDNEC, one colon PDNEC, one gastric PDNEC, one rectal WDNET and one gastric WDNET) (data not shown).
In addition, expression data for the tumors in each tissue were normalized to the expression of the normal calibrator (or “1X” sample) for that tissue. Normal samples were first evaluated for the expression of the reference gene β-GUS, and cases with CT values >33 were excluded from the analysis because of insufficient quantity or poor quality of RNA. cDNAs from 14 pulmonary parenchyma, 5 gastric fundic mucosa, 3 pancreatic parenchyma, and 2 ileal mucosa (24/36, 67% of the normal specimens) were collected in four different pools of cDNA with similar CT values, each of them constituting the calibrator for the tissue being analyzed.
The calculations made were as follows: a difference in CT values (ΔCT) was calculated for each RNA sample by taking the mean CT of duplicate tubes for the target gene and subtracting the mean CT of duplicate tubes for the reference gene (β-GUS) measured from an aliquot of cDNA from the same RT reaction. The ΔCT for the calibrator of the analyzed tissue was then subtracted from the ΔT for the test sample to generate a ΔΔCT. Expression of the target gene relative to the endogenous reference gene and normalized to the calibrator is: relative expression = 2-ΔΔCT .
Clinicopathological features of 117 neuroendocrine tumors
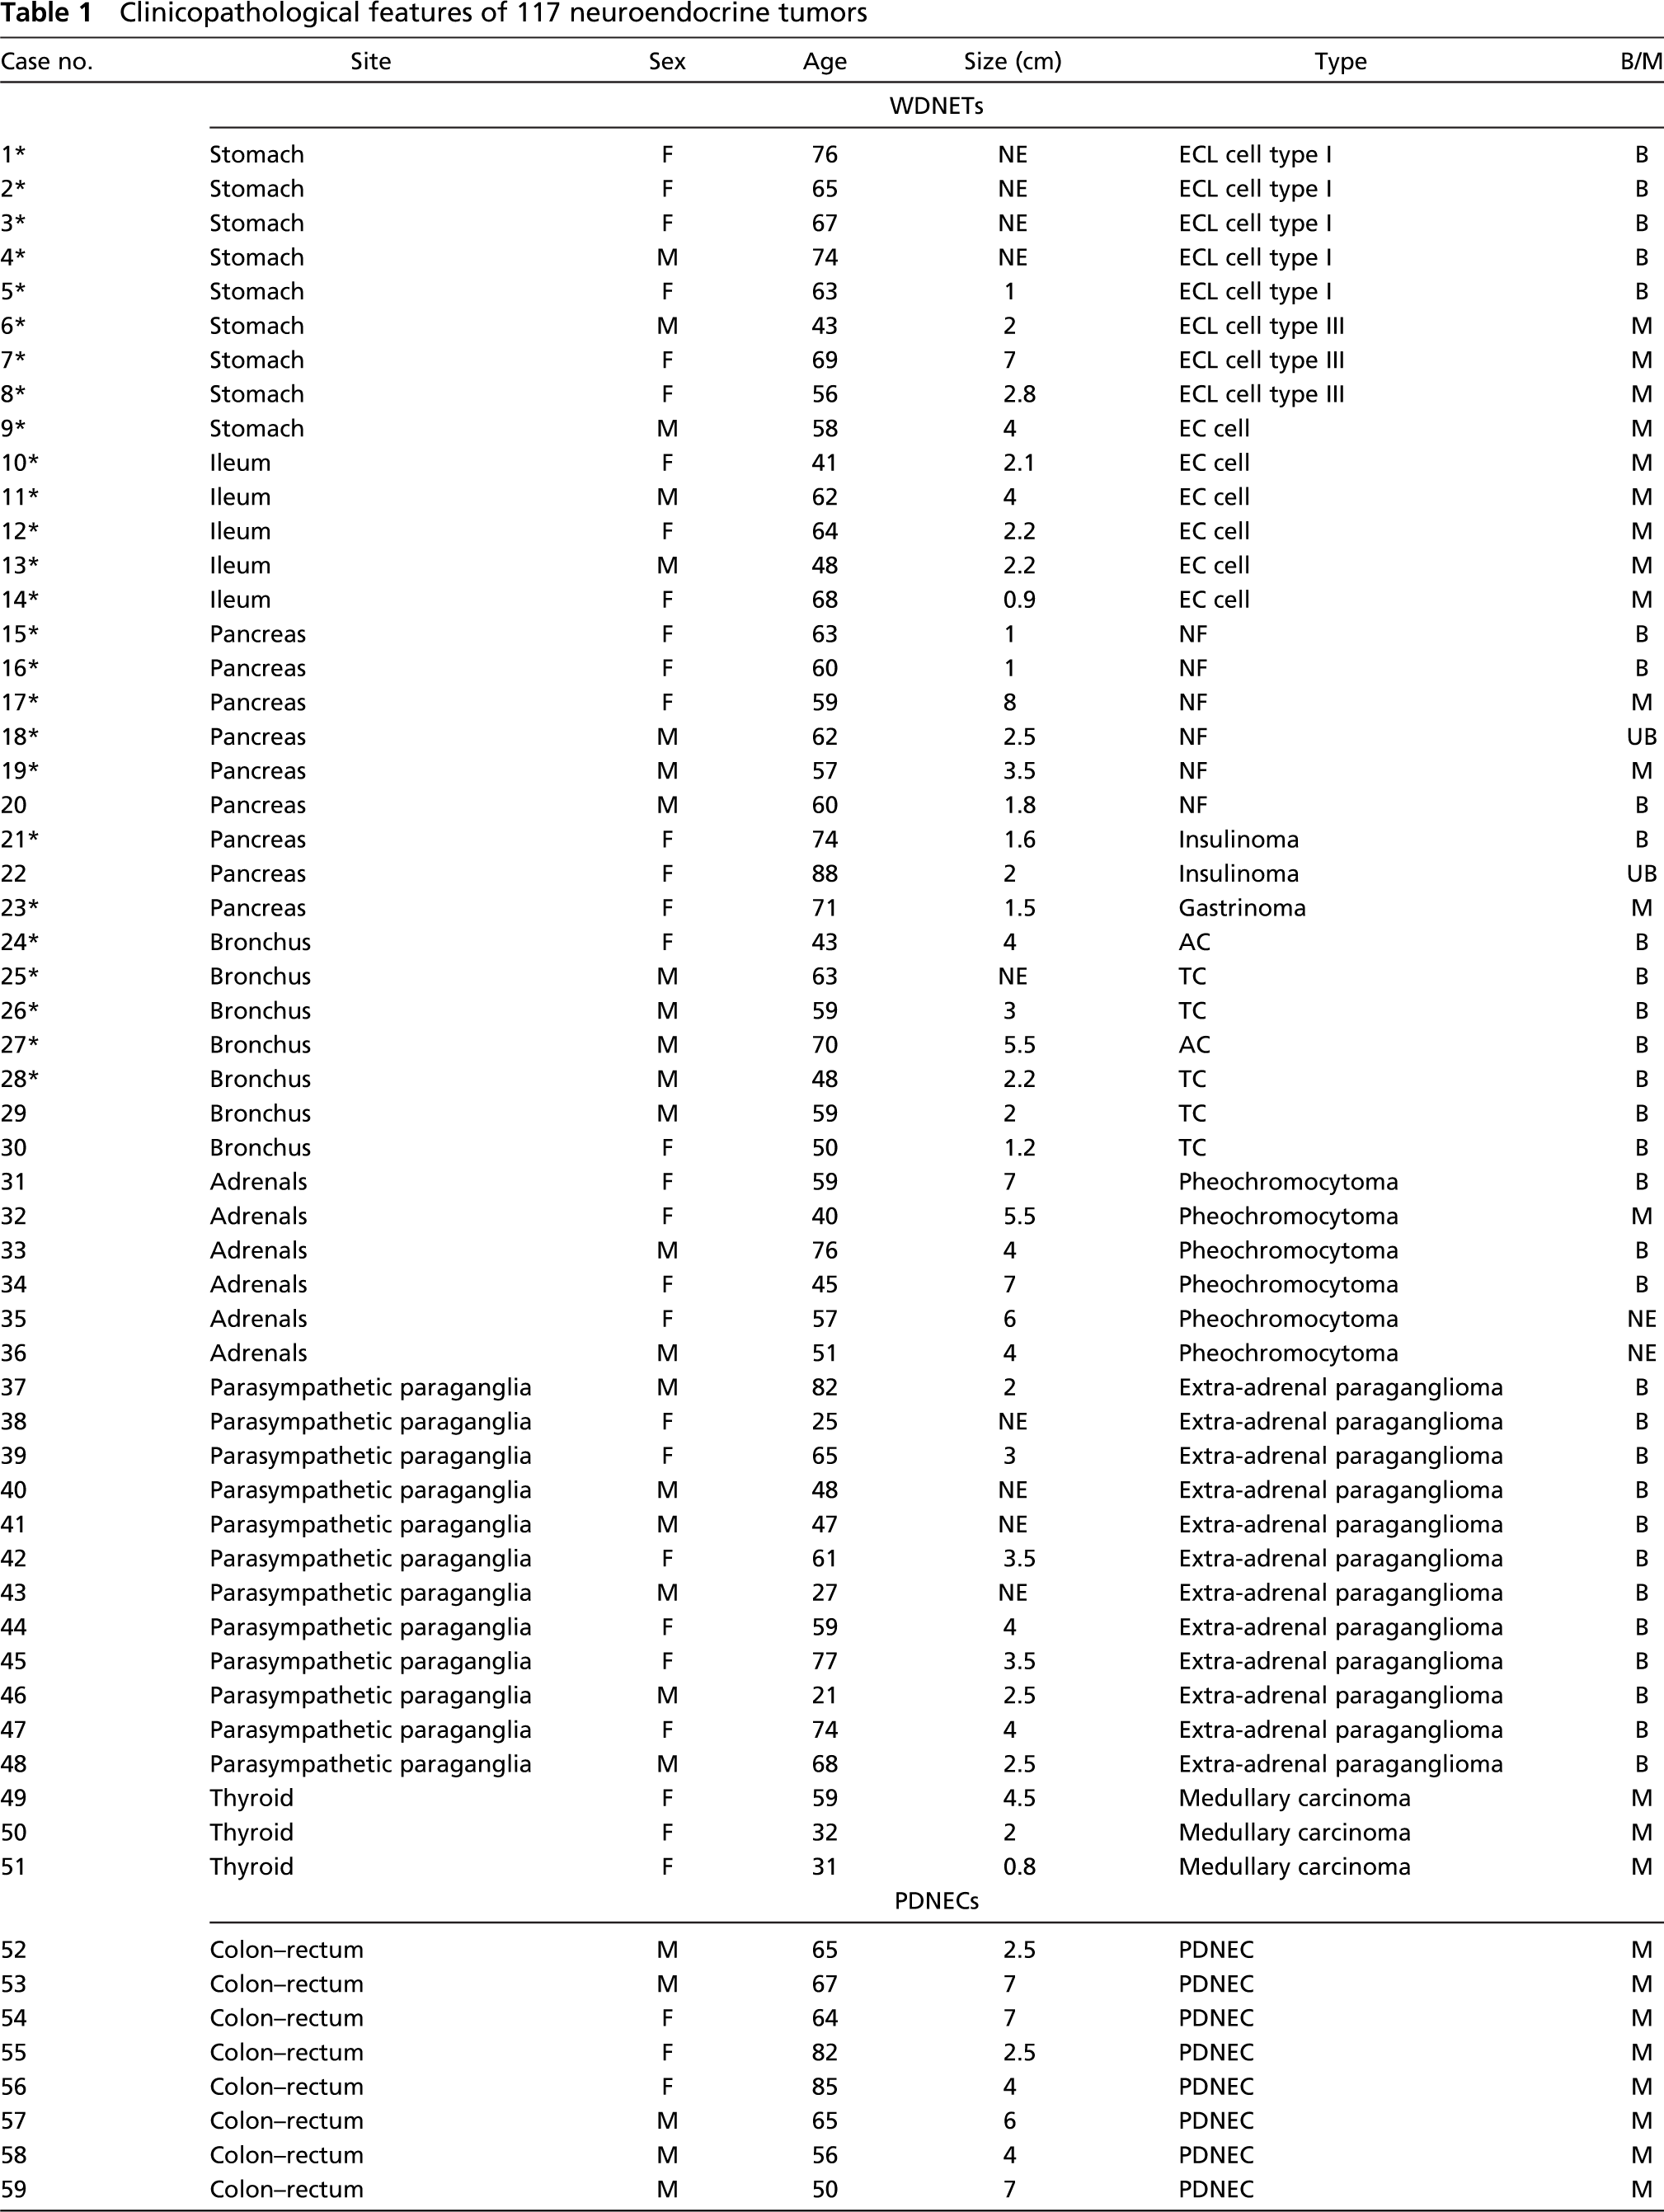
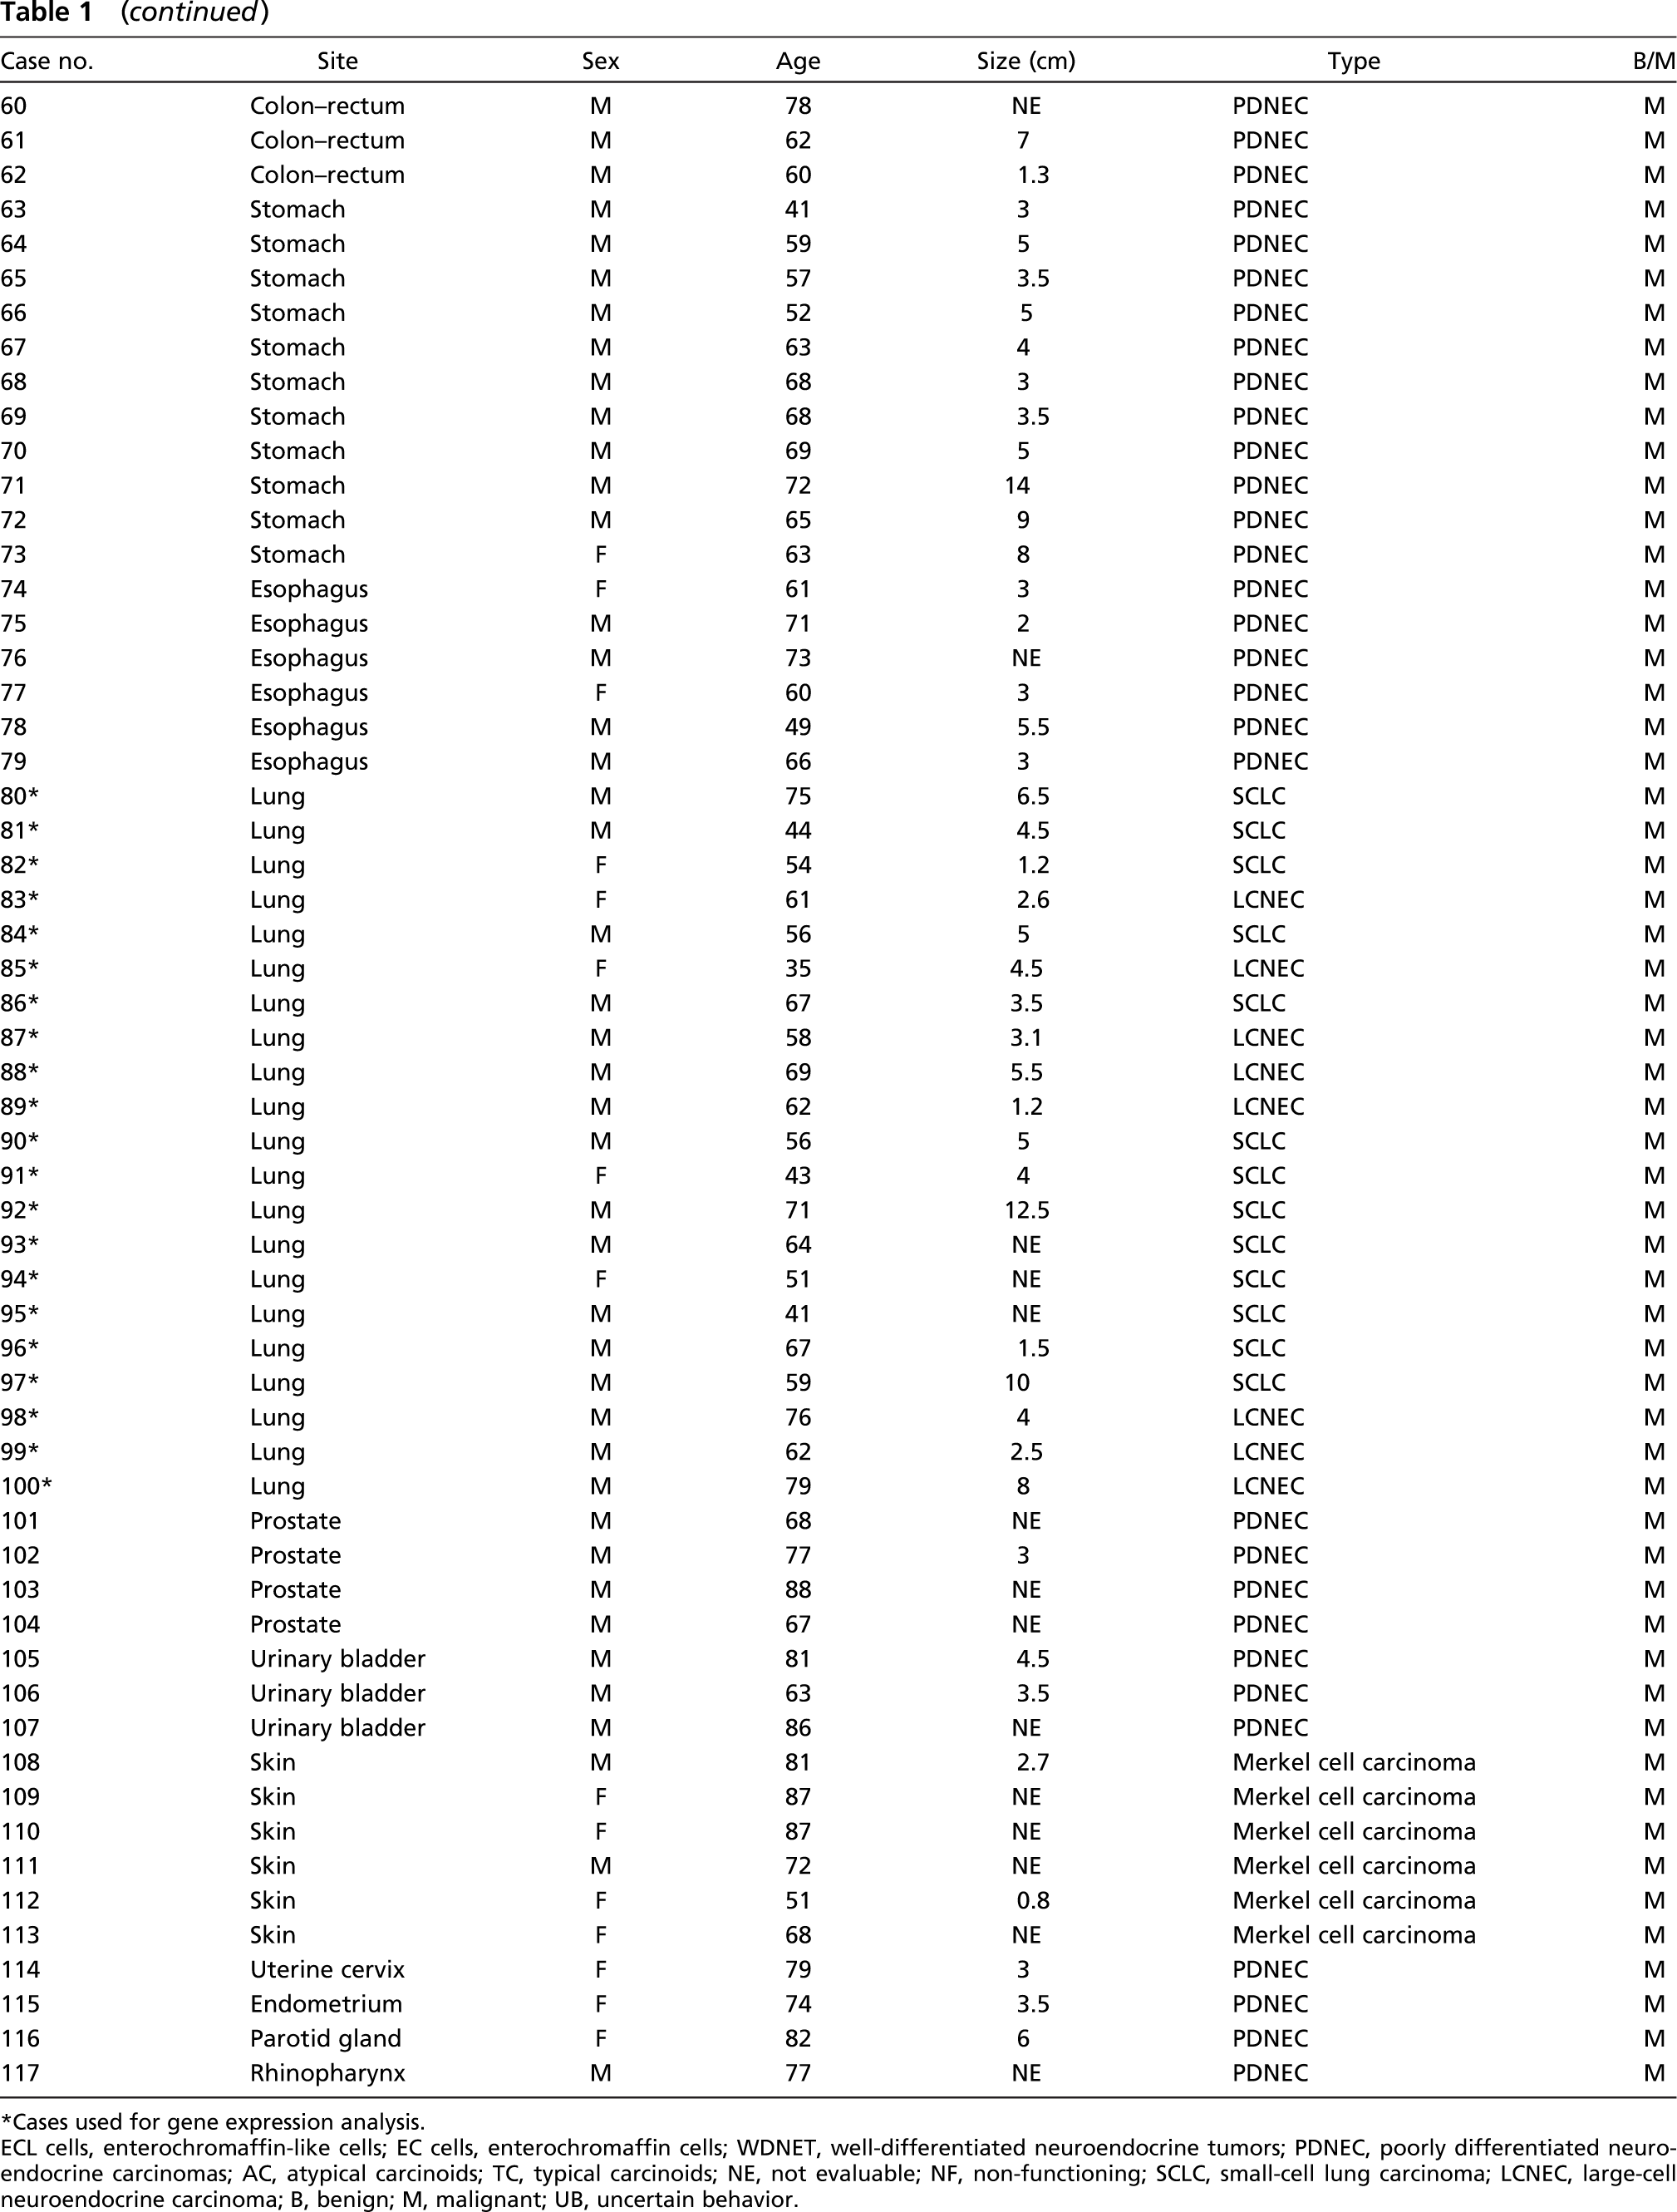
Cases used for gene expression analysis. ECL cells, enterochromaffin-like cells; EC cells, enterochromaffin cells; WDNET, well-differentiated neuroendocrine tumors; PDNEC, poorly differentiated neuroendocrine carcinomas; AC, atypical carcinoids; TC, typical carcinoids; NE, not evaluable; NF, non-functioning; SCLC, small-cell lung carcinoma; LCNEC, large-cell neuroendocrine carcinoma; B, benign; M, malignant; UB, uncertain behavior.
Immunohistochemical (IHC) expression of v-MAT2 and HDC in 51 WDNETs
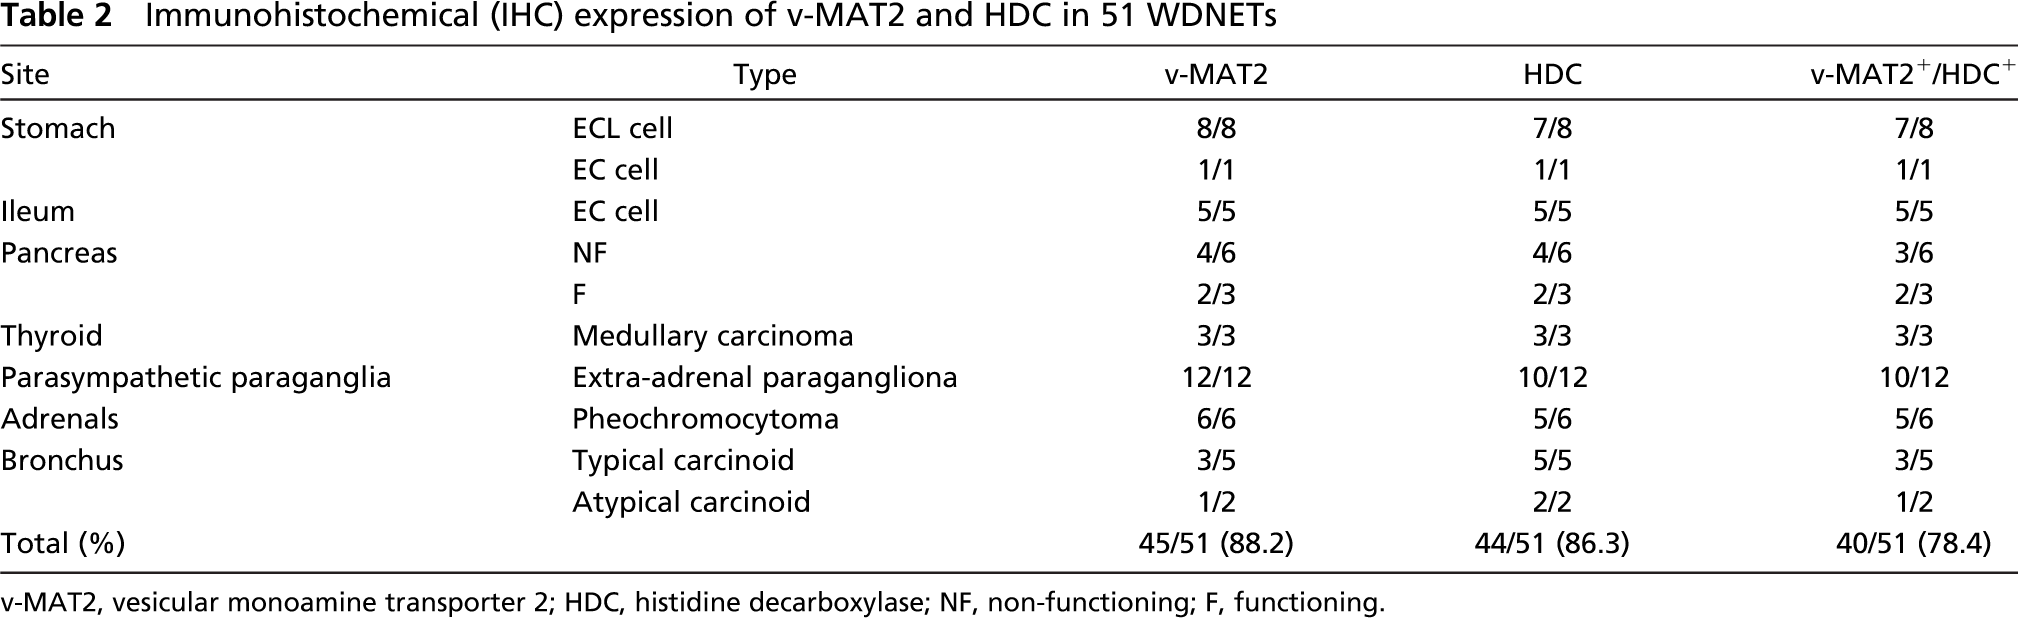
v-MAT2, vesicular monoamine transporter 2; HDC, histidine decarboxylase; NF, non-functioning; F, functioning.
Statistical Analysis
Statistical analysis was performed using Fisher's exact test.
Results
Immunohistochemistry
The obtained results of the immunohistochemical, western blotting, and real time RT-PCR analysis are detailed in Tables 2,3,4, and 5. v-MAT2 and HDC were widely expressed both in WDNETs and in PDNECs from the various sites analyzed, as detailed in Table 2 and Table 3.
In particular, v-MAT2 IR was present in 45/51 (88%) of the WDNETs, with all the tumors from the stomach (Figure 1B), ileum (Figure 1D), thyroid, adrenals, and parasympathetic paraganglia being positive. Lower figures were observed among bronchial carcinoids and pancreatic WDNETs, which showed v-MAT2 IR in 4/7 (57%) and in 6/9 (66%) cases, respectively (Table 2). Gastric ECL-cell tumors showed the highest percentage of v-MAT2 IR cells (80-100%) and the immunostaining was generally more intense in these tumors than in the other WDNETs. As far as PDNECs were concerned, 52/66 (79%) cases were v-MAT2 IR, with 100% of lung (Figure 1F) and cutaneous carcinomas being positive and a lower percentage in other sites (Table 3).
IHC expression of v-MAT2 and HDC in 66 PDNECs
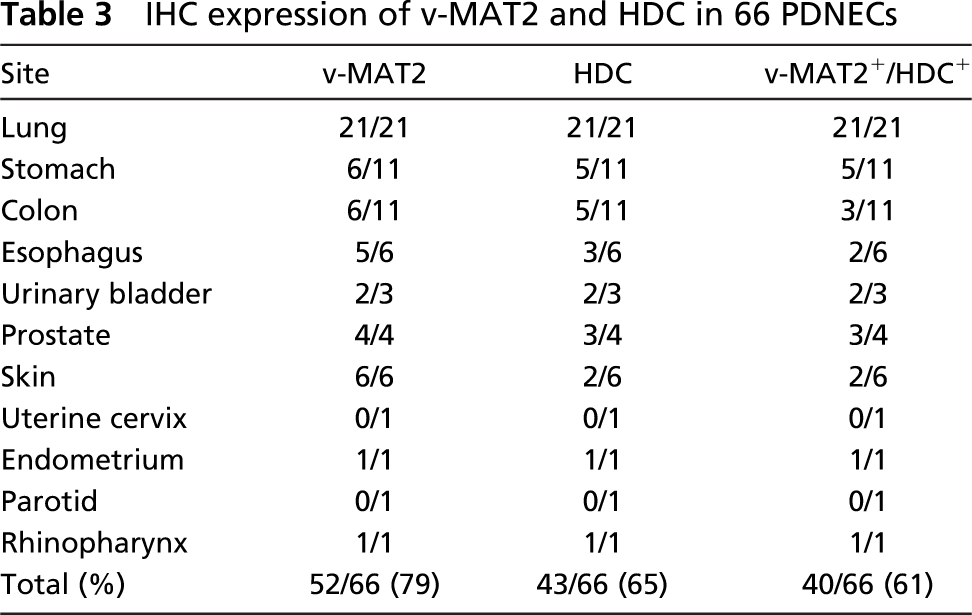
HDC IR was observed in 43/51 (84%) WDNETs, including 8/9 gastric tumors (Figure 1A). All bronchial, ileal (Figure 1C), and thyroid tumors were HDC IR and, in the other sites, HDC was always expressed in more than half of the cases (Table 2). Of the 66 PDNECs analyzed, 39 (59%) showed HDC IR. Interestingly, all lung PDNECs showed HDC positivity (Figure 1E), whereas in the other sites the enzyme was expressed in a lower number of cases (Table 3). Of 51 cases, 39 (76.5%) WDNETs (Table 2) and 43/66 (65%) PDNECs (Table 3) were both v-MAT2 and HDC IR. Figure 1 shows the immunostainings for HDC and v-MAT2 in two cases of WDNETs and in a PDNEC.
DDC IHC expression was evaluated in the 42 tumors investigated with real-time RT-PCR (Table 5). DDC IR was observed in 15/22 WDNETs (68%), including all ileal and bronchial carcinoids, 4/7 tumors of the pancreas, and 3/7 tumors of the stomach. PDNECs of the lung were all DDC IR (Figure 1G), with the percentage of IR cells ranging from 20% to 90%. HDC and DDC were coexpressed in all cases investigated, and the percentage of cells IR for the two markers was similar in nearly all cases. We found HDC IR but not DDC IR in three gastric ECL-cell tumors and in one non-functioning pancreatic WDNET in which, however, HDC expression was observed in only 5% of the cells.
The number of c-Kit IR mast cells observed in each tumor is detailed in Table 5. Interestingly, both well-and poorly differentiated NETs of the lung showed a low number of c-Kit IR mast cells (mean numbers: 26 and 30 cells × 10 HPF, respectively). On the other hand, we observed higher numbers of these cells in the gastroenteropancreatic sites (mean numbers: 121 cells × 10 HPF in the stomach, 266 in the ileum, and 66 in the pancreas) although with a marked variability from case to case.
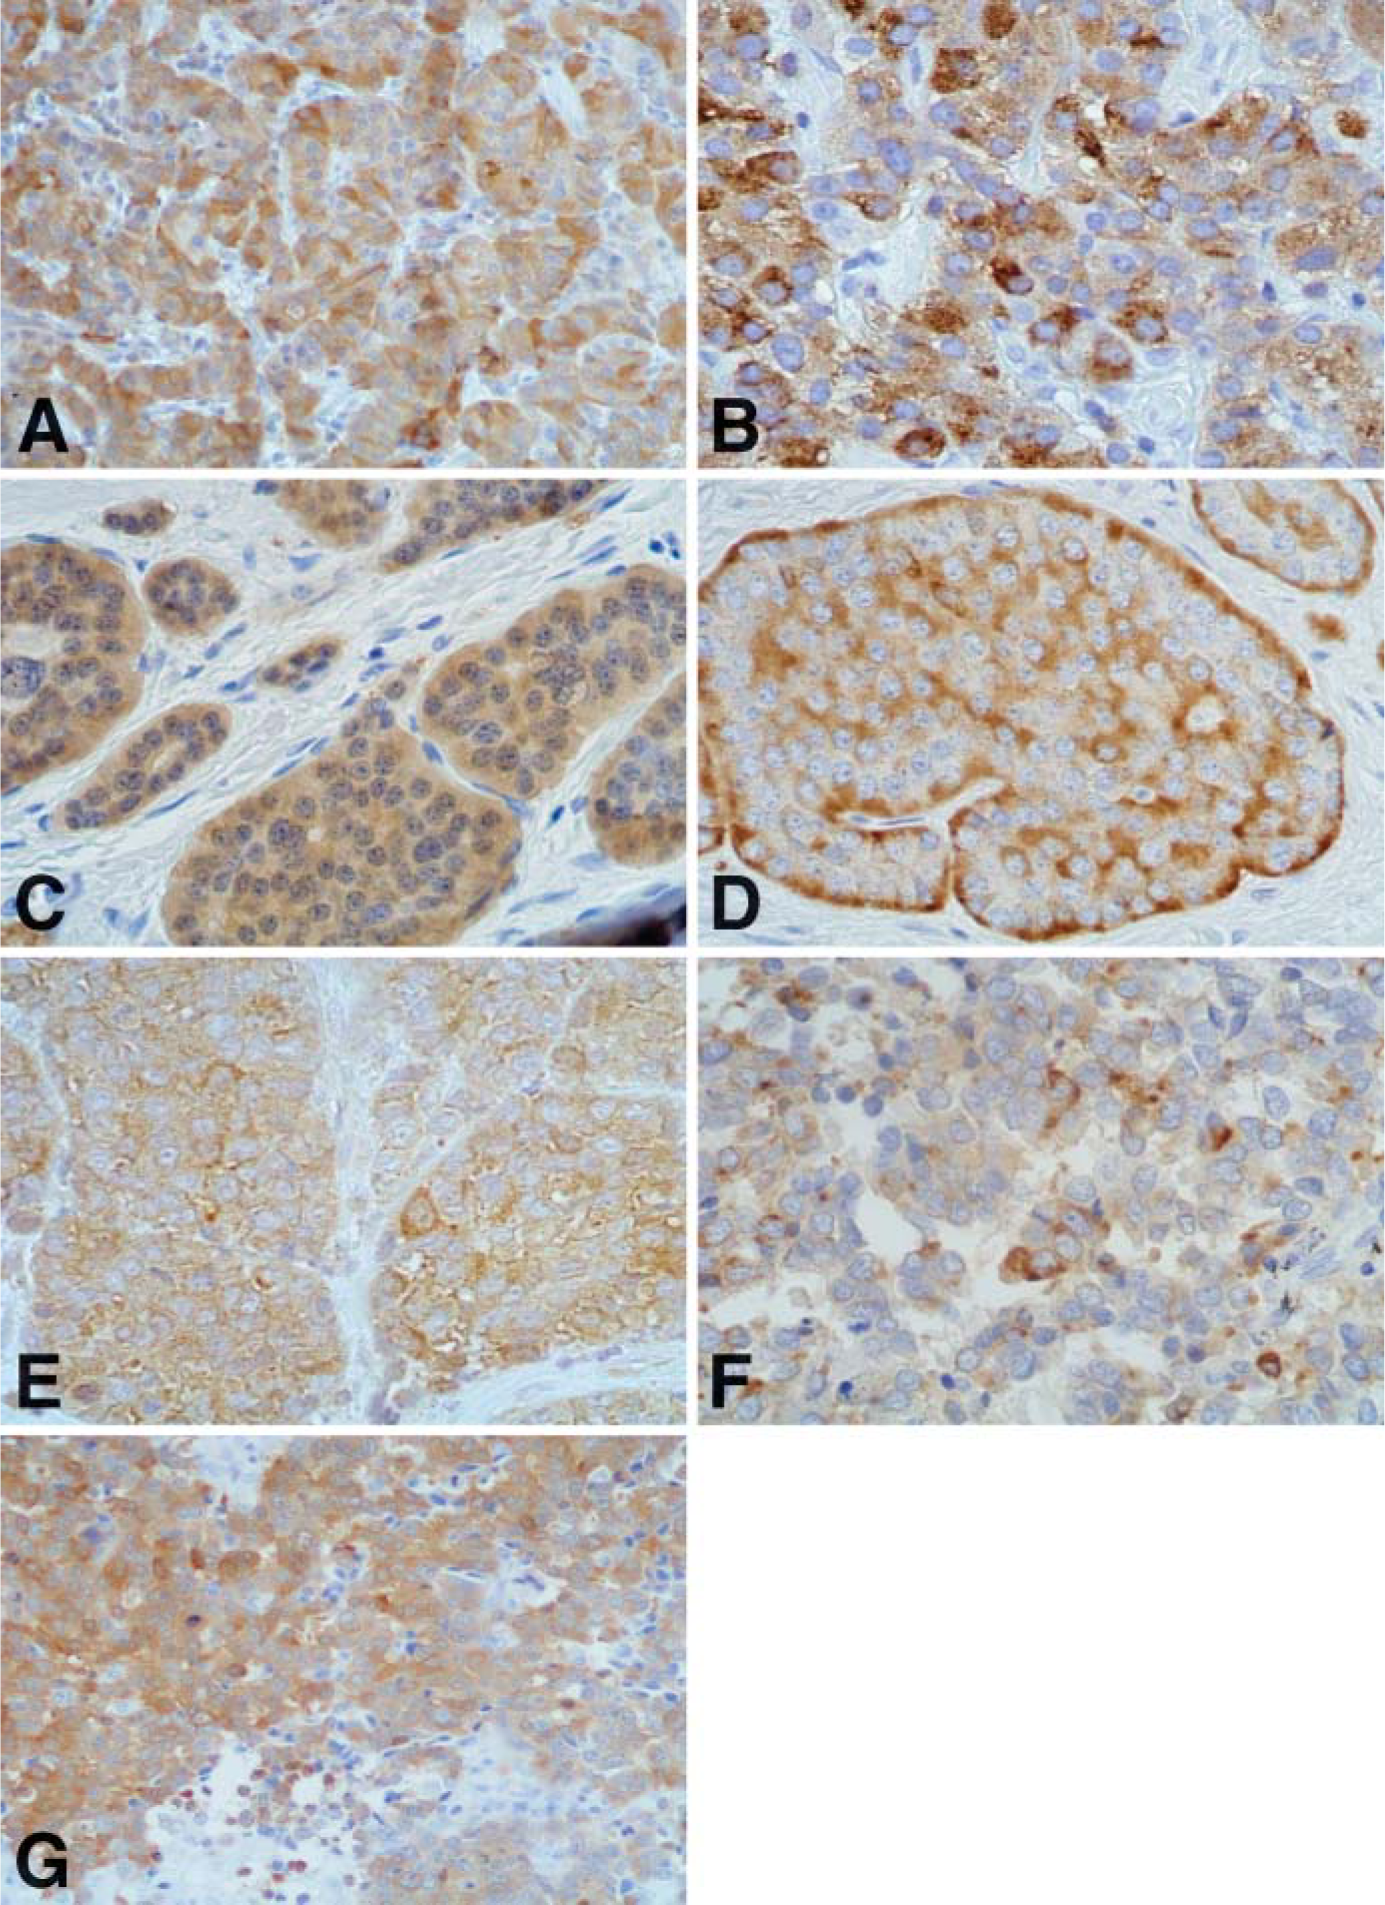
Immunohistochemical stainings for histidine decarboxylase (HDC) (
The results of the IHC study of HDC, DDC, and c-Kit in normal tissues are reported in Table 4. HDC IR was observed in single cells scattered in gastric fundic mucosa and ileal mucosa, which were morphologically identified as ECL cells and EC cells, respectively. In pancreatic samples, a faint HDC positivity was found in some islet cells that were identified as glucagon-producing α-cells using double immunostainings (data not shown). HDC IR was not observed in normal pulmonary samples. DDC IR was seen in the same cells as HDC in all sites except in the lung, where rare IR endocrine cells were observed in the bronchial mucosa and were negative for HDC (Table 4). c-Kit IR mast cells were observed in all of the 36 normal tissues analyzed. However, the mean number of mast cells was higher in lung samples than in the other sites (Table 4).
Western Blotting Analysis
As shown in Figure 2, DDC protein was recognized by anti-DDC antibody as a very strong band at 55 kDa. Interestingly, the anti-HDC antibody also recognized the DDC protein (both when 3 μg and 0.3 μg of the protein were loaded), giving a signal of comparable intensity to that of anti-DDC antibody. It is to be noted that both anti-DDC and anti-HDC antibodies did not recognize any band in the standard ladder proteins (results not shown), indicating that the interaction of HDC antibodies with DDC protein was not due to nonspecific interactions (as a relatively high quantity of protein extract was loaded into the gels) but more likely to the very high degree of identity between the HDC and DDC proteins.
Relative expression of HDC and DDC mRNA and IHC detection of HDC, DDC, and c-kit-IR in four different normal tissues
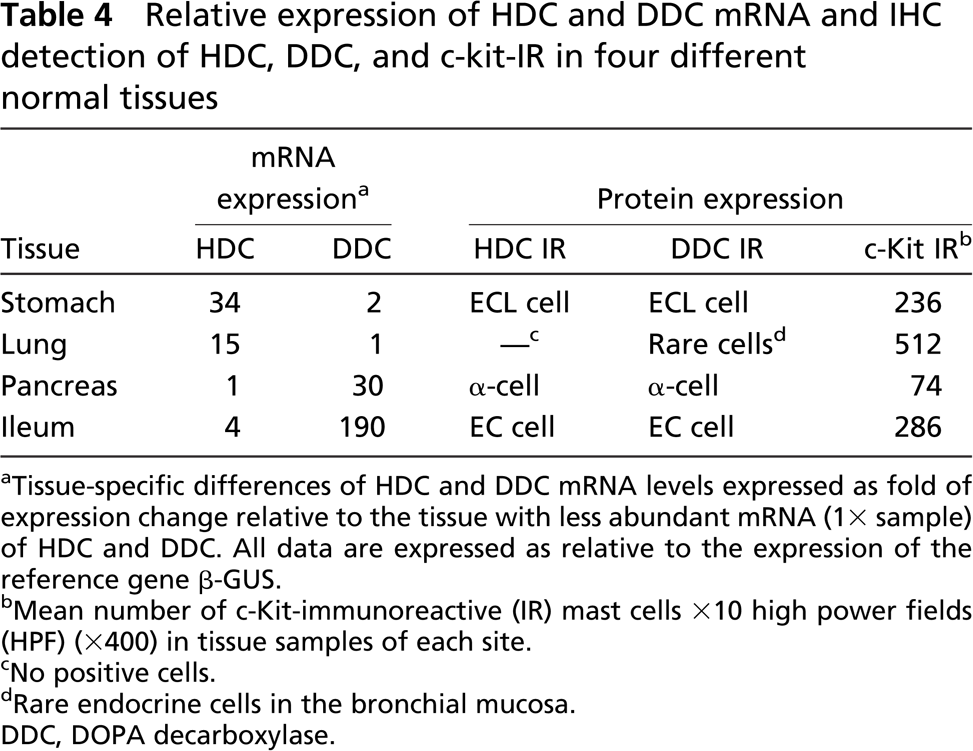
Tissue-specific differences of HDC and DDC mRNA levels expressed as fold of expression change relative to the tissue with less abundant mRNA (1X sample) of HDC and DDC. All data are expressed as relative to the expression of the reference gene β-GUS.
Mean number of c-Kit-immunoreactive (IR) mast cells X10 high power fields (HPF) (X400) in tissue samples of each site.
No positive cells.
Rare endocrine cells in the bronchial mucosa. DDC, DOPA decarboxylase.
As far as tumor samples are concerned, when 20 μg of protein extract was loaded, anti-DDC antibody revealed a single band at 55 kDa as expected. On the other hand, HDC antibodies depicted two expected bands, respectively, at 74 kDa (primary translation product of the hdc gene) and at 55 kDa (the mature subunit of the homodimeric enzyme). Of note, the 74-kDa band was fainter than the 55-kDa band. Considering that the 55-kDa band (Figure 2) could be derived both from DDC and HDC proteins, this band cannot be ascribed univocally to HDC or DDC. Interestingly, when 2 μg of protein extract was loaded in PAGE and the Western blotting analysis was performed, the anti-DDC antibody detected the same band at 55 kDa as previously described, whereas the anti-HDC antibody detected only a faint 74-kDa band in case no. 27 and no 74-kDa band in case no. 25 (Figure 2).
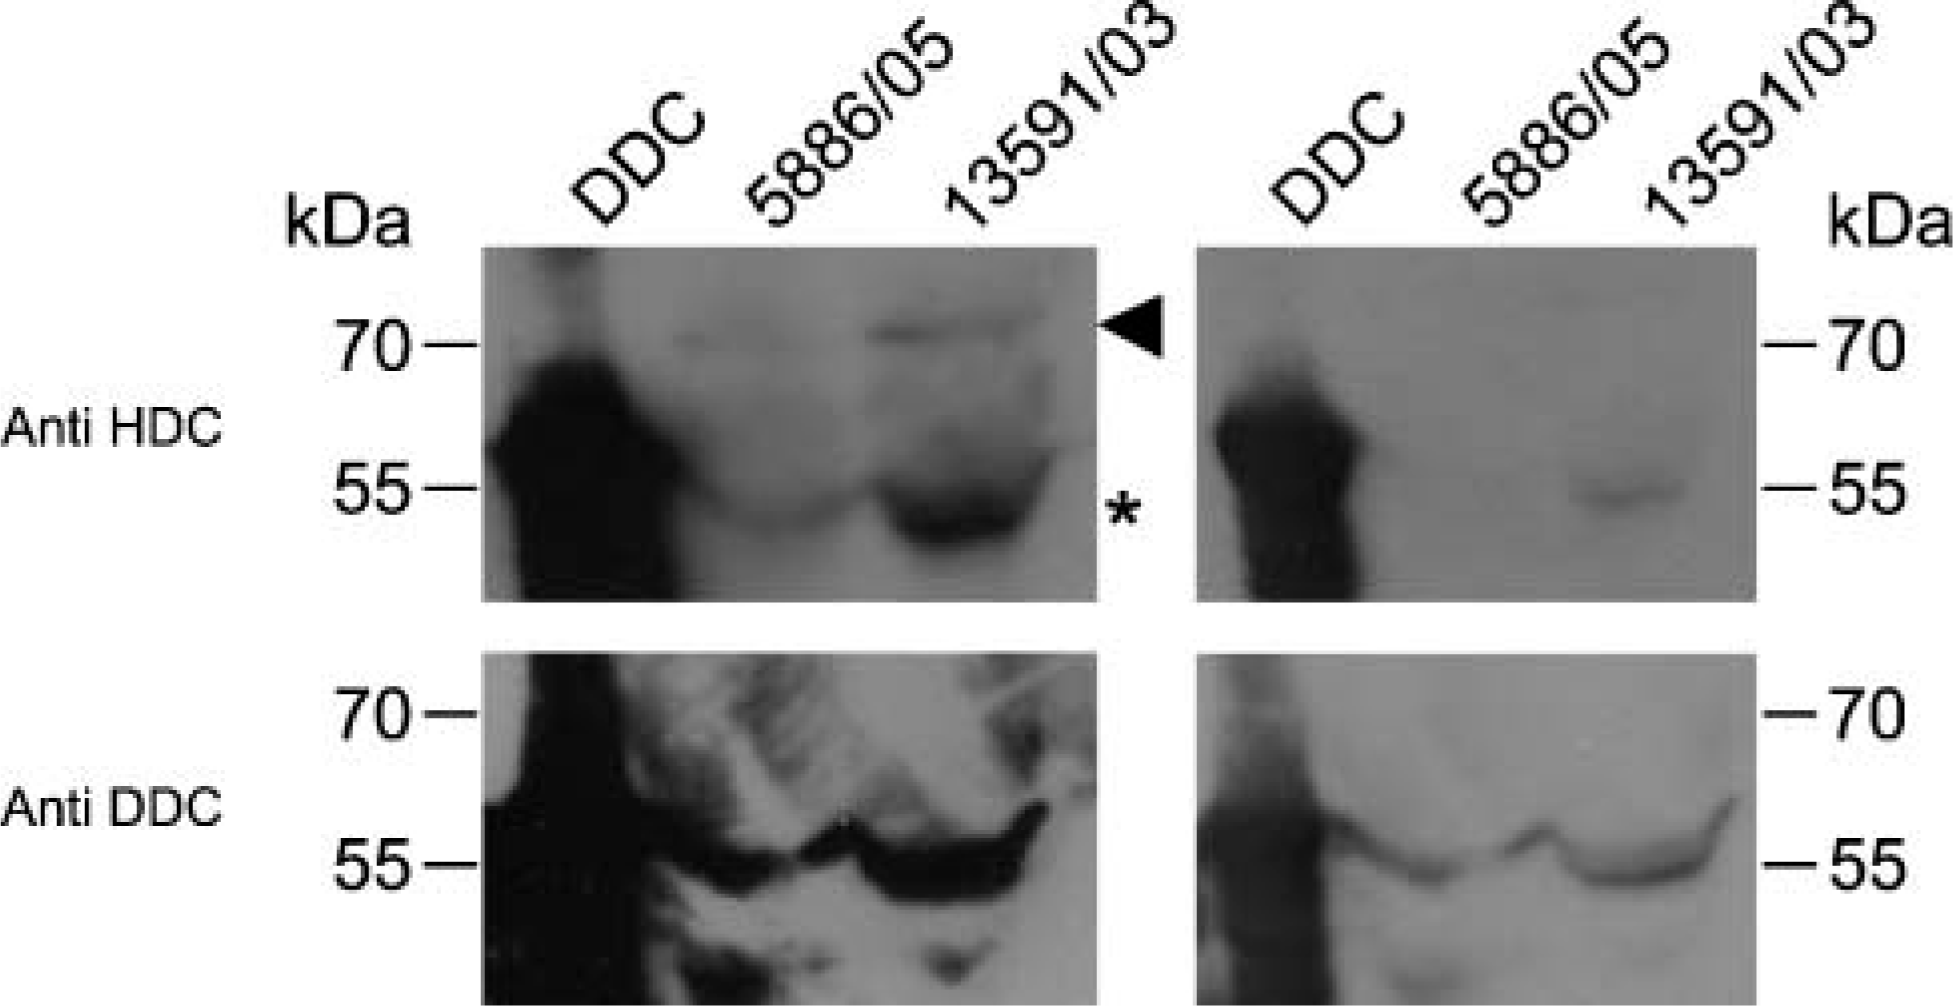
Left panels: Western blotting analysis on 3 μg of purified human recombinant DDC protein (DDC) and 20 μg of protein extract from case no. 25 in Table 5 (5886/05) and from case no. 27 in Table 5 (13,591/03) using anti-HDC (upper panel) and anti-DDC (lower panel) antibodies. Right panels: Western blotting analysis on 0.3 μg of purified human recombinant DDC protein (DDC) and on 2 μg of protein extract from the tumor samples. Arrowhead and asterisk indicate the 74-kDa and the 55-kDa bands corresponding to the immature and mature HDC protein, respectively.
HDC and DDC Transcript Levels in Normal and Tumor Tissues
The four pools of cDNA of normal specimens were analyzed for the expression of HDC and DDC genes. The results are summarized in Table 4. We assumed as “1X” samples the tissues that showed the least abundant expression of the genes being examined, i.e., pancreas for HDC and lung for DDC. According to the calculations reported in Materials and Methods, the highest HDC mRNA expression levels were detected in gastric fundic mucosa and in the lung (34X and 15X, respectively), whereas ileal mucosa showed HDC mRNA level relatively similar to that of the pancreatic tissue (1X sample).
Analysis of the DDC gene showed a very abundant expression of the gene both in the ileal mucosa and in the pancreatic normal tissue (190X and 30X, respectively). By contrast, gastric mucosa showed no relevant differences in DDC expression compared with the pulmonary parenchyma (1X sample).
In analyzing the tumor tissues, we were able to isolate RNA and amplify cDNA from 19/21 (91%) pulmonary PDNECs, 5/7 (71%) bronchial WDNETs, 3/5 (60%) ileal WDNETs, 7/7 (100%) pancreatic WDNETs, and 7/7 (100%) gastric WDNETs (42/47 cases, 89% of the total number of samples). These samples were considered suitable for PCR analysis because (a) CT values for the β-GUS gene were <33 cycles, (b) high fluorescence signals were observed in PCR reactions (ΔRn>0.5), and (c) there was a high reproducibility between PCR reactions performed in duplicate. The observed mean standard deviation of CT was 0.15.
For each tumor, detailed results of HDC and DDC mRNA expression levels compared with the IHC findings are summarized in Table 5. On the whole, we observed high relative expression levels for the HDC gene in gastric, ileal, and pancreatic tumors and low levels in bronchial WDNETs and in pulmonary PDNETs (p<0.001). It is of note that among gastroenteropancreatic tumors the highest HDC transcript levels were found in gastric WDNETs, particularly in ECL-cell tumors. In Figure 3 an example of a HDC amplification plot of one of these tumors is shown (case no. 3 in Table 5) and compared with the normal reference. Interestingly, the lowest levels of HDC mRNA in the gastric site were detected in the following three tumors: the only non-ECL-cell tumor (case no. 7, which showed 90% of 5HT IR EC cells); a case of ECL-cell microcarcinoids, which consisted of very small neoplastic nodules in the context of an atrophic fundic mucosa (case no. 2); and a completely HDC-negative tumor (case no. 6). In ileal and pancreatic WDNETs, HDC transcript levels were generally lower than in gastric tumors and showed a certain variability. Of note, the pancreatic insulinoma showed HDC levels near the normal reference, whereas in non-functioning pancreatic WDNETs a higher level of HDC expression was found. The lowest levels of HDC expression were found in lung PDNETs, among which 16/19 (84%) cases showed no expression or relative values <0.6 (mean value 0.4) (Table 5).
Relative expression of HDC and DDC mRNA and IHC detection of HDC, DDC, v-MAT2, and c-Kit-IR mast cell in the 42 investigated tumors
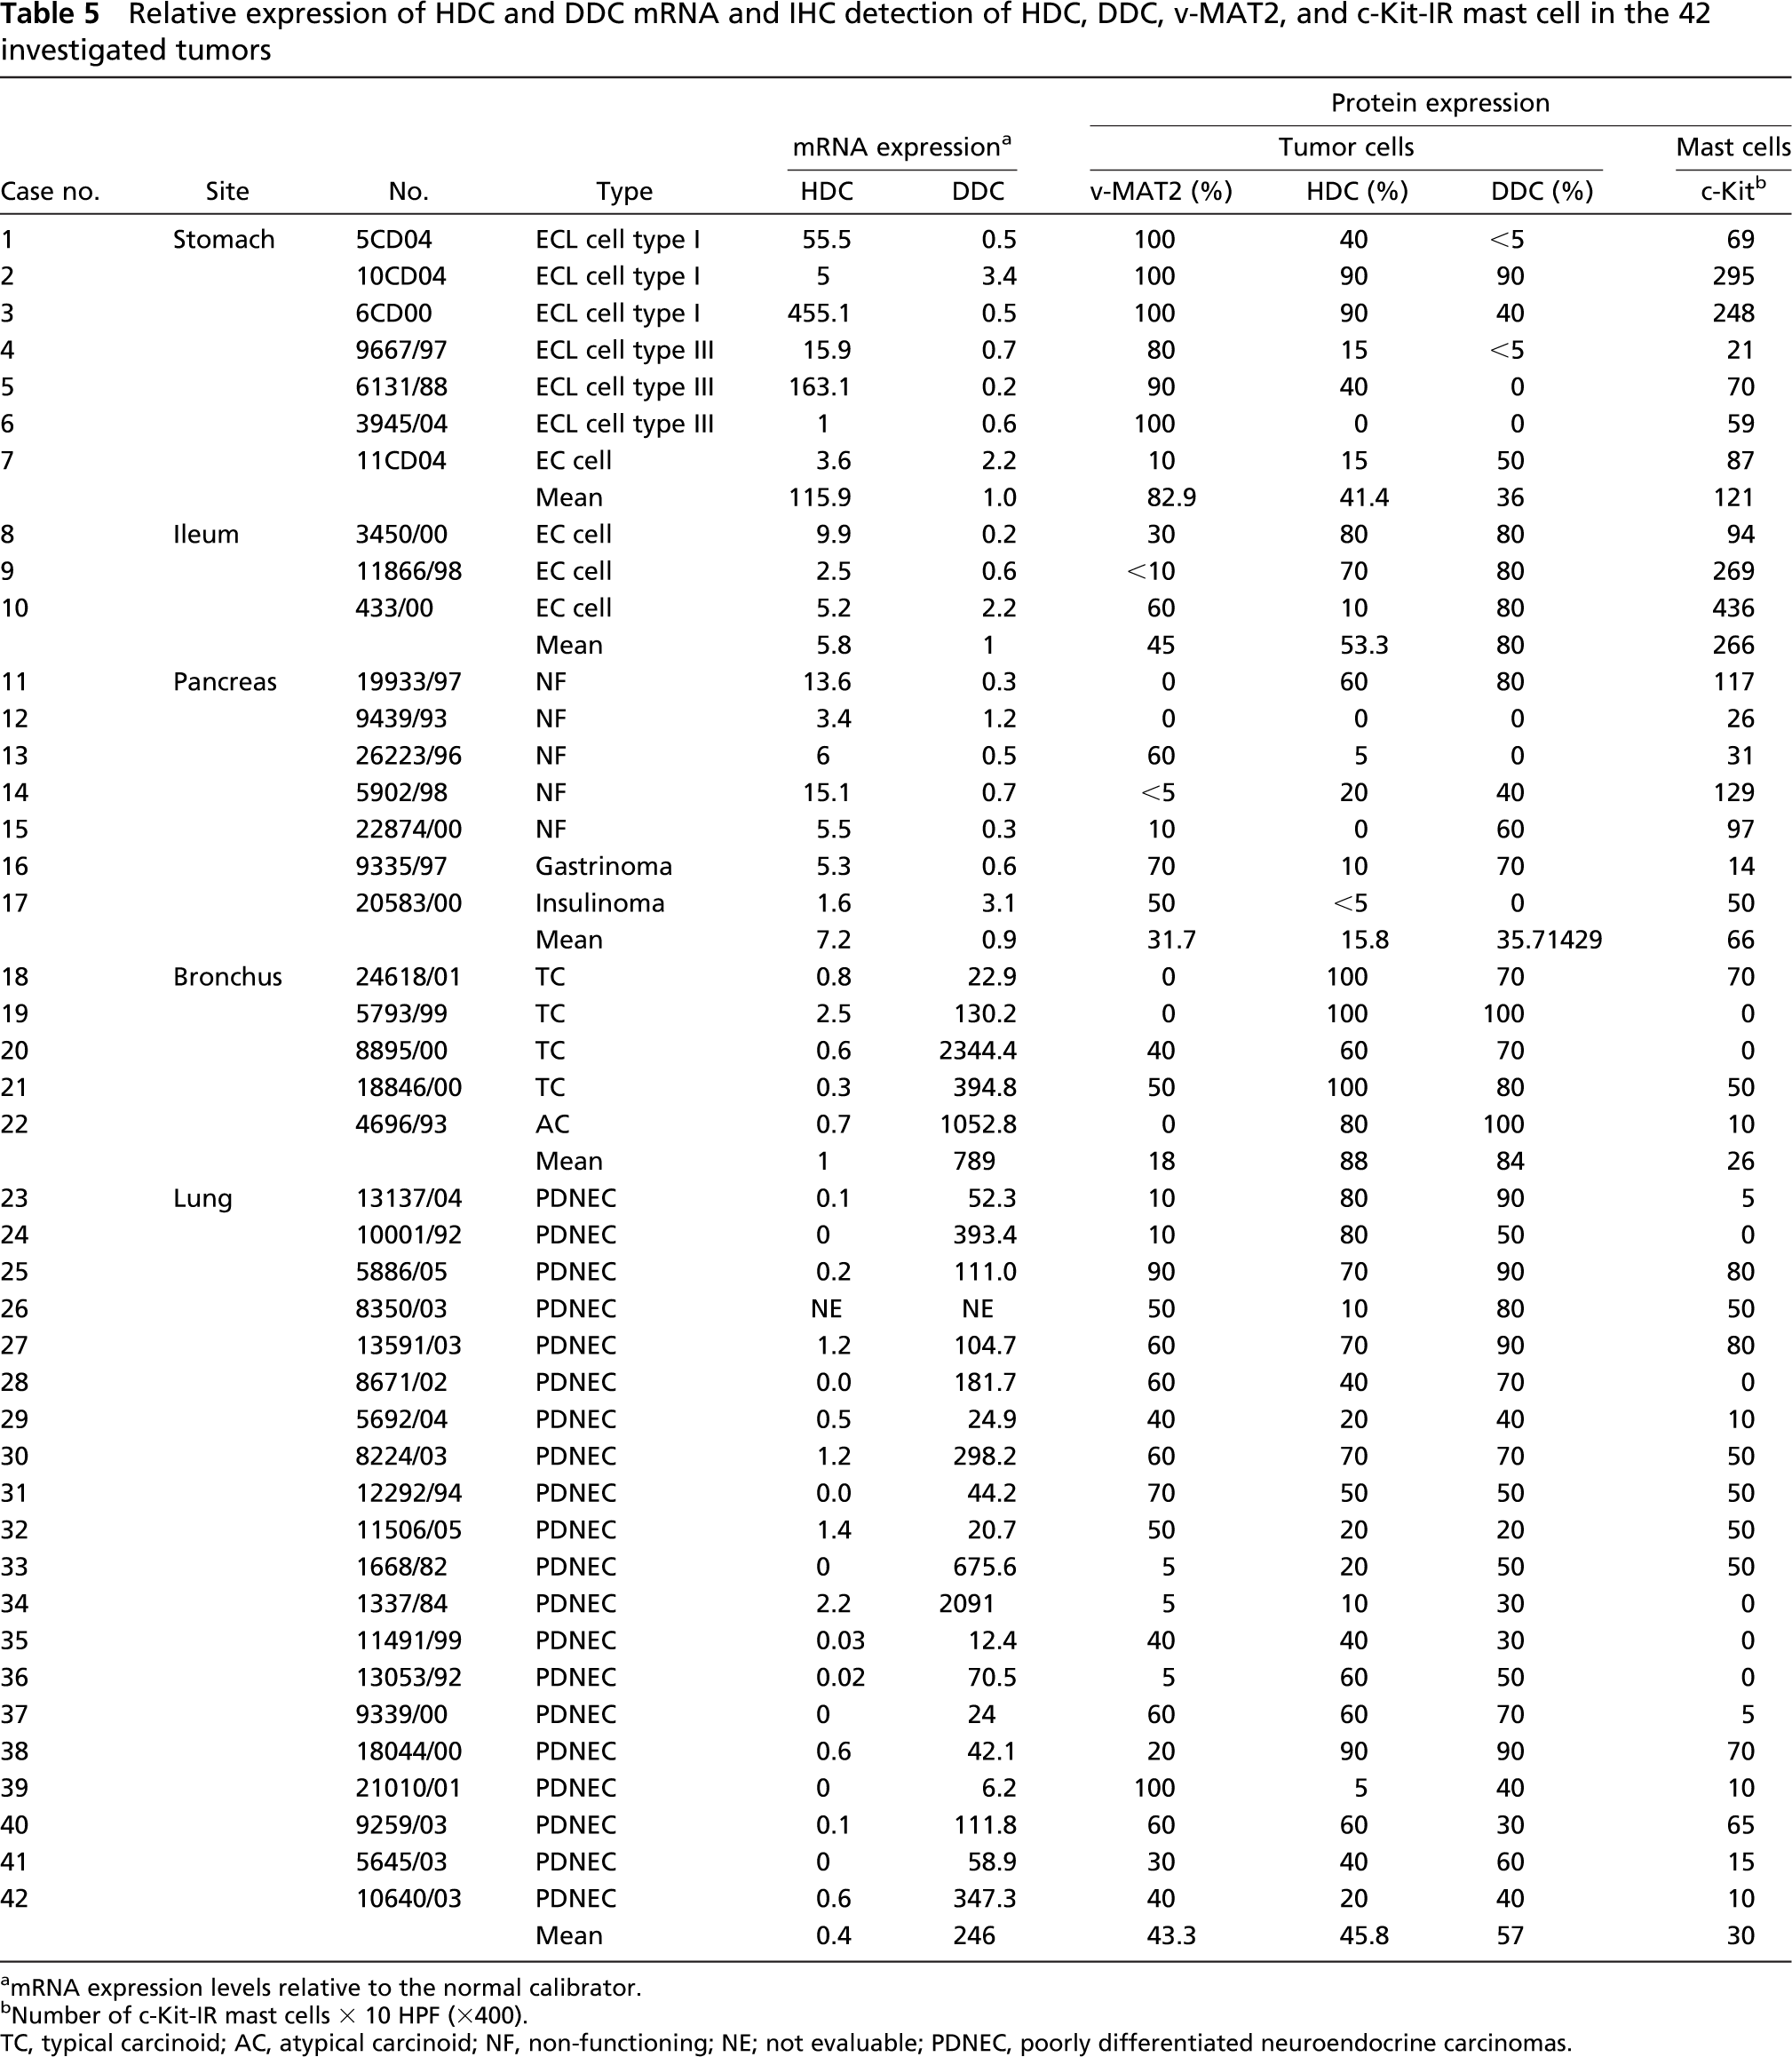
mRNA expression levels relative to the normal calibrator.
Number of c-Kit-IR mast cells × 10 HPF (X400).
TC, typical carcinoid; AC, atypical carcinoid; NF, non-functioning; NE; not evaluable; PDNEC, poorly differentiated neuroendocrine carcinomas.
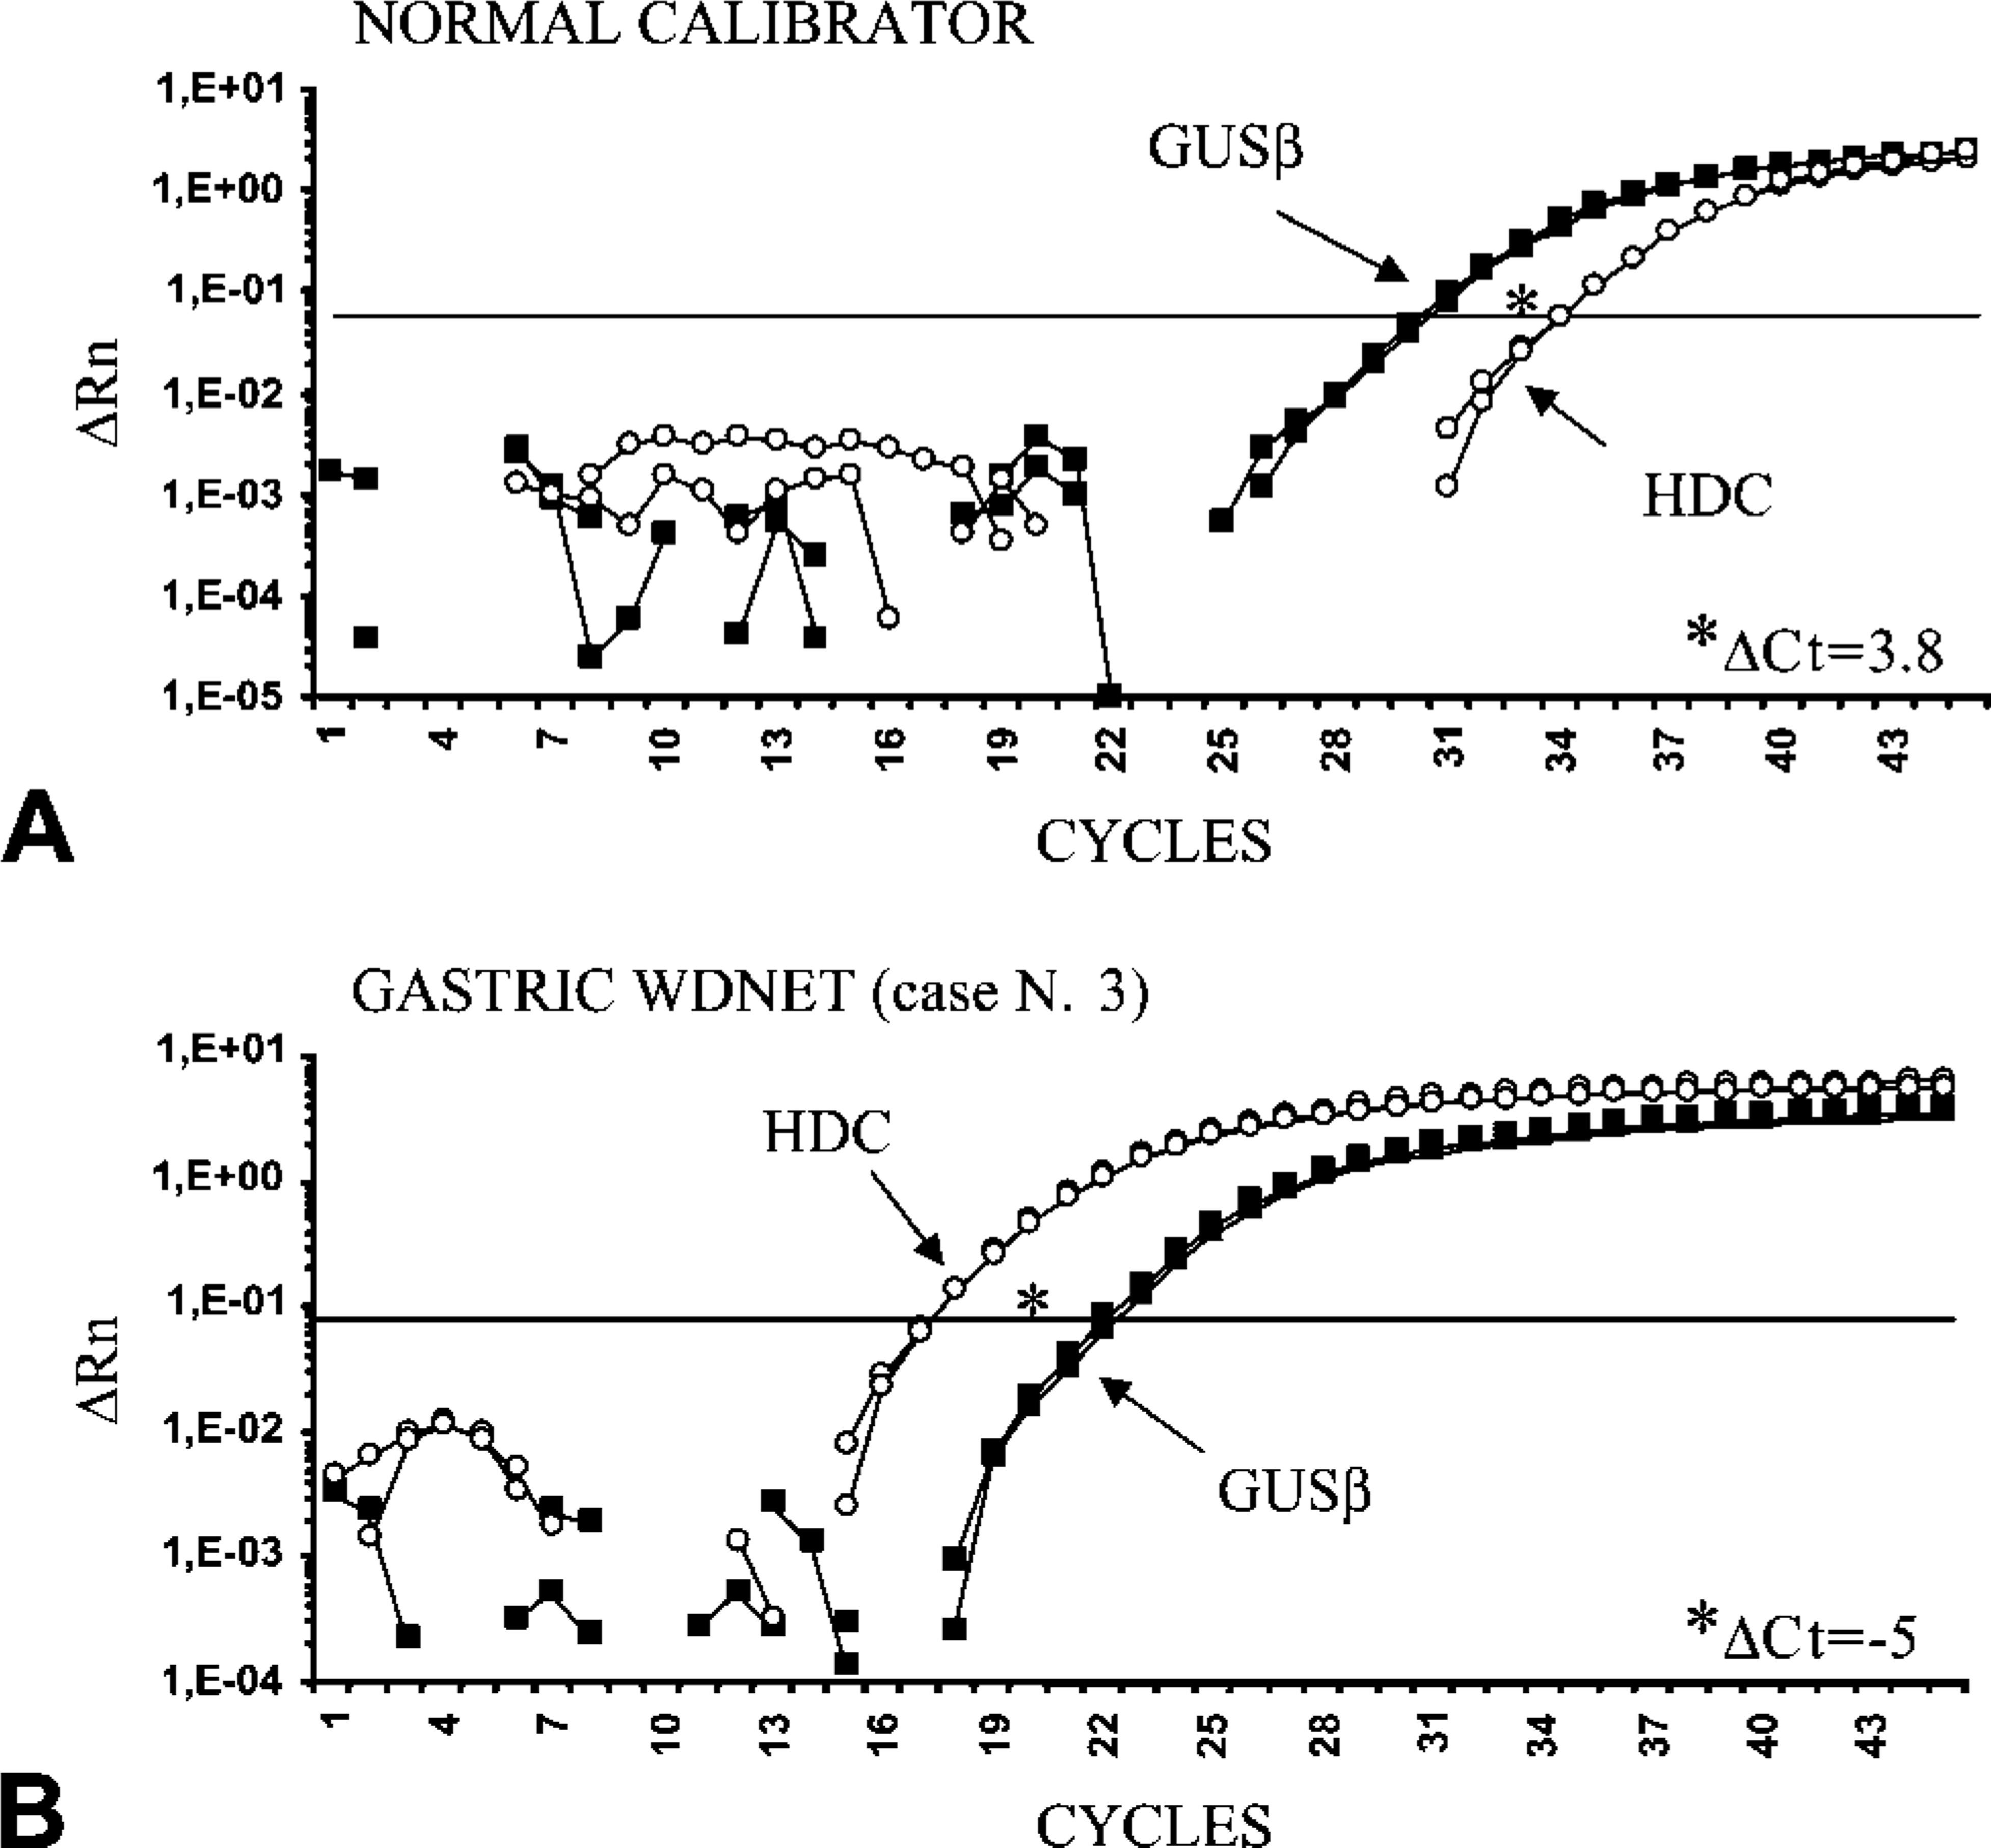
Representative plots showing real-time PCR amplifications of the endogenous reference gene (GUSβ) and HDC gene in the normal fundic mucosa (
Analysis of the DDC gene revealed high relative expression levels in all bronchial WDNETs and in pulmonary PDNECs. By contrast, levels of DDC mRNA comparable with those of the normal calibrators were found in all the gastroenteropancreatic tumors (p<0.001), with no significant variability among different cases (Table 5).
Discussion
This study represents the first HDC protein and gene expression analysis in a large series of NETs. The comparison between IHC and quantitative realtime RT-PCR results suggests that the anti-HDC antibody directed against the whole recombinant protein cross-reacts with DDC, as confirmed by Western blotting analysis.
To our knowledge, this is the largest series of WDNETs and PDNECs analyzed so far with IHC using anti-v-MAT2 and anti-HDC antibodies. We found widespread IR for both v-MAT2 and HDC, particularly in WDNETs and in pulmonary PDNECs. Our results confirm previous studies reporting HDC and v-MAT2 expression in NETs of different sites, also including SCLC (Eissele et al. 1999; Rindi et al. 2000; Graff et al. 2001,2002; Jakobsen et al. 2001; Anlauf et al. 2003; Matsuki et al. 2003; Tanimoto et al. 2004). Overall, these data suggest that the histaminergic phenotype is not restricted to ECL cell and related tumors of the gastric oxyntic mucosa, as has long been accepted (Pearse 1974; Solcia et al. 2000). In fact, expression of both v-MAT2 and HDC is a feature of histamine-handling cells (Medina et al. 2003) and represents a strong indicator of histamine production in NETs from sites different from the stomach. Moreover, such widespread expression of v-MAT2 and HDC in NETs suggests that they may be considered as new general endocrine markers, as previously proposed by other authors (Graff et al. 2001,2002; Matsuki et al. 2003; Tanimoto et al. 2004).
Specificity of the anti-v-MAT2 antibody has been extensively tested (see Materials and Methods), and the results of both the present and previous studies (Eissele et al. 1999; Jakobsen et al. 2001; Anlauf et al. 2003) can be confidently accepted as specific, although they have been validated with gene expression analysis in only a few reports (Graff et al. 2001; Anlauf et al. 2003). On the other hand, all available data on IHC expression of HDC in NETs have been obtained using polyclonal antibodies directed against human recombinant
Cross-reactivity of the anti-HDC antibody with the purified human recombinant DDC protein was clearly demonstrated by Western blotting analysis. In fact, a 55-kDa band corresponding to the DDC protein was detected by both the anti-DDC and the anti-HDC antibodies. Similarly, in tumor samples, the 55-kDa band was detected in the same way by the two antibodies. The 74-kDa band of HDC was recognized by the anti-HDC antibody only when 20 μg, and not 2 μg, of protein extract was loaded. This suggests that a very small quantity of HDC protein could be expressed in neoplastic cells.
Gene expression analysis with real-time RT-PCR was planned to verify the expression of DDC and HDC at the transcript level. To the best of our knowledge, this is the first gene expression study of HDC and DDC in a series of NETs from different sites. To increase confidence in these results, molecular analysis was performed on the same paraffin-embedded tissues used for the IHC study. This technique represents a sensitive, accurate, and highly reproducible method of studying gene expression in archival tissues despite extensive RNA fragmentation that occurs in these specimens (Godfrey et al. 2000; Specht et al. 2001; Cronin et al. 2004).
Analysis of HDC expression by real-time RT-PCR in normal samples showed the highest levels of HDC mRNA in the gastric oxyntic mucosa and in the lung parenchyma. This result was to be expected in the gastric oxyntic mucosa, where histamine-producing HDC-IR ECL cells are present. In lung parenchyma, high HDC expression levels are presumably due to the HDC activity of mast cells, which are numerous in this site and not recognized by the anti-HDC antibody, as reported by Dartsch et al. (1999). In the normal ileum, HDC expression levels were low, despite the presence of numerous strongly HDC-IR cells that were, however, morphologically identified as serotonin-producing, DDC-expressing EC cells. HDC IR in these cells is probably due to a cross-reaction with DDC. The lowest levels of HDC mRNA were observed in the normal pancreas where the number of mast cells was very small, and the faint HDC IR in α-cells should be considered as a cross-reaction with DDC or, alternatively, may indicate the presence of low HDC expression (Tanimoto et al. 2004).
The molecular study of tumor samples partially confirmed our concerns about the specificity of the HDC antibody. As expected, gastric ECL-cell carcinoids showed the highest levels of HDC expression. Only one case had HDC RNA levels equal to normal gastric mucosa. However, this case was HDC negative and the diagnosis of ECL-cell carcinoid was based only on v-MAT2 positivity. DDC mRNA levels in gastric tumors was generally lower than in the normal calibrator, except for a case showing multiple ECL-cell microcarcinoids (case no. 6 in Table 5) associated with chronic atrophic gastritis and areas of complete intestinal metaplasia containing EC cells, which were DDC IR. Among non-gastric tumors, ileal and pancreatic NETs generally displayed levels of DDC mRNA similar to those observed in normal ileal and pancreatic tissues, whereas HDC expression was increased compared with the normal reference. Such expression does not seem to be related to intratumoral mast cells, the mean number of which was similar to that observed in normal tissues. In partial agreement with our data, Tanimoto et al. (2004) recently identified α-cells as the probable site of histamine production in Langerhans islets, although they reported that HDC-IR cells were not restricted to α-cell tumors, being represented in different types of WDNETs.
Together the IHC and molecular results of this study suggest the presence of histamine-storing cells in ileal and pancreatic NETs. In the pancreas, some reports have suggested a role for histamine in insulin metabolism and β-cell proliferation (Feldman 1984; Azevedo et al. 1990; Sjoholm 1995). More recently, a number of studies have proposed that histamine may be involved in normal and neoplastic cell proliferation acting as an autocrine/paracrine growth factor (Adams et al. 1994; Rivera et al. 2000; Hegyesi et al. 2001; Takahashi et al. 2001).
Unlike digestive tumors, pulmonary NETs, including both well- and poorly differentiated forms, showed DDC mRNA levels strikingly higher than those of the normal lung. In contrast, HDC expression was generally absent or several times lower than that of the normal calibrator, probably due to the small number of intratumoral mast cells compared with normal lung parenchyma. In light of these data, the HCD IR observed in lung NETs is not to be considered as a sign of a real HDC expression. It should rather be regarded as the consequence of a cross-reaction of the anti-HDC antibody with DDC, as the Western blotting analysis indicated. In fact, the presence of DDC expression and/or activity in NETs, particularly in SCLC, has been reported in several studies and DDC has been considered as a general endocrine marker (Gazdar et al. 1988; Jensen et al. 1990). To the best of our knowledge, the only molecular analysis of HDC gene expression in SCLC was performed by Graff et al. (2002), and the results were consistent with the presence of a histaminergic phenotype in these tumors. However, only three primary tumors were analyzed with RT-PCR and, as the authors pointed out, the possible contribution of HDC-producing mast cells in the tumor could not be ruled out (Graff et al. 2002).
As a whole, our result showed a discrepancy between v-MAT2 expression and HDC mRNA levels in the majority of the lung PDNECs analyzed. This observation makes a histaminergic phenotype of these tumors improbable but opens the question of the possible biological role of v-MAT2 in HDC-negative tumor cells. It has been proposed that v-MAT2 expression in HDC-defective cells is possibly involved in the storage and utilization of exogenous histamine (Happola et al. 1985; Erickson et al. 1995). However, the role of histamine in the biology of NETs needs further investigation, including the analysis of histamine receptor expression in these neoplasms. As an alternative, it is possible that the solitary expression of v-MAT2 may be related in general with an aminergic phenotype of tumor cells that are DDC IR and not specifically with histamine production. This is suggested by the fact that v-MAT2 expression is reported also in chromaffin cells of the adrenal medulla and in central, peripheral, and enteric neurons, where it is involved in the storage of several amines such as catecholamines, serotonin, and dopamine, which are synthesized by DDC (Erickson et al. 1996). In view of this, v-MAT2 may be considered as a general endocrine marker. At any rate, the ECL-cell tumors of the stomach showed a stronger v-MAT2 IR than the other NETs. On this basis, we suggest that the value of this marker in identifying ECL cells should be retained if a careful evaluation of the quality of the immunostaining is done and a panel of endocrine markers is employed.
In conclusion, this study shows that anti-HDC antibody directed against the whole recombinant protein cross-reacts with DDC. For this reason, HDC-IR in NETs should be critically evaluated and validated with a specific molecular approach. In particular, we demonstrated that HDC IR in lung PDNECs should probably be considered as a cross-reaction with DDC, which is expressed in these tumors both at the mRNA and the protein level. Our results suggest that v-MAT2 and DDC, but not HDC, may be considered as general endocrine markers.