
Abstract
Mitosis is a valuable indicator of active tissue proliferation but, other than morphological characteristics, there have hitherto been no markers available to detect only M-phase cells. However, a newly established monoclonal antibody (MAb), HTA28, recognizing histone H3 (H3) harboring phosphoserine 28, allows visualization with mitotic chromosomal condensation. In this study we investigated the use of HTA28 for immunohistochemical (IHC) detection of M-phase cells in the regenerating rat liver after partial hepatectomy (PH). Groups of three to five rats were sacrificed at intervals up to 72 hr after PH and proliferation was then assessed by IHC staining using HTA28 and other markers. The temporal pattern of the HTA28 staining index (SI) was very similar to that for the mitotic index (MI), also showing similarities to the bromodeoxyuridine (BrdU) labeling index (LI) with a time lag. The HTA28 SI proved to be higher than MI at every time point in line with HTA28 immunoreactivity maintained for all stages of M-phase. The spatial distribution of HTA28-positive cells corresponded with those of other proliferative cell markers. These therefore provide strong evidence for the applicability of HTA28 as an M-phase marker. We also showed that antigenicity for HTA28 is lost if tissue is not immediately fixed after sampling.
Keywords
A
Histones, the major protein constituents of chromatin in the nuclei of eukaryotic cells, are divided into two main groups, core and linker. Core histones are wrapped around DNA as octamers, consisting of two H2A-H2B dimers and one H3-H4 tetramer (D'Anna and Isenberg 1974; Moss et al. 1976; Luger et al. 1997). The N-terminal tails of core histones are subjected to multiple modifications such as acetylation, phosphorylation, methylation, and ubiquitination to maintain several chromatin functions and structures (Cheung et al., 2000; Strahl and Allis, 2000). Histone H3 (H3) phosphorylation is closely linked to mitotic chromosomal condensation, occurring at serine 10 in diverse organisms (Hans and Dimitrov 2001). Recently we reported that H3 phosphorylation occurs not only at serine 10 but also at serine 28 and demonstrated that this coincides with mitotic chromosomal condensation in several types of cultured cells using immunocytochemical and biochemical approaches (Goto et al. 1999). A site- and phosphorylation state-specific antibody was generated to recognize the region around phosphoserine 28 of H3 and named HTA28. The HTA28 antibody could be shown to specifically bind to mitotic but never to interphase cells by immunofluorescence of in vitro cultured cells and by immunoblotting analysis.
Cell proliferation can be induced by various methods in rodents. One well-known and highly reproducible animal model that includes all cell-cycle events is regenerating rat liver after partial hepatectomy (PH), because the liver cells are initially in G0 and then they traverse the cell cycle one to three times before finally decycling back in G0 (Wright and Alison 1984). This animal model has been widely used in studies of methods for measurement of cell proliferation (Alison et al. 1994; Gerlach et al. 1997).
In this study we therefore investigated the utility of the HTA28 antibody for detecting M-phase cells by IHC in regenerating rat liver tissue after PH. The temporal patterns and spatial distributions of HTA28-positive cells were compared with those of BrdU- and Ki-67-positive cells, as well as mitotic figures, in hematoxylin and eosin (H and E)-stained serial sections. Because some proliferating markers, such as PCNA (Hall et al. 1990; Leong et al. 1993), can be readily destroyed with the prolonged fixation, we also investigated the stability of HTA28 antigenicity with prolonged fixation or delay before fixation to provide information about optimal preparation of clinical samples.
Materials and Methods
Animals
Six-week-old male F344 rats were purchased from Charles River Japan (Atsugi, Japan) and housed in plastic cages on wood chips for bedding under constant conditions (12 hr light/dark cycle; 60% humidity at 22 ± 2C). They were fed Oriental NMF diet (Oriental Yeast; Tokyo, Japan) and tap water ad libitum. They were allowed to acclimatize for 1 week before the start of experiments, at which time they were 7 weeks old and weighed 140-150 g. All animals were handled in accordance with the guidelines for animal experimentation of the Faculty of Agriculture, Gifu University and Aichi Cancer Center Research Institute.
Antibodies
Rat monoclonal antibody (MAb) HTA28 was produced using a synthetic peptide PH28 (CKKAARKpSAPATGGV; pS represents phosphoserine), corresponding to the region around the H3 phosphorylation site at serine 28, as an antigen. The specificity of HTA28 has been characterized by immunocytochemistry and immunoblotting analyses as described earlier (Goto et al. 1999). A mouse (MAb) against BrdU (clone Bu20a) and an anti-rat Ki-67 antibody (MIB-5) were purchased from Dako Japan (Kyoto, Japan).
Experimental Protocol
In experiment I (Figure 1A), all rats underwent PH under diethyl ether anesthesia and groups of three to five rats were sacrificed at 0, 12, 18, 24, 30, 36, 48, 60, or 72 hr thereafter. They received an IP injection of BrdU (Sigma Chemical; St Louis, MO) at a dose of 100 mg/kg body weight 1 hr before sacrifice. Liver slices of the right lobe were fixed in 10% neutral buffered formalin immediately after excision for 24 hr at room temperature. Tissues were then processed routinely, embedded in paraffin and sectioned serially at 2 μm for H and E staining and immunostaining for HTA28, BrdU, and Ki-67.
In experiment II (Figure 1B), six rats underwent PH and were sacrificed at 30 hr after PH. This sampling time point was selected to give a moderate proliferative activity and a minimal scatter from the results of experiment I. The right lobe of each liver was separated into 11 pieces and fixed under different conditions. In groups 1-1, 1-2, and 1-3, samples were fixed in 10% neutral buffered formalin for 24, 48, and 168 hr immediately after sacrifice to investigate stability of the antigen against prolonged fixation. In groups 2 and 3, samples were soaked in PBS at RT for 2 and 4 hr, respectively, before fixation in formalin for 24, 48, and 168 hr again to investigate stability. All samples were subsequently processed routinely, embedded in paraffin, and sectioned for HTA28 immunostaining.
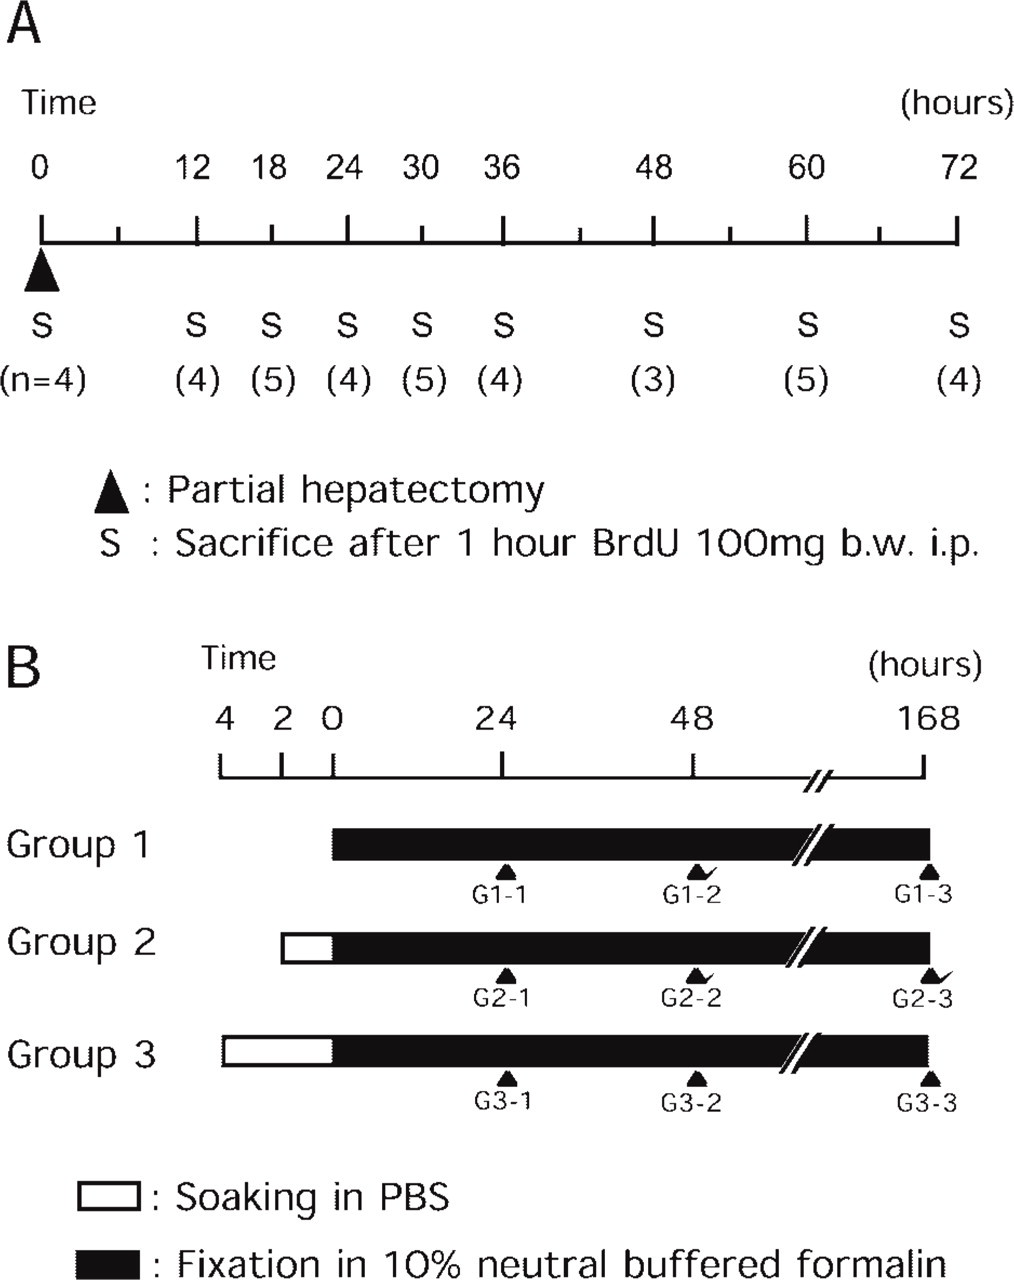
Schematic representation of the protocol. See Materials and Methods for further details.
Immunohistochemistry
After removal of paraffin, endogenous peroxidase was blocked with incubation in 0.3% H2O2 in methanol for 20 min at RT. Sections for HTA28 and Ki-67 staining were then pretreated in a microwave oven (type MI-77; Azumaya, Tokyo, Japan) in 0.01 M citrate buffer at pH 6.0 for 10 min at 98C with continuous monitoring of solution temperature using a temperature probe. After rinsing in PBS, nonspecific binding sites were blocked by incubation with diluted normal horse serum for 20 min at RT. Primary antibodies diluted in PBS were applied (diluted at 1:500, 1:50, and 1:100 for HTA28, BrdU, and Ki-67, respectively) and incubated overnight at 4C. Influence of the staining procedure itself was assessed in negative controls by omitting the primary antibodies using regenerating rat liver tissue 24 hr after PH. After incubation, sections were washed with PBS and processed for avidinbiotin-peroxidase staining (Vectastain ABC kit; Vector Laboratories, Burlingame, CA) according to the manufacturer's instructions. Sections were then incubated in 3,3′-diaminobenzidine and H2O2 to provide the chromogen, washed in running tapwater, and lightly counterstained in Meyer's hematoxylin.
Analysis of Sections
In experiment I, the numbers of HTA28-, BrdU-, and Ki-67-positive hepatocytes, as well as mitotic figures in H and E sections, were counted at ×400 magnification and the percentages of positive cells to a total of 1000 or more hepatocytes were calculated for each time point. Here we counted metaphase and anaphase cells in H and E sections as mitotic figures to calculate mitotic indices (MIs).
In experiment II, only mitotic figures (metaphase and anaphase cells) were counted at ×400 magnification. One hundred or all mitotic figures (sometimes mitotic figures were less than 100 in one section) were counted and the percentages of HTA28-positive cells were calculated.
Statistical Analysis
In experiment I, the significance of differences was statistically evaluated using the Mann-Whitney U-test for comparisons between the HTA28 staining index (SI) and MI at each time point after PH. Linear regression analysis was used to determine the relationship between the HTA28 SI and MI. In experiment II, the significance of differences was statistically evaluated using the Mann-Whitney U-test for comparisons among groups and the Kruskal-Wallis test for comparisons within the same time group (within groups 1, 2, and 3).
Results
Experiment I
Temporal Patterns of Proliferating Cells. The temporal patterns of HTA28-, BrdU-, Ki-67-positive cells and mitoses are shown in Figure 2. HTA28-positive cells and mitoses demonstrated two peaks at 24 and 48 hr after PH. The maximal levels were 5.0% for HTA28 and 2.1% for mitoses at 24 hr. The HTA28 SI was consistently higher than the MI at every time point, and with statistical significance at 12, 30, and 60 hr (p<0.05). BrdU-positive cells in S-phase of the cell cycle exhibited three peaks, at 18, 36 and 60 hr after PH, and the maximum labeling index was 34.0% at 18 hr. Ki-67-positive cells increased rapidly between 12 and 18 hr, reached a maximal level of 70.7% at 36 hr, and then decreased slowly.
Linear Regression Analysis of HTA28 SI and MI. A highly significant (p<0.001) positive correlation was found between HTA28 SI and MI, with a correlation coefficient of r = 0.933 (Figure 3). The slope for the regression line of HTA28 SI plotted against MI was calculated to be 1.80.
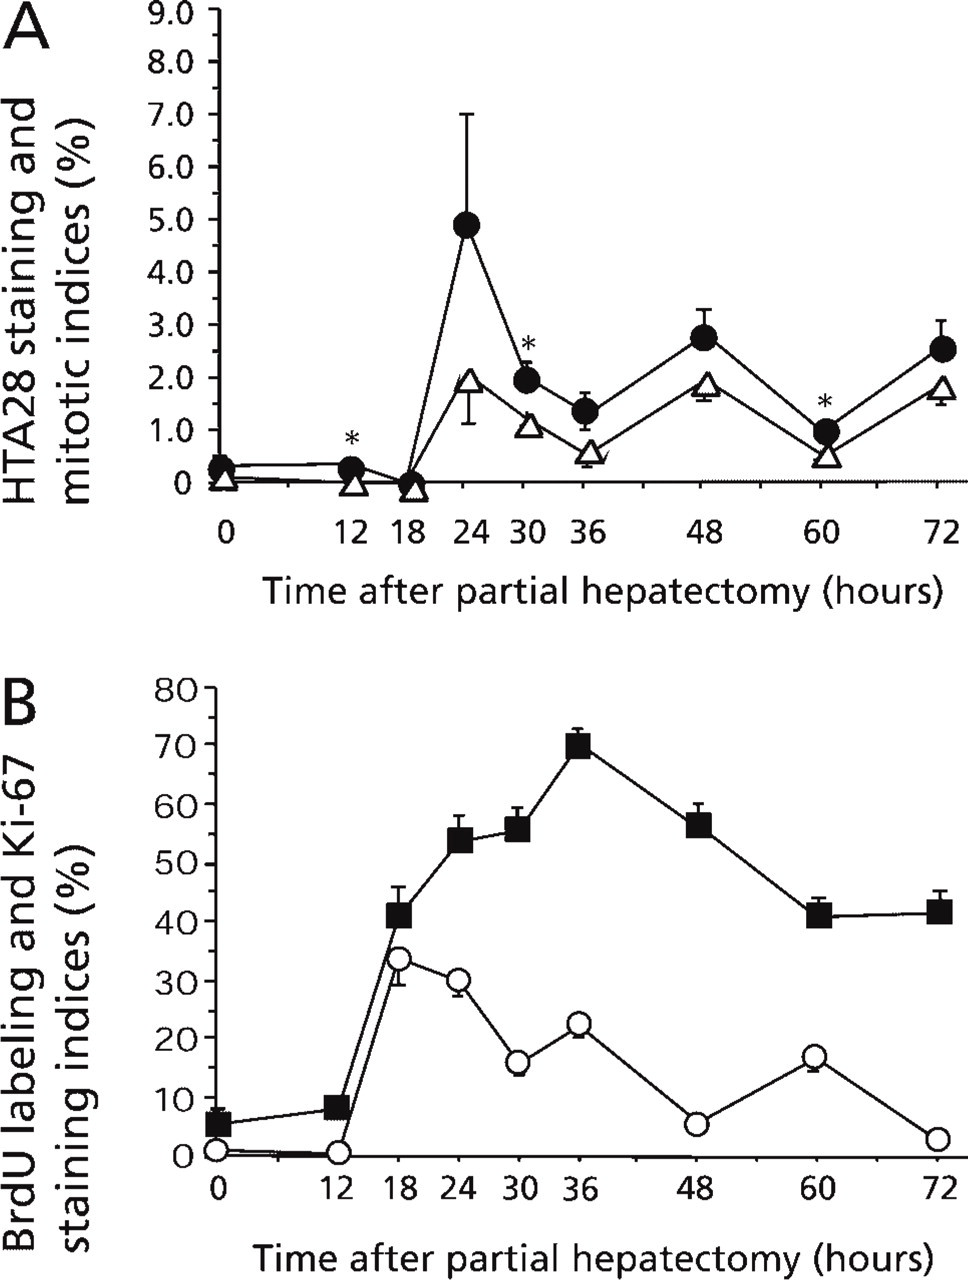
Cell proliferation indices after partial hepatectomy. (
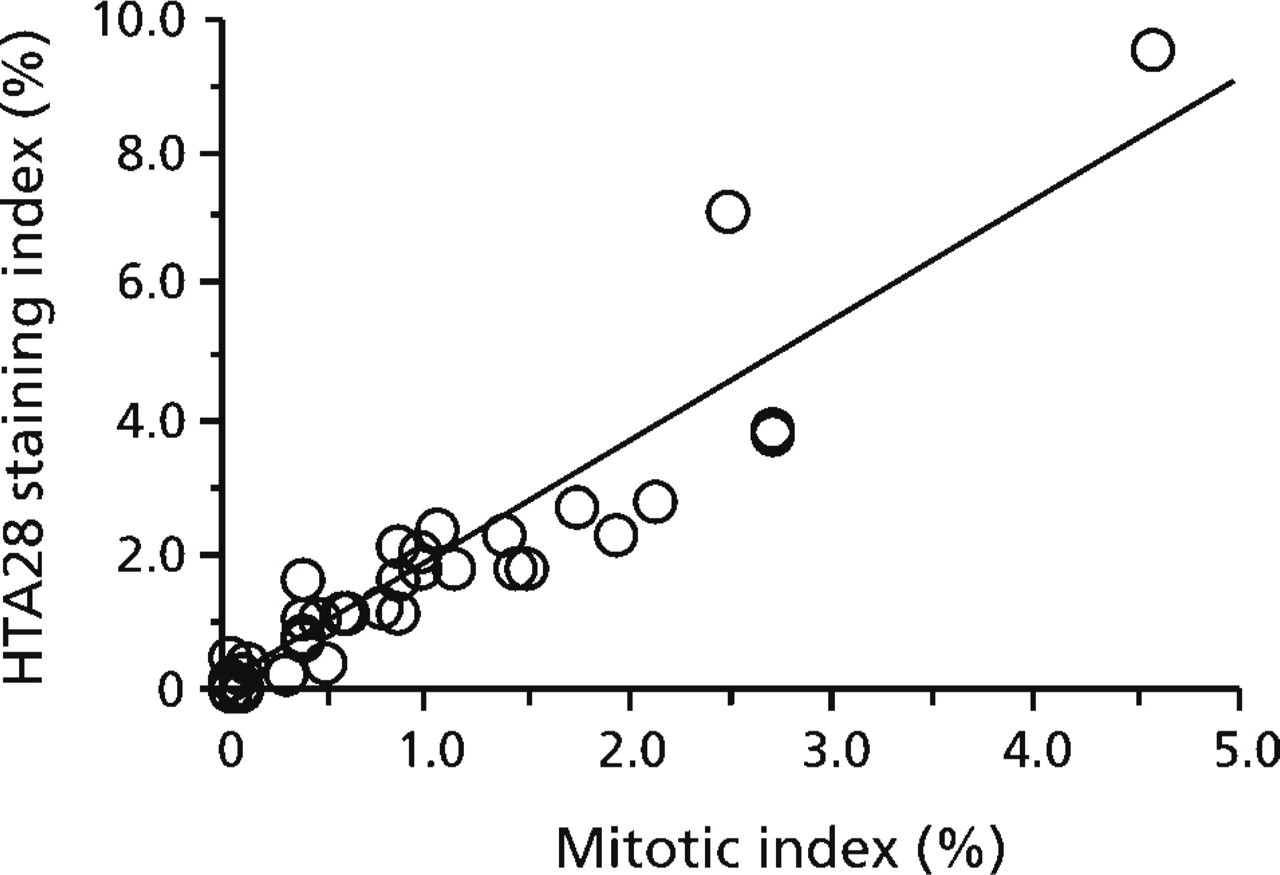
Correlation between HTA28 LI and MI for 38 samples. y-axis, HTA28 LI; x-axis, MI in H and E-stained sections. y = 1.802×+0.047; n = 38; r = 0.933; p<0.001.
Spatial Distribution of Proliferating Cells. Figure 4A shows the distribution of HTA28-positive cells at 24 hr after PH. Most were found in the periportal areas of lobules within the first 36 hr after PH. At 48 hr, positive cells were mainly detected in the midzonal and central areas. BrdU-positive cells were also localized periportally during the first peak at 18-24 hr. At the second peak, BrdU-positive cells were mainly localized in the periportal area but were also detected in the midzonal and central areas. Ki-67-positive cells were observed in the periportal and midzonal areas in the first 36 hr after PH.
Immunoreactivity of HTA28. Figure 4B shows HTA28-positive cells in each stage of M-phase, distinguished by the shape of their nuclei. HTA28 was found to react strictly with the nuclei, with no staining of the cytoplasm. Immunoreactivity appeared from prophase and was maintained throughout all stages of M-phase until telophase, although the nuclei in telophase cells were stained less strongly than in earlier stages. No mitotic cells were positively stained without the primary antibody, confirming the specificity (data not shown).
Experiment II
Table 1 shows the results of experiment II. The HTA28 SI significantly decreased with time in PBS before fixation (group 1-1 vs 2-1 and 3-1; p<0.01) and with the fixation period (among groups 1-1, 1-2, and 1-3; p<0.01).
Discussion
It is well known that H3 phosphorylation at serine 10 is closely linked to chromosomal condensation (Cheung et al. 2000; Strahl and Allis 2000). Goto et al. (1999) reported that phosphorylation can also occur at serine 28, providing the rationale for the present study. HTA28 was generated that can specifically recognize phosphorylation of H3 at serine 28 by utilizing the approach to producing site- and phosphorylation state-specific antibodies with synthetic phosphorylated peptides as antigens (Czernik et al. 1991; Nishizawa et al. 1991; Inagaki et al. 1997). In this study we selected HTA28, an antibody that recognizes H3 phosphorylated at serine 28 but not serine 10, as a candidate IHC marker of M-phase cells because HTA28 specifically binds to mitotic but never to interphase cells. In contrast, antibodies recognizing H3 phosphorylated at serine 10 also react with interphase cells in immunocytochemical and immunoblotting analyses (Goto et al. 1999; Juan et al. 1998). It is noteworthy that the temporal pattern of HTA28 SI with the present experiments was very similar to that for the MI, with a highly significant (p<0.001) positive correlation apparent on linear regression analysis. However, absolute values for HTA28 SI were higher than for MI at all time points, in line with the consistent observation that immunoreactivity was in all stages of M-phase from prophase through telophase. Although statistical significance was attained only at three time points, because of a scatter of proliferation rates among individual animals, it was generally possible to detect approximately twice as many M-phase cells using HTA28 immunostaining in accordance with the slope of the regression line for HTA28 SI being 1.80 against MI. Moreover, mitoses can be detected more readily with HTA28 immunostaining than in H and E-stained sections, since pyknotic nuclei of degenerating or necrotic cells are frequently hard to differentiate from actual mitotic figures. Therefore, HTA28 is very useful for detection of M-phase cells in tissue sections.
The temporal pattern of HTA28 SI showed the expected similarity with that for BrdU LI with a time lag of 6 hr, although the magnitudes of the labeling indices were quite different, presumably reflecting the respective phase duration (Wright and Alison 1984). Because the S-phase is much longer than the M-phase, it is reasonable that the BrdU LI was much higher. There have been many reports of a time lag of 4-6 hr between S- and M-phase peaks (Grisham 1962; Fabrikant 1968; Whitfield et al. 1980; Wright and Alison 1984).
The spatial distribution of HTA28-positive cells in the liver after PH also corresponded with that of BrdU-positive cells in the present study. It is widely accepted that DNA synthesis in the regenerating liver shows a periportal preponderance in the first 36 hr after PH (Wright and Alison 1984). The subsequent shift towards the midzonal area has also been previously reported (Harkness 1952; Grisham 1962; Fabrikant 1967,1968).
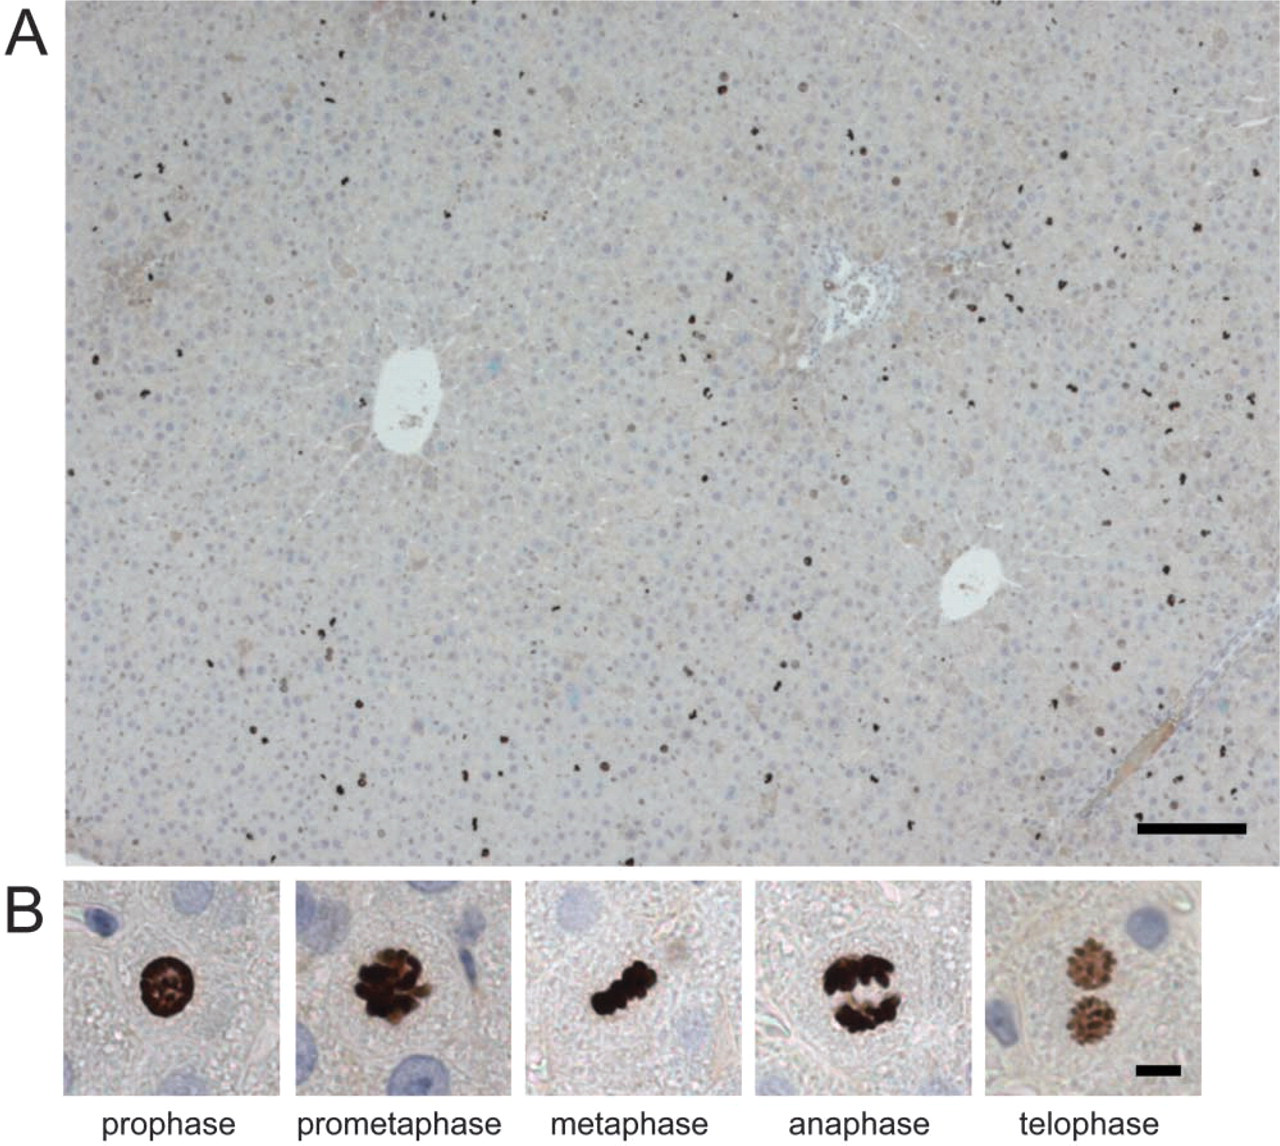
HTA28-stained cells in regenerating rat liver tissue at 24 hr after PH. (
The temporal pattern and distribution of Ki-67-positive cells found here were in line with previous reports (Gerlach et al. 1997). Ki-67 SI was the highest at every time point among indices of other proliferative markers because this antigen is expressed throughout all active phases of the cell cycle. Therefore, the MIB-5 antibody would be expected to have the greatest sensitivity to detect proliferating cells.
In the present IHC study, reactivity for HTA28 was maintained through all stages of M-phase from prophase to telophase, although telophase cells were stained relatively weakly, indicating primary expression of the antigen epitope in the early stages of M-phase. Immunoreactivity of HTA28 was found to decrease at the beginning of anaphase and to completely disappear during late anaphase in cultured cells with an indirect immunofluorescence technique (Goto et al. 1999). This difference in findings may be caused merely by differences of fixatives, labeling methods, or conditions of cells between in vivo and in vitro. Indeed, we have established that it is possible to readily detect cells in telophase by increasing the amount of the antibody and/or extending the development time with chromogens (unpublished results).
In experiment II, antigenicity was severely lost with introduction of a period before fixation, with ~30% reduction of an HTA28 SI by soaking tissues in PBS for only 2 hr, even when they were appropriately fixed (for 24 hr in formalin) afterward. Moreover, antigenicity was also lost after elongated fixation times, with statistical significance in group 1. Actually, a few cells (3.4%) were already not positive although they showed mitotic figures (metaphase and anaphase) even after only 24 hr fixation. Loss of antigenicity might be caused by dephosphorylation at serine 28 of H3 because obvious changes such as degeneration were not apparent on H and E staining. It has been confirmed that HTA28 reacts with the synthetic peptide PH28 (CKKAARKpSAPATGGV; pS represents phosphoserine) but not with H28 (CKKAARKSAPATGGV) (Goto et al. 1999). Therefore, surgeons and pathologists are recommended to immediately and precisely fix samples if clinical specimens are to be examined.
Stability of the nuclear antigen recognized by HTA28 with prolonged fixation and period before fixation
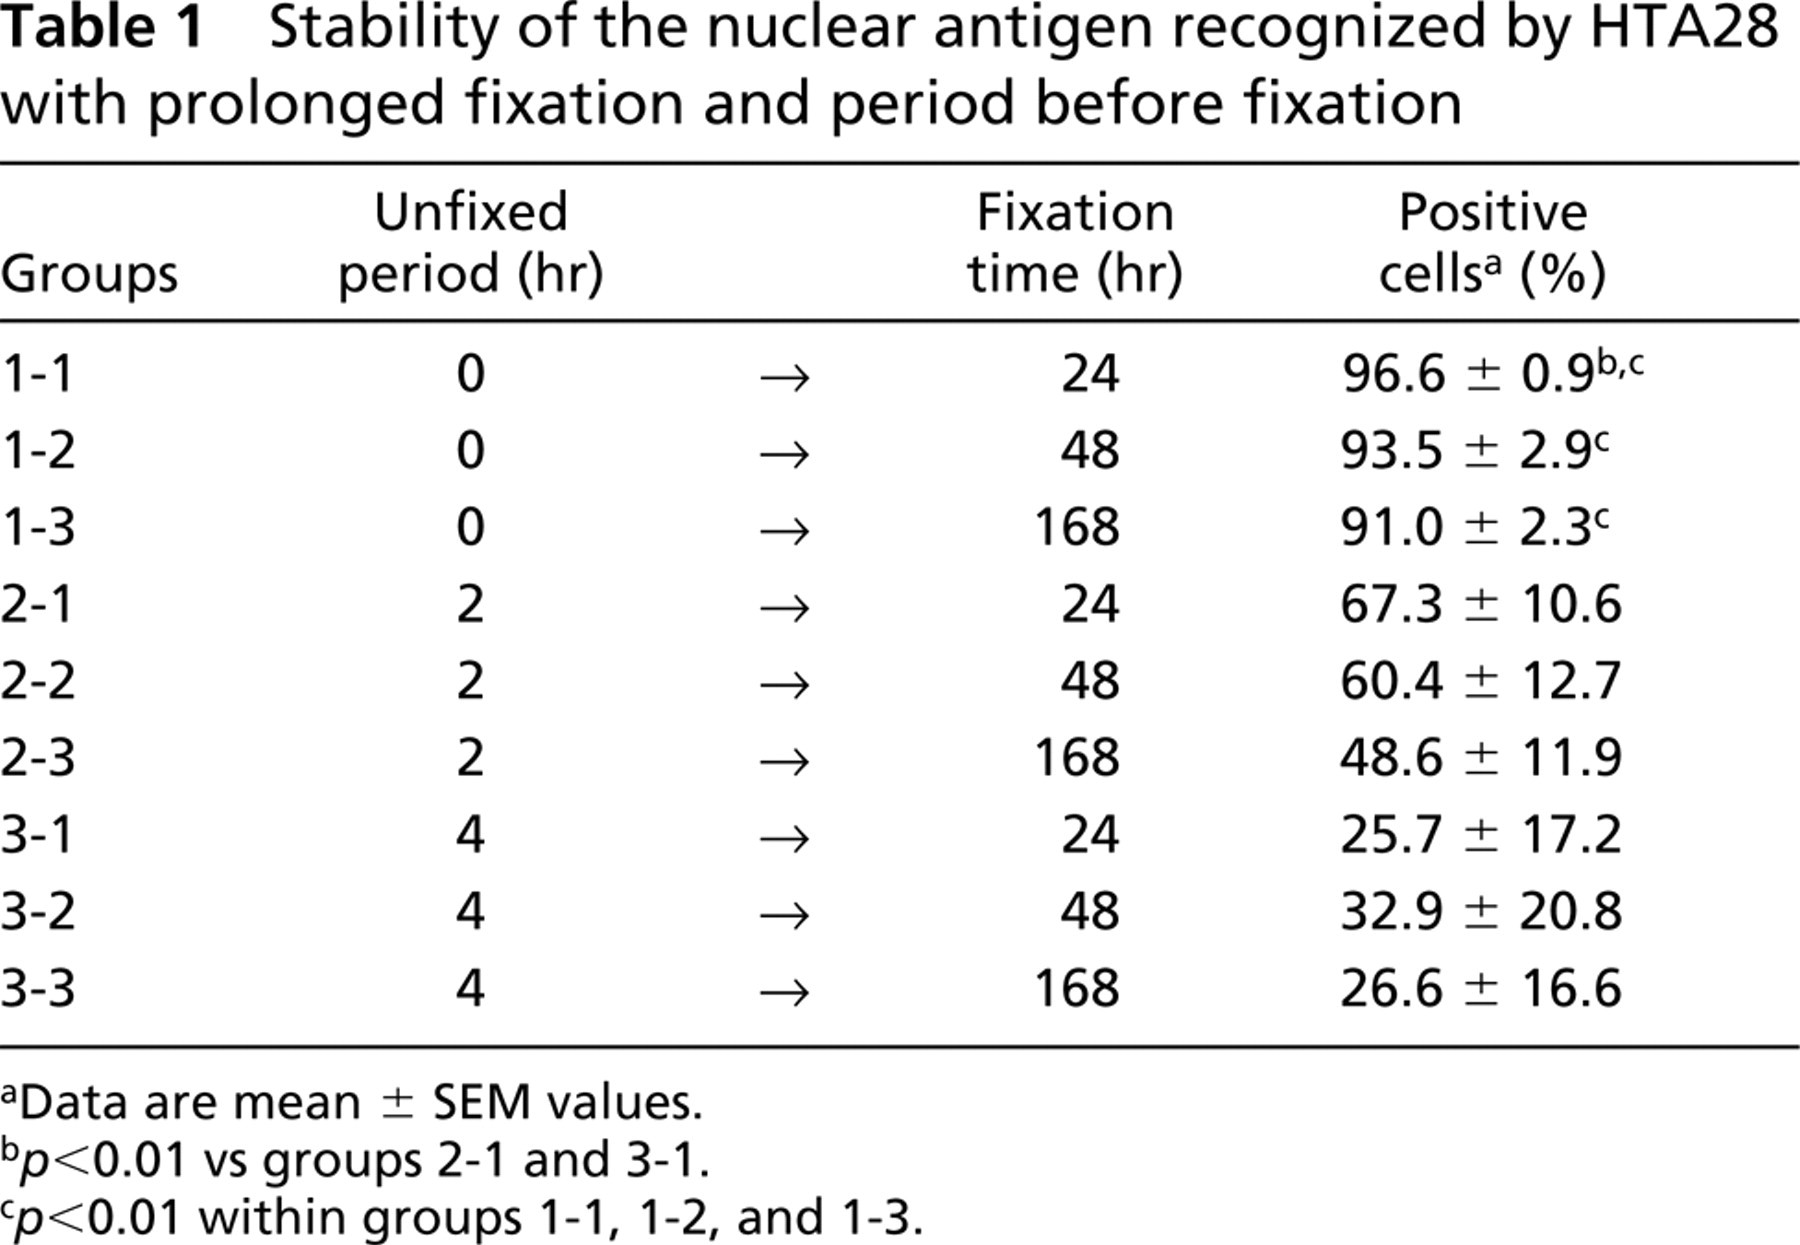
aData are mean ± SEM values.
b p<0.01 vs groups 2-1 and 3-1.
c p<0.01 within groups 1-1, 1-2, and 1-3.
In the present study, we clearly demonstrated that HTA28 is a useful IHC marker of M-phase cells. HTA28 might find application to human and other animal tissues because H3 phosphorylation at serine 28, as well as at serine 10, may be conserved across species (Wei et al. 1998). Assessment of proliferative activity of tumor cells is clinically very important for the evaluation of patients' prognosis. Miscellaneous parameters have been proposed as prognostic markers for different human neoplasms (Hall and Levison 1990; Linden et al.1992; Sallinen et al. 1994), and HTA28 might be particularly useful because it can detect actual mitoses more sensitively than can morphological assessment. Moreover, HTA28 is also applicable for retrospective investigations with archival materials because it has the advantage of allowing the cell proliferative status in tissue sections to be evaluated through an appropriate antigen retrieval technique without pretreatment.
Footnotes
Acknowledgements
Supported in part by a Grant-in-Aid for Cancer Research from the Ministry of Health, Labor and Welfare, Japan, and by a Grant-in-Aid from the Ministry of Education, Culture, Sports, Science and Technology of Japan.
We thank Ms Hisayo Ban and Mr Tatsuya Wani for expert technical assistance.