
Abstract
Epithelial proliferation in the rat mammary gland is recommended in regulatory guidelines as an endpoint for assessment of the in vivo carcinogenic potential of insulin analogues. Epithelial proliferation is traditionally assessed by immunohistochemical staining of a proliferation marker, for example, 5-bromo-2′-deoxyuridine (BrdU) or Ki67, followed by labor-intensive manual counting of positive and negative cells. The aim of this study was to develop and validate an approach for image analysis based on artificial intelligence, which can be used for quantification of proliferation in rat mammary gland, independent of the choice of proliferation marker. Furthermore, the aim was to compare the markers BrdU, Ki67, and phosphorylated histone H3 (PHH3). A sequence of image analysis applications were developed, which allowed for quantification of proliferative activity in the mammary gland epithelium. These endpoints agreed well with manually counted labeling indices, with correlation coefficients in the range ≈0.92–0.93. In addition, all three proliferation markers were significantly correlated and could detect the variation in epithelial proliferation during the estrous cycle. In conclusion, image analysis can be used to quantify epithelial proliferation in the rat mammary gland and thereby replace time-consuming manual counting. Furthermore, BrdU, Ki67, and PHH3 can be used interchangeably to assess proliferation:
Keywords
Introduction
The insulin analogue B10Asp (X10) increased the incidence of mammary tumors in female rats in a 12-month chronic toxicity study, 1 and this correlated with an increased mitogenic potency of X10 in various cell lines in vitro.2,3 This led to a recommendation from the European Medicines Agency (EMA) that quantification of mammary gland proliferation in vivo could be performed as part of the non-clinical safety assessment of novel insulin analogues, 4 and mammary gland proliferation has therefore been included as an endpoint in repeat-dose toxicity studies during non-clinical development of insulin analogues. A recent study described that proliferation of normal rat mammary gland epithelium is not a predictive marker of receptor-mediated carcinogenic effects of insulin analogues, 5 but assessing mammary gland cell proliferation is still often implemented in non-clinical development programs, based on current recommendations from regulatory authorities regarding non-clinical safety assessment of insulin analogues.
Mammary gland proliferation is traditionally assessed by immunohistochemical staining for a proliferation marker [e.g., 5-bromo-2′-deoxyuridine (BrdU) or Ki67] and subsequent manual counting of positive and negative mammary epithelial cells, for calculation of the labeling index (LI). Various approaches for manual counting of cells have been described, which are all time-consuming and prone to interoperator and intraoperator variation.6,7 Two recent studies used image analysis software based on artificial intelligence (AI) to quantify mammary gland proliferation, detected with Ki67 7 or BrdU. 6 However, an approach with digital image analysis with commercially available software, which would allow for assessment of proliferation in rat mammary gland independent of choice of proliferation marker, has not been described previously and would be a clear advantage.
The aim of this study was therefore to develop and validate an image analysis method based on AI, for quantification of epithelial proliferation in rat mammary gland tissue, independent of the applied proliferation marker. This was done by staining mammary gland tissue from young and older rats with the proliferation markers BrdU, Ki67, and phosphorylated histone H3 (Ser10) (PHH3). BrdU (thymidine analogue which is incorporated in DNA during S-phase) and Ki67 (expressed in all phases of the cell cycle except G0) are commonly applied markers of proliferating cells. Histone H3 is phosphorylated at Ser10 only during late G2 and mitosis. 8 The AI module in image analysis software VIS (Visiopharm A/S; Hørsholm, Denmark) was used to develop a workflow for quantification of mammary gland proliferation. This image analysis workflow was validated by calculation of standard performances indices and by comparison to manually counted cell numbers and LIs in a test dataset. Finally, the correlation between the proliferation markers BrdU, Ki67, and PHH3 in the rat mammary gland was characterized, to explore if these proliferation markers are equally well suited for detection of proliferation in the rat mammary gland.
Materials and Methods
Animals
This study included 31 outbred female Sprague–Dawley rats (NTac: SD), from an experiment described previously. 6 These rats were 13–15 weeks old at sacrifice and referred to as the “young” rats in this study. Furthermore, this study included 19 outbred female Sprague–Dawley rats (NTac: Sd) from another experiment described previously. 9 These 19 rats were approximately 10 months old at sacrifice and are referred to as the “old” rats in this study. Details of origin, acclimatization, housing, type of treatment, method of sacrifice, and collection of tissue are described for the young and old rats in the corresponding original studies.6,9 All rats had been dosed intraperitoneally (ip) with 50 mg/kg BrdU (Sigma-Aldrich; Brøndby, Denmark), dissolved at 5 mg/ml in sterile 0.9% NaCl solution (Sigma-Aldrich), 6 and 3 hr before sacrifice. The rats were grouped according to which phase of the estrous cycle they were in at the time of sacrifice (assessed by histological analysis as described previously, 9 i.e., proestrus, estrus, metestrus, or diestrus), if they were spontaneous pseudopregnant (PP) as described previously, 10 or if they (young rats only) were treated with a combination of estradiol-17β and progesterone (E + P) (both chemicals from Sigma-Aldrich) for 5 or 19 days, as described previously. 6 An overview of the number of rats in the different groups is provided in Table 1. From the young rats, mammary gland number 4 and 5 were used in this study (to explore potential differences between glands) and from the old rats, mammary gland number 4 was used. The sampling guideline for toxicity studies suggests to collect the mammary gland tissue in the inguinal area. 11 Such a sample is likely to contain tissue from both the fourth and fifth mammary gland.
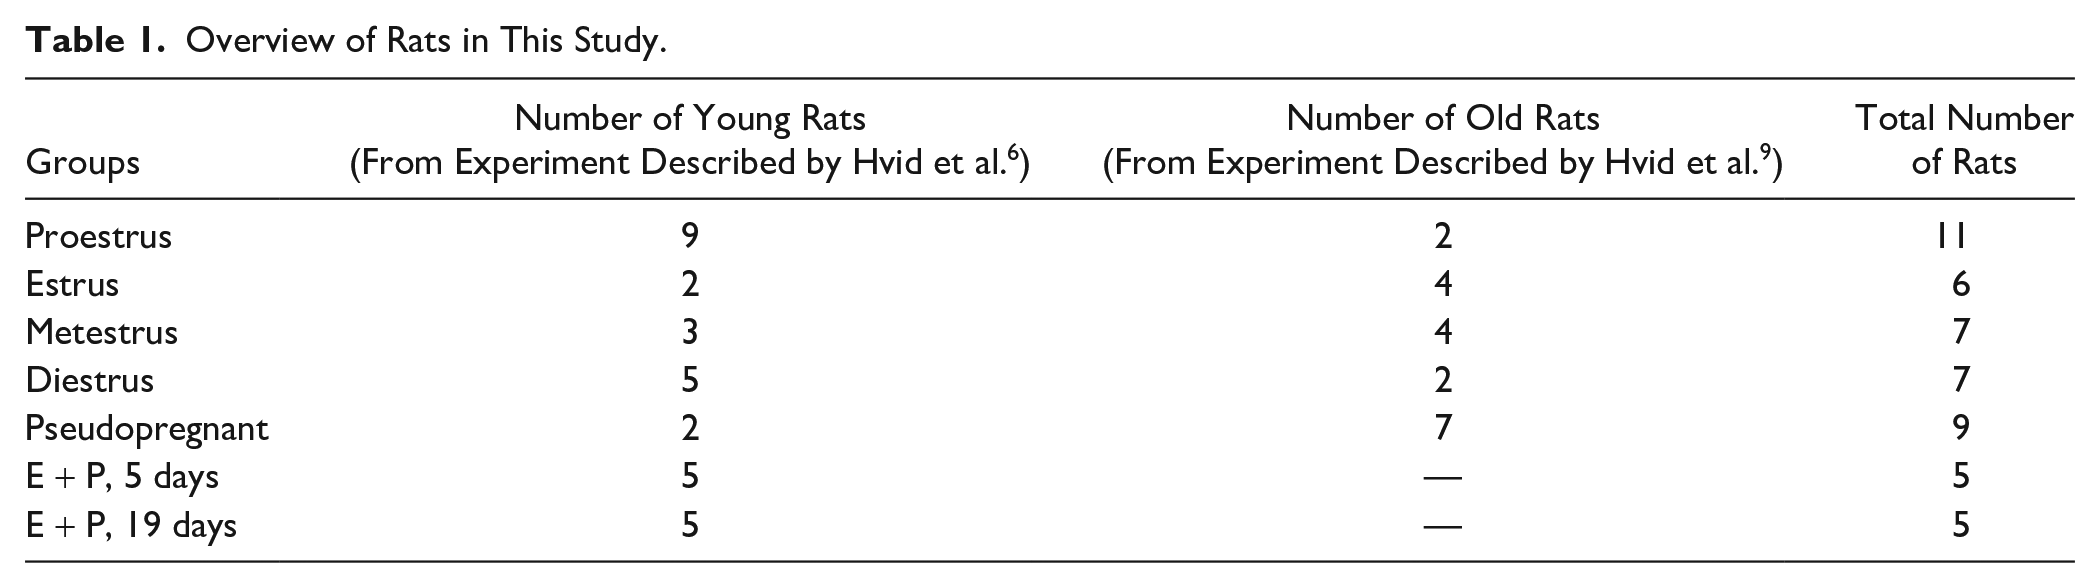
Overview of Rats in This Study.
Immunohistochemistry
Mammary glands were collected, fixed, processed, and embedded in paraffin and serial horizontal mammary gland sections of 3-µm thickness were cut as described previously 12 (one section for each IHC staining) and mounted on Superfrost+ glass slides. Immunohistochemical staining for BrdU, Ki67, and PHH3 was performed on serial sections on a Ventana Discovery Ultra platform (Roche; Hvidovre, Denmark). Details regarding antibodies and reagents are described in Table 2. In brief, all sections were heated at 60C for 32 min before heat-induced epitope retrieval (HIER), performed in CC1 buffer (Roche) with pH 8.4. Mammary gland tissue from young and old rats required different duration of HIER for optimal staining of Ki67 and PHH3. Endogenous peroxidase activity was quenched with application of Discovery inhibitor (Roche). The slides were then rinsed in Reaction buffer (Roche) (this buffer was used at all rinsing steps unless otherwise stated) and unspecific binding of the primary antibody was blocked with incubation in TNB (consisting of 100 mM Tris-HCl (pH 7.5), 150 mM NaCl and 0.5% Blocking reagent (Roche)) blocking buffer (Roche) for 20 min.The relevant primary antibodies were applied as described in Table 2, followed by detection polymer. Thereafter, the sides were incubated with purple chromogen (Roche) for 32 min. The slides were finally counterstained in hematoxylin (Sigma-Aldrich) for 4 min, rinsed in tap water, dehydrated, and cover glasses were mounted with Pertex (Sigma-Aldrich). Rat intestinal sections were stained as positive control. Negative controls included omission of the primary antibody and replacement of the primary antibody with sheep IgG (BrdU stain) (Jackson ImmunoResearch; West Grove, PA) or rabbit IgG (Ki67 and PHH3) (Jackson ImmunoResearch), applied in the same concentration as the corresponding primary antibodies.
Details of IHC.
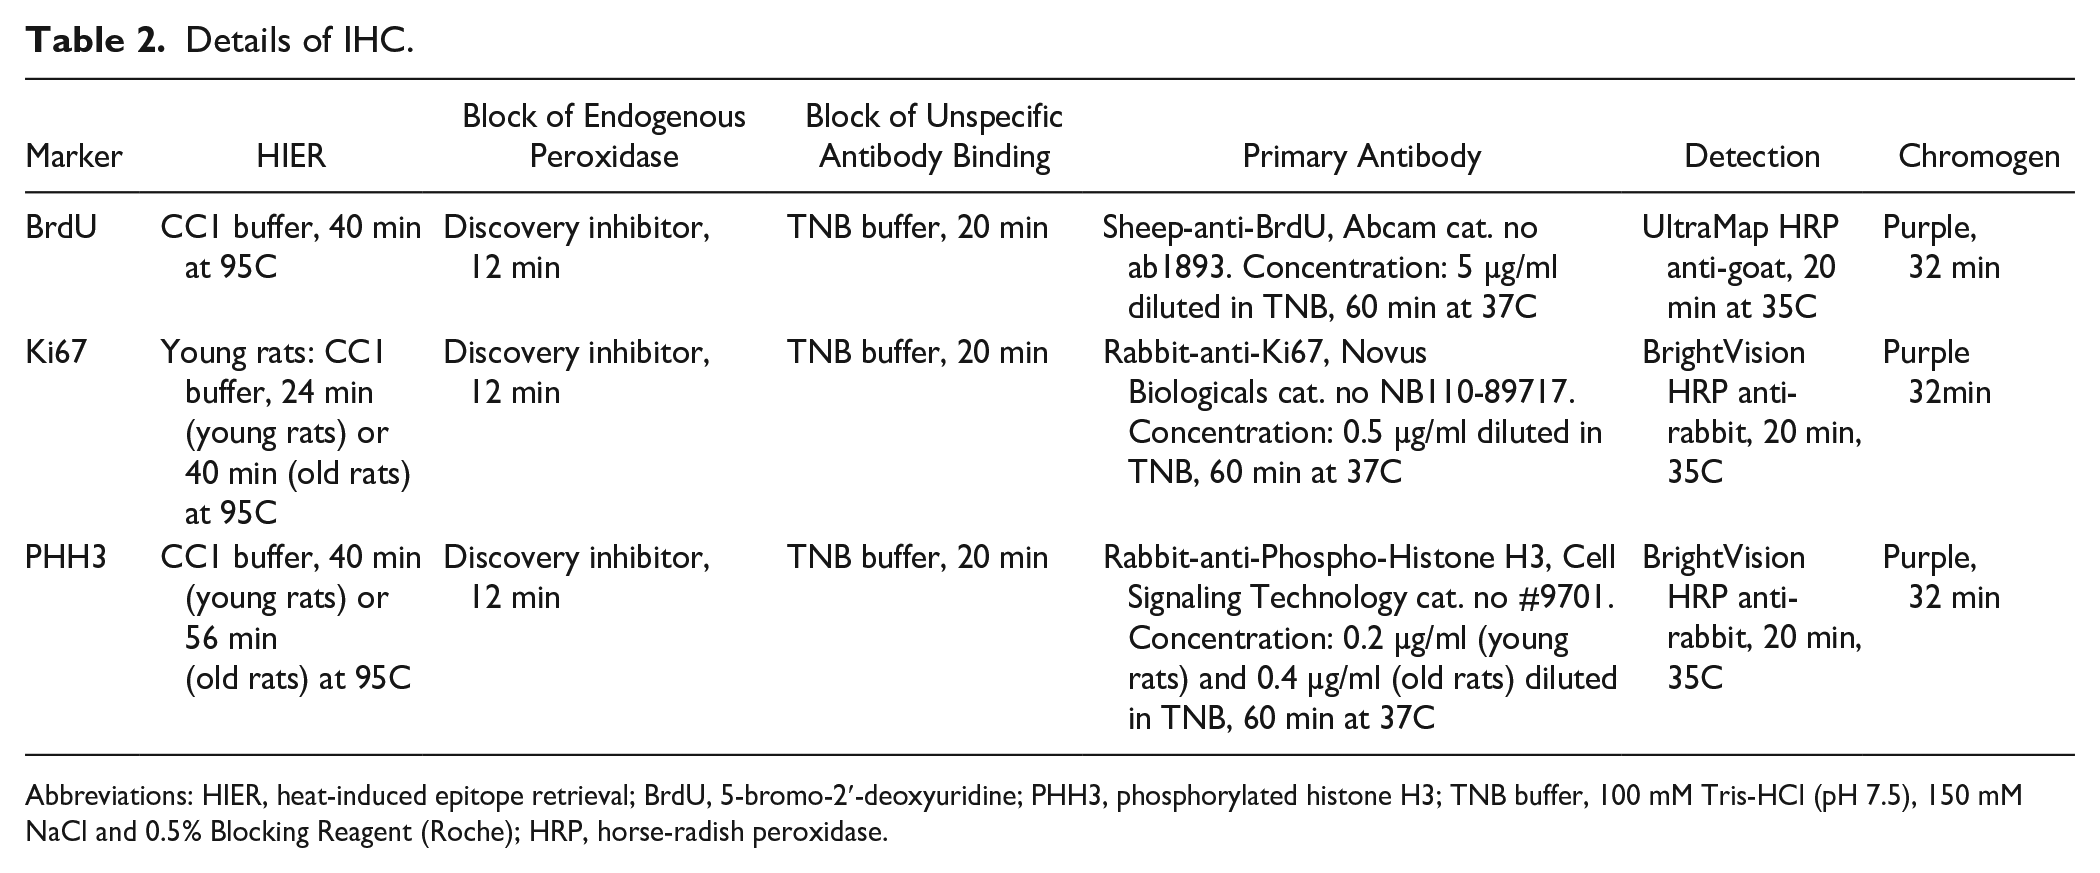
Abbreviations: HIER, heat-induced epitope retrieval; BrdU, 5-bromo-2′-deoxyuridine; PHH3, phosphorylated histone H3; TNB buffer, 100 mM Tris-HCl (pH 7.5), 150 mM NaCl and 0.5% Blocking Reagent (Roche); HRP, horse-radish peroxidase.
Scanning of Mammary Gland Sections
A digital whole-slide image of each rat mammary gland section at 20× magnification was generated on a NanoZoomer 2.0HT digital slide scanner (Hamamatsu; Hamamatsu City, Japan) according to the manufacturers’ instructions.
Assessment of Epithelial Proliferation in Rat Mammary Gland Sections by Manual Counting of Proliferating and Non-proliferating Cells
In the mammary gland sections, mammary epithelial cells with positive staining for a given proliferation marker and the total number of mammary epithelial cells were counted in whole-slide images as described previously, 12 using software VIS (Visiopharm A/S). In brief, ≈200 fields of vision and minimum ≈200 total mammary epithelial cells were identified in each whole-slide image by systematic random sampling using the stereology module in VIS, at 40× magnification. BrdU+/Ki67+/PHH3+ mammary epithelial cells were counted in a primary counting frame and the total number of mammary epithelial cells was counted in a secondary counting frame superimposed on each field of vision, with an area of 67 × 103 µm2. The primary counting frame was set to 70% (BrdU), 60% (Ki67), or 90% (PHH3) of the vision field because the number of positively stained mammary epithelial cells varied for the different markers. To count approximately the same number of total mammary epithelial cells, the area of the secondary counting frame was set to 5% (BrdU and Ki67) or 4% (PHH3) of the primary counting frame because the total number of mammary epithelial cells was considerably higher than the number of positive mammary epithelial cells. There was pronounced hyperplasia of the mammary gland epithelium in rats treated with E + P, and in these rats, it was sufficient to sample 50 fields of vision to count minimum 200 mammary epithelial cells in the secondary counting frame. The counts of positive and total mammary epithelial cells were adjusted for the different areas of the counting frames and used for calculation of the LIs (percentage of positively stained mammary epithelial cells). To test the reproducibility and assess the within-section variation in the LI for each proliferation marker, sections from four different rats, where the proliferative activity gradually increased from low to very high, were counted 3× by the same operator, in independent random sampling procedures. These three estimates of the LI were used to calculate the within-section coefficient of variation (= standard deviation divided by the mean value).
Definition of Workflow and Training of Algorithms for Image Analysis
First, the rats were divided in a training dataset and a test dataset. This was done by randomly selecting one young and one old rat from each of the groups in the study, to ensure all experimental conditions were represented in the training dataset. Thereby the training dataset comprised whole-slide images from 12 rats and the test dataset comprised whole-slide images from 38 rats. From each rat, IHC was performed for BrdU, Ki67, and PHH3, and all staining was included in the training and test datasets. Furthermore, from the young rats, two mammary glands (number 4 and 5) were included from each animal. A few sections had sectioning and/or staining artifacts which made them unsuitable for training and/or analysis, which meant the training dataset in total comprised 33 whole-slide images from 12 different rats, and the test dataset in total comprised 186 whole-slide images from 38 different rats (Fig. 1A and B).
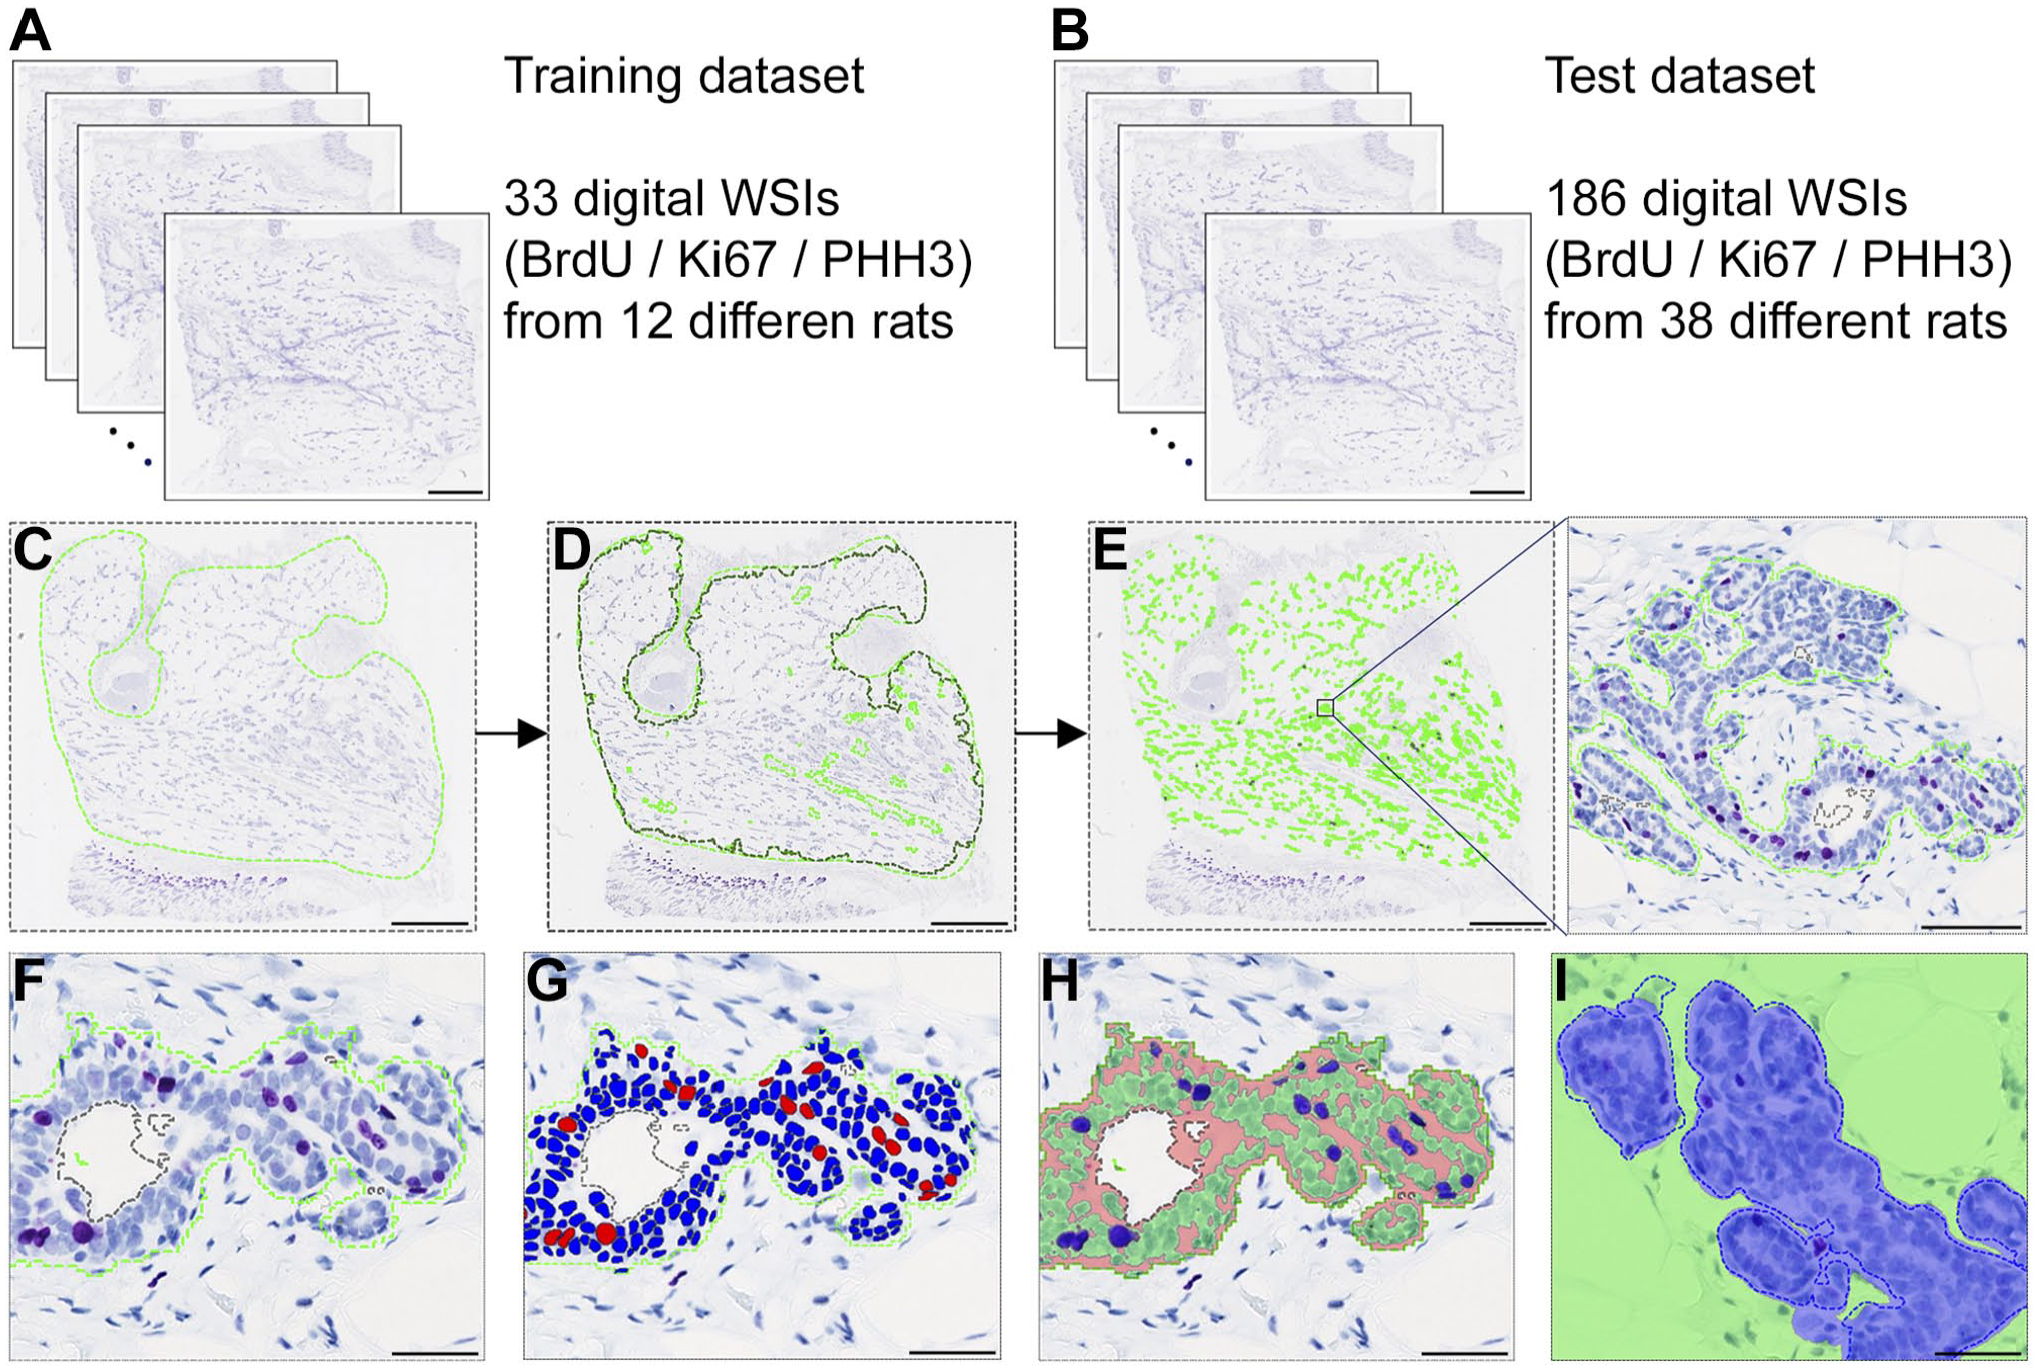
Image analysis workflow and validation of artificial intelligence (AI) apps. The 219 whole-slide images from 50 different rats were divided in a training dataset (panel A) and a test dataset used for validation (panel B). Scale bars in panel A and B = 2.5 mm. C: In the first step in the image analysis workflow, areas with mammary gland tissue were manually outlined in each whole-slide image. Scale bar = 2.5 mm. D: Then, an AI app which identified areas with mammary fat pad was applied. Scale bar = 2.5 mm. E: Subsequentially, mammary gland epithelium was identified with an AI app. Scale bar = 2.5 mm in panel E and scale bar = 100 µm in the insert. In the identified mammary gland epithelium (panel F), positive and negative nuclei of mammary epithelial cells were then identified with an AI app (panel G). Furthermore, with a Bayesian classifier (panel H), the areas of positive nuclei (blue overlay) and negative nuclei (green overlay) in the mammary gland epithelium were quantified. Scale bars in panels F, G, and H = 50 µm. I: In randomly selected validation regions, the mammary gland epithelium was manually outlined (blue dashed line, ground truth), and the AI app subsequently classified the area in the region as mammary gland epithelium (blue overlay) or non-epithelium (green overlay). Based on classification of each pixel as true positive, true negative, false positive, or false negative, Dice coefficient, the sensitivity, and precision were calculated. Scale bar in panel I = 50 µm. Abbreviations: BrdU, 5-bromo-2′-deoxyuridine; PHH3, phosphorylated histone H3; WSIs, whole-slide images.
Next, a workflow was defined for the image analysis in software VIS. It consisted of the following sequential steps:
Manual high-level identification of areas with mammary fat pad in each whole-slide image by visual inspection and outlining at low magnification in VIS (performed at 2× magnification or lower) (Fig. 1C). Artifacts and regions in the whole-slide images which clearly were not mammary fat pad (e.g., lymph nodes, larger areas with hair follicles, epidermis, subcutis, cutaneous muscle) would be excluded manually at this step.
Detailed identification of mammary fat pad within the manually outlined area with an image analysis application based on AI (AI app) (Fig. 1D).
Detailed identification of mammary gland epithelium with the mammary fat pad area identified in step 2, with an AI app (Fig. 1E and F).
Exclusion of larger areas with lumen from the mammary gland epithelium, identified in step 3, with an AI app.
Identification of positive and negative nuclei in the regions with mammary gland epithelium identified in step 4, with an AI app (Fig. 1G).
As a supplement to identification of positive and negative nuclei in step 5, the area of positive and negative nuclei within the regions with mammary gland epithelium, identified in step 4, was also assessed with a Bayesian classifier (Fig. 1H). Based on this, the fractional area of epithelial nuclei (nuclear AF) with staining for each proliferation marker was calculated.
The AI app for identification of mammary fat pad (step 2), the AI app for identification of mammary gland epithelium (step 3), and the AI app for exclusion of lumen from regions with mammary gland epithelium (step 4) were all Deep Learning U-Net classifying algorithms in VIS. For training of the AI app for identification of mammary fat pad, all the tissues in the 33 whole-slide images in the training dataset were annotated as either background (i.e., not mammary fat pad) or mammary fat pad. This meant that areas with connective tissue, hair follicles, and larger blood vessels, present in the manually outlined area, would be classified as background. For training of the AI app for identification of mammary gland epithelium, randomly selected areas of mammary fat pad in all 33 whole-slide images in the training dataset were manually annotated as either background (i.e., not epithelium) or mammary gland epithelium. The annotated areas covered on average 2.1% of the tissue in these 33 whole-slide images. Likewise, training of the AI app for exclusion of larger areas with lumen from regions of mammary gland epithelium was done on randomly selected regions in all 33 whole-slide images in the training dataset, where the tissue was manually annotated as either mammary gland epithelium or lumen. The AI app for identification of positive and negative mammary gland epithelial nuclei was modified from the pretrained AI app [“AI Nuclei (BF) app,” Visiopharm A/S] available in VIS for identification of nuclei in brightfield digital images. The APP was trained further on randomly selected regions with mammary gland epithelium from 13 whole-slide images in the training dataset. In total, 8179 nuclei were manually annotated for training of the AI APP. Nuclei positive for purple staining were classified using the AEC_DAB—AEC filter with a threshold below 20 in the lower 50th percentile of pixel values to ensure an identical classification of all nuclei.
Validation of Image Analysis Applications
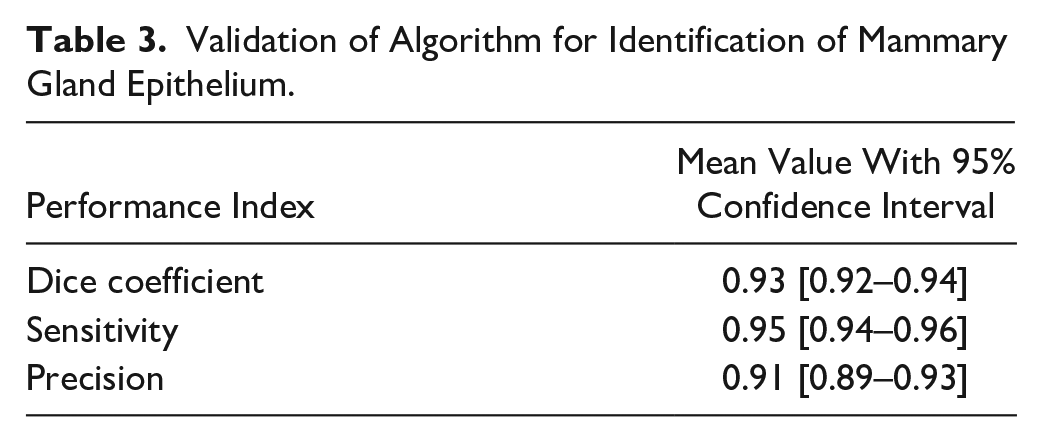
Identification of mammary gland epithelium with the image analysis application was validated in a randomly selected validation region in one whole-slide image from each of the 38 rats in the test dataset. It was randomly selected whether a BrdU-, Ki67-, or PHH3-stained whole-slide image from a given rat would be used for validation. In the selected validation region (average size: 2.5 × 105 µm2), the epithelium was manually outlined and considered as the ground truth. Then, the image analysis was performed, and based on classification of each pixel as true positive (TP), true negative (TN), false positive (FP), or false negative (FN), the Dice coefficient [=2TP/(2TP + FP + FN)], the sensitivity, [=TP/(TP + FN)], and precision [=TP/(TP + FP)] were calculated for each of the 38 whole-slide images, and used for calculation of the overall mean value, including 95% confidence interval (Fig. 1I and Table 3).
Validation of Algorithm for Identification of Mammary Gland Epithelium.
Validation of the AI app for identification of mammary gland epithelial nuclei was also performed in one randomly selected validation region from each of the 38 whole-slide images selected above. In each validation region (average size: 1.7 × 103 µm2), the total number of epithelial nuclei (negative and positive) was counted first by an operator (i.e., the “ground truth”) and subsequently with the AI app. The operator counted in total 1192 cells in these 38 validation regions. The correlation between the number of cells in the validation regions assessed with image analysis and by manually counting was explored (Fig. 2A) and a Bland–Altman analysis of the ln-transformed numbers of cells determined with the two methods was performed (Fig. 2B).
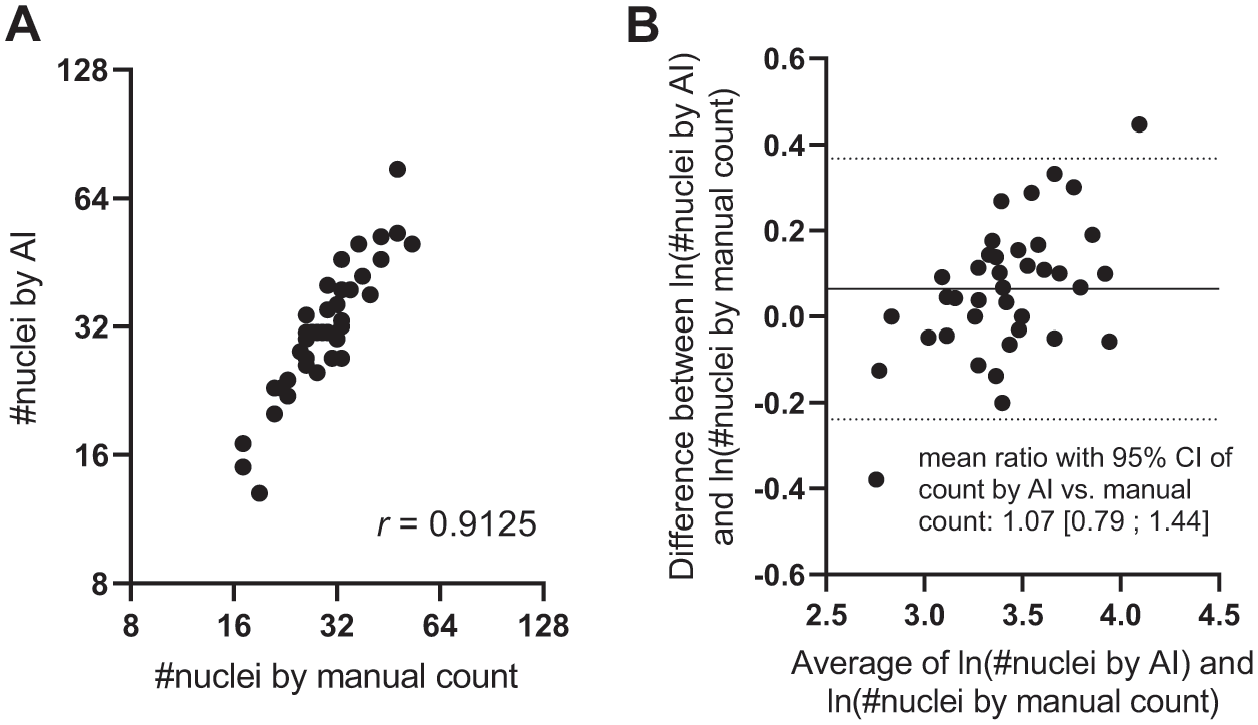
Comparison of number of nuclei found by image analysis and by manual counting in validation regions. A: Correlation between manually counted number of mammary epithelial cells in validation regions (ground truth) and the number of mammary epithelial cells found by the AI app in the same regions. B: Bland–Altman plot of the number of mammary epithelial cells found by manual counting and by the AI app. Abbreviations: AI, artificial intelligence; CI, confidence interval.
Finally, as an overall validation of the image analysis, the correlation between LIs determined with image analysis in each entire whole-slide image and the LIs determined by manual counting in multiple fields of vision from each whole-slide image, identified by systematic random sampling, was explored for all whole-slide images in the test dataset. These correlations were also explored for the combined data from training and test datasets, and the magnitude of relative differences between groups was compared, when all animals in the study were included.
Statistical Analysis
LIs were analyzed in a mixed linear model, with the variable group (levels: proestrus, estrus, metestrus, diestrus, PP, E + P day 5, and E + P day 19), gland number (levels: 4 or 5), and rat age (levels: young or old) as fixed effects and rat number as a random effect in SAS JMP v14.1.0 (SAS Institute; Cary, NC). All data were transformed with the natural logarithm (ln) before analysis. For each type of endpoint, datapoints which equalled 0 were set to half of the value of the lowest datapoint >0. No significant interaction was found between any of the fixed effects. To explore differences between groups, all possible pairwise comparisons of groups were performed, with Tukey’s adjustment for multiple parallel pairwise comparisons. Adjusted p values <0.05 were considered statistically significant. To explore the magnitude of the difference between each group and the proestrus group, the difference between two groups on ln-scale was calculated, including limits of the 95% confidence interval. These differences and the limits of the corresponding 95% confidence intervals were subsequentially back-transformed to obtain ratios. The difference between young and old rats and fourth and fifth gland was estimated in a similar way. The Pearson correlation coefficients between endpoints (LIs with different proliferation markers or manually counted LI versus LI/nuclear AF determined with image analysis) were calculated with GraphPad Prism v9.0.1 (GraphPad Software LLC; San Diego, CA). All data were ln-transformed before correlation analysis. Descriptive statistics of performance indices of the image analysis applications and Bland–Altman analysis of number of nuclei determined by image analysis versus number of nuclei determined by manual counting were also performed with GraphPad Prism v9.0.1.
Results
BrdU, Ki67, and Phospho-histone H3 Labelled Different Proportions of Cells in the Rat Mammary Gland
Representative images of IHC for BrdU, Ki67, and PHH3 are shown in Fig. 3A to C. These three markers of proliferating cells stained different proportions of the mammary epithelial cells. Ki67 labeled the highest proportion of mammary epithelial cells, followed by BrdU, while PHH3 labeled a considerably lower proportion of mammary epithelial cells, in agreement with the known expression pattern of Ki67 and PHH3 (Fig. 3A to C). The staining pattern also displayed some differences between the different markers. The staining of BrdU was very distinct in all positive cells, whereas the staining intensity in Ki67-positive cells varied from relatively weak to very strong (Fig. 3A vs Fig. 3B). Finally, there was pronounced variation in proportion of positively stained mammary epithelial cells between different rats. Rats treated with E + P displayed the highest number of positive cells (Fig. 3A to C vs Fig. 3D and E).
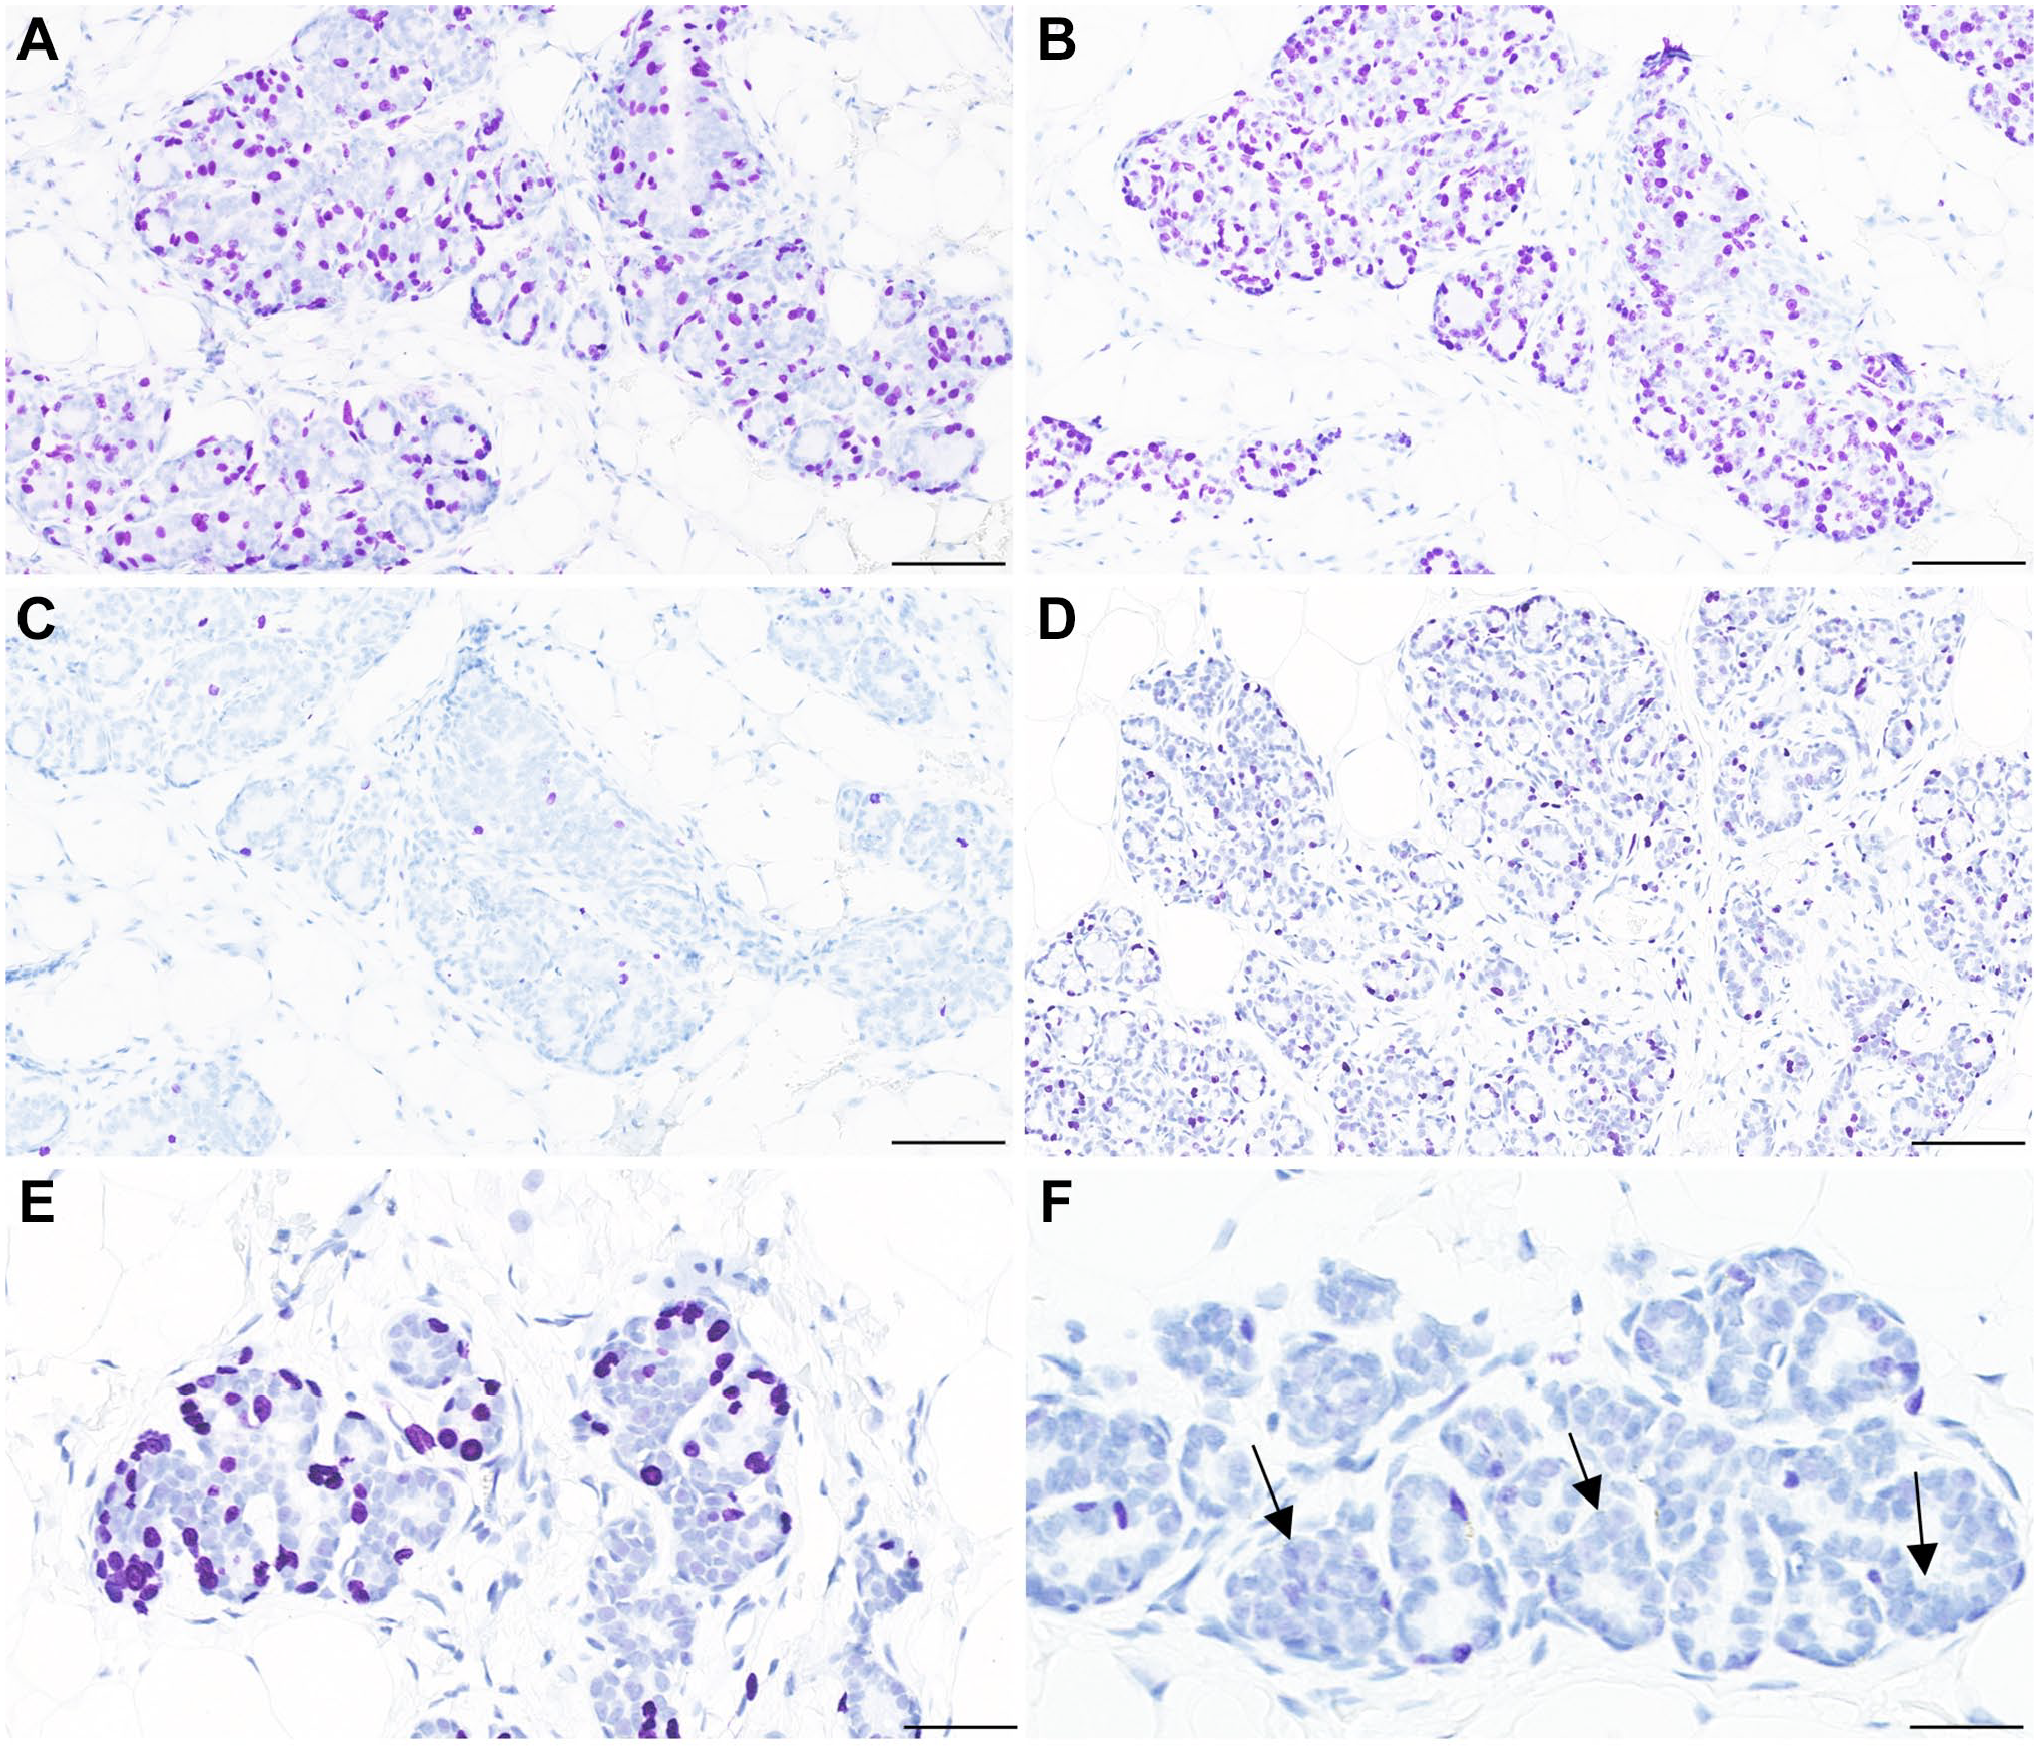
Representative images of IHC for proliferation markers in rat mammary gland. A: Rat treated with E + P, staining for BrdU. Scale bar = 100 µm. B: Rat treated with E + P, staining for Ki67. Scale bar = 100 µm. C: Rat treated with E + P, staining for PHH3. Scale bar =100 µm. D: PP rat, staining for Ki67. Scale bar = 100 µm. E: Rat in metestrus, staining for Ki67. Scale bar = 50 µm. F: Rat in diestrus, staining for Ki67. Mammary gland epithelial cells sometimes cluster, so nuclei are overlapping (arrows). In such areas, it is difficult to quantify the exact number of nuclei by image analysis as well as by manual counting. Scale bar = 50 µm. Abbreviations: BrdU, 5-bromo-2′-deoxyuridine; PHH3, phosphorylated histone H3.
Mammary Gland Proliferation Assessed With Manual Counting Revealed Dependency of the Estrous Cycle, Pseudopregnancy, and Treatment With Combination of Estradiol and Progesterone
Quantification of mammary gland epithelial proliferation by manual counting in multiple fields of vision per whole-slide image, identified by systematic random sampling, resulted in reproducible estimates of the LI for all three proliferation markers (Fig. 4A to C). The coefficient of variation for the average LI of three repeated counting procedures in the same mammary gland whole-slide image was generally in the range ≈5–25% (all three markers). For comparison, the general coefficient of variation for LI across all the animals in the study was ≈40% (BrdU), ≈90% (Ki67), and ≈100% (PHH3).
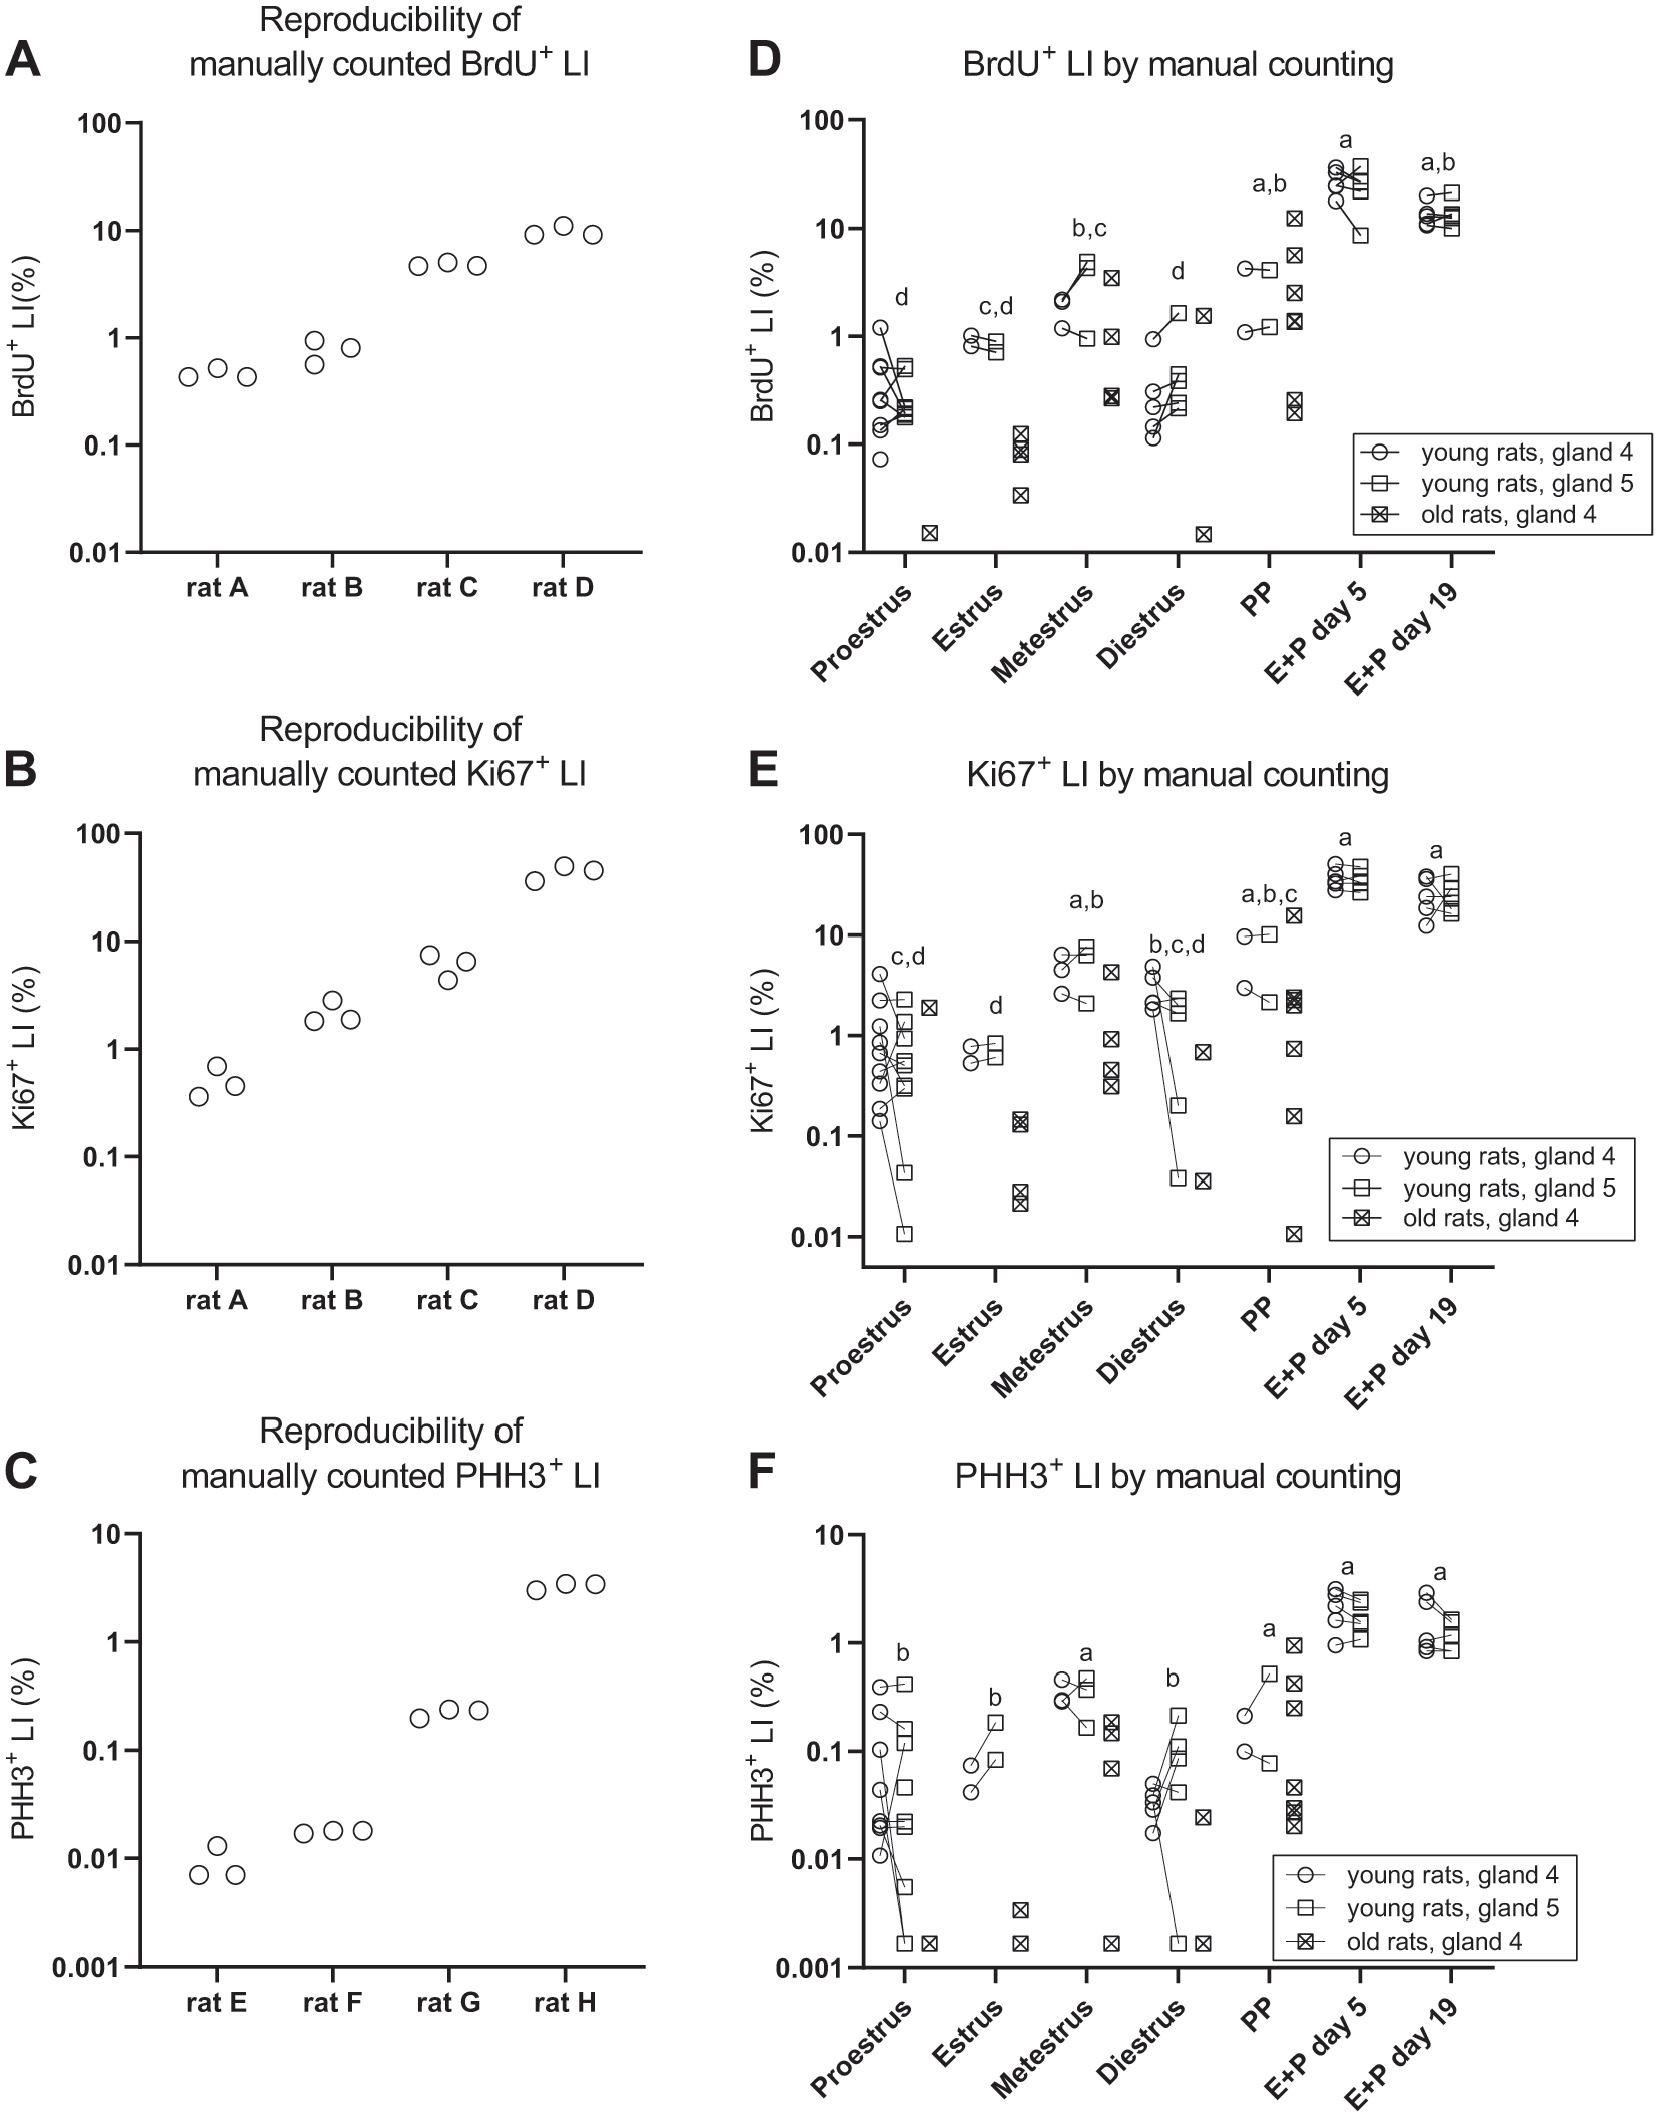
Proliferative activity in the mammary gland was assessed with manual counting of proliferating and non-proliferating mammary epithelial cells in a randomly selected part of each tissue section (≈200 fields of vision or ≈50 fields of vision, see the “Materials and Methods” section). The reproducibility of the LIs assessed with this approach was tested in sections from rats with low, medium, high, and very high proliferative activity, stained for BrdU (panel A), Ki67 (panel B), or PHH3 (panel C). D: BrdU+ LIs for all rats in the study assessed with manual counting. E: Ki67+ LIs for all rats in the study assessed with manual counting. F: PHH3+ LIs for all rats in the study assessed with manual counting. In all panels, symbols indicate observations from individual animals. In panels D–F, observations from the fourth and fifth mammary gland from the same rat are connected with lines. In panels D–F, groups marked with different letters have significantly different mean values. Abbreviations: BrdU, 5-bromo-2′-deoxyuridine; PHH3, phosphorylated histone H3; LIs, labeling indices.
There was considerable variation in epithelial proliferation between the animals when proliferation was assessed with BrdU, Ki67 as well as PHH3 (Fig. 4D and E). With all markers, proliferation was significantly increased in rats treated with E + P for 5 or 19 days compared with rats in proestrus, estrus, and diestrus (Fig. 4D and E). Furthermore, proliferation of mammary epithelial cells displayed a dependency of the estrous cycle with all three markers, and in general appeared elevated during metestrus and in PP rats compared with rats in proestrus, estrus, and diestrus, although statistical significance was not reached for all pairwise comparisons for all three proliferation markers (Fig. 4D and E). In general, across estrous cycle stages, proliferation of mammary epithelial cells was also increased in young rats compared with the old rats (Fig. 4D and E), with ≈3- to 8-fold (Supplemental Table 1). No significant difference in proliferative activity between the fourth and fifth mammary gland was observed.
When LIs were compared pairwise for all three proliferation markers, they were all significantly correlated, with comparable and high correlation coefficients (Fig. 5A to C).
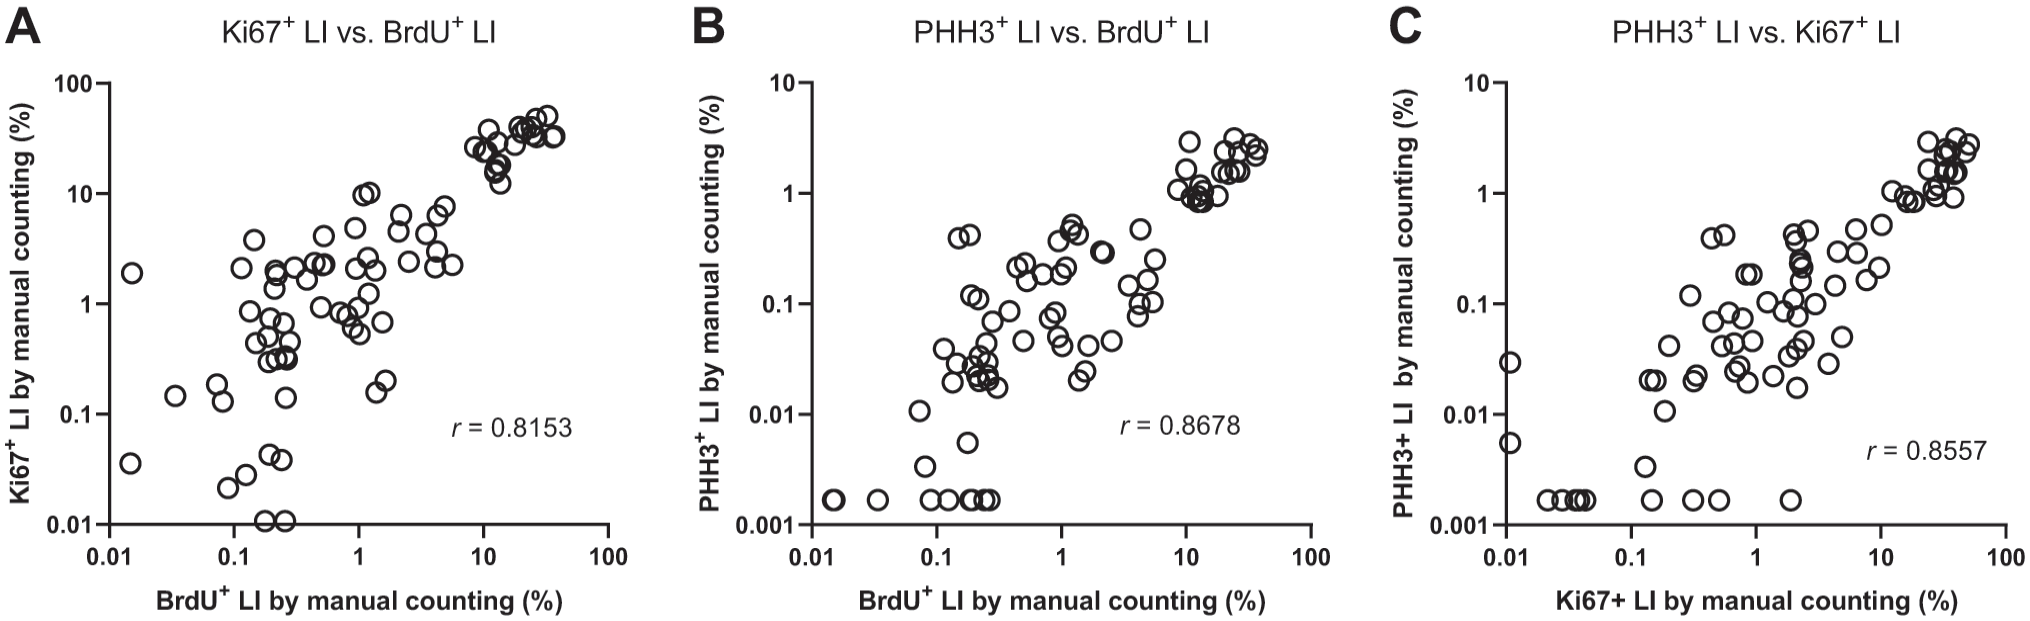
A: Correlation between Ki67+ LIs and BrdU+ LI, determined by manual counting. B: Correlation between PHH3+ LIs and BrdU+ LI, determined by manual counting. C: Correlation between PHH3+ LIs and Ki67+ LI, determined by manual counting. Abbreviations: BrdU, 5-bromo-2′-deoxyuridine; PHH3, phosphorylated histone H3; LIs, labeling indices.
Image Analysis Could Accurately Identify Mammary Gland Epithelial Cells and Quantify Proliferative Activity in Rat Mammary Gland Sections
Upon manual high-level outlining of the mammary fat pad, the two sequential and automated image analysis applications resulted in successful identification of mammary gland epithelium (Fig. 1C to F). The proliferative activity in this compartment was subsequently quantified by specific identification of positive and negative nuclei of mammary epithelial cells (Fig. 1G). In randomly selected validation regions, the total number of mammary epithelial cell nuclei identified by image analysis was significantly correlated with the total number of nuclei found by manual counting in the same region (Fig. 2A), and a Bland–Altman analysis revealed no significant difference, but a trend that the number of nuclei identified by image analysis was ≈7% higher than the number found by manual counting (Fig. 2B). Finally, determination of the nuclear AF with positive staining for a given proliferation marker (Fig. 1H) was used as another method for quantification of the proliferative activity.
The LIs and nuclear AFs determined by image analysis for each proliferation marker are shown in Fig. 6. Proliferative activity was high in rats treated with E + P (5 and 19 days) and in PP rats for all proliferation markers, both when assessed as an LI and as a nuclear AF, in good agreement with LIs assessed by manual counting. The proliferative activity assessed by image analysis during the phases of the estrous cycle also recapitulated the pattern seen with the LIs determined by manual counting in multiple systematic randomly selected vision fields in each whole-slide image, with elevated proliferation during metestrus compared with the other phases (Fig. 6A to E). The interanimal coefficients of variation for LIs determined with image analysis were ≈40% (BrdU), ≈80% (Ki67), and ≈70% (PHH3), and interanimal coefficients of variation for nuclear AFs were ≈40% (BrdU), ≈90% (Ki67), and ≈100% (PHH3).
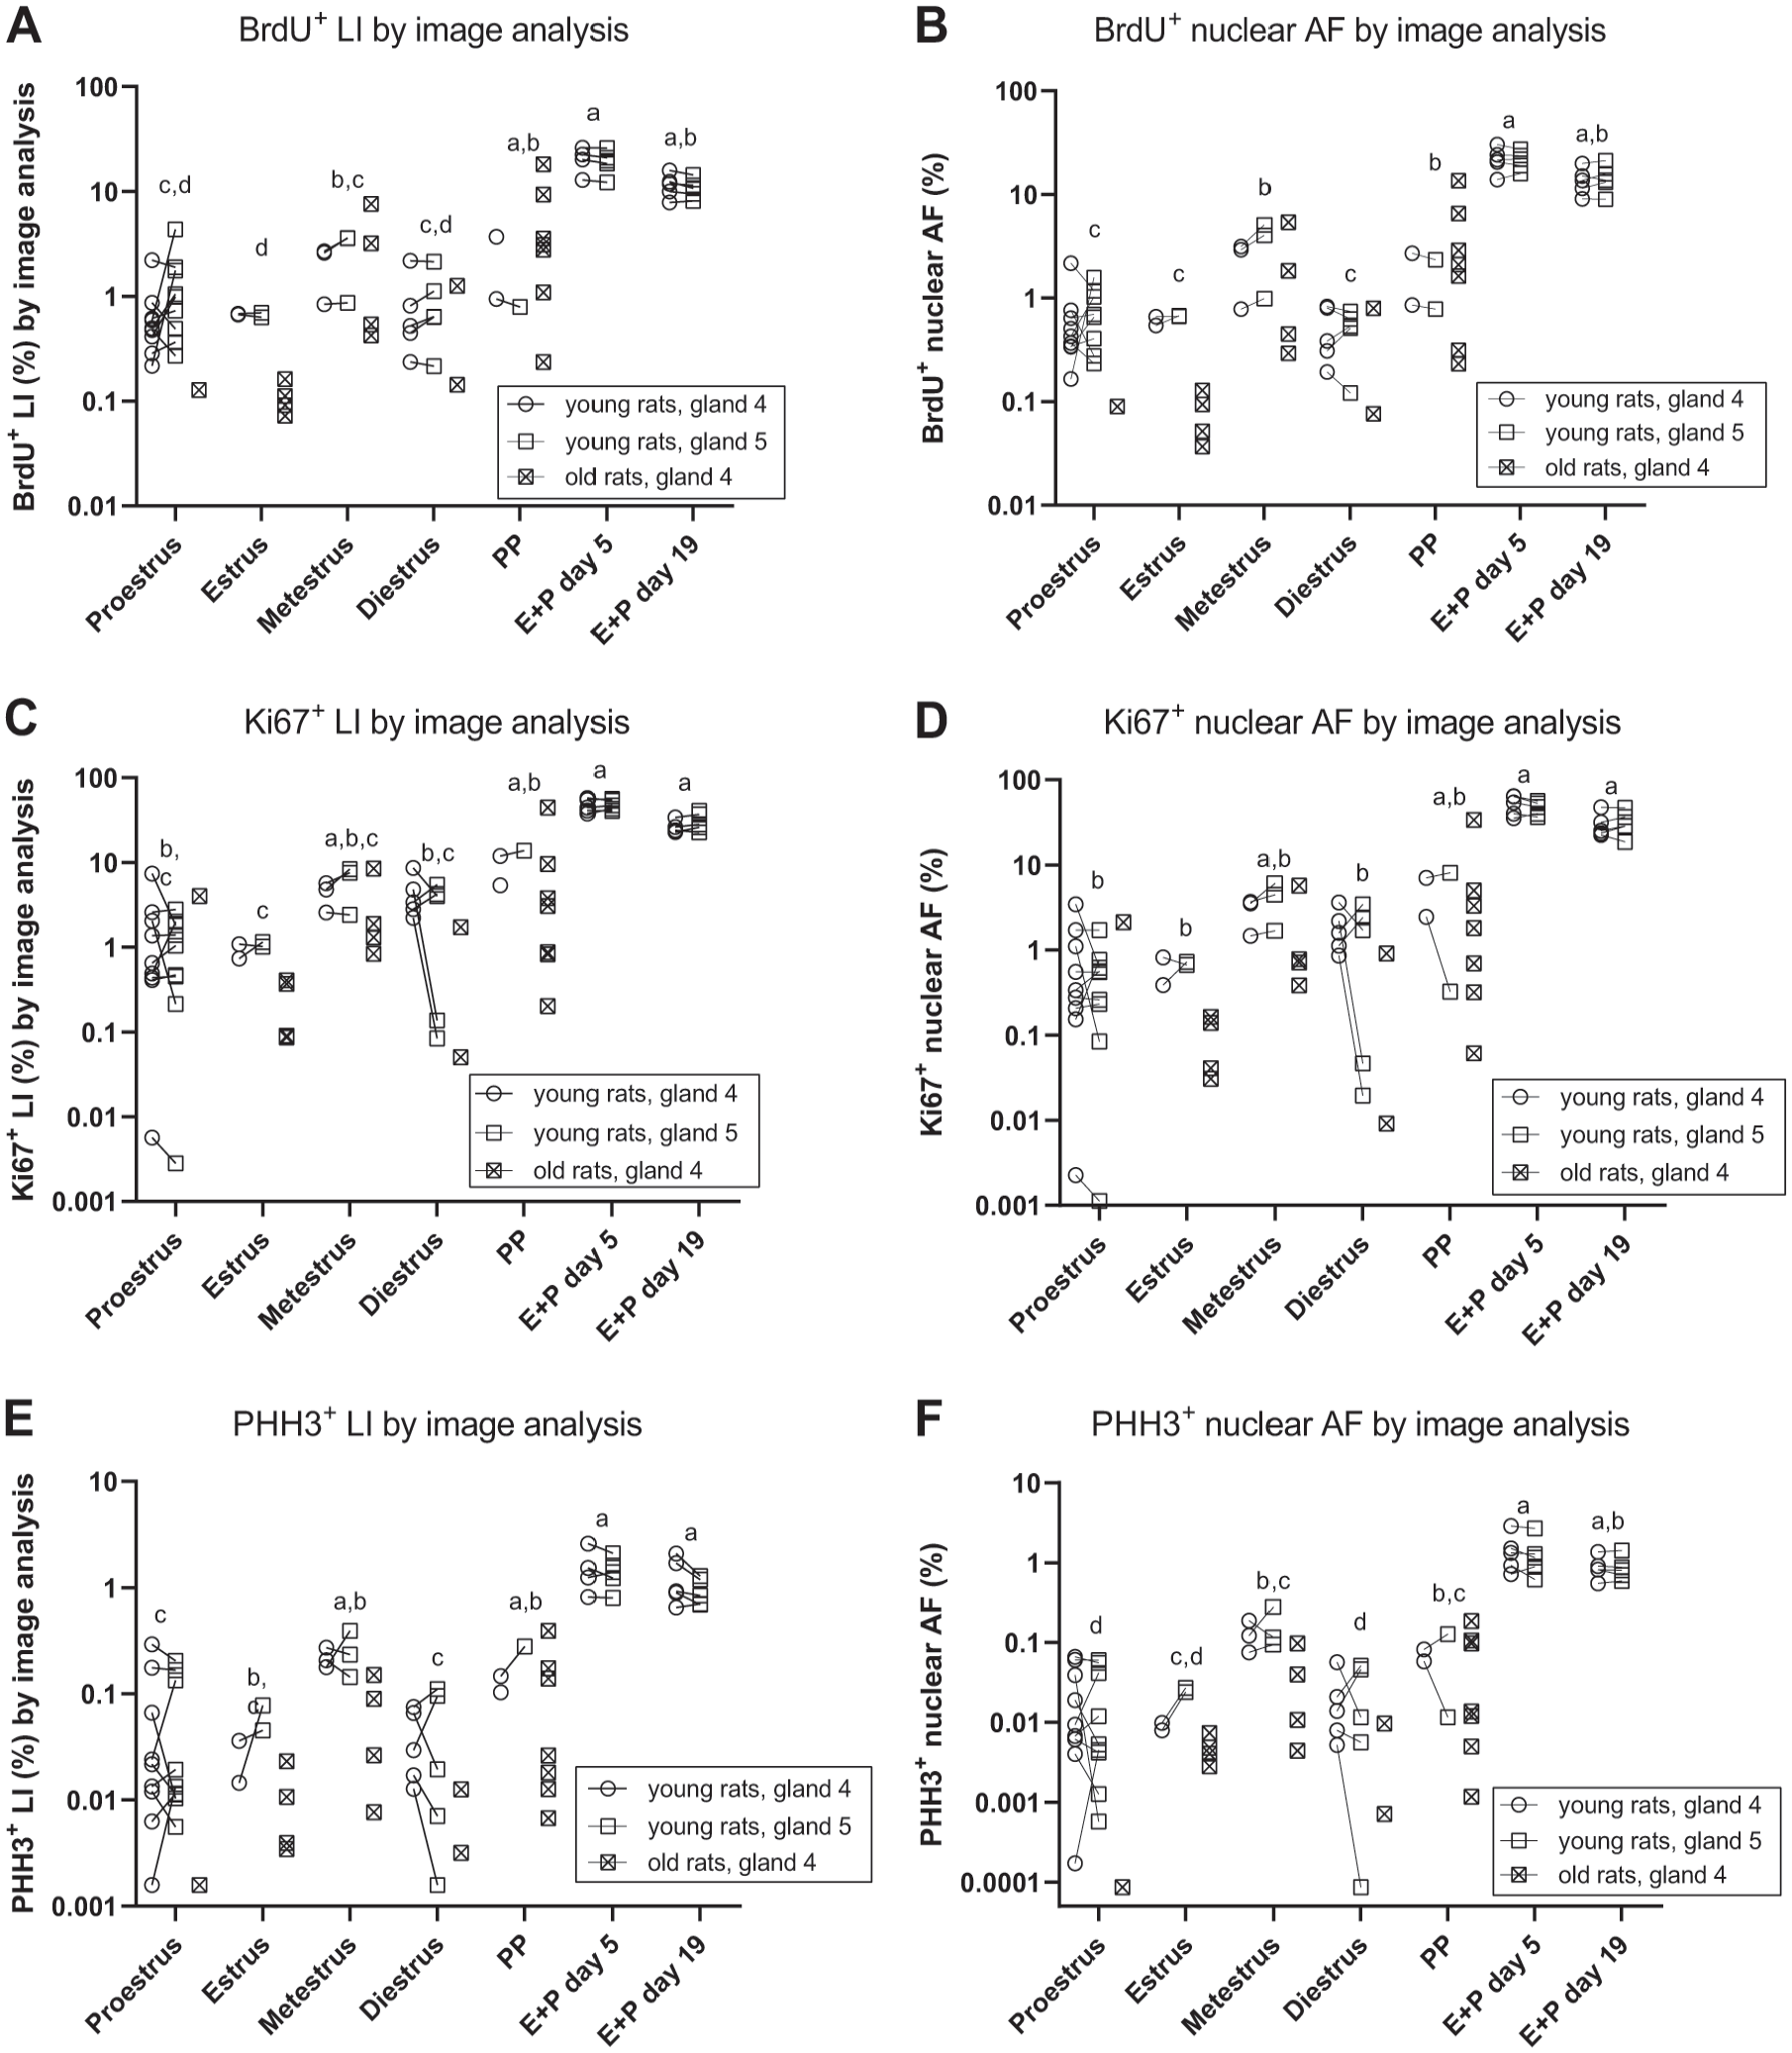
A: BrdU+ LI assessed with image analysis. B: The BrdU+ nuclear AF assessed with image analysis. C: Ki67+ LI assessed with image analysis. D: Ki67+ nuclear AF assessed with image analysis. E: PHH3+ LI assessed with image analysis. F: PHH3+ nuclear area fraction assessed with image analysis. In all panels, symbols indicate observations from individual animals and observations from the fourth and fifth mammary gland from the same rat are connected with lines. In all panels, groups marked with different letters have significantly different mean values. Abbreviations: AF, fractional area; BrdU, 5-bromo-2′-deoxyuridine; PHH3, phosphorylated histone H3; LIs, labeling indices; PP, pseudopregnant.
Mammary Gland Proliferation Assessed With Manual Counting and Image Analysis Was Significantly Correlated and Revealed Differences Between Estrous Cycle Phases of Comparable Magnitude
A significant and high correlation was found between LIs assessed by image analysis and LIs assessed by manual counting for BrdU, Ki67 as well as PHH3, for animals/whole-slide images in the test dataset (Fig. 7A to C), with correlation coefficients ranging from ≈0.92 to 0.93. Comparable correlation coefficients were observed when data from the training and test datasets were combined (Supplemental Fig. 1A to C). Significant correlations were also observed between nuclear AFs and the manually counted LIs for each proliferation marker, with correlation coefficients ranging from ≈0.91 to 0.94 (Supplemental Fig. 2A to C). For each proliferation marker, the relative differences between each stage/treatment group and the phase proestrus were explored (Fig. 7D to F). These relative differences were generally of comparable magnitudes, and with very few exceptions resulted in identification of similar statistically significant differences. The largest difference between endpoints was seen for BrdU, where a significant ≈10-fold difference between metestrus and proestrus was seen for the BrdU+ LI assessed by manual counting, while the BrdU+ LI assessed by image analysis indicated a non-significant difference of ≈5-fold between metestrus and proestrus. (Fig. 7D). However, these two relative differences were not significantly different, as seen from the overlapping 95% confidence intervals (Fig. 7D).
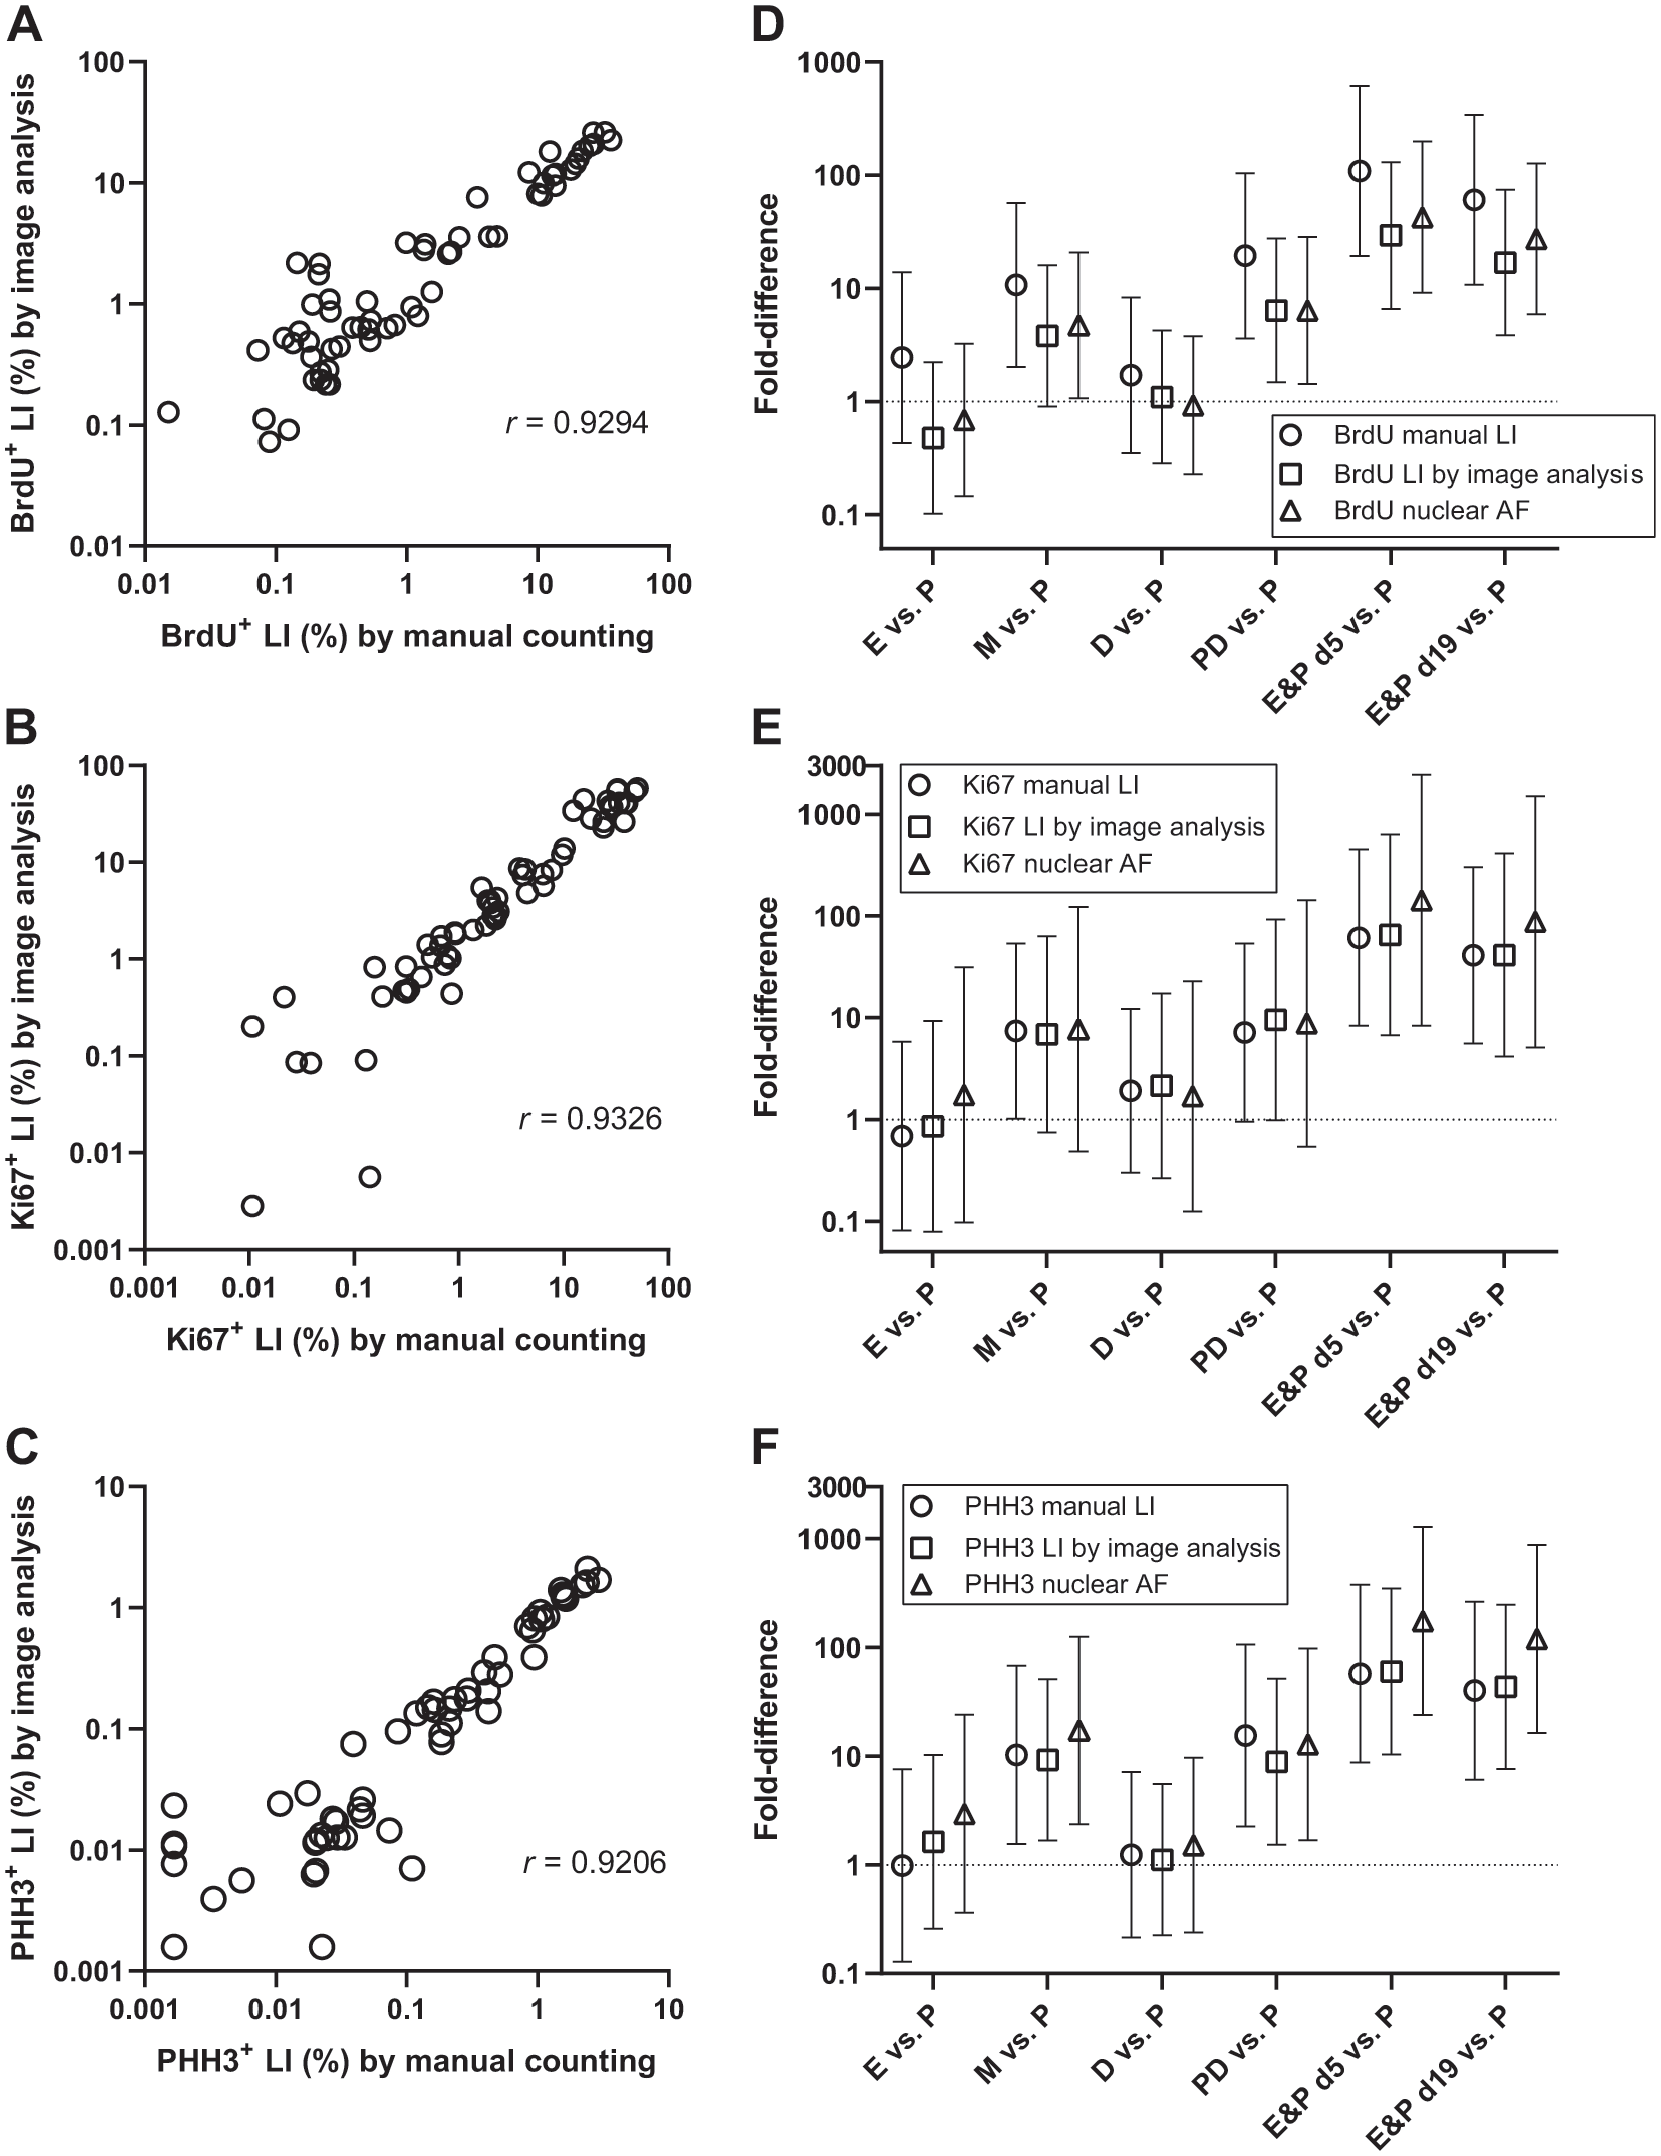
A: Correlation between the BrdU+ LI assessed with image analysis and the BrdU+ LI assessed with manual counting. B: Correlation between the Ki67+ LI assessed with image analysis and the Ki67+ LI assessed with manual counting. C: Correlation between the PHH3+ LI assessed with image analysis and the PHH3+ LI assessed with manual counting. D: The fold-difference and corresponding 95% confidence interval between each experimental group and the proestrus group, calculated for the three different types of endpoints describing the BrdU staining, that is, BrdU+ LI assessed by manual counting (circles), BrdU+ LI assessed with image analysis (squares), and the BrdU+ nuclear AF (triangles). E: The fold-difference and corresponding 95% confidence interval between each experimental group and the proestrus group, calculated for the three different types of endpoints describing the Ki67 staining, that is, Ki67+ LI assessed by manual counting (circles), Ki67+ LI assessed with image analysis (squares), and the Ki67+ nuclear AF (triangles). F: The fold-difference and corresponding 95% confidence interval between each experimental group and the proestrus group, calculated for the three different types of endpoints describing the PHH3 staining, that is, PHH3+ LI assessed by manual counting (circles), PHH3+ LI assessed with image analysis (squares), and the PHH3+ nuclear AF (triangles). Abbreviations: AF, fractional area; BrdU, 5-bromo-2′-deoxyuridine; PHH3, phosphorylated histone H3; LI, labeling index.
Discussion
The principal findings in this study were that (1) quantification of proliferative activity in the rat mammary gland epithelium with image analysis based on AI was in very good agreement with estimates of epithelial proliferation based on manual counting of cells and (2) the proportions of mammary epithelial cells which were stained for BrdU, Ki67, and PHH3 were significantly correlated and overall revealed the same differences of comparable magnitude between the different phases of the estrous cycle, PP rats, and rats treated with E + P. This means that the workflow described here, with sequential use of image analysis applications, can be used in future studies where it is required to quantify proliferation in the rat mammary gland, and thereby replace time-consuming and labor-intensive manual counting of cells. Furthermore, the present data indicate that it is not critical whether BrdU, Ki67, or PHH3 are used to assess proliferation in the rat mammary gland.
Our finding that image analysis agrees excellently with manual assessment of proliferative activity is in good agreement with several previous studies performed on neoplastic tissue from human cancer patients13–15 and two previous studies where proliferation in rat mammary gland was assessed with Ki67 7 or BrdU. 6 The approach for image analysis described here has the advantage that it is independent of choice of proliferation marker, as long as the same chromogen is used. While the three proliferation markers used here are all located in the nucleus, the markers still differed with respect to the frequency and/or staining intensity of the positive cells, and it is a clear strength that the image analysis algorithms worked well with all three markers. In the previous study by Lindauer et al., 7 the investigators developed their own software for quantification of cell proliferation, whereas we in this study utilized commercially available image analysis software, which does not require expert-level programming skills to use. Furthermore, in the workflow described by Lindauer et al., an operator had to select and capture images of the areas with mammary gland tissue to be analyzed. In this study, the workflow allowed for analysis of all mammary gland tissue in the digital whole-slide images. This is a more simple process and eliminates concern for a potential bias when smaller regions must be selected.
Manual counting of the mammary gland sections in this study took ≈30–45 min per whole-slide image for a trained operator. In comparison, the described workflow for image analysis required up to 5 min of manual work per whole-slide image (i.e., inspection of the whole-slide image, crude outlining of the area with mammary fat pad, exclusion of possible artifacts, initiation of the batch analysis, and final check of the analysis results). That is, with this approach for image analysis, the time required for manual analysis work is significantly reduced, with ≈6- to 9-fold.
As shown here, epithelial cells in the rat mammary gland sometimes cluster together, so nuclei to a large extent are overlapping. In such areas, it is difficult for an operator to count the number of nuclei, and we knew from previous work that it can also be a challenge for image analysis algorithms to perform a correct segmentation of single nuclei in such areas. A previous study has also reported that the largest discrepancies between manually counted proliferating cells and numbers of proliferating cells identified by image analysis occurred in tissue sections where cells clustered together. 14 Therefore, we quantified both the cellular LI and the nuclear AF by image analysis. It turned out that both types of endpoints correlated to a high degree with the manually counted LIs, which indicates that the AI apps perform well, also when nuclei of mammary gland epithelial cells cluster closely together and overlap in tissue sections. In some situations, it could also be an advantage to apply the Bayesian classifier. This can, for example, rapidly be adjusted to detection of other types of chromogens, and the time required for the software to process analysis of a whole-slide image with the Bayesian classifier is generally faster than the AI app for detection of nuclei.
A previous study observed a significant correlation between Ki67+ LIs and BrdU+ LIs in rat mammary gland, with a Pearson correlation coefficient of 0.814, 9 that is, almost identical to the correlation coefficient of 0.8153 found in this study. Previous studies also reported that BrdU+ LI and Ki67+ LI are correlated in other tissues and species.16,17 There are to our knowledge no previous studies which compared BrdU or Ki67 with PHH3 in the rat mammary gland, but a previous study reported a strong correlation between Ki67 and PHH3 in invasive ductal carcinoma of the breast in humans 18 and in human prostate cancer. 19 Furthermore, PHH3+ LI (and Ki67+ LIs) has been reported to have prognostic value in human breast cancer, 20 prostate cancer, 19 meningioma, 21 and melanomas. 22 However, there are also studies which reported PHH3+ LIs were less suited than KI67+ LIs for accurate grading of gastroenteropancreatic neuroendocrine neoplasms.23,24
Which marker is then the preferred proliferation marker in the rat mammary gland? We believe they can all be used because all three markers can detect the dramatically increased proliferation after short-term treatment with E + P and the elevated proliferation during metestrus and in PP rats. BrdU appears in this study as the least variable marker, but that could be different if a longer labeling period is used (in this study, it was 6 hr). Furthermore, BrdU must be administered to the animals, and besides the extra work this requires, there is also a risk of failed dosing, such as injection in the intestine or the bladder instead of correctly injecting ip. Ki67 and PHH3 can be detected without prior administration, that is, these markers can be utilized also in studies where it was not originally decided to assess proliferation. The Ki67+ LIs and PHH3+ LIs were equally variable in this study. PHH3 has a more restricted expression during the cell cycle than Ki67 (late G2 and mitosis vs all phases except G0), and it could be speculated that PHH3 therefore would be more sensitive for detection of changes in mammary gland proliferation during the rapidly changing phases of the rat estrous cycle, which in total is only of 4- to 5-day duration. However, in this study, we detected ≈10-fold increased proliferation in metestrus (i.e., the phase with highest proliferation) compared with proestrus with both PHH3 and Ki67, and the confidence intervals for these relative differences were overlapping to a large extent (Fig. 7E and F). The relative increases in proliferation detected with Ki67 and PHH3 in rats treated with E + P for up to 19 days were also of fully comparable magnitudes (Fig. 7E and F). Ki67 is a very well-established marker of proliferating cells, and has been used in numerous studies. To be able to compare directly with previous studies, it can therefore be an advantage to choose this marker.
In conclusion, we have here described an automated workflow and image analysis applications which can be used to assess epithelial proliferation in the rat mammary gland, independent of the choice of proliferation marker. The LIs determined by image analysis agree excellently with traditional manual counting of proliferating cells, which means image analysis based on AI can replace time-consuming manual counting procedures. Furthermore, the proliferation markers BrdU, Ki67, and PHH3 are all significantly correlated, and can all be used for quantification of proliferation in the rat mammary gland. However, we recommend using either Ki67 or PHH3 because these markers can be detected without prior administration to the animals, as is required for BrdU.
Supplemental Material
sj-pdf-1-jhc-10.1369_00221554221075327 – Supplemental material for Quantitative Assessment of Epithelial Proliferation in Rat Mammary Gland Using Artificial Intelligence Independent of Choice of Proliferation Marker
Supplemental material, sj-pdf-1-jhc-10.1369_00221554221075327 for Quantitative Assessment of Epithelial Proliferation in Rat Mammary Gland Using Artificial Intelligence Independent of Choice of Proliferation Marker by Tobias H. Dovmark, Peter H. Kvist, Anne-Marie Mølck and Henning Hvid in Journal of Histochemistry & Cytochemistry
Footnotes
Acknowledgements
The authors wish to thank laboratory technicians Jette Mandelbaum, Pia Rothe, and Dorte Larsen for excellent technical assistance with preparation of tissue sections, immunohistochemical staining, and manual counting of positive and negative cells.
Competing Interests
The author(s) declared the following potential conflicts of interest with respect to the research, authorship, and/or publication of this article: A.-M.M., P.H.K., and H.H. own shares in Novo Nordisk A/S. Besides that, the authors declare they have no competing interests.
Author Contributions
HH designed the study, supervised immunohistochemical staining and manual counting, performed statistical analysis, and drafted the manuscript. THD and HH designed the image analysis algorithms and performed the image analysis. All authors participated in interpretation of data, revision of the manuscript draft, and approved the final manuscript.
Funding
The author(s) disclosed receipt of the following financial support for the research, authorship, and/or publication of this article: This study was funded entirely by Novo Nordisk A/S.
References
Supplementary Material
Please find the following supplemental material available below.
For Open Access articles published under a Creative Commons License, all supplemental material carries the same license as the article it is associated with.
For non-Open Access articles published, all supplemental material carries a non-exclusive license, and permission requests for re-use of supplemental material or any part of supplemental material shall be sent directly to the copyright owner as specified in the copyright notice associated with the article.