
Abstract
In the present report, we have compared the phenotype and growth of small hepatocyte progenitors (SHPs) induced by retrorsine/partial hepatectomy (R/PH) and small hepatocytes (SHs) isolated from normal adult liver. SHs were isolated by a combination of differential centrifugation and Percoll isodensity fractionation from a liver cell suspension prepared by collagenase perfusion of a dipeptidyl peptidase IV (DPPIV)-positive Fischer F344 rat liver. Following further purification by flow cytometry, the SH-R3 fraction was transplanted via the portal vein into R/PH-treated, DPPIV-negative Fischer F344 rats. Frozen sections from tissue harvested at 5, 7, and 21 days after transplantation were analyzed by indirect immunofluorescence to compare the phenotypic characteristics of colonies formed by exogenous SH-R3s and endogenous SHPs. Colonies of transplanted SHs and endogenous SHPs displayed similar histologies and phenotypes but were distinguished from surrounding hepatocytes by their elevated expression of transferrin receptor. SH-R3 colonies were frequently located within clusters of γ-glutamyl transpeptidase-positive host hepatocytes. Although significantly smaller at 5 and 7 days after PH, by day 21, SH-R3 colonies were similar in size to those formed by SHPs. The present results suggest that endogenous SHPs are derived, at least in part, from SHPs.
Keywords
R
Although SHPs are not easily identified in hematoxylin and eosin-stained sections of normal liver, they are readily detected in the livers of retrorsine-treated animals as clusters of small cells (Gordon et al. 2000c) that first become apparent at 3 days after PH. At this early time point, SHPs express hepatocyte markers, such as albumin and H.4 (Gordon et al. 2000c). By 5 days post-hepatectomy, 30% of the SHP clusters contain cells positive for both hepatocyte and ductal markers, such as OC.2 and OC.5. During the next 48 hr, SHPs lose ductal markers, and by 30 days after surgery, when regeneration is complete, they cease to proliferate (Gordon et al. 2000c). Based on RT-PCR analysis, Gordon et al. (2000b) proposed that SHPs are deficient in the CYP450 enzymes needed to metabolize retrorsine into its active form, a characteristic that makes them resistant to DNA damage produced in mature hepatocytes expressing the full complement of CYPs needed for retrorsine metabolism.
Although the origin of SHPs is still a question for debate, they are known to share physical characteristics with small hepatocytes (SHs) isolated by Mitaka et al. (1998), Asahina et al. (2006), and Tateno and Yoshizato (1996) from the livers of normal adult rats using a combination of differential centrifugation, flow cytometry, and in the case of Asahina et al. (2006), centrifugal elutriation. In vitro, a subpopulation designated R3 (SH-R3) isolated by fluorescent-activated cell sorting (FACS) on the basis of size (forward scatter) and granularity (side scatter) was found to be the fastest growing of three SH subpopulations (Tateno et al. 2000). When transplanted into retrorsine/PH (R/PH) rats, the SH-R3 subpopulation displayed a colony-forming ability surpassing that of parenchymal hepatocytes (Katayama et al. 2001).
With the goal of shedding light on the relationship between SHPs induced by retrorsine and the SH-R3 fraction from normal adult rat liver, we have compared the phenotype and expansion of SHPs in dipeptidyl peptidase IV (DPPIV)-deficient, R/PH-treated Fischer rats with transplanted SH-R3s purified from a DPPIV-positive, wild-type Fischer rat. Of particular interest was whether exposure to retrorsine selected for a sub-population of SHPs that differed significantly in phenotype and growth characteristics from SH-R3s in normal liver. Our results show that endogenous SHPs and exogenous SH-R3s form colonies that are distinguished by differences in size and the levels of CYP2E1. In addition, we present evidence for the preferential engraftment of SH-R3s in proximity to clusters of host hepatocytes expressing γ-glutamyl transpeptidase (GGT).
Materials and Methods
Isolation of Small Hepatocyes
SHs were purified from total liver cell isolates prepared by collagenase perfusion of DPPIV+ Fischer F344 rats by a combination of differential centrifugation and Percoll isodensity fractionation using a previously described protocol (Katayama et al. 2001). SHs were further fractionated by flow cytometry and the R3 fraction, a subpopulation of small cells (<18 μm in diameter) with low granularity relative to parenchymal hepatocytes, were transplanted into retrorsine-treated DPPIV- Fischer rats (Katayama et al. 2001).
Animals
Wild-type Fischer F344 rats expressing an active form of DPPIV were purchased from Harlan Sprague Dawley (Indianapolis, IN). DPPIV- F344 host rats were from a colony maintained at Rhode Island Hospital, established from breeder pairs obtained from Charles River in Germany. Animals were fed Harlan rat chow ad libitum and kept in an alternating 12-hr light/dark cycle environment. National Institutes of Health guidelines for the care and use of laboratory animals were followed throughout this investigation. The Rhode Island Hospital Institutional Animal Care and Use Committee approved all animal protocols used in these studies.
Transplantation of SHs into Retrorsine-treated DPPIV- Fischer Rats
DPPIV-deficient F344 female rats weighing between 130 and 140 g were given two intraperitoneal injections of retrorsine 2 weeks apart at a dose of 30 mg/kg body weight. One month after treatment, the animals were subjected to a two-thirds PH. Freshly isolated small hepatocytes from normal DPPIV+ F344 male rats (2 × 10⁵ or 6 × 10⁵ cells) were injected into the livers of seven DPPIV- F344 rats via the portal vein. Liver tissue harvested at 5 days (one rat with 2 × 10⁵ and one with 6 × 10⁵ cells), 7 days (one rat with 2 × 10⁵ cells), and 21 days (5 rats with 2 × 10⁵ cells) after transplantation, was frozen by immersion in hexane cooled by a dry ice-ethanol bath and stored at −80C.
Phenotypic Characterization of Colonies Formed by SH-R3s and SHPs
Serial cryosections 5 μm in thickness were fixed in ice-cold acetone for 10 min and air dried. Sections were subsequently stained by immunofluorescence (IIF) as previously described using mouse monoclonal antibodies (MAbs) and Alexa goat anti-mouse IgG antibodies (Sigma-Aldrich; Milwaukee, WI) as secondary antibody (Hixson et al. 2000). GGT was detected using rabbit anti-GGT antibodies obtained as a gift from Professor Marie Hanigan (Department of Cell Biology, University of Oklahoma Cancer Center). Double labeling for GGT and DPPIV was performed by sequential incubations with rabbit anti-GGT, Alexa 594-conjugated goat anti-rabbit IgG; anti-DPPIV MAb, and Alexa 488- conjugated goat anti-mouse IgG (Molecular Probes; Eugene, OR). Phenotypic analysis by IIF was performed as previously described (Hixson et al. 2000; Erickson et al. 2006) using MAbs specific for the following markers: CEACAM1 (Mowery and Hixson 1991); pancadherin (AbCam; Cambridge, MA); desmoplakin I, a major desmosomal plaque protein (Comegys et al. 1999); ZO1 (Zymed; San Francisco, CA), a tight-junction protein; DPPIV (Mowery and Hixson 1991); leucine amino peptidase and H.1, an hepatocyte surface protein (Mowery and Hixson 1991); and transferrin receptor (TfR) (Faris et al. 1991). Double labeling with rabbit anti-DPPIVand MAb with IgG isotypes was performed by sequential incubations with rabbit anti-DPPIV, Alexa 488-conjugated goat anti-rabbit IgG, an IgG MAb, and Alexa 594-conjugated goat anti-mouse IgG. Double labeling using primary MAb IgG and IgM isotypes was performed with a mixture of the two antibodies followed by a cocktail of IgG Fc region-specific goat anti-mouse IgG and μ-chain-specific goat anti-mouse IgM antibodies (Sigma-Aldrich). Digital images of stained sections were captured under epi-fluorescence illumination as previously described (Erickson et al. 2006). The intensity of CYP2E1 fluorescence on host hepatocytes and colonies of SH-R3 was quantitated using the histogram palette feature of Photoshop CS software to determine the average pixel intensity in a defined area. Depending on the size of the colonies, average fluorescence intensities for colonies and host parenchyma were calculated from measurements taken in one to four identically sized non-overlapping areas. Maximal differences in intensity were determined from lowest and highest pixel intensities, respectively, measured in colonies and host parenchyma. Results were expressed as the percentage deficit in the average CYP2E1 fluorescence for SH-R3 colonies relative to the surrounding host liver.
Changes in the Size of SHPs and SH-R3s and Their Colonies
SHPs and SH-R3s were visualized in acetone-fixed frozen sections by IIF with anti-DPPIV- and anti-TfR-specific MAbs, respectively. Cross-sectional areas were determined with Image Pro Plus 5.0 software by application of the area algorithm to colonies outlined using the auto-trace feature. Statistical analysis of areas was performed as described by Simper-Ronan et al. (2006). The size of cells was determined from the mean diameter of cells within donor SH-R3 colonies visualized in acetone-fixed frozen sections by a histochemical stain for DPPIV (Simper-Ronan et al. 2006) or within SHP colonies visualized in formalin-fixed frozen sections stained with hematoxylin. Mean diameters were calculated as previously described from the area and the number of cells in 10 colonies (Katayama et al. 2001).
Distribution of SHP Colonies
The percentage of donor SHP colonies proximal to GGT+ host hepatocytes was determined by fluorescent microscopic examination of frozen sections double labeled for DPPIV and GGT. Colonies in close proximity were defined as those surrounded by, in contact with, or within one cell layer of a cluster of GGT+ host hepatocytes. The percentage of host-derived SHP colonies proximal to GGT+ hepatocytes was determined in a similar manner. Endogenous host colonies were identified as compact clusters of small DPPIV- cells in sections double labeled with GGT and DPPIVand counterstained with 4'-6-diamidino-2-phenylindole. Because of the small size of SH-R3 colonies at 5 and 7 days and the correspondingly small number of recognizable foci in each 5-μm frozen section, the percentage of colonies proximal to GGT+ clusters of host hepatocytes was based on the combined colony counts for the three time points.
Results
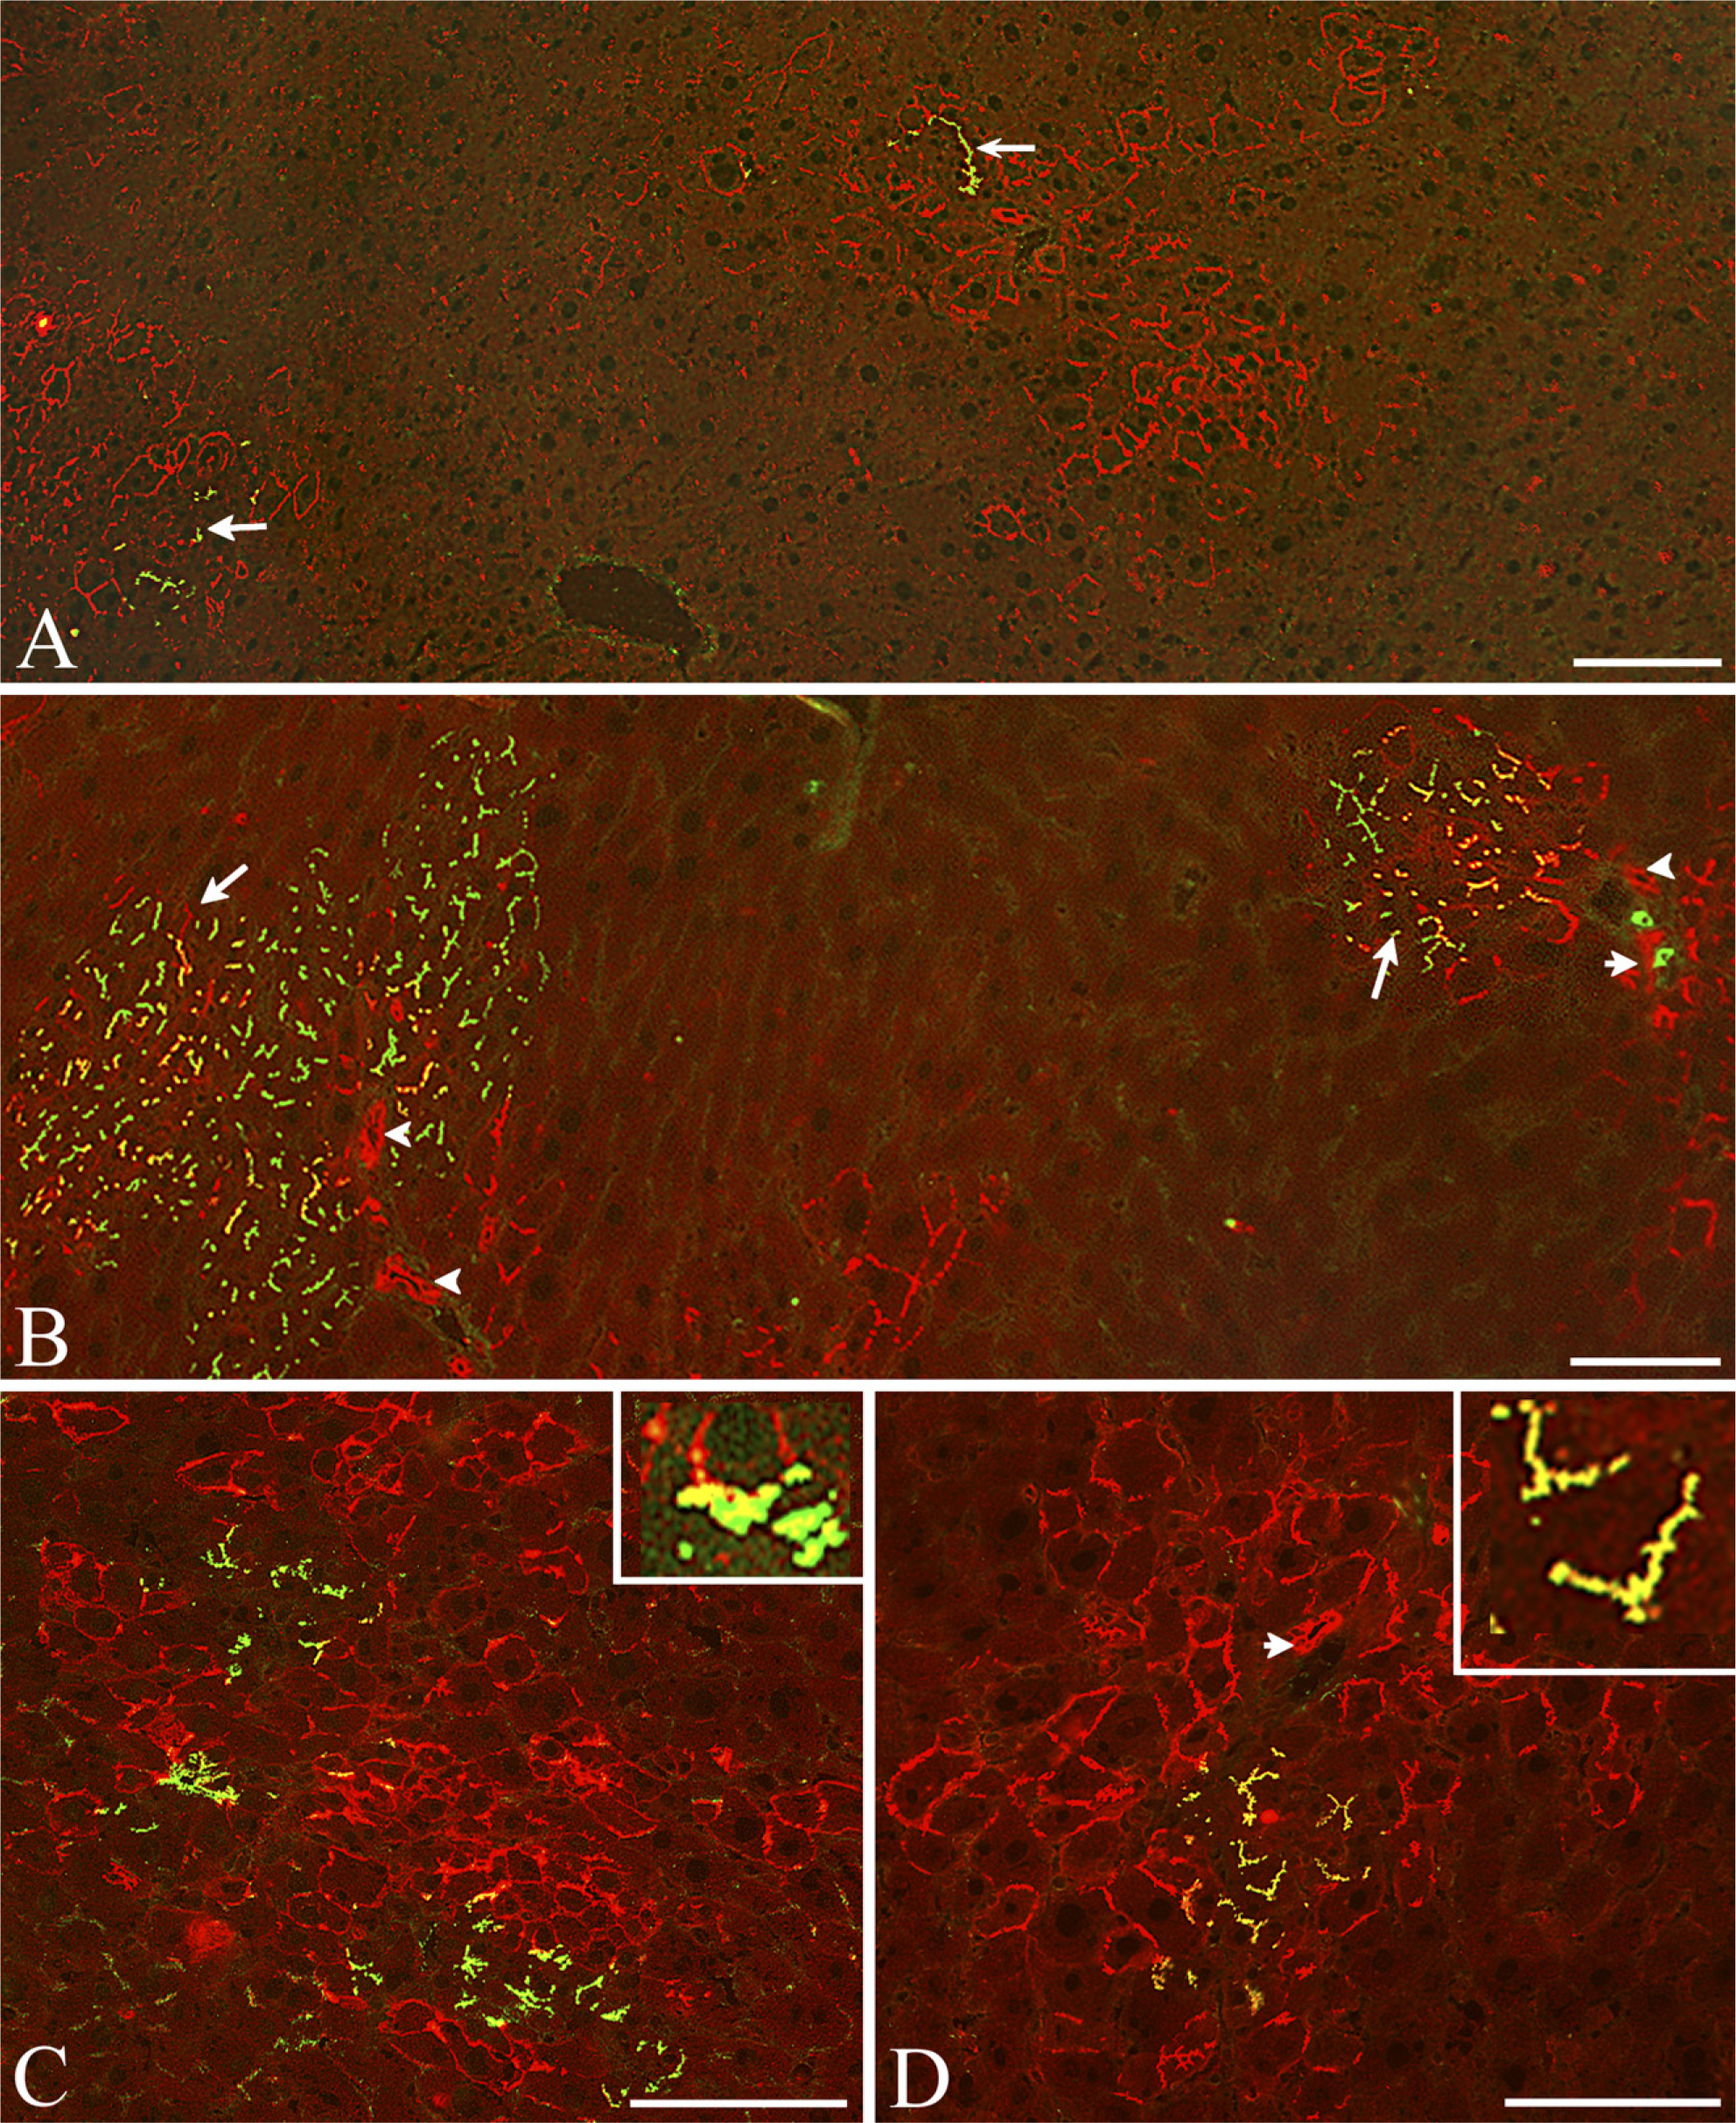
Colonies of SHP and SH-R3 Show Elevated Expression of the Transferrin Receptor. When compared with host hepatocytes, colonies of SHPs and SH-R3s show differences in the expression of TfR. High levels of TfR are present on hepatoblasts and hematopoietic cells in the fetal rat liver (Allison et al. 1982). Elevated levels have also been reported on regenerating hepatocytes after PH and on hepatocellular carcinomas (Eriksson et al. 1986; Cairo and Pietrangelo 1994). To determine whether TfR was differentially expressed by colonies of SH-R3 and SHP, frozen sections were double labeled with MAbs specific for DPPIV and rat type 1 TfR (Figure 1). As shown in Figures 1A and 1B, the lateral and apical (canalicular) membrane domains of hepatocytes surrounding DPPIV+ SH-R3 or DPPIV- SHP colonies were negative or weakly positive for TfR (broad white and black arrows, respectively, in Figures 1A and 1B). In contrast, DPPIV+ colonies of SH-R3s, as well as endogenous colonies of SHPs at 5 days (not shown), 7 days (Figures 1A and 1D), and 21 days (Figure 1C) after PH, demonstrated strong TfR reactivity that often appeared to encircle the cell (Figure 1A, cells with a central white dot). DPPIV+ canaliculi (green) displayed a limited discontinuous distribution of TfR (inset in Figure 1A). Although there also appeared to be elevated sinusoidal reactivity, the resolution was insufficient to distinguish between TfR on basal (sinusoidal) hepatocytes and/or endothelial cell membranes. Highly variable levels of expression were also observed on host liver sinusoids (thin arrows in Figures 1B and 1C).
Colonies of SHPs and SH-R3s Contain Well-defined Sinusoids. In agreement with previous studies, donor SH-R3-derived DPPIV+and host SHP-derived DPPIV- colonies were composed of cells with smaller nuclear and cell diameters than host hepatocytes and megalocytes, distinguishing characteristics at all three time points, which facilitated identification of colonies of SHPs or SH-R3s in inverted black-and-white views such as that shown in Figure 1B. To determine whether sinusoids lined by endothelial cells were present in SH-R3 and SHP colonies, frozen sections were labeled with an MAb specific for the pan-endothelial marker, RECA-1. Results indicated that at 5 days, 7 days, and 21 days after PH, both endogenous (data not shown) and exogenous DPPIV+ colonies (Figures 2A and 2B) contained well-defined sinusoids lined by RECA-1-positive cells.
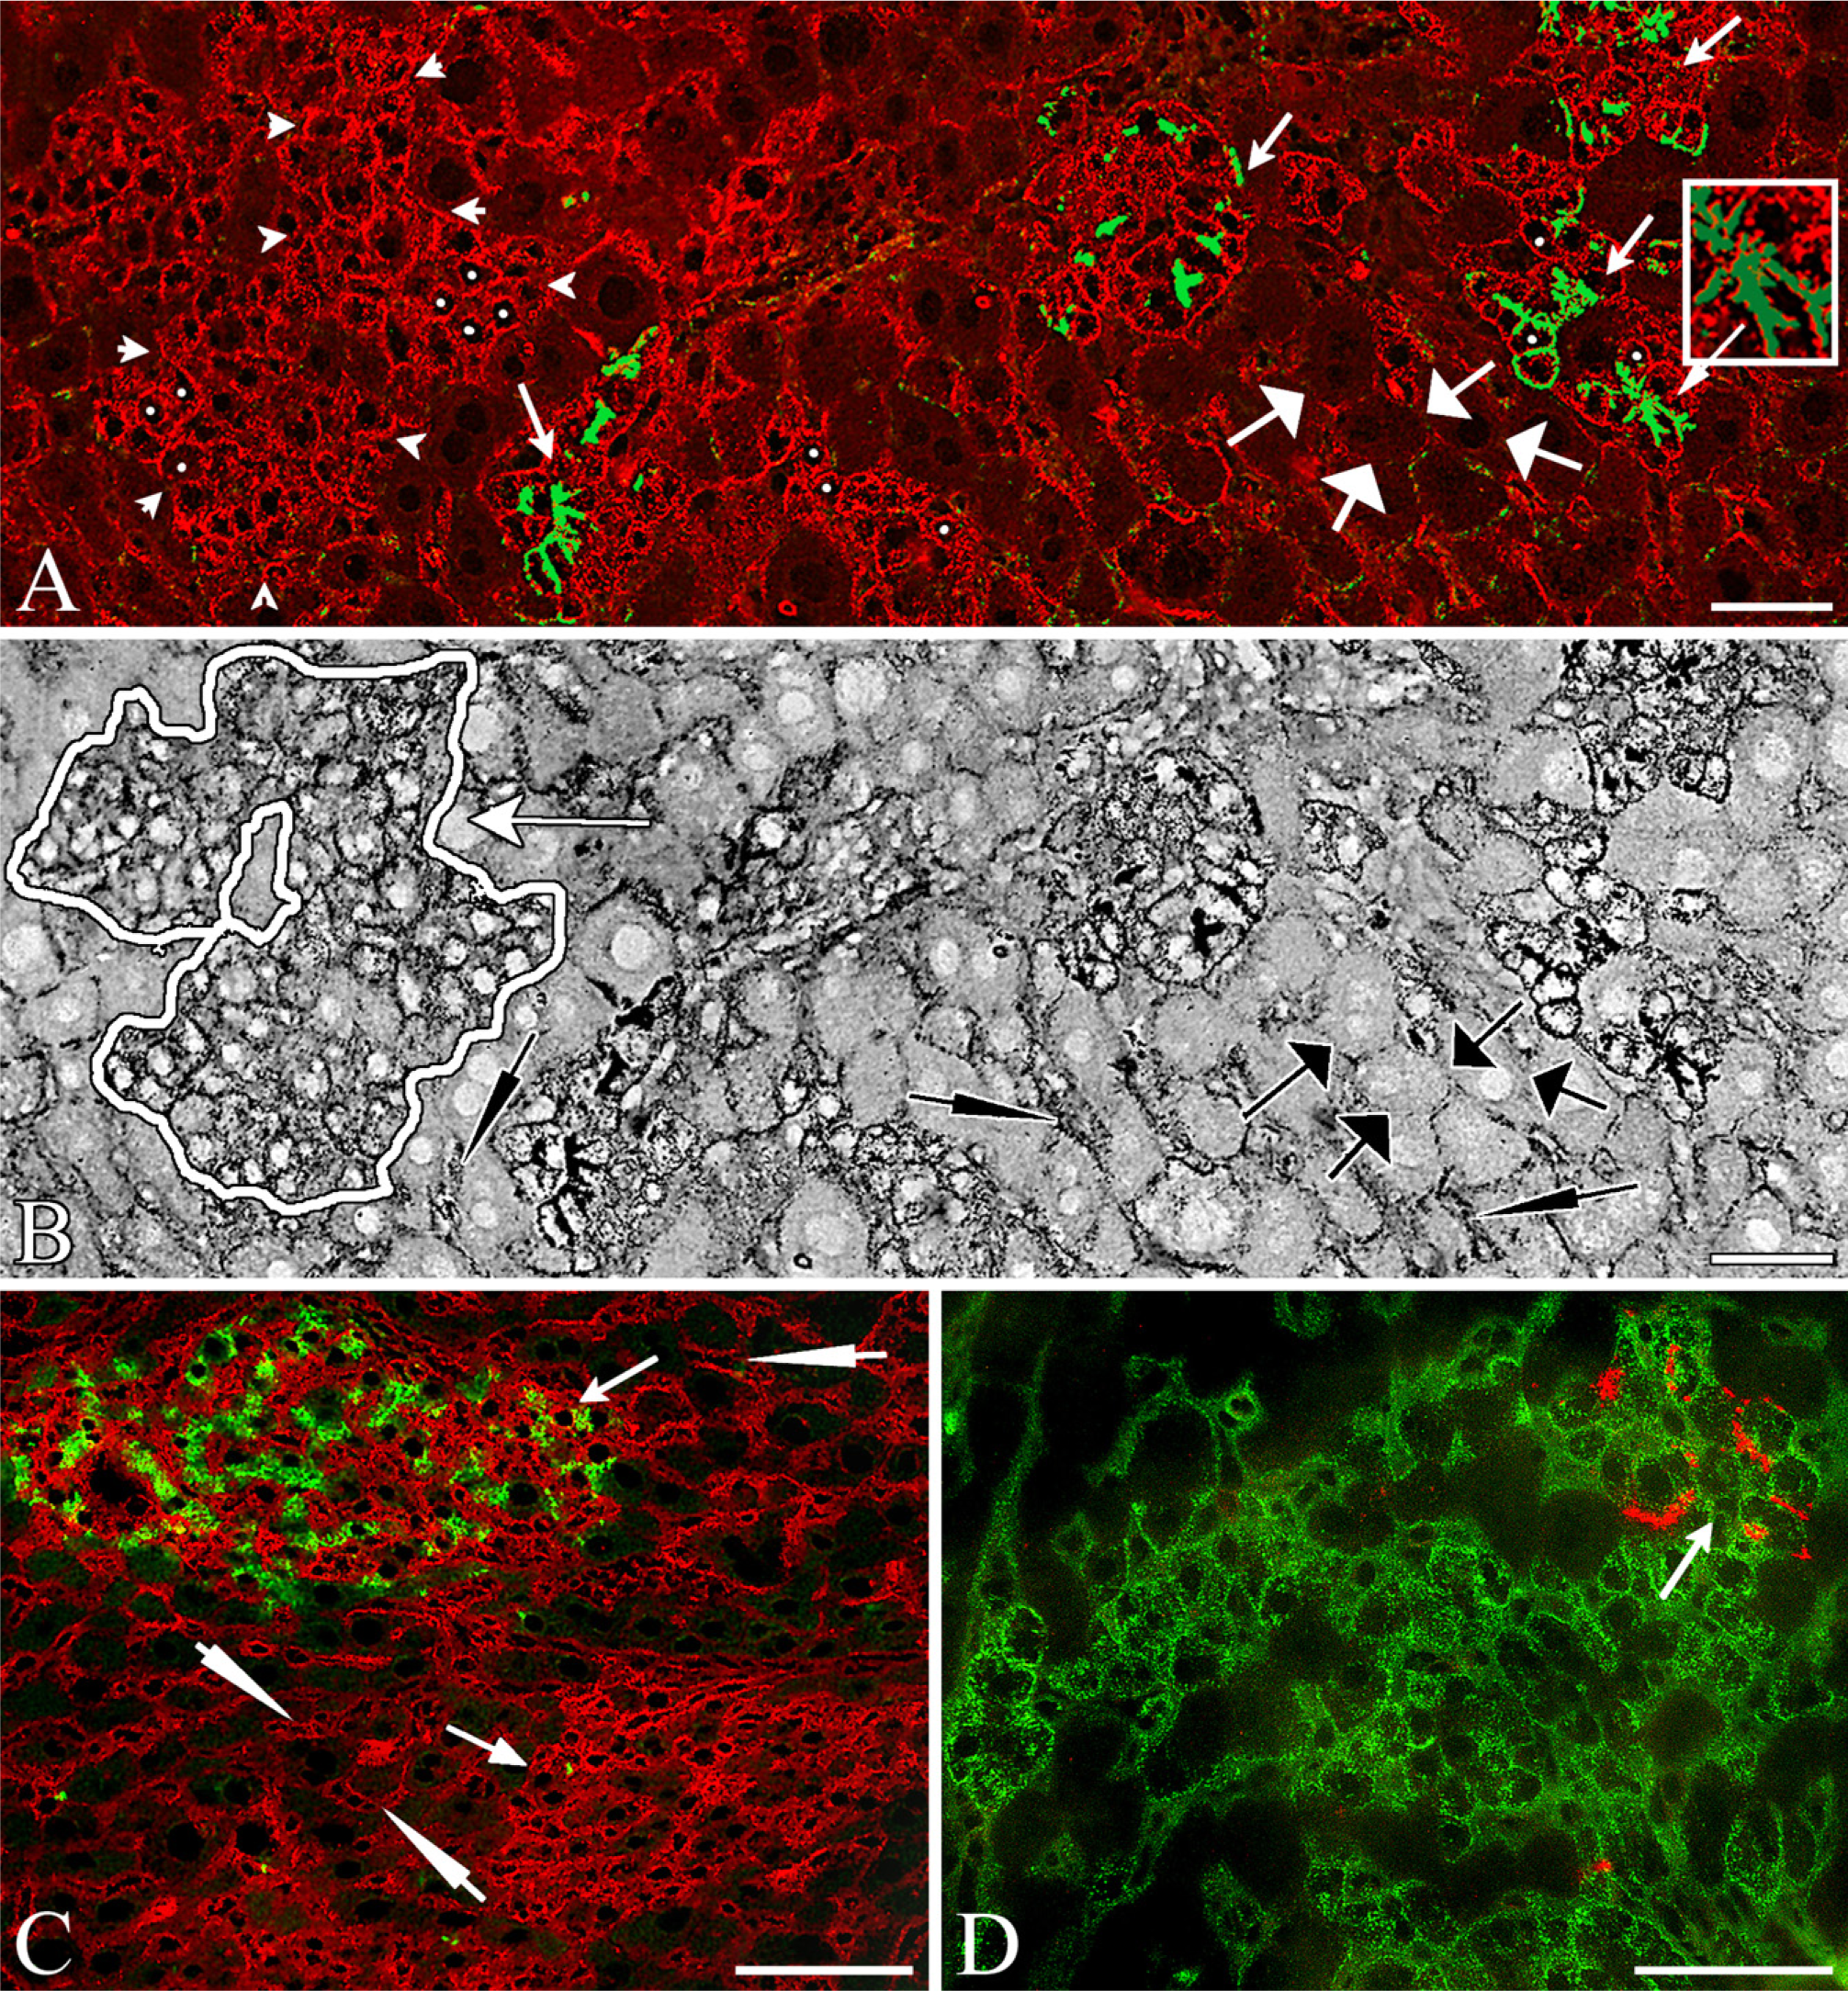
Differential expression of the transferrin receptor. Immunofluorescence (IIF) analysis revealed differences in the expression of transferrin receptor (TfR; red) displayed by host hepatocytes and by small hepatocyte progenitors (SHPs) and small hepatocyte (SH)-R3. (
Colonies of SH-R3 and SHP Express Proteins Characteristic of Mature Hepatocytes. Double-labeled IIF analysis revealed the expression of a number of different membrane proteins characteristic of normal adult hepatocytes. Colonies of DPPIV+ SH-R3s and DPPIV- SHPs, were strongly positive for the hepatocyte markers H.1 (Figures 2C and 2D), pan-cadherin (Figures 3A and 3B), desmoplakin I (Figures 3C and 3D), and leucine aminopeptidase (Figure 3E). When labeled by IIF with antibodies specific for the tight-junction protein ZO1 (Figures 4A and 4B), colonies of SH-R3s and SHPs displayed the sharply defined canalicular fluorescence previously reported for tight junctions (Britt et al. 2004). Exogenous or endogenous colonies expressing the ductal marker OV6 were not observed (data not shown).
Differential Expression of CYP2E1 in Colonies of SH-R3s and SHPs. CYP2E1 is strongly expressed by adult rat hepatocytes (Figures 4C-4E). In general, expression by endogenous colonies of SHPs (Figures 3C and 3E) was comparable to that of surrounding hepatocytes. In contrast, levels in colonies of SH-R3s were usually significantly lower (Figure 3E). Quantitative analysis of a collection of nine different colonies from days 5, 7, and 21 after PH showed an average deficit of 16% in the fluorescence intensity of SH-R3 colonies relative to host hepatocytes. Because there was considerable heterogeneity in the levels of CYP2E1 in SH-R3 colonies, we also determined the maximum deficit in intensity for each colony, which ranged from a low of 9% to a high of 62%, with an average of 28%.
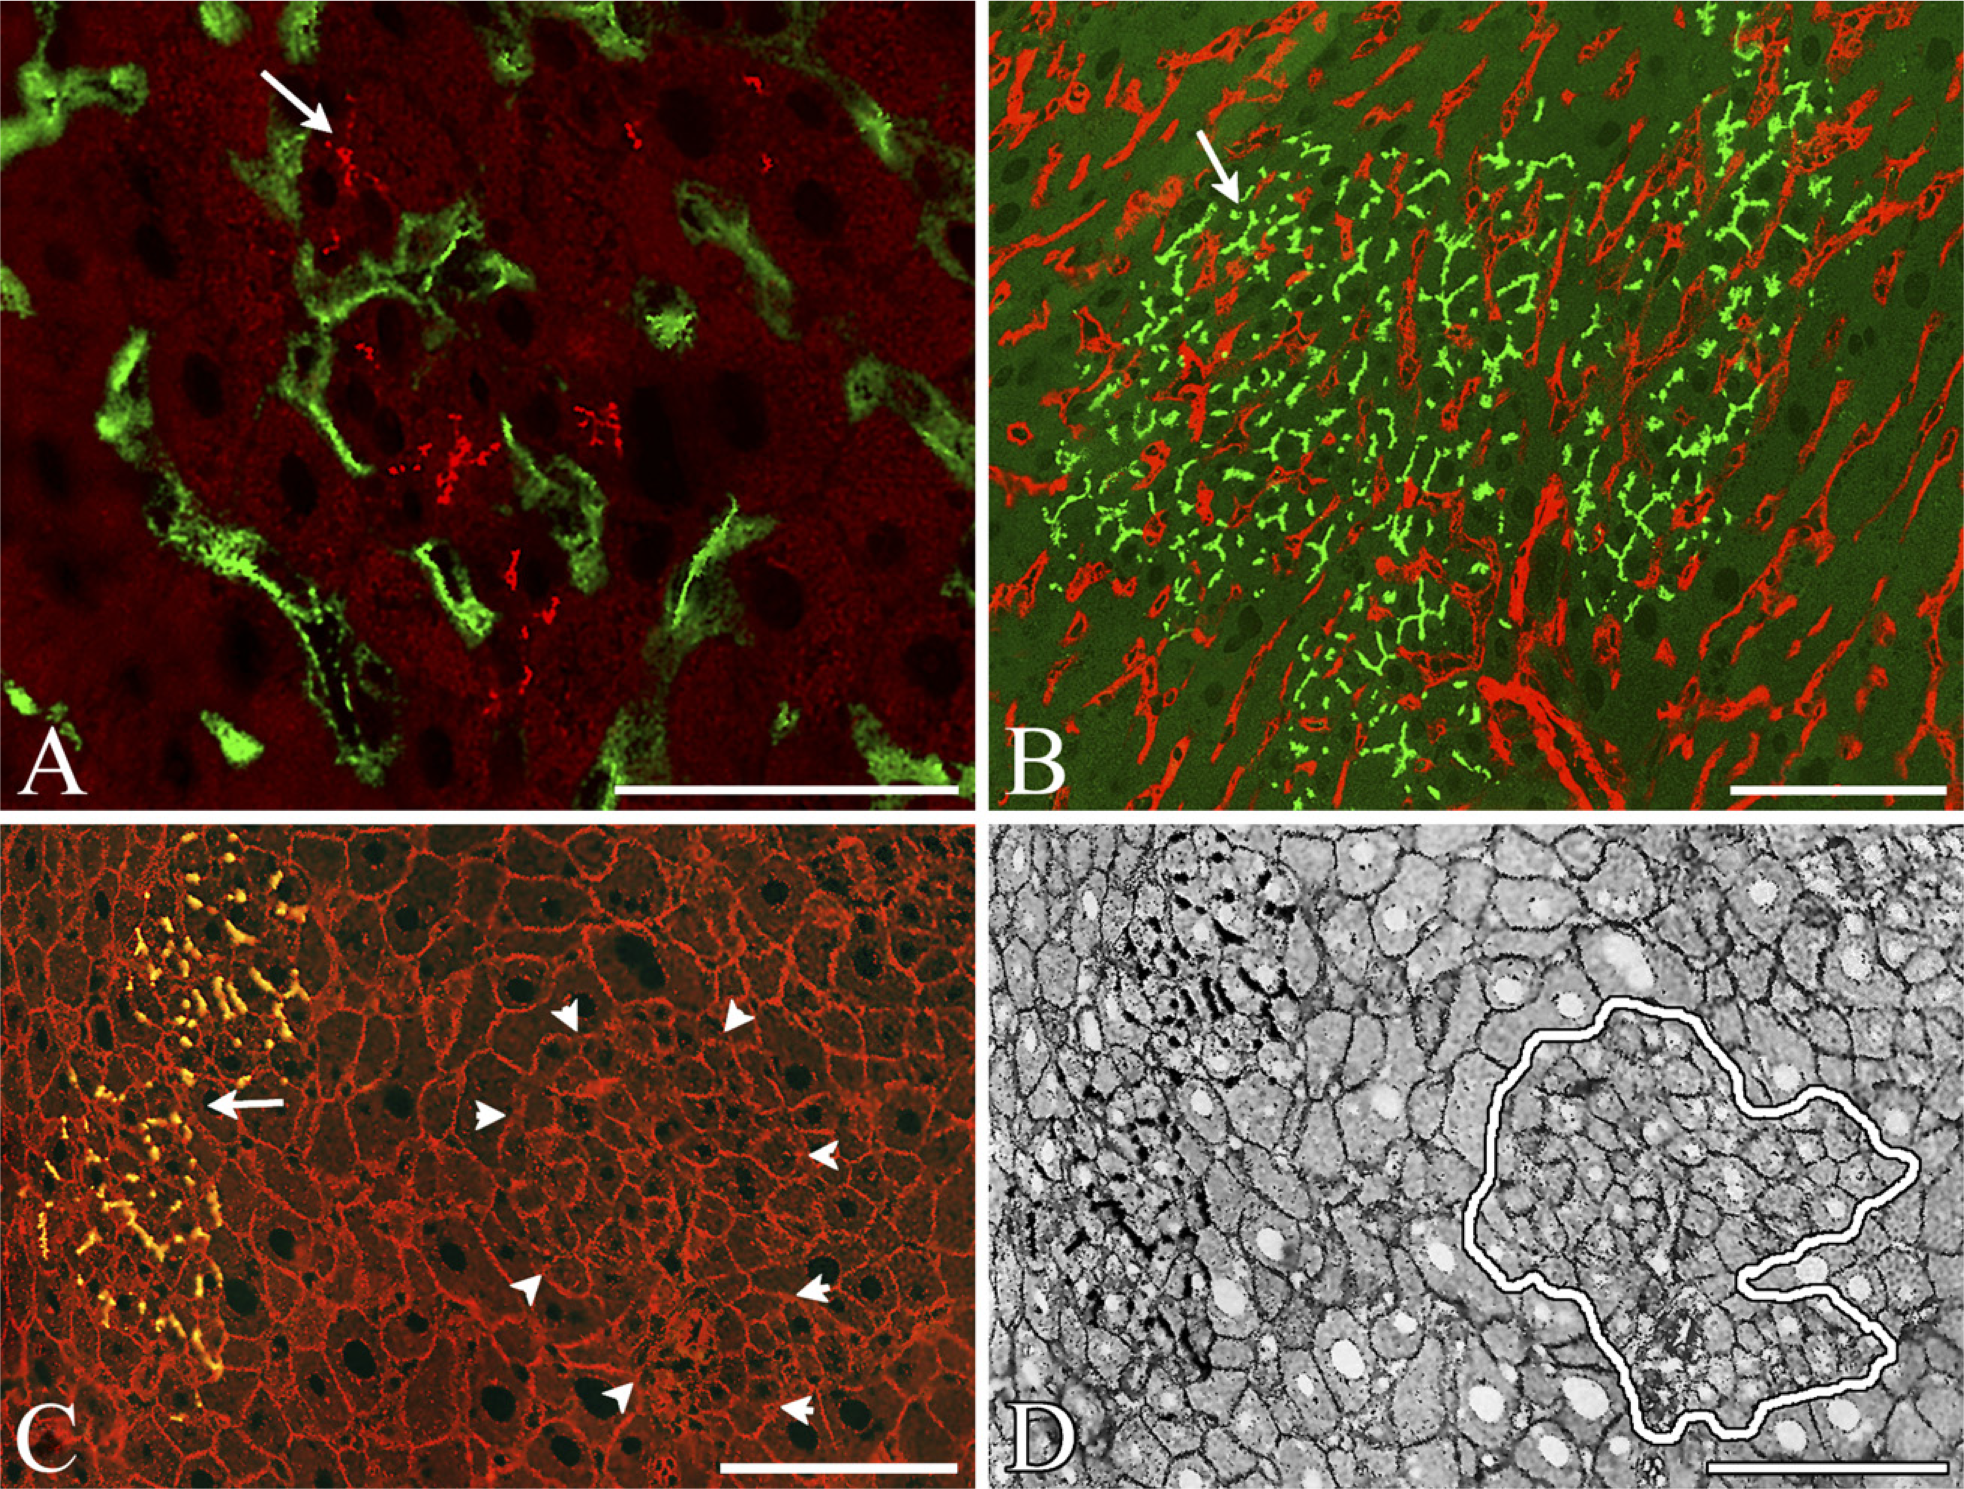
Expression by exogenous and endogenous colonies of H.1, a hepatocyte membrane protein, and RECA, an endothelial cell marker. (
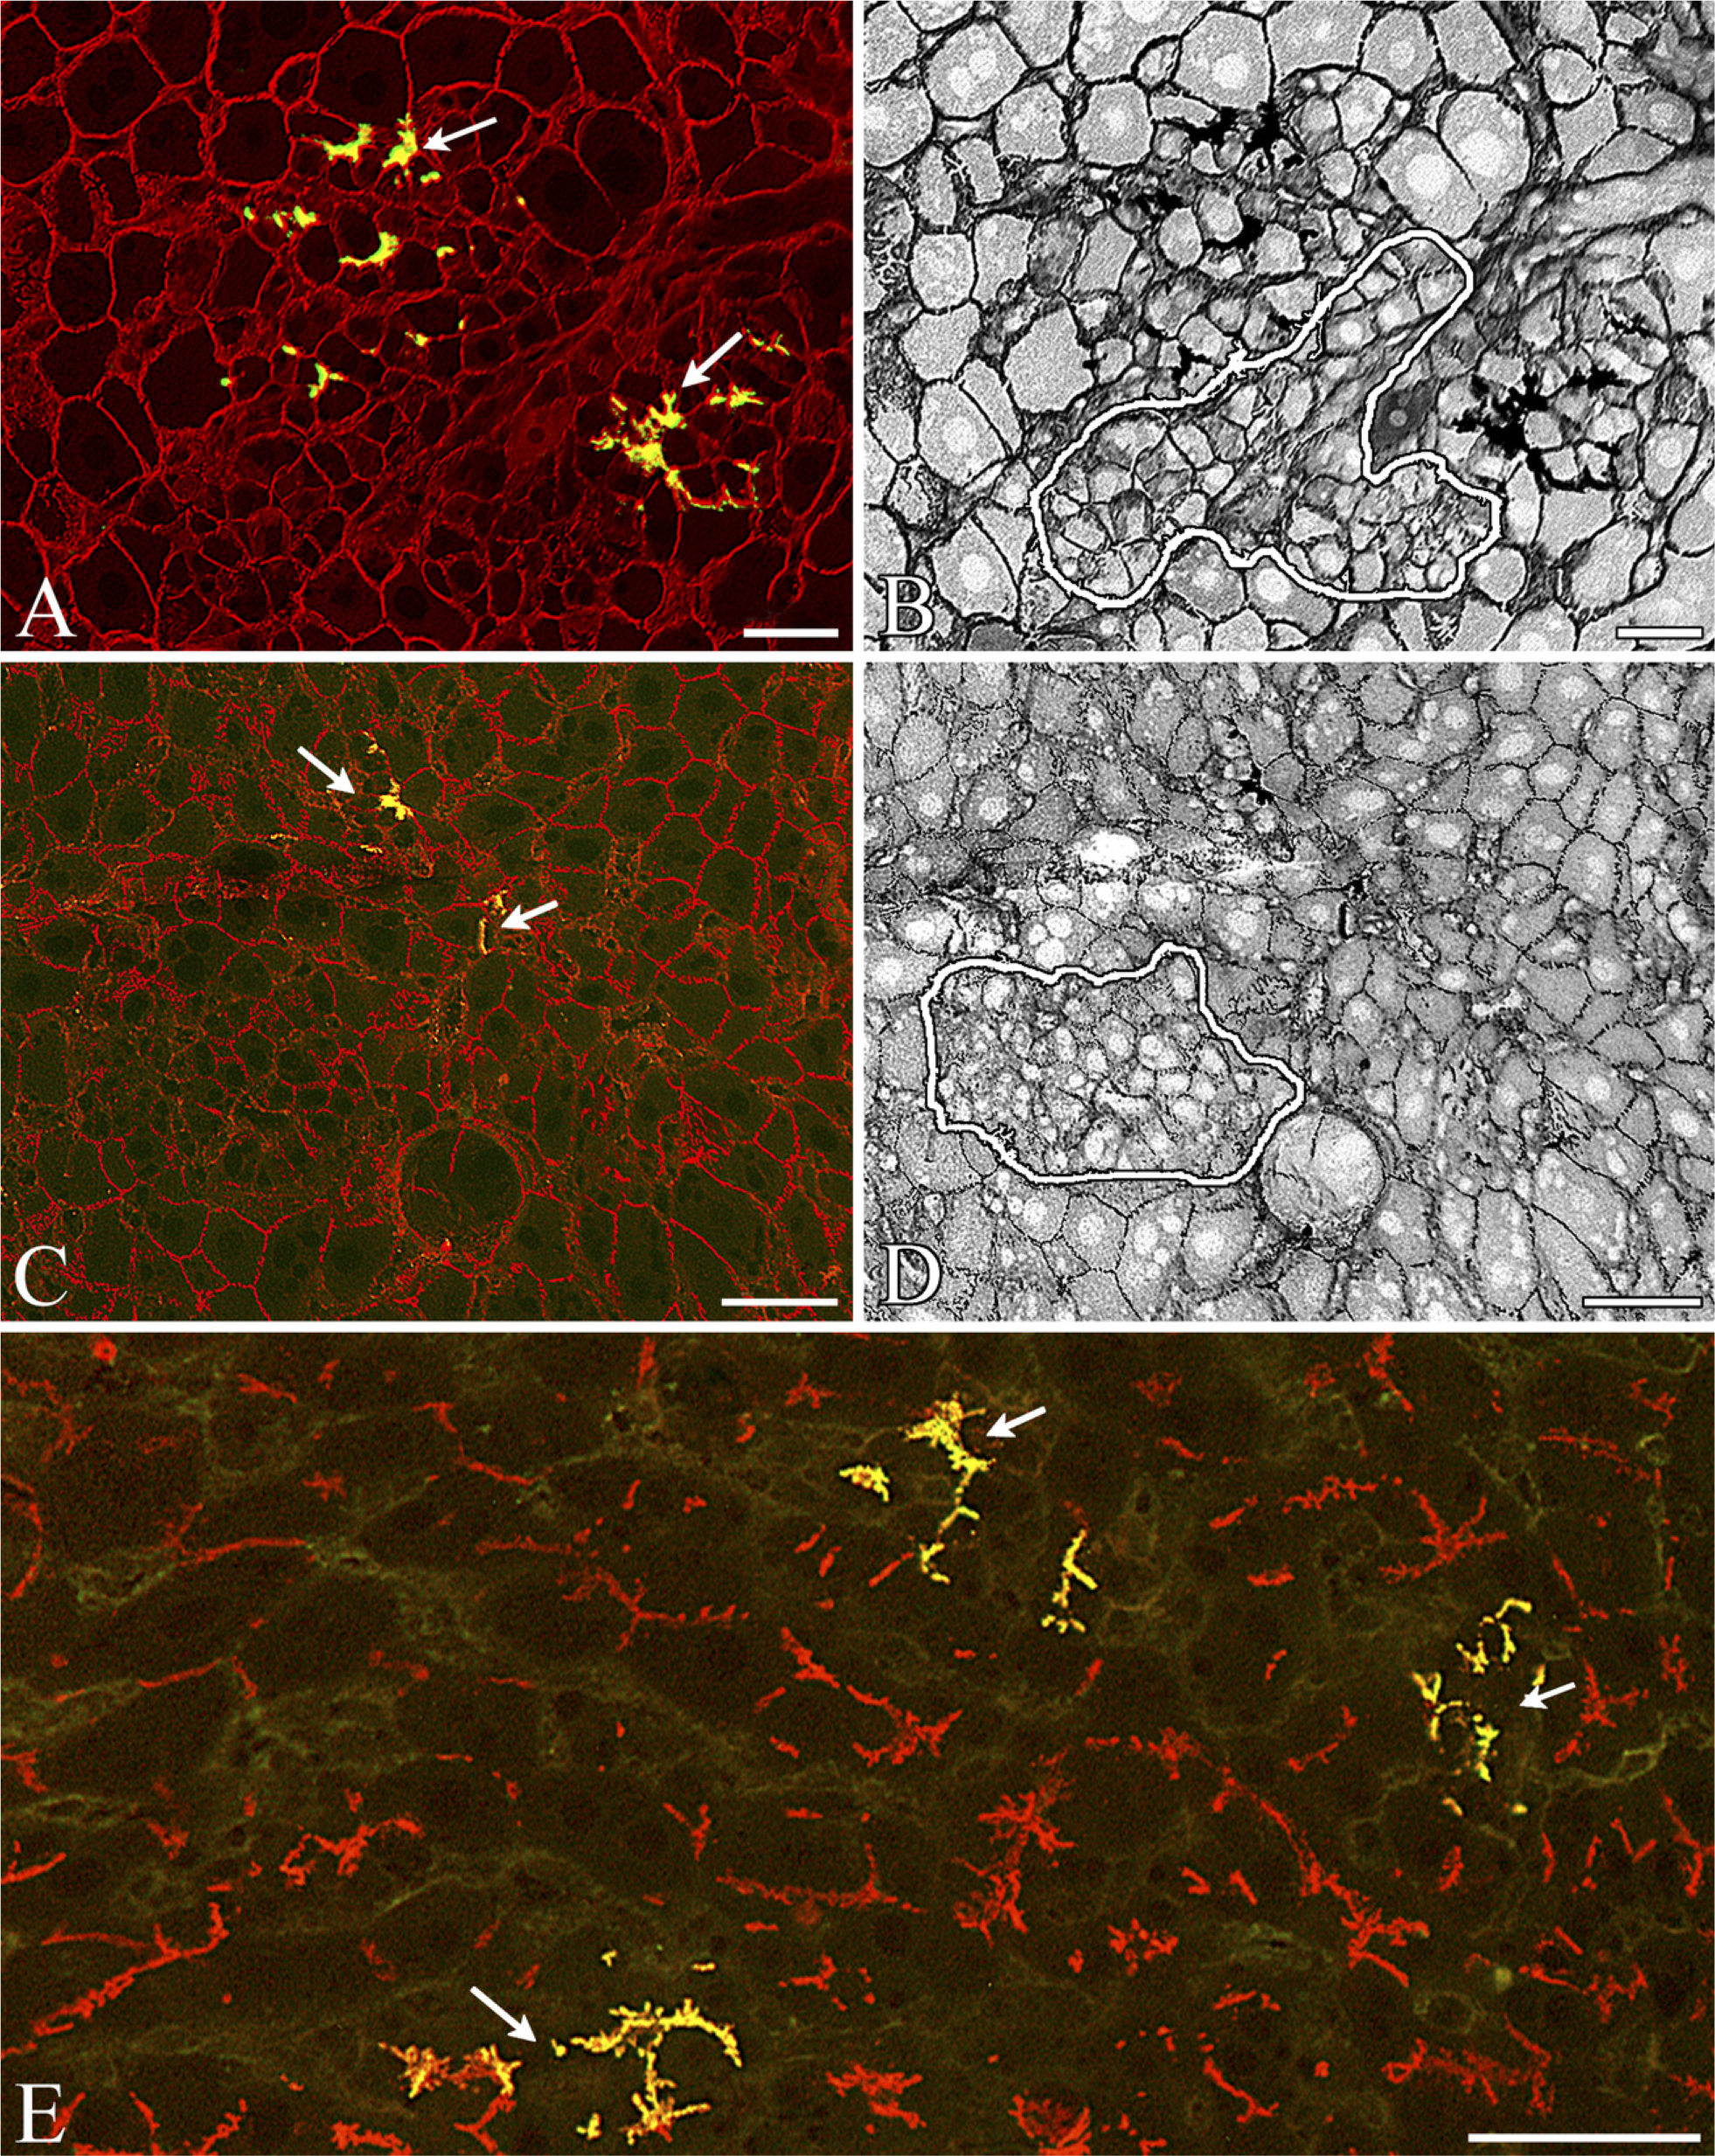
Phenotypic characterization of colonies of exogenous SH-R3s and endogenous SHPs. (
Phenotypic characterization of colonies of exogenous SH-R3s and endogenous SHPs. (
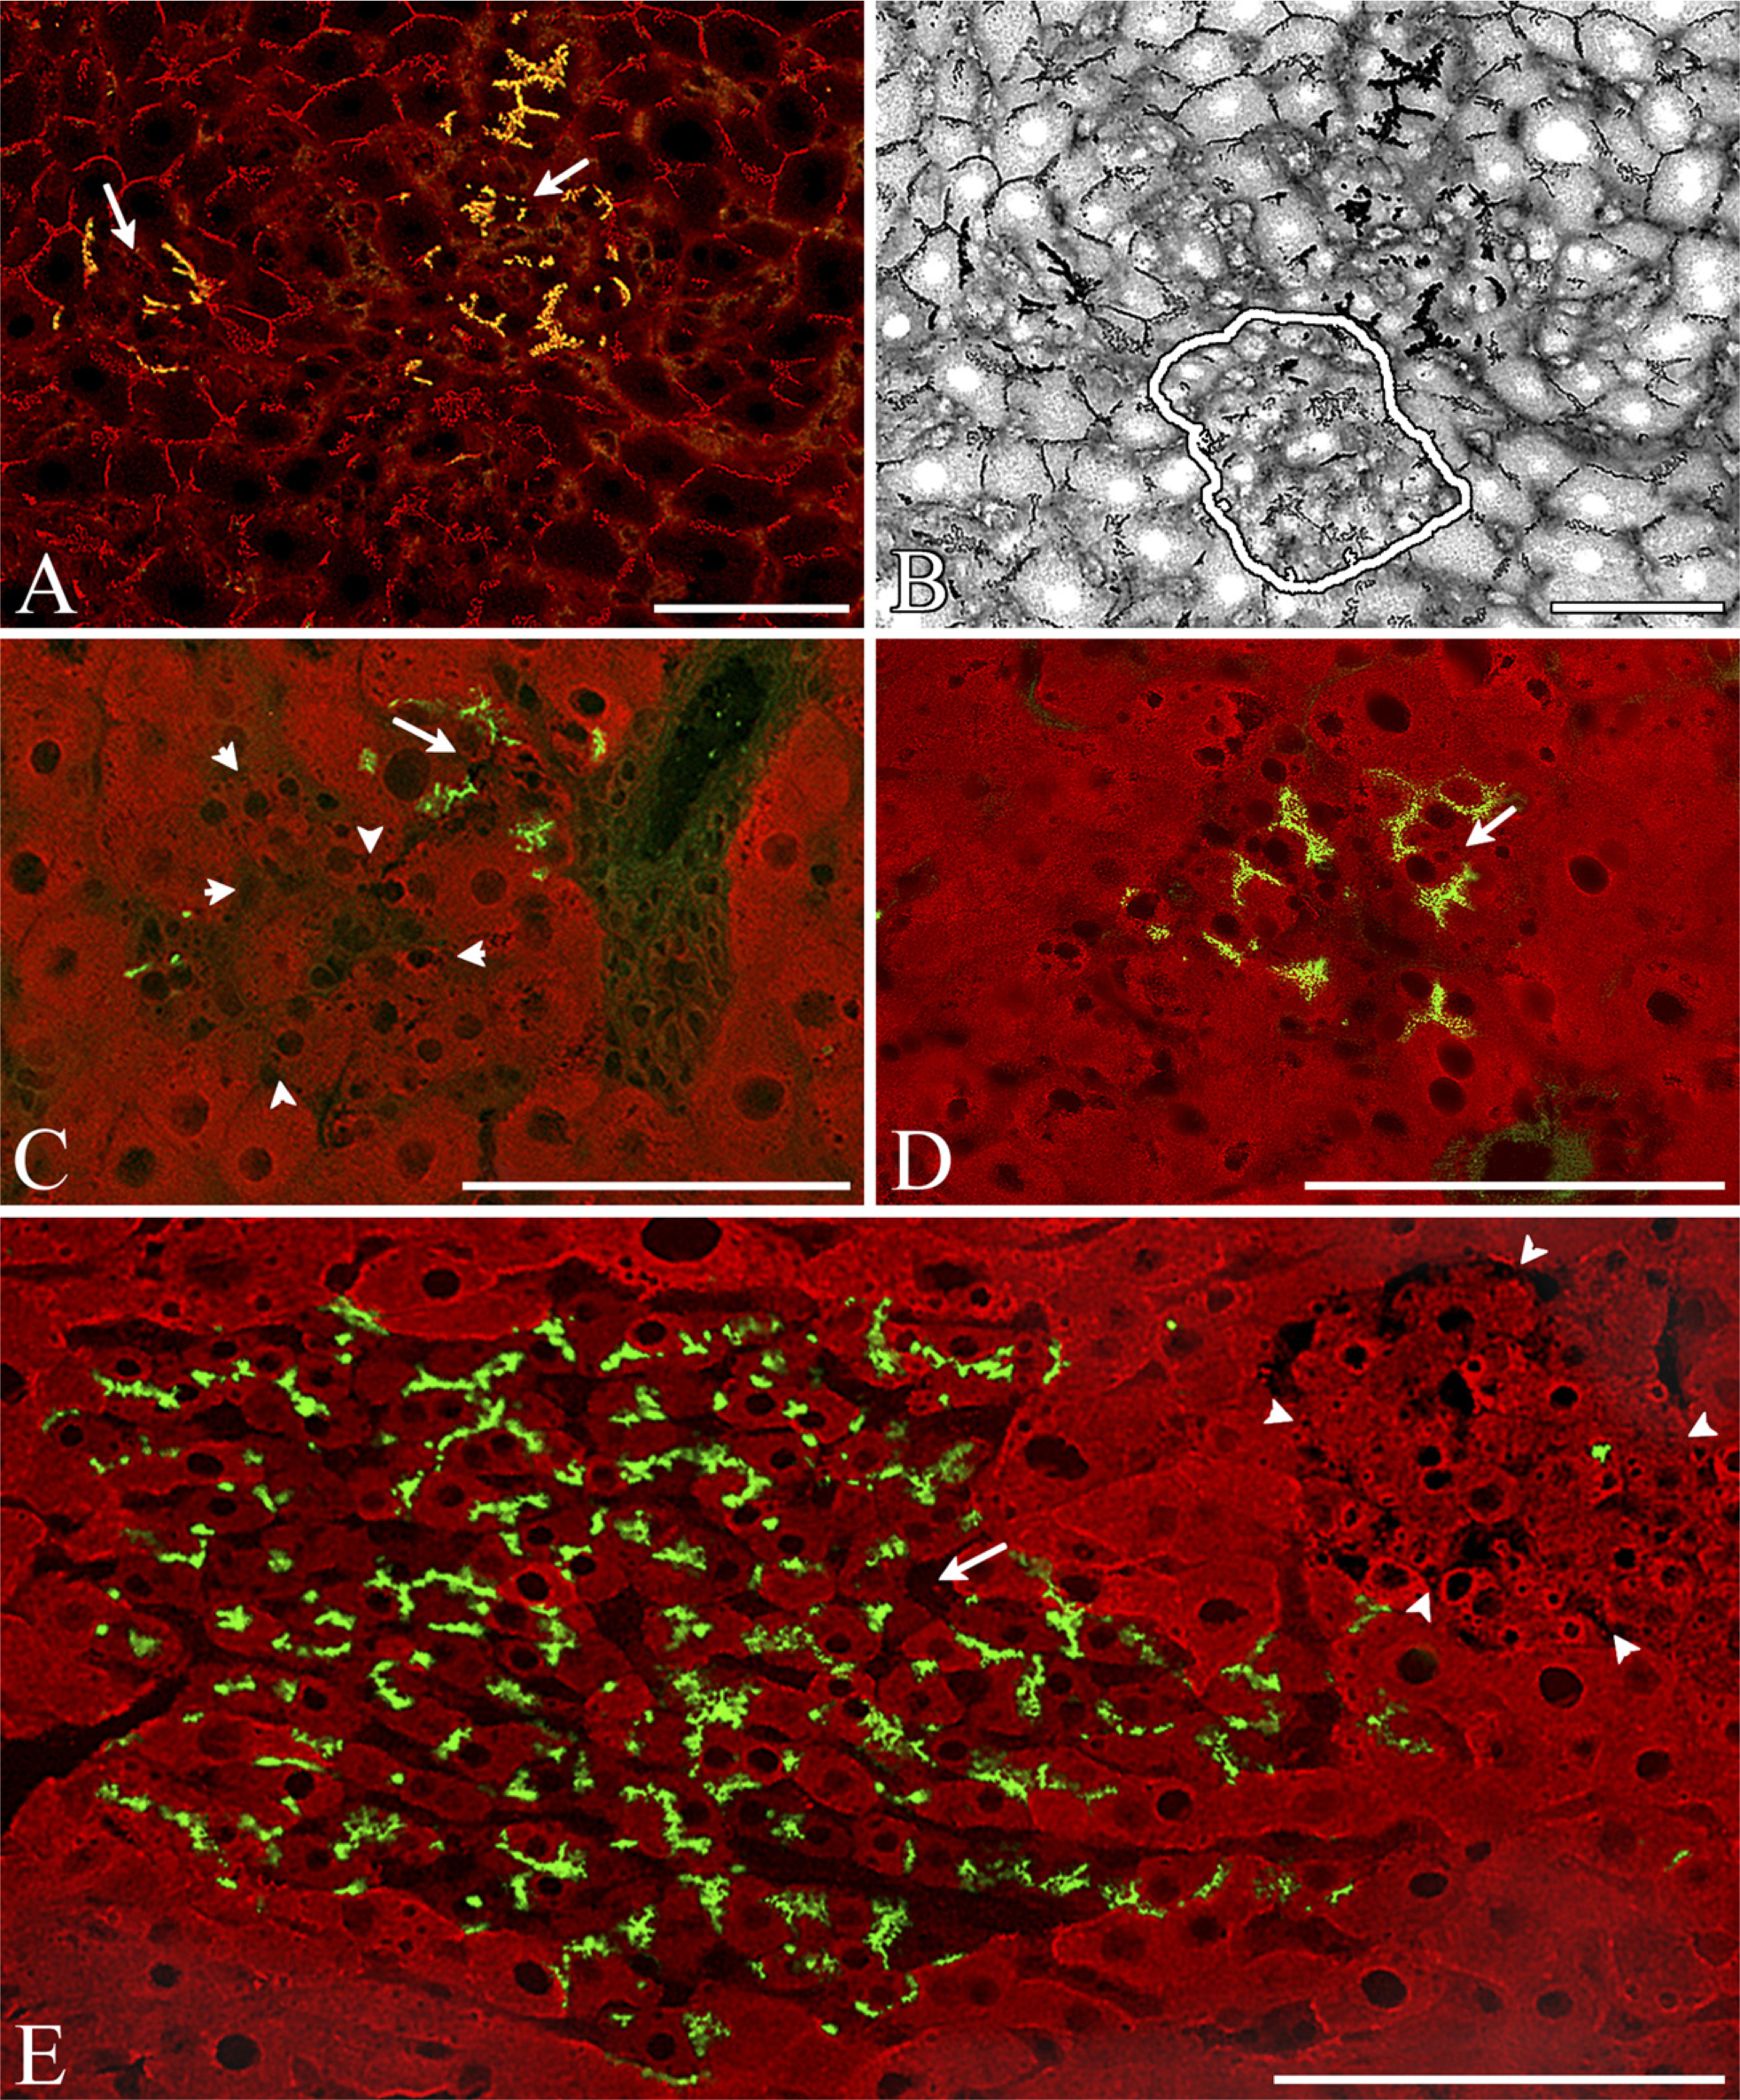
SH-R3 Appeared to Locate Preferentially in GGT+ Areas of the Host Parenchyma. Scattered clusters of DPPIV- host hepatocytes with strong membrane staining for GGT were found throughout the host liver parenchyma (Figures 5A-5D). A high percentage (.80%) of the SH-R3 colonies at days 5 and 7 were found embedded within these GGT-positive areas (Figure 6), a preference that was not observed for colonies of endogenous SHPs (Figure 6). Comparison of the average cross-sectional area of these clusters of GGT+ host hepatocyte at 5 and 21 days after PH revealed a marked decrease in size with increasing time (Figure 7).
Although most endogenous DPPIV- SHP colonies were negative for GGT, a few contained small numbers of GGT+ cells (data not shown). Yellow canaliculi representing colocalization of red GGT and green DPPIV fluorescence were often seen in exogenous SH-R3 colonies. These yellow canaliculi represented SH-R3s positive for both GGT and DPPIV (Figure 5) or alternatively, a bile canaliculus formed at the interface between a DPPIV+/GGT2 SH-R3 and a DPPIV-/GGT+ host hepatocyte (Figure 5B). In the inset in Figure 5C, the yellow fluorescence is localized at such an interface in what appears to be a composite canaliculus with a DPPV1GGT2 and a DPPIV-GGT+ face. In the inset in Figure 5D, the absence of green fluorescence suggests that the two yellow canaliculi in the inset were formed by an SH-R3 positive for both GGT and DPPIV.
SH-R3 Colonies Increased in Size More Rapidly Than Colonies of Endogenous SHPs. Initially, colonies of SH-R3s had an average cross-sectional area markedly smaller than colonies of endogenous SHPs. However, between 7 and 21 days after PH, SH-R3 colonies almost tripled in size, so that by 21 days, they were similar in area to their endogenous counterparts (Figure 6), which, during the same time interval, showed only a 1.5-fold increase in area. Because the diameters of SHPs and SH-R3s were virtually identical at days 7 and 21 (Table 1), the more-rapid increase in the size of SH-R3 colonies was not due to a differential increase in cell diameter.
Discussion
In the present investigation, we have compared the morphological and phenotypical characteristics of colonies formed by transplanted SH-R3s and endogenous SHPs. SH-R3s were reported previously by Katayama et al. (2001) to engraft and expand when transplanted following PH of retrorsine-treated host rats. Our results show that colonies derived from transplanted SH-R3s and endogenous SHPs at 21 days after treatment with retrorsine and PH show similar phenotypes, contain well-defined bile canaliculi, and display a histotypical arrangement of sinusoids. A characteristic of both types of colonies was an altered distribution and expression of TfR, a cell surface glycoprotein previously shown to be overexpressed by neoplastic nodules and hepatocellular carcinomas (Faris et al. 1991; Hixson et al. 1996). Similar results were also obtained by Pascale et al. (1998). Although the physiological significance of the differences observed in TfR expression remains to be determined, a recent study showing that overexpression of TfR greatly increased the size of metastatic foci formed by rat mammary carcinoma cells (Cavanaugh et al. 1999) suggests that high levels of TfR may have a positive effect on the growth and expansion of SHPs and SH-R3s.
DPPIV+ colonies derived from SHs were frequently found within areas of GGT+ host hepatocytes. Gupta et al. (2000) also observed GGT expression in R/PH-treated rats that increased 20-fold by 2 weeks and persisted for months after transplantation. These investigators surmised that the expression of GGT was a consequence of ischemic liver injury caused by transient portal hypertension produced following intrasplenic injection of a large bolus of hepatocytes (106 to 2 × 10⁷ cells). If GGT induction is truly a consequence of ischemic injury, the marked reduction in the size of GGT+ areas observed in the present studies suggests that the injury caused by the much lower dose of cells used in the present investigation was less severe and more transient in nature.
Asahina et al. (2006) distinguished between SHPs and SH-R3s based on differences in the expression of α-fetoprotein (AFP) and WT1, both of which were low in SH-R3s but, according to Gordon et al. (2000a), were high in SHPs induced by retrorsine. Asahina et al. (2006) also reported that CYPs, including CYP2E1, were expressed at lower levels by isolated SH-R3s when compared with hepatocytes. In agreement, we consistently found lower levels of CYP2E1 in SH-R3 colonies in comparison to surrounding host hepatocytes. In contrast, even at 5 days, the majority of endogenous SHPs displayed levels of CYP2E1 that were very close or identical to those of host hepatocytes, a finding in line with results reported by Gordon et al. (2000b). The lower CYP2E1 expression by SHP-R3s could result from stress induced during migration through the spleen or during the process of engraftment, or could reflect the more rapid upregulation by endogenous SHPs, a consequence of their exposure to retrorsine. All of these possibilities would be consistent with the initially slower expansion of exogenous SH-R3s (Figure 6). It is also possible that the more rapid acquisition of CYP2E1 by endogenous SHPs reflects the selection by retrorsine for a distinct subpopulation of SHPs, a possibility suggested by the presence of annexin III in SH-R3s isolated as described in the present report (Niimi et al. 2003) and its absence in SH-R3s isolated by Asahina et al. (2006) using a different protocol.
Location of donor SH-R colonies relative to γ-glutamyl transpeptidase (GGT)-positive areas in host rat liver: Frozen sections were double labeled by IIF for GGT (red) and DPPIV (green). (
Mean diameters ±SE of cells within SH-R3 and SHP colonies
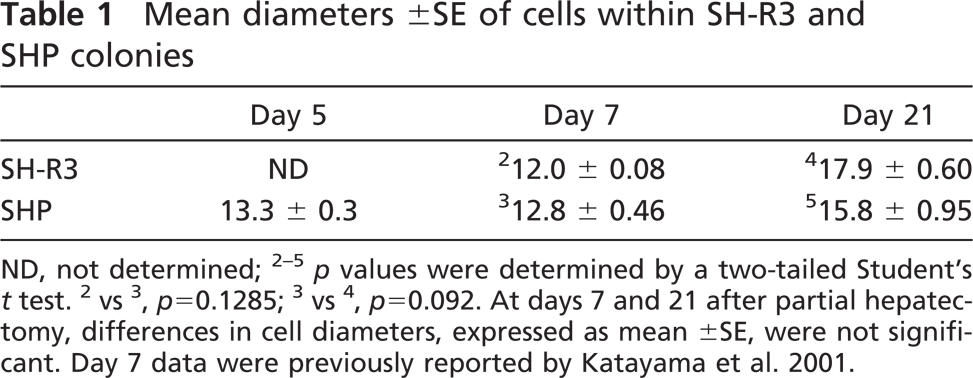
ND, not determined; 2–5 p values were determined by a two-tailed Student's t test. 2vs3, p=0.1285; 3vs4, p=0.092. At days 7 and 21 after partial hepatectomy, differences in cell diameters, expressed as mean ±SE, were not significant. Day 7 data were previously reported by Katayama et al. 2001.
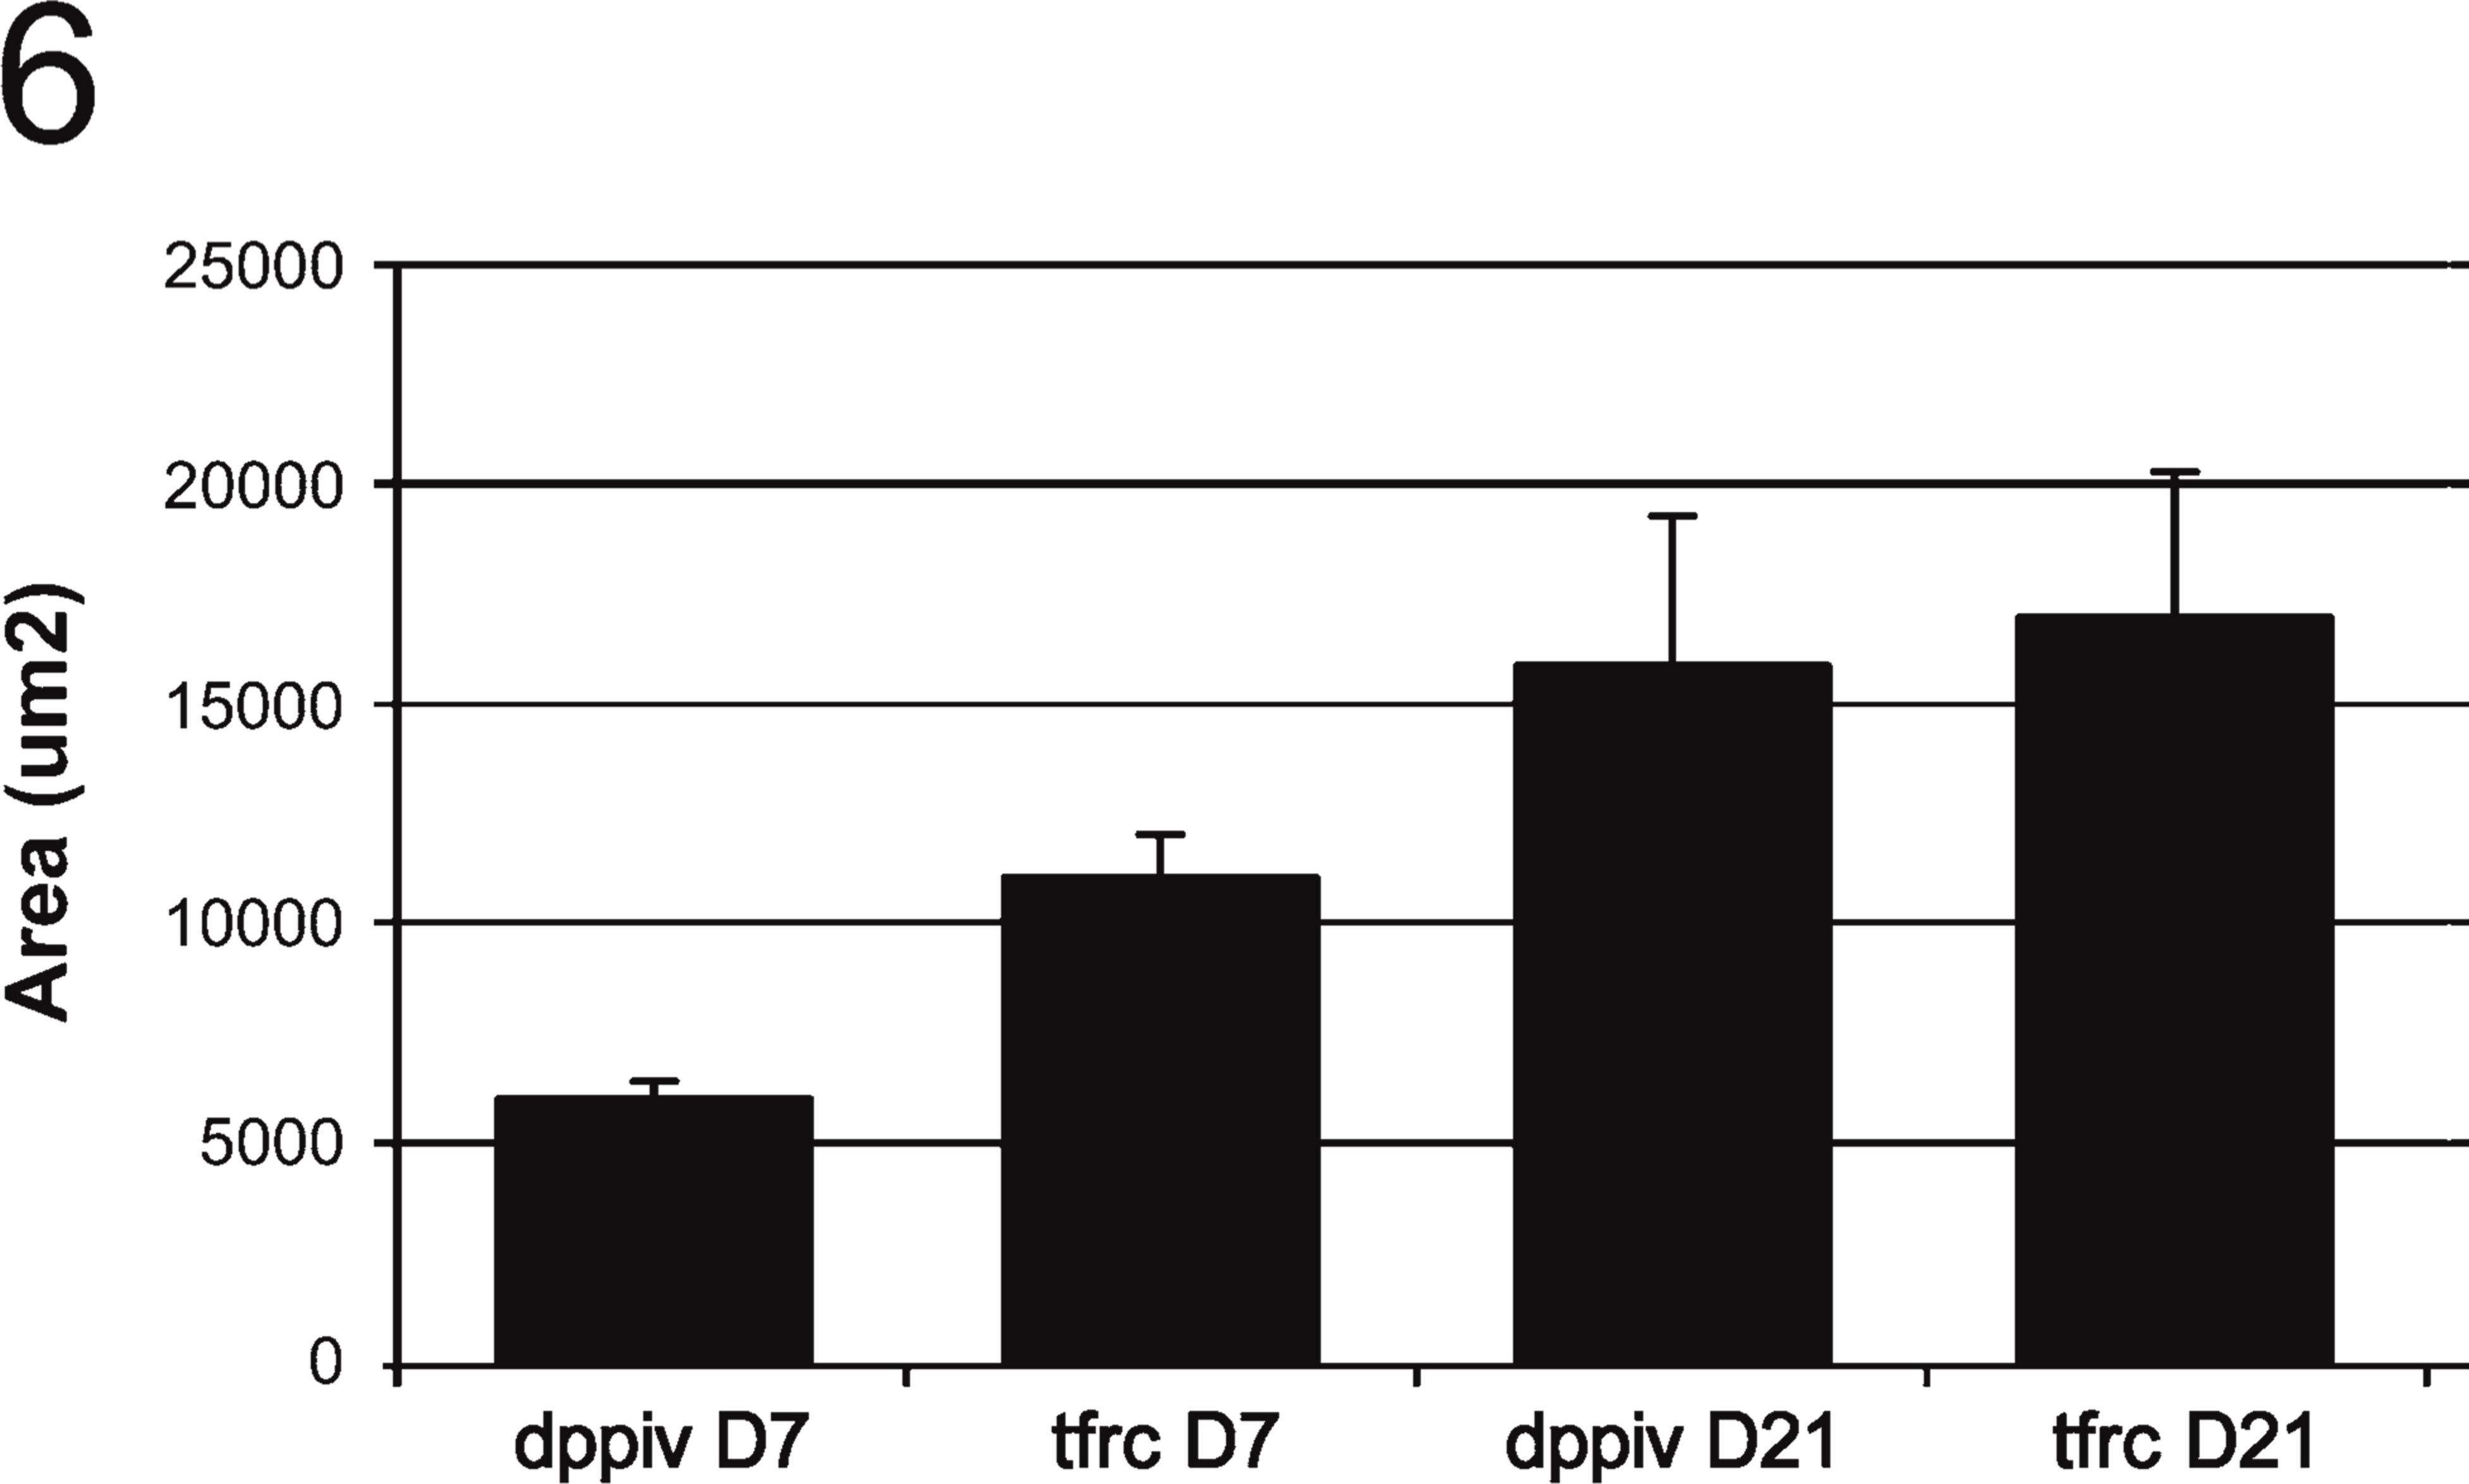
Size comparison of endogenous SHP (TfR+/DPPIV-) and exogenous SH-R3 (TfR+/DPPIV+) colonies. Areas of colonies labeled by IIF for DPPIV and TfR at days 7 and 21 after PH were determined by image analysis with Image Pro Plus software. At day 7, endogenous colonies of SHPs were significantly larger than colonies of SH-R3s (p,0.0005 for a two-tailed Student's t-test assuming equal variance. Variances were determined to be equal by the F test). However, by 21 days, this differential in size was no longer apparent.
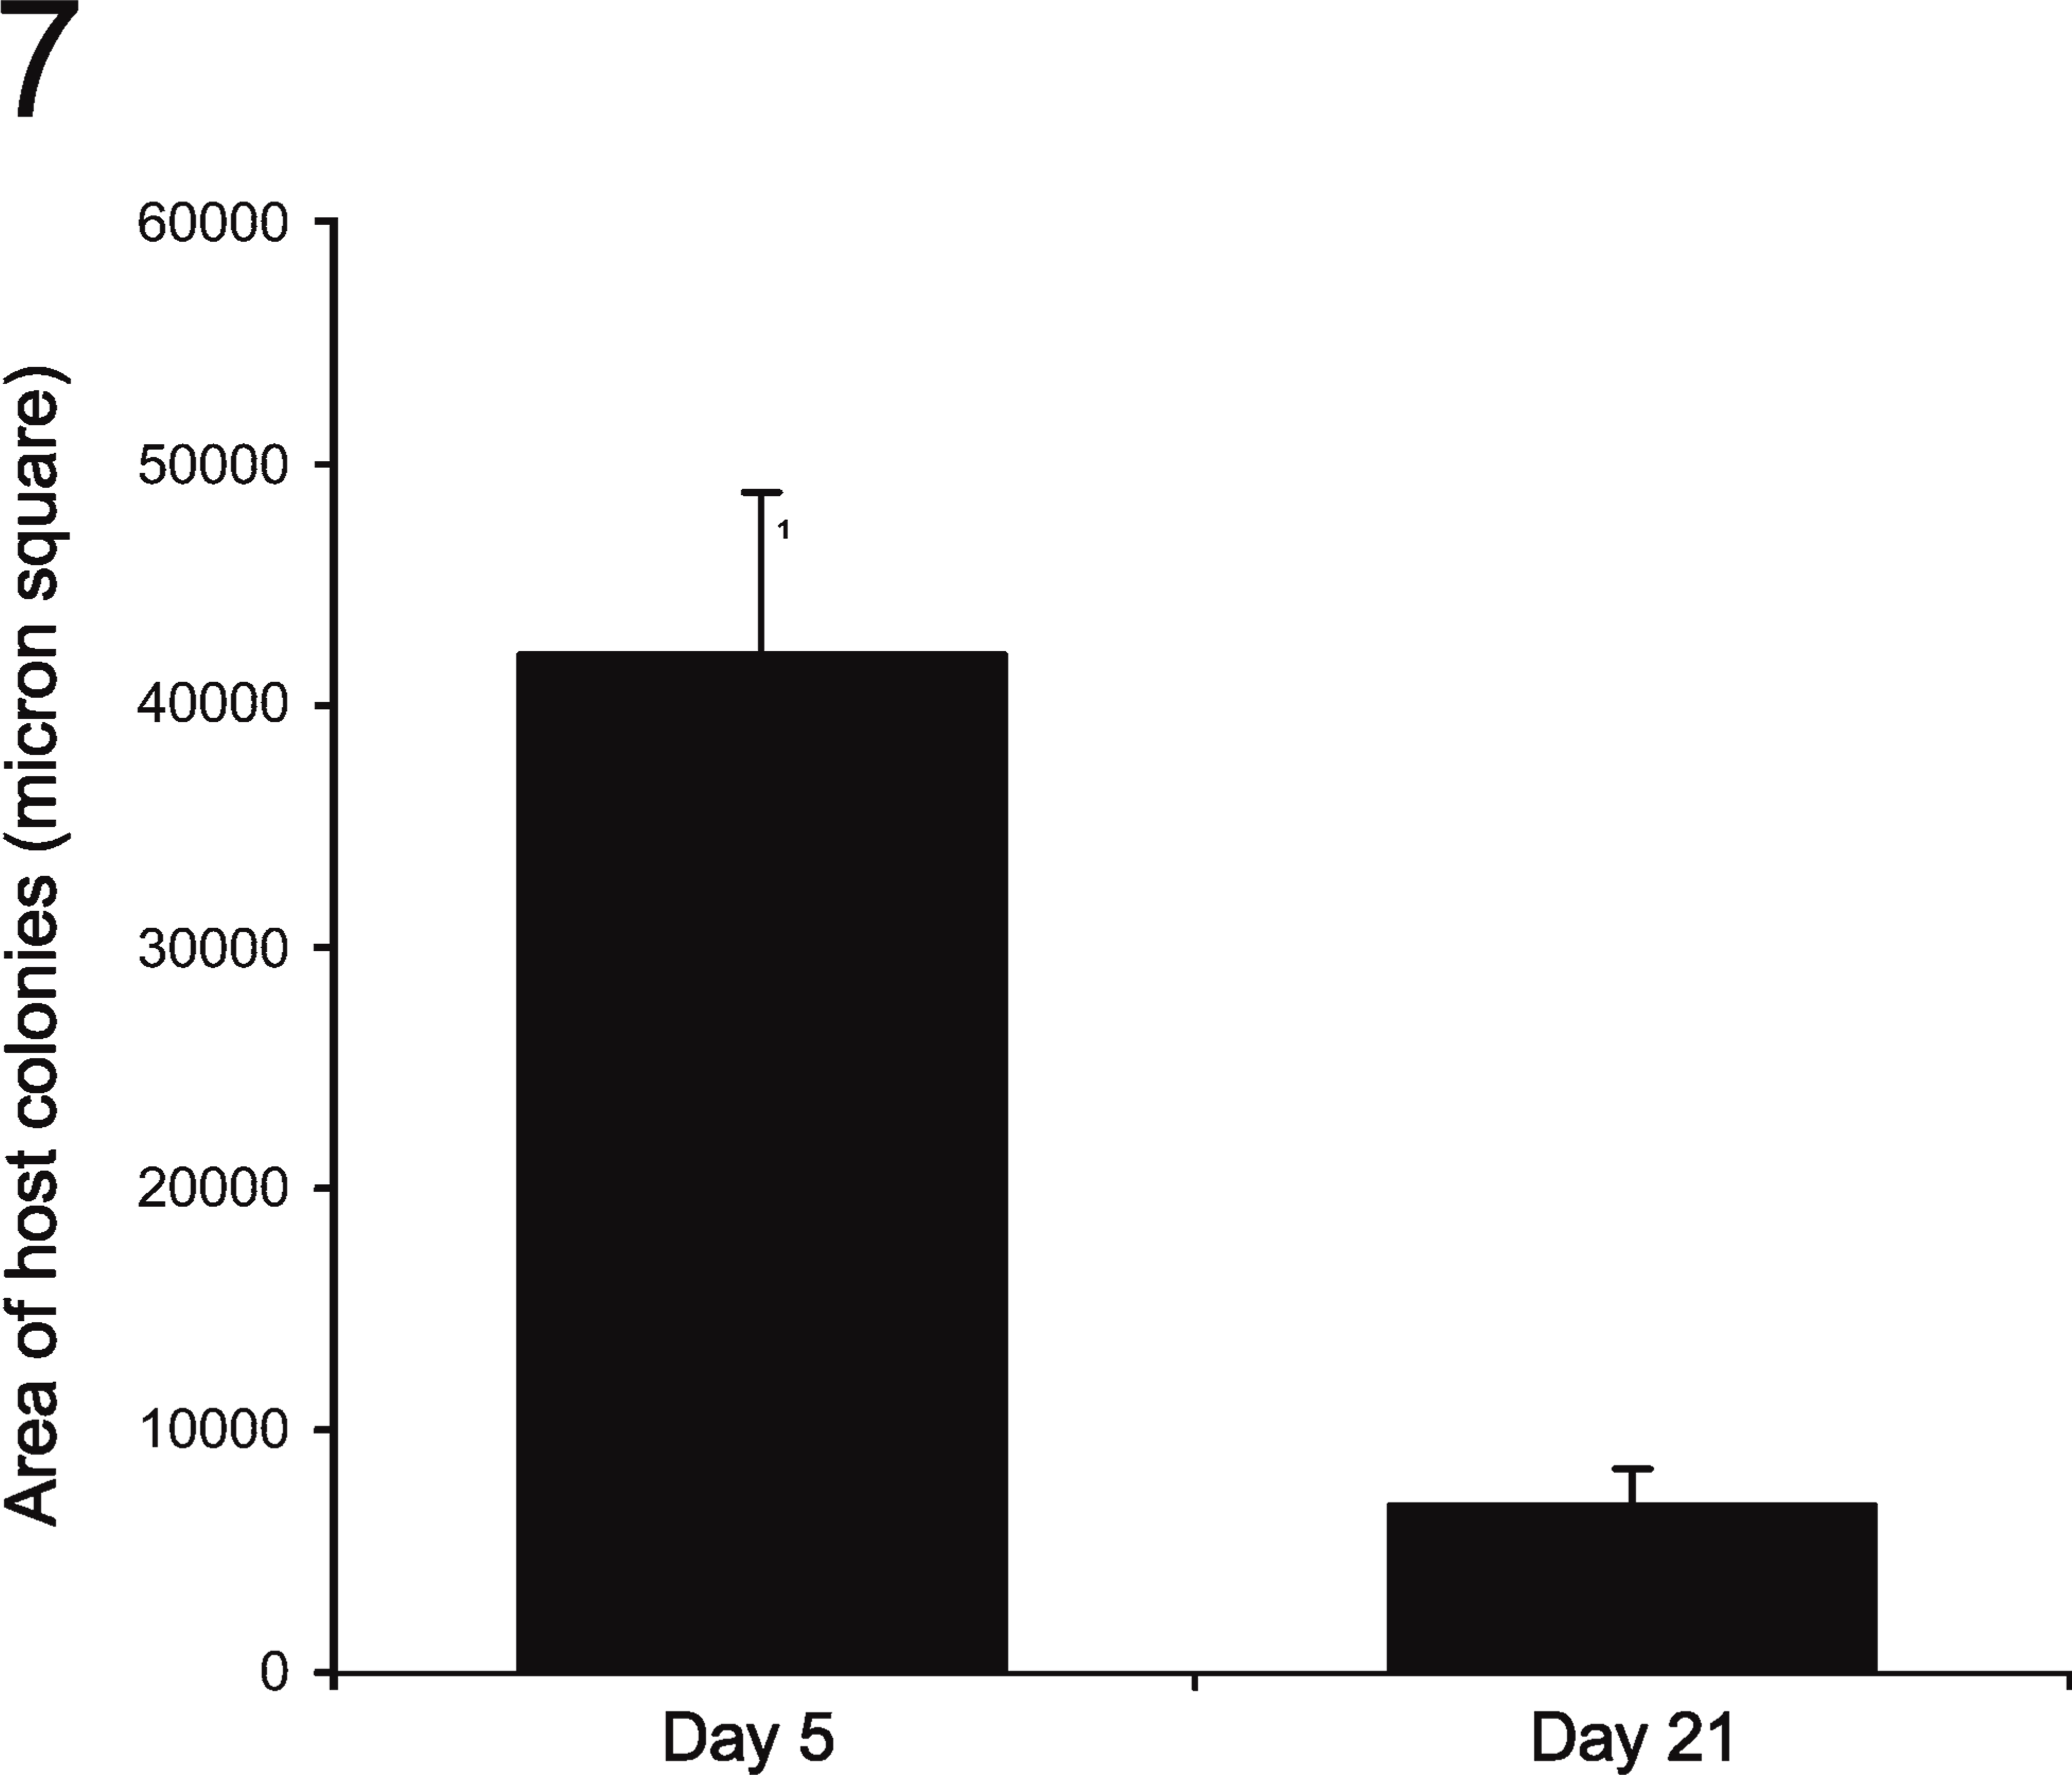
Changes in the size of GGT-positive hepatocyte clusters. The area occupied by GGT+ hepatocytes in retrorsine/PH (R/PH)-treated, DPPIV- host rat livers transplanted with SH-R3s was determined by image analysis with Image Pro Plus software. Between day 5 and day 21 after PH, there was a significant 4-fold drop in the size of GGT+ hepatocyte clusters (p<0.0005 for a two-tailed Student's t-test assuming unequal variance. Variances were determined to be unequal by the F test).
At 5 days after PH, colonies of SHPs were almost twice the size of their exogenous SH-R3 counterparts. This initial lag in SH-R3 proliferation could infer a period of recovery from stresses incurred during dissociation, isolation, and transplantation. It could also derive from stresses induced during transit from the spleen, extravasation from sinusoids, and stable integration into the host parenchyma. If there were restraints on proliferation, they were apparently released between 7 and 21 days, because colonies of exogenous SH-R3s increased in size at twice the rate of endogenous SHPs, a differential that could be due to an increase in SH-R3 expansion, an SH-R3-mediated suppression of SHP proliferation, or both. However, any significant effects of SH-R3s seem unlikely, considering the large number of SHPs [4.5 × 10⁷ to 6 × 10⁸ at days 6–8 and 14 after PH, respectively (Gordon et al. 2002)] in comparison to the small number of transplanted SH-R3s (2 × 10⁵) and the even lower number that transit from the spleen and engraft in the liver.
In a recent report, Avril et al. (2004) proposed that SHPs in the retrorsine model were derived from mature hepatocytes. This conclusion was based on the fate of hepatocytes genetically labeled in situ by infection with a β-galactosidase retrovirus after having been given cyproterone acetate and thyroid hormone to induce proliferation. Subsequent treatment with R/PH resulted in the appearance of SHP-expressing β-galactosidase. Based on the similarity in the percentage of β-galactosidase-positive hepatocytes prior to R/PH and the percentage of β-galactosidase-positive SHP colonies, it was concluded that SHPs were derived from mature hepatocytes randomly recruited into proliferation. In a cogent analysis, Coleman and Best (2005) point out that the majority of β-galactosidase-positive hepatocytes, like their uninfected counterparts, would be sensitive to the mitoinhibitory/cytotoxic effects of retrorsine and ultimately undergo apoptosis. Instead of random hepatocytes, Best and Coleman (2007) offer the counterproposal that at least some SHPs derive from rare AFP-positive, CYP450-deficient, retrorsine-resistant, parenchymal cells morphologically similar to hepatocytes but lacking the full spectrum of hepatocyte-specific genes. In a more recent report, Best and Coleman ruled out the possibility that SHPs were derived from oval cell precursors by showing that subcutaneous implantation of a 21-day 2-acetylaminofluorine time release pellet into retrorsine-treated animals at 1 week prior to R/PH suppressed the expansion of SHPs while causing a marked proliferation of oval cells. This was in contrast to treatment with R/PH alone, which produced the expected SHP expansion without inducing significant numbers of oval cells.
Although thought-provoking, the observations of Avril et al. do not eliminate the possibility that SHPs may arise from some other immature progenitor cell type (Sell 2001), such as SH-R3 cells or oval cells, the latter recently shown to be an apparent SHP progenitor in mice (Vig et al. 2006). In addition, Avril et al. reported that at 1 month after PH, SHPs formed three-dimensional clusters lacking sinusoids, an observation at odds with the present studies, in which well-defined sinusoids were present in colonies of SHPs and SH-R3s as soon as 5 days after PH. The reason for this discrepancy is presently unresolved.
The relative numbers of SH-R3s vs SHPs during the first 5 days after PH also argue against any significant effect of engrafted SH-R3s on the growth of SHPs. R/PH-treated rats were injected with 2 × 10⁵ SH-R3s. Inasmuch as only a fraction of the 50% that reach the liver undergo stable engraftment, it is hard to see how such a small number of cells could have a major influence on the growth of SHPs.
In conclusion, the present study shows that both endogenous SHPs and exogenous SH-R3s expand to form colonies similar in size and morphology that display phenotypes closely resembling mature hepatocytes.
Footnotes
Acknowledgements
Sponsored by grants from the National Cancer Institute (CA-42714, CA-93840) and from the National Center for Research Resources (P20RR017695).