
Abstract
For the understanding of functions of proteins in biological and pathological processes, reporter molecules such as fluorescent proteins have become indispensable tools for visualizing the location of these proteins in intact animals, tissues, and cells. For enzymes, imaging their activity also provides information on their function or functions, which does not necessarily correlate with their location. Metabolic mapping enables imaging of activity of enzymes. The enzyme under study forms a reaction product that is fluorescent or colored by conversion of either a fluorogenic or chromogenic substrate or a fluorescent substrate with different spectral characteristics. Most chromogenic staining methods were developed in the latter half of the twentieth century but still find new applications in modern cell biology and pathology. Fluorescence methods have rapidly evolved during the last decade. This review critically evaluates the methods that are available at present for metabolic mapping in living animals, unfixed cryostat sections of tissues, and living cells, and refers to protocols of the methods of choice.
Keywords
T
Together, all of these variables determine the activity of an enzyme. Therefore, localization or measurement of mRNA or protein of an enzyme in cells cannot predict its activity in those cells (Figure 1) (Hazen et al. 2000; Baruch et al. 2004; Boonacker et al. 2004; Bogyo and Cravatt 2007). Similarly, activity measurements of a purified enzyme in either diluted solutions or in tissue or cell homogenates probably do not reflect the activity of that enzyme in the crowded compartmentalized cell (Baruch et al. 2004; Ramanujan et al. 2008).
Localization of the protein
Living cell or tissue imaging, in which cells and tissues are kept intact during analysis, is perhaps the best approach to generating data on the activity of an enzyme that reflect the in vivo situation (Yuste 2005; Sadaghiani et al. 2007; Ramanujan et al. 2008). Imaging of enzyme reactions in living tissues is more complex, but the use of unfixed cryostat sections in combination with tissue protectants in the incubation media on top of the sections allows the determination of enzyme reactions in an almost true-to-nature situation (Van Noorden and Frederiks 2002). The most-complex form of metabolic mapping is non-invasively in vivo. Despite technical difficulties, considerable progress has been made, particularly in the imaging of enzyme activity to visualize pathological lesions such as tumors, atherosclerotic lesions, and arthritic joints.
This review critically evaluates developments in metabolic mapping in live animals, tissues, and cells over the last 10 years.
Fluorescence vs Absorbance
Imaging of enzyme reactions in time is possible when the enzyme converts a fluorogenic or chromogenic substrate into a fluorescent or colored product. Imaging fluorescence is potentially harmful to cells because the excitation of fluorescence molecules generates radicals, in particular oxygen radicals, that can cause cell death (Stephens and Allan 2003; Hoebe et al. 2007,2008). There are various ways to reduce or avoid cytotoxicity of fluorescence imaging (Stephens and Allan 2003; Frigault et al. 2009), but the most drastic way of limiting the phototoxicity of fluorescence imaging is the application of controlled light exposure microscopy (CLEM; Nikon, Tokyo, Japan) that is based on the principle that not all pixels receive the same amount of excitation light. A feedback system regulating the exposure time per pixel decides in an early stage of exposure whether the pixel is foreground or background. Background pixels only receive limited exposure. Bright pixels in the foreground receive less light than do dim pixels, which receive full exposure. The final image is constructed on the basis of information on exposure time and the amount of fluorescence. In this way, 2–10 times less exposure to excitation light is needed, depending on the composition of the image (Figure 2) (Hoebe et al. 2007,2008).
Imaging of colored enzyme products is relatively harmless to cells. The relative amount of light necessary to image colored enzyme products in a cell is only a fraction of that needed to image fluorescence in a cell. Moreover, generation of radicals during excitation of fluorescence molecules is limited to autofluorescence. When cytometry or image analysis is used to quantify colored reaction product formation, this damage is even less, because white light cannot be used for valid quantification. Narrow bandpass filters are used to generate monochromatic light for precise absorbance measurements (Chieco et al. 1994,2001).
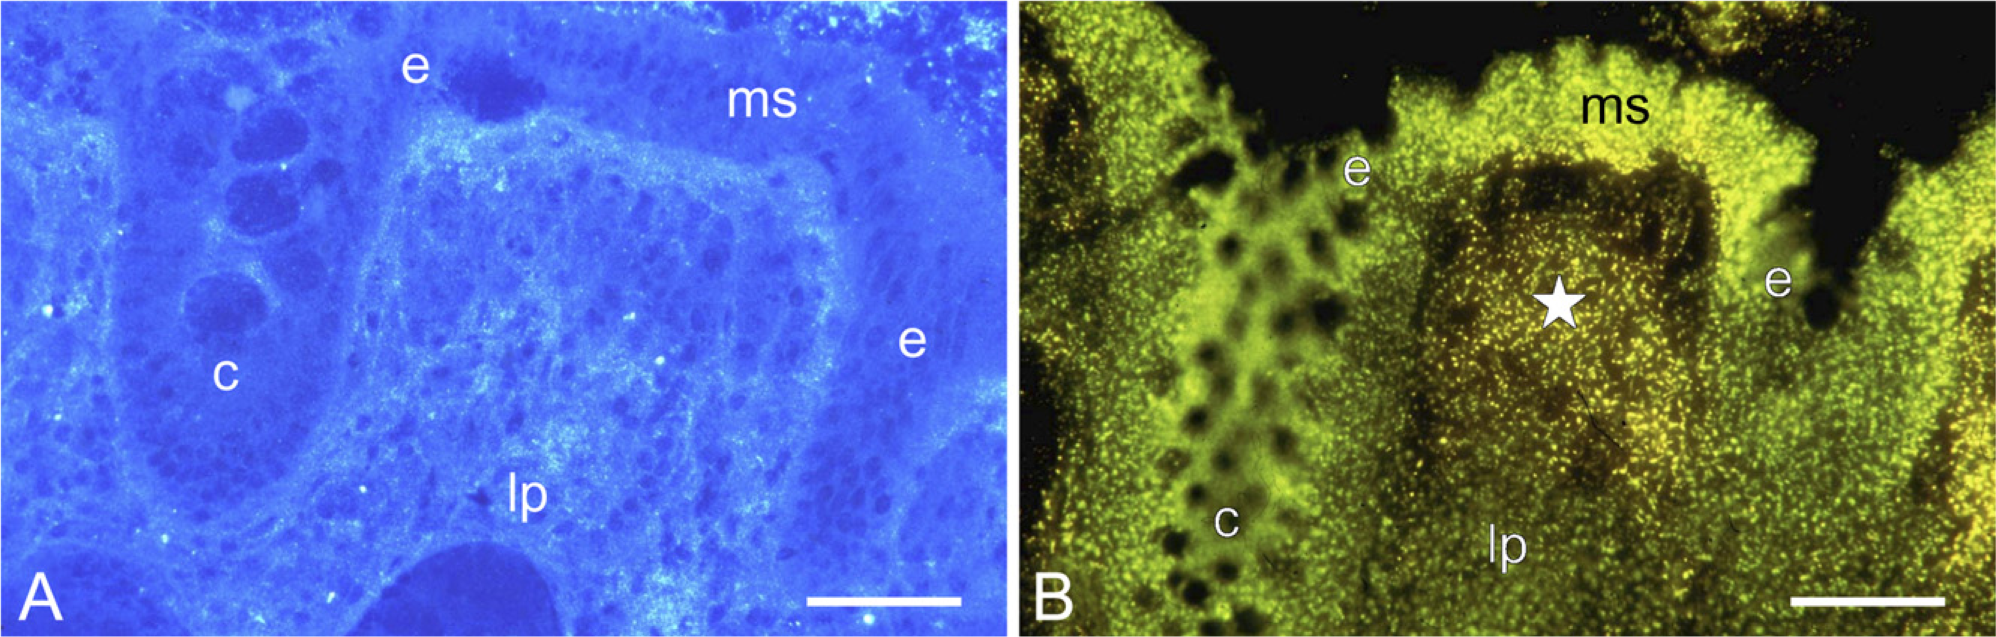
Another aspect that needs serious consideration when using living cells is the permeability of cells for the substrate of the enzyme and the impermeability for the product. Ideally, the substrate reaches the same concentration in cells as in the incubation medium in a short period of time, whereas the product remains in cells. In that way, enzyme reactions can be monitored at different substrate concentrations, which enables the determination of the kinetic properties of an enzyme, such as the maximum velocity (Vmax), Michaelis constant (K m ), and metabolic flux (Figure 3). However, the cell membrane is often a diffusion barrier for the enzyme substrate. There are a number of ways to circumvent this obstacle: (1) microinjection of the substrate into individual cells; (2) electroporation of cells; (3) chemical fixation of cells with homeopathic concentrations of fixative that only permeates the cell membrane without inactivation of the intracellular proteins; (4) treatment of cells with digitonin, bile salts, or detergents; (5) the use of membrane-permeable prosubstrates; and (6) the use of fluorescent substrates that result in fluorescent enzyme products at different wavelengths.
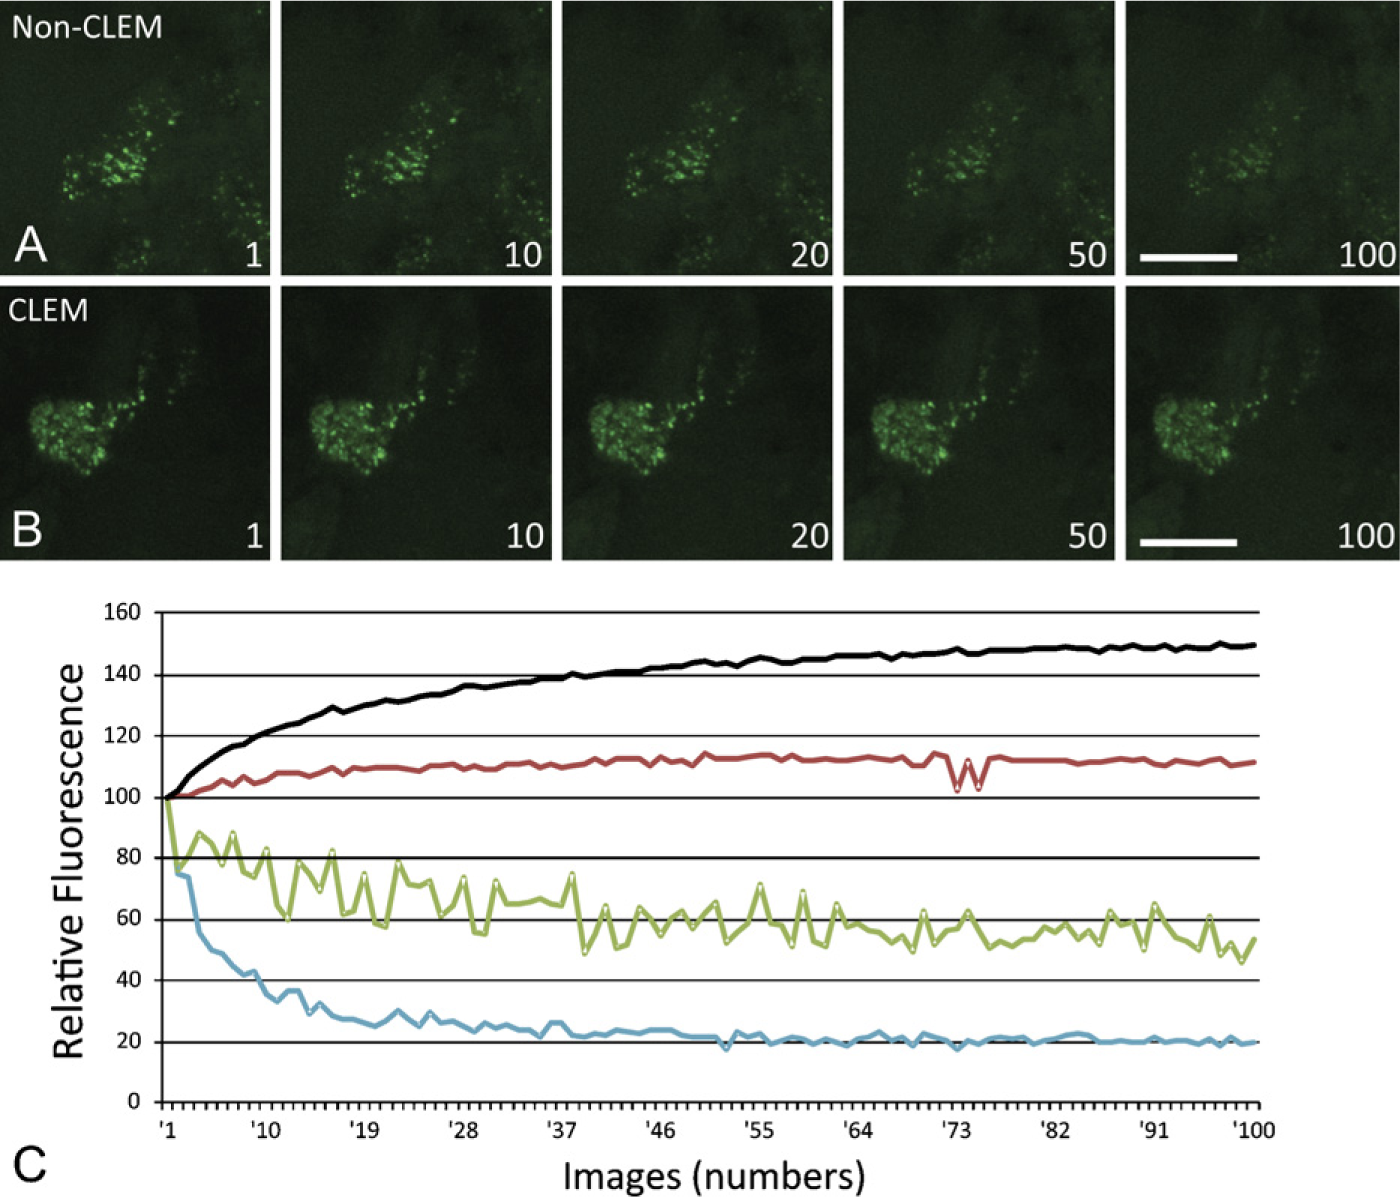
In situ zymography of gelatinase (MMP-2 and MMP-9) activity using DQ-gelatin as substrate in human brain tumor tissue (glioblastoma multiforme). Imaging in time was performed using a Nikon C1 Eclipse confocal microscope (Nikon Instruments; Amstelveen, The Netherlands) equipped with Hamamatsu E717–63 photomultipliers (Hamamatsu; Hamamatsu City, Japan) and homemade controlled light exposure microscopy (CLEM) electronics. A Nikon Plan Apo 403/1.0 objective and EZ-C1 3.90 software from Nikon were used. An acoustic optical modulator (Isomet; Springfield, VA) was placed in the optical path of a 488-nm argonion laser at 20 mW. Images were sampled at 288 × 288 × 7 (X, Y, Z) pixels using a 12-bit analog digital converter and a voxel size of 0.104 × 0.104 × 0.4 μm. The time between images was 45 sec. One hundred images were collected without
In our hands, microinjection, homeopathic fixation of cells, membrane-permeable prosubstrates, and fluorescent substrates producing fluorescent products with a different wavelength are the methods of choice. The first method is time-consuming, but imaging can be performed even during injection. Electroporation is less suitable, because it takes a relatively long time before cells have recovered and the enzyme reaction starts as soon as the substrate has entered cells. Homeopathic fixation also produces good and reproducible results; but it needs to be done very accurately; too little gives no result, because the cells are still impermeable, whereas too much inactivates intracellular proteins. Many enzymes are very sensitive to fixation. For example, staining of glucose-6-phosphate dehydrogenase (G6PD) activity in erythrocytes is an important diagnostic tool for detecting G6PD deficiency, which is the most common inherited enzyme deficiency in humans and is X-chromosome linked. Heterozygous females cannot be detected reliably with methods other than the cytochemical method (Peters and Van Noorden 2009). The cytochemical method is only successful when the erythrocytes are permeabilized with 0.025% freshly prepared glutaraldehyde for 30 min at room temperature (Figure 4). We did not succeed in permeabilizing cells chemically with any other method tested (Van Noorden et al. 1982). The best example of the use of a membrane-permeable prosubstrate is a substrate that contains an ester, such as acetate. Ester-containing molecules often show cell permeability, presumably because hydrophilic groups are shielded (Haugland et al. 2005; Kim et al. 2007). Intracellular esterases cleave off the ester, and the substrate can then be processed by the enzymes under study.
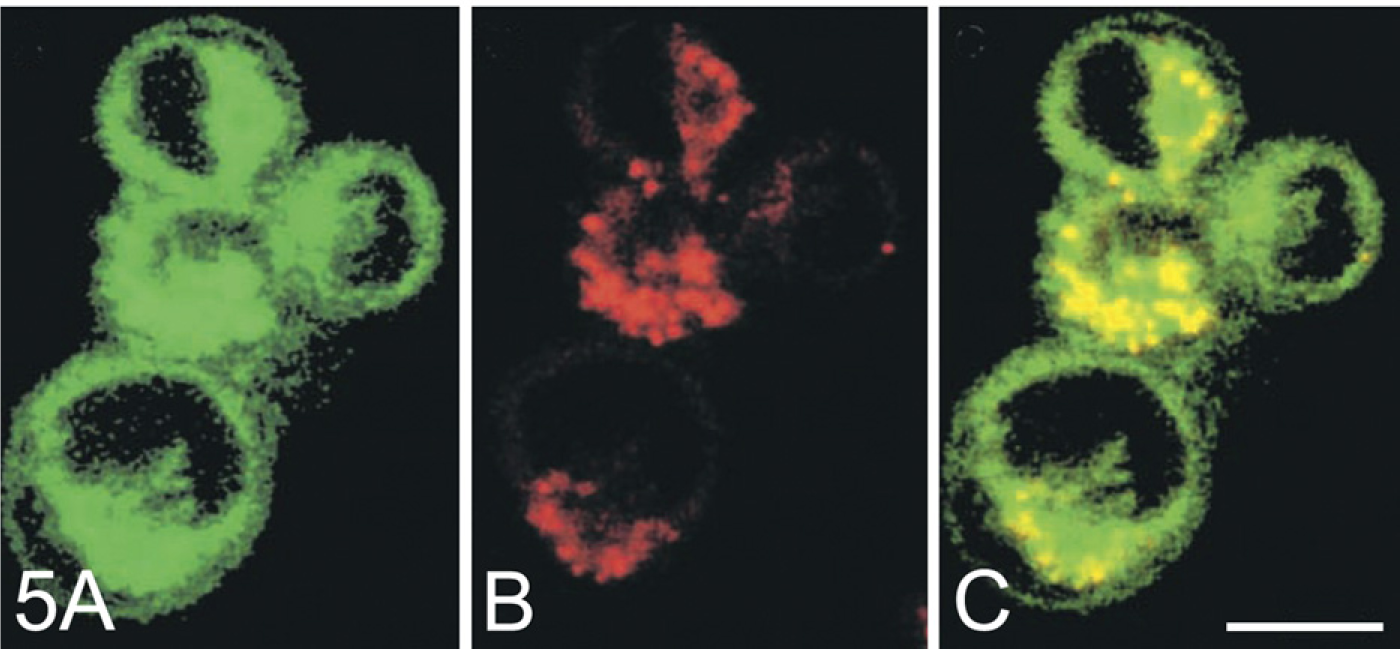
A number of substrates are fluorescent, such as ethoxyresorufin, ELF97-based substrates, cresyl violet–based substrates, fluorescence resonance energy transfer (FRET)-based substrates, and a two-color quenched substrate (see below). When the substrate is converted enzymatically into the product, fluorescence shifts to another wavelength. This enables a simultaneous imaging of local substrate levels and product formation at two different wavelengths (Figure 5) (for protocol, see Boonacker et al. 2003a; Creasy et al. 2007). This is relevant either to checking whether the substrate enters specific cell compartments or to determining the local kinetics of enzyme activity (Van Noorden and Frederiks 1992).
The two-color quenched MMP-7 substrate developed by McIntyre et al. (2004) enables local measurement of substrate and product concentrations as well. One fluorescence moiety of the substrate allows the monitoring of uncleaved substrate and cleaved product and the other allows the selective monitoring of cleaved MMP-7 product.
Metabolic mapping of NADP+-dependent isocitrate dehydrogenase (IDH) activity in time in human brain tumor (glioblastoma multiforme) with
The product of an enzyme should accumulate in the cells that produce it. Many chromogenic enzyme histochemical methods do exactly that, as is shown in Figure 3, because the reaction product is water-insoluble and is precipitated where it is generated. Fluorescent enzyme products often diffuse out of cells. To limit this effect of diffusion as much as possible, imaging should be performed within a short period of time after the reaction has started (Boonacker and Van Noorden 2001).
In Vivo Metabolic Mapping
Non-invasive imaging in live animals in time is the ideal approach to studying biological processes and the effects of therapeutic strategies. A number of noninvasive imaging modalities are available for this purpose, such as bioluminescence imaging (BLI) (Klerk et al. 2007), fluorescence imaging (FLI) (Hoffman 2004; Joyce et al. 2004; Hoffman and Yang 2006), magnetic resonance imaging (MRI) (Mook et al. 2008), computed tomography (Koo et al. 2006), ultrasonography (Snyder et al. 2009), single photon emission computed tomography (Lewis et al. 2002; Sadaghiani et al. 2007), and positron emission tomography (Lyons 2005; Sadaghiani et al. 2007).
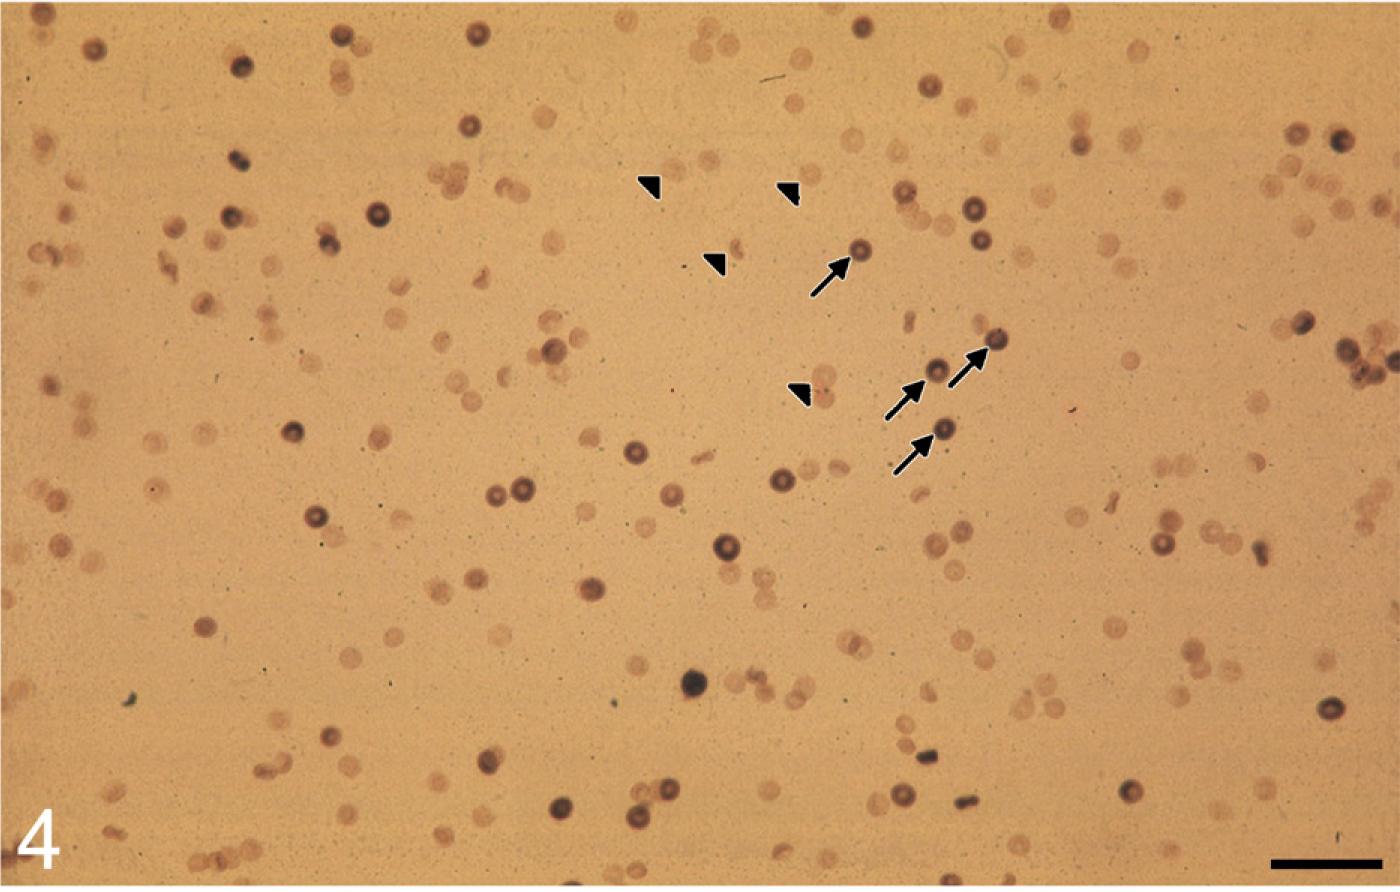
Erythrocytes of a person with heterozygous glucose-6-phosphate dehydrogenase (G6PD) deficiency after metabolic mapping of G6PD activity showing a mixed population of stained G6PD-containing erythrocytes (arrows) and unstained G6PD-deficient erythrocytes (arrowheads) (Peters and Van Noorden 2009). Bar = 50 μm.
Images of fluorescence of [Ala-Pro]2-cresyl violet, substrate of dipeptidyl peptidase IV
Non-invasive FLI of small laboratory animals has progressed rapidly since the introduction of green fluorescent protein (GFP) and its rapidly growing family of fluorescent proteins (Hoffman 2004; Yuste 2005; Hoffman and Yang 2006). This approach initiated non-invasive metabolic mapping (Joyce et al. 2004). Positron emission tomography and single photon emission computed tomography produce images of physiological processes, but most efforts to develop non-invasive metabolic mapping methods to date have been based on FLI. The other methods are morphological methods rather than methods to image processes such as enzyme reactions.
One of the issues of non-invasive FLI that remains to be improved is the quenching of excitation and emission light by the tissues of the animal. At present, an imaging depth up to 800 μm can be achieved despite the use of strongly fluorescent probes at long wavelengths and highly sensitive cameras (Weissleder and Pittet 2008). The use of skin-fold chambers and subcutaneous windows is a compromise that increases the depth of view into the animal considerably (Jain et al. 2002), but maintenance of windows for longer periods of time is difficult and, more importantly, the non-invasive principle is lost. This is also the case with skin flap models (Yang et al. 2002).
Autofluorescence of tissues is another source of interference with non-invasive FLI. Light at wavelengths below 600 nm suffers in particular from quenching by tissues and autofluorescence. Light at wavelengths between 600 and 900 nm is more-optimal for use in live animals, inasmuch as tissues are more-translucent and produce less autofluorescence (Choy et al. 2003; Klerk et al. 2007; Weissleder and Pittet 2008). However, food in the gastrointestinal tract may contain plant products that are fluorescent at longer wavelengths and may thus interfere with the sensitivity of FLI (Troy et al. 2004). Hair interferes strongly with fluorescence imaging, and thus nude mice must be used.
A number of fluorogenic substrates have been developed in recent years for non-invasive FLI. A poly-
Localization of protease activity has been combined with imaging of leukocyte recruitment in the healing myocardial infarct in mice (Nahrendorf et al. 2007). Leukocytes were visualized with magneto-fluorescent nanoparticles. MRI imaging was used to validate FLI. The acquisition time for an image was more or less 5 min per animal. Cathepsin K activity was also visualized in osteoclasts in vivo during bone development in neonatal mice (Kozloff et al. 2009) and in colonic adenomas and carcinomas using a microendoscope (Funovics et al. 2006). Localization of protease activity has been used to visualize arthritic joints in animal models of rheumatoid arthritis (Wunder et al. 2004). An MMP-2- and MMP-9-selective substrate was developed as well (Chen et al. 2005) and was used for the visualization of inflammation in atherosclerosis in mouse aorta in vivo and ex vivo (Deguchi et al. 2006).
Alternative approaches to visualizing the MMP-2-active site in animals have been reviewed by Li and Anderson (2003). MMP-2 inhibitors containing fluorine-18 and iodine-125 and inhibitors radiolabeled with copper radionuclides were visualized with positron emission tomography in mice. The endogenous tissue inhibitor of matrix metalloprotease-2 (TIMP-2) was also labeled with radionuclides to image MMP-active sites in vivo (Giersing et al. 2001).
Activity of the serine protease matriptase was imaged in vivo in a subcutaneous pancreatic carcinoma model in mice using S∗DY-681 substrate (Dyomics; Jena, Germany). The substrate contains a matriptase cleavage site and two quenched DY-681 near infrared fluorophores that become fluorescent after cleavage (excitation, 615–665 nm; emission, 695–770 nm). Activity was visualized after intravenous injection of substrate over time up to 60 min, and controls included treatment of the mice with matriptase inhibitors directly or 24 hr before activity measurement.
Activity-based probes (ABPs) (discussed later) visualize active sites of specific enzymes in a similar way. This type of approach does not show the catalytic activity of an enzyme (product formation) but rather visualizes the number of active sites of an enzyme in an animal.
Recently, multiphoton microscopy was applied to studying excretion of carboxyfluorescein by hepatocytes into bile canaliculi either under cholestatic conditions or not under these conditions (Li et al. 2009). Non-fluorescent carboxyfluorescein diacetate was administered into the circulation of mice as a substrate for esterases. When it is taken up by cells, it is hydrolyzed into fluorescent carboxyfluorescein by intracellular esterases. Hepatocytes excrete it into bile canaliculi, and these were visualized using a hepatic imaging window. Bile canaliculi of control mice, but not of bile duct–ligated mice, became fluorescent within 5 min after administration of carboxyfluorescein diacetate into a jugular vein. The depth of the imaging area was ×30 mm under the liver capsule.
It has to be realized that in all of these non-invasive imaging techniques, motion artifacts caused by respiration and heart beat must be avoided. Triggering the imaging protocol to the breathing of the animal enables the acquisition of well-contrasted and detailed images (Mook et al. 2008). This is particularly the case when imaging takes a relatively long time, as is the case with MRI. Imaging of the head and extremities of mice does not suffer very much from movements due to breathing and heart beat. On the other hand, Breckwoldt et al. (2008) reported visualization of myeloperoxidase activity to track the inflammatory responses to stroke in mice without breath triggering of the imaging. Myeloperoxidase activity was demonstrated because it is a key inflammatory enzyme secreted by activated neutrophils and macrophages/microglia. Myeloperoxidase generates highly reactive oxygen species that can induce polymerization and binding to protein of a gadolinium-containing macromolecule. Gadolinium is an excellent contrast agent for MRI.
Non-invasive BLI is in fact a whole-body metabolic mapping technique as well. Bioluminescence is produced by the ATP-dependent conversion of luciferin by the enzyme luciferase into the light-emitting product oxyluciferin. Cells such as cancer cells can be transfected with the luciferase gene of bacteria, firefly, red and green click beetle, and Renilla (Troy et al. 2004), and administered to animals. When the substrate luciferin is given intraperitoneally, BLI can start. A protocol for valid BLI in mice is given by Kemper et al. (2006). Non-invasive BLI has advantages and disadvantages, compared with non-invasive FLI in small animals (Choy et al. 2003; Troy et al. 2004; Klerk et al. 2007). The most important aspects are: first, luciferase is a reporter enzyme that has nothing to do with the metabolism of small animals other than firefly or click beetle, whereas fluorogenic substrates are converted into fluorescent products by an enzyme or enzymes that are playing a part in the physiology of the animal; second, fluorescence signals are usually brighter than bioluminescence signals, but the very low autoluminescence levels in animals (because excitation is not needed in BLI) provide a superior signal-to-noise ratio in BLI (Choy et al. 2003); and third, because excitation is not necessary in BLI, light has to traverse tissues only once in BLI, whereas in FLI, both excitation light and emitted light have to traverse the tissues and thus suffer twice as much from quenching by tissues. BLI has a broad spectrum with a large component above 600 nm where light absorption is relatively little.
In summary, BLI is a favorable imaging technique in small animals for detecting molecules or cells that are tagged with luciferase (Figure 6), whereas FLI of enzyme activity can be used for true non-invasive metabolic mapping in live animals, in addition to its use in imaging morphological structures with high activity of a specific enzyme (Weissleder et al. 1999; Baruch et al. 2004; Blum 2008; Weissleder and Pittet 2008).
Traditionally, activity of the reporter enzyme β-galactosidase is stained with the chromogenic reaction based on the indigogenic method, which results in an intense blue dye (Lojda et al. 1979). This dye cannot be imaged non-invasively in animals. However, the development of the substrates Gal-2SBPO (Ho et al. 2007) and DDA0Gal (Tung et al. 2004) that are converted by β-galactosidase into products that are both colored and fluorescent in the far-red enables imaging of its activity. The latter substrate fluoresces itself, whereas the product shows a Stokes shift of 50 nm into the red (Tung et al. 2004).
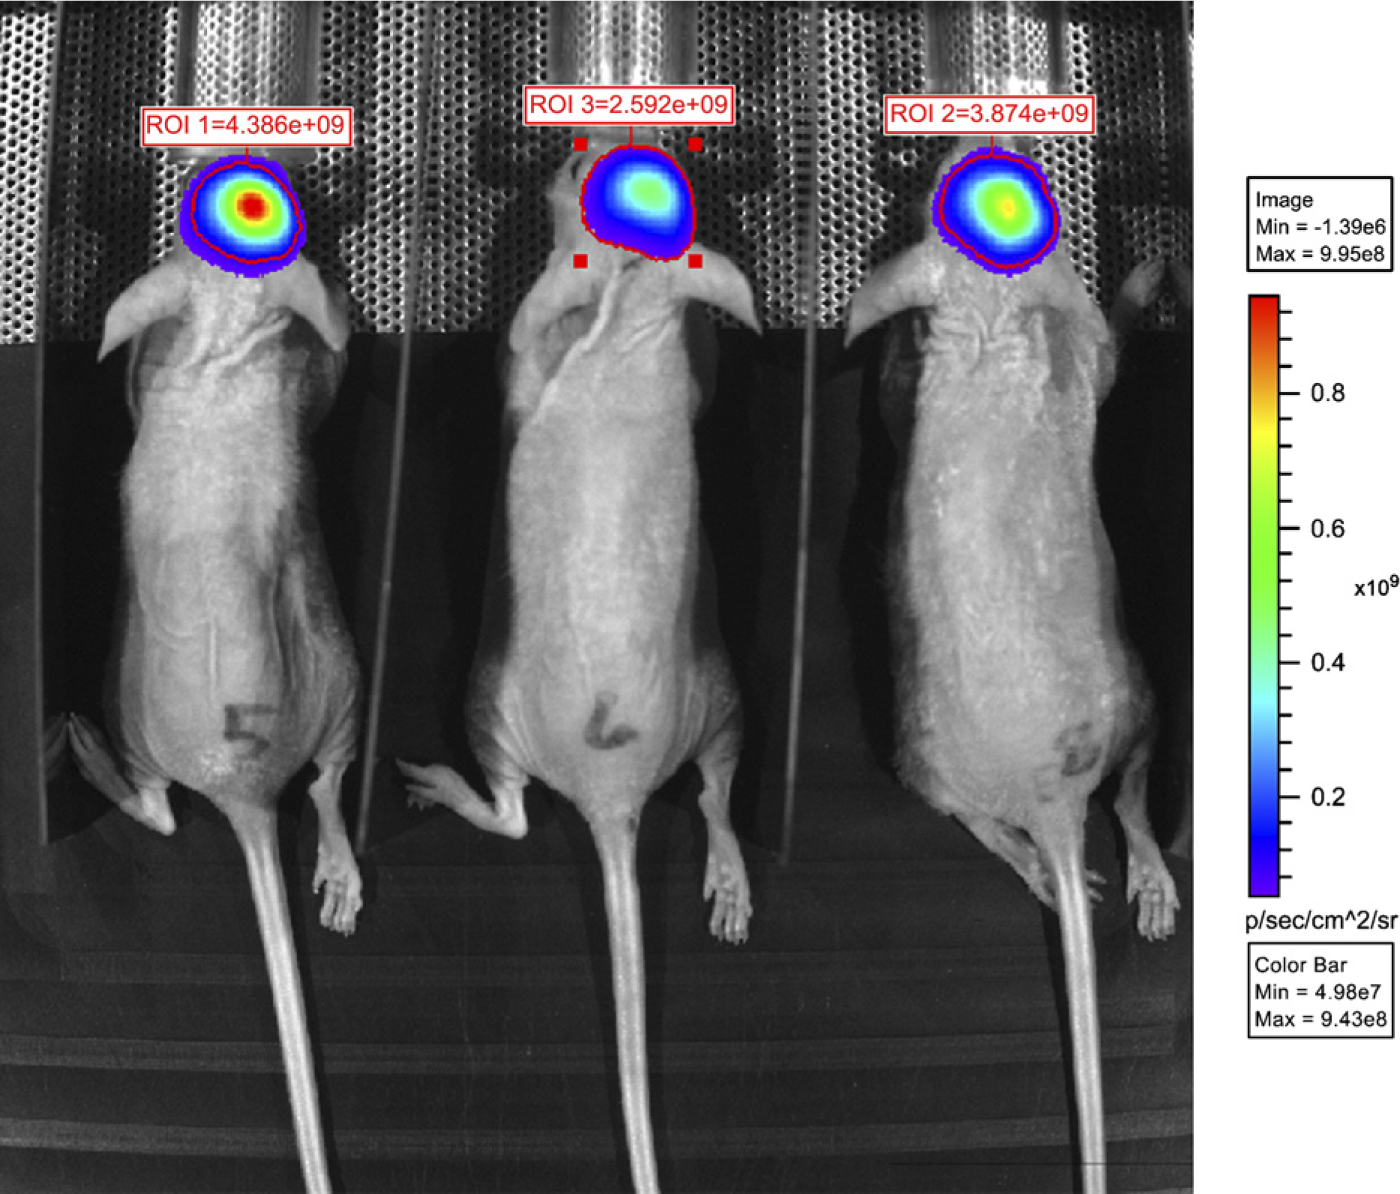
Non-invasive imaging of brain tumors in mice at 2 weeks after stereotactic injection of human glioma cells (U87) into the brain that were transfected with the luciferase gene according to Kemper et al. (2006). Bio-luminescence is shown in pseudocolors in the region of interest (ROI).
Metabolic Mapping in Cryostat Sections and Living Cells
In Situ Zymography
Electrophoretic bands with gelatinolytic activity after gel electrophoresis can be visualized using zymography. The polyacrylamide gel contains gelatin with quenched fluorochromes such as fluorescein (DQ-gelatin). It allows the demonstration of activity of MMP-2 and MMP-9 (formerly called gelatinases) both in proforms and in cleaved active forms. Frederiks, Mook, and colleagues (Mook et al. 2003; Frederiks and Mook 2004) adapted the technique for in situ zymography on unfixed cryostat sections (Figure 2). A thin film of DQ-gelatin covers the cryostat section, and areas of gelatinase activity (MMP-2 and/or MMP-9 activity) are visualized (for staining protocol, see Frederiks and Mook 2004). These authors observed that areas of degradation of DQ-gelatin were the same areas that showed immunocytochemical staining of MMP-2 and collagen type IV in serial sections of colon cancer metastases in rat liver (Mook et al. 2003). This technique was further developed to visualize proteolytic activity against various quenched fluorogenic substrates, such as DQ-collagen type I and IV, in three-dimensional matrices of Matrigel in which cells were incorporated, by Sloane and coworkers (Roshy et al. 2003; Sloane et al. 2005,2006; Cavallo-Medved et al. 2009). Imaging shows intracellular and extracellular proteolysis in relation to endothelial cells during tube formation and angiogenesis or tumor development of cancer cells, either in combination or not in combination with a microenvironment of fibroblasts, leukocytes, and/or endothelial cells (reviewed by Sameni et al. 2009). A protocol for this type of imaging of proteases at work can be found in Jedeszko et al. (2008).
Endogenous Fluorescent Metabolites
A number of cellular metabolites are fluorescent, and can be monitored as probes for cellular processes. Tryptophan (290-nm excitation, 330-nm emission), NAD(P)H (350-nm excitation, 450-nm emission), riboflavin (450-nm excitation, 530-nm emission), and a yet-unidentified molecule (500-nm excitation, 530-nm emission) are the major components of endogenous fluorescence or autofluorescence, of which NADH and riboflavin are the most important compounds (Aubin 1979; Heintzelman et al. 2000). The pioneers of living-cell cytochemistry (Kohen et al. 1974; Thorell 1983; Outlaw et al. 1985) monitored fluorescence of NADH and riboflavin in single cells. Because excitation in the 350–450-nm wavelength range is highly toxic to cells, and because shifts in the emission spectra due to molecular interactions in cells make the analysis difficult, this approach of metabolic mapping in living cells and tissues became obsolete. However, the application of dual-photon excitation of NADH at 730 nm, which reduces cytotoxicity considerably, the determination of the ratio of free and protein (enzyme)-bound NADH using fluorescence lifetime imaging microscopy and anisotropy of autofluorescence, and the application of fast photon detection re-introduced NADH as an attractive probe for spatially resolved imaging of the metabolism of living cells (Ramanujam et al. 1994; Bird et al. 2005; Ramanujan et al. 2008; Yu and Heikal 2009). The focus of these studies is particularly on metabolic mapping of normal and malignant cells and tissues.
NADPH levels have also been mapped recently in living neutrophils (Kindzelskii and Petty 2002; Olsen et al. 2003). NADPH is a substrate of NADPH oxidase involved in the oxidative burst of neutrophils. It was shown that NADPH levels show oscillations and waves throughout neutrophils that are both functionally linked with reactive oxygen species formation. A step-by-step protocol to image NADH and/or NADPH in living cells is not yet available.
Fluorogenic Substrates
The development of fluorogenic substrates and, in particular, protease substrates, is dynamic. In the last decade, many novel substrates have been developed and applied to address biological and pathological issues (Baruch et al. 2004). The fluorogenic substrates based on the fluorochromes 7-amino-4-methylcoumarin, Bodipy FL, Bodipy TR-X, cresyl violet, Cy 5.5, ELF97, fluorescein, rhodamine, MNA in combination with NSA, and resorufin were reviewed in detail in Boonacker and Van Noorden (2001). The methods that have been developed and/or applied in the past decade for live-cell imaging are discussed here.
Ethoxyresorufin. The fluorogenic substrate ethoxyre-sorufin is used to image ethoxyresorufin-O-deethylase activity, which converts it into resorufin and is a biomarker of exposure to pollutants such as planar halo-genated and polycyclic aromatic hydrocarbons. It is a parameter for receptor-mediated induction of cytochrome P450-dependent monooxygenases (Donato et al. 2004). It is accepted as biomarker for pollution of aqueous environments and is applied to intact living isolated hepatocytes of fish (Viarengo et al. 2007). It is usually applied to hepatocytes in microplate wells. Production of resorufin is determined using microspectro-fluorometry. It can also be applied to individual hepatocytes using confocal laser scanning microscopy (for a protocol, see Taira et al. 2007). These authors show that resorufin production is specific. Both ethoxy-resorufin and resorufin are fluorescent but at different wavelengths. The excitation wavelengths for ethoxyre-sorufin and resorufin are 450 nm and 540 nm and emission wavelengths are 560 nm and 610 nm, respectively. Figure 7 shows resorufin produced in an isolated hepatocyte. In addition to its application as biomarker in environmental studies, it can also be applied in toxicological studies (Taira et al. 2007; Barhoumi et al. 2009).
ELF Substrates. Enzyme-labeled fluorescence (ELF) substrates, such as ELF97 phosphate, ELF97 acetate, ELF97 N-acetyl-β-
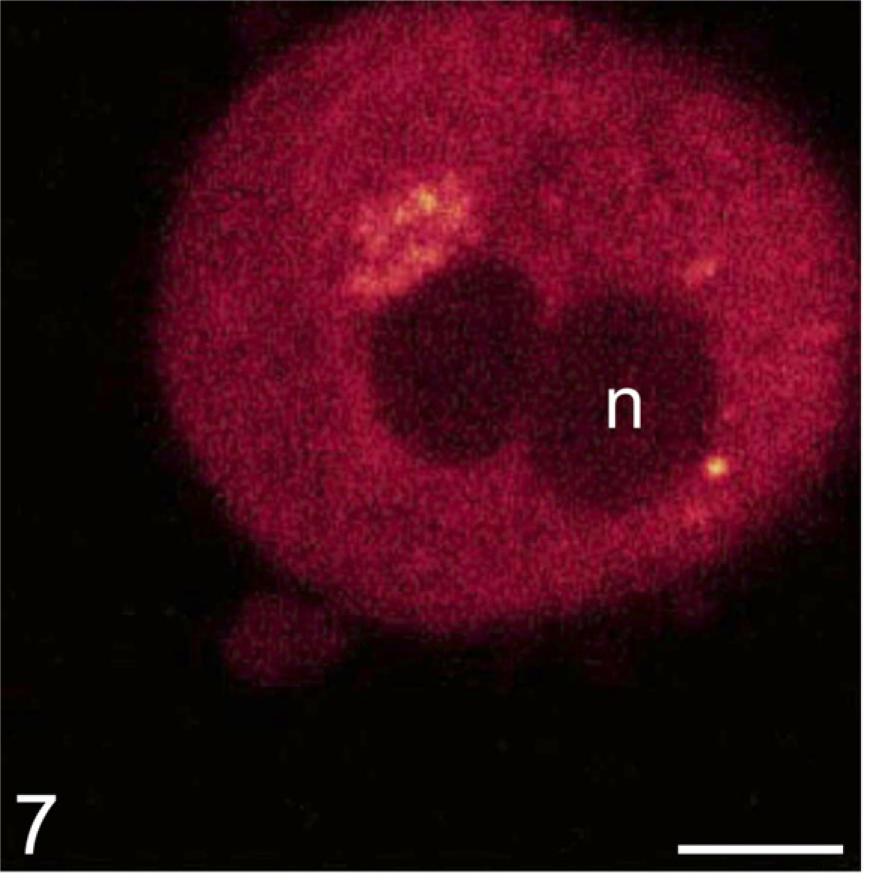
Fluorescent resorufin in a living rat hepatocyte generated by activity of ethoxyresorufin-O-deethylase representing P450-dependent monooxygenases (Taira et al. 2007). Accumulation of resorufin occurs mainly adjacent to the nuclei, suggesting localization in the endoplasmic reticulum. Bar = 10 μm. With permission, Taira et al. Cell Biol Toxicol 23:143–151, 2007.
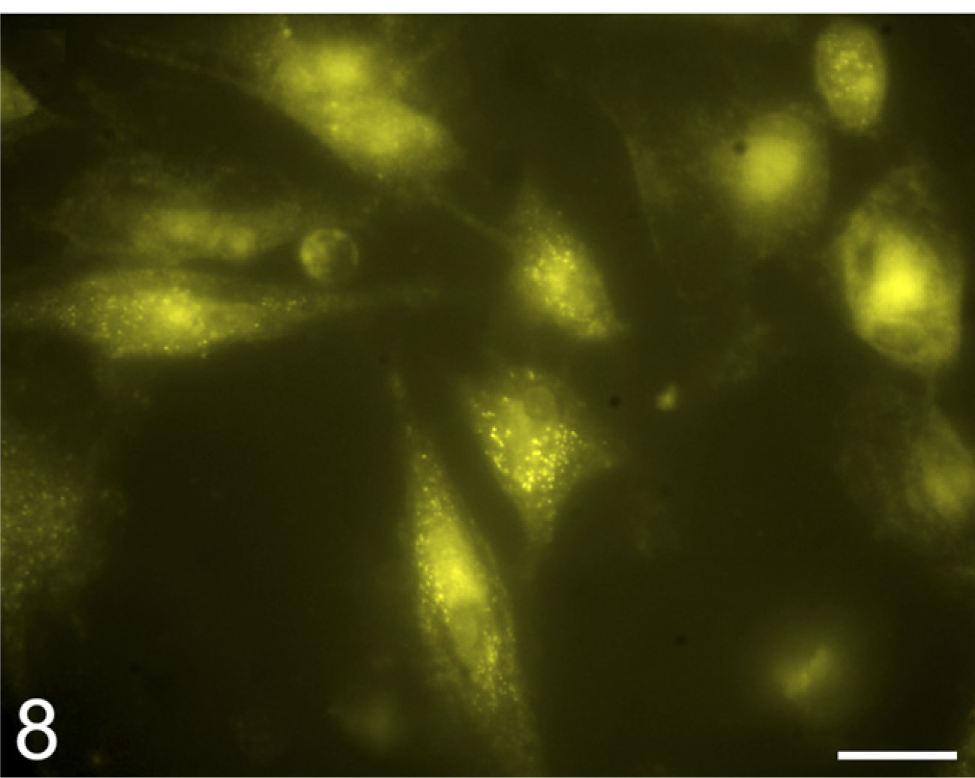
Localization of phosphatase activity using ELF97 phosphate substrate in cultured human fibroblasts. The yellow fluorescent ELF97 product is present in granular intracellular form, probably representing acid phosphatase activity in lysosomes, and diffusely in cytoplasm and nuclei, probably representing unspecified phos-phatases. Bar = 20 μm.
Steroid Substrate. The multifunctional or moonlighting protein, 17β-hydroxysteroid dehydrogenase, converts steroids and is involved in β-oxidation of fatty acids, among other functions. Deficiency of the enzyme leads to loss of mental and motor skills. Reduced activity is found in brains of Parkinson's patients. It binds β-amyloid peptide, the pathological marker of Parkinson's. A fluorogenic steroid substrate was synthesized by Froemming and Sames (2007) that allows metabolic mapping in living cells.
Magic Red Substrates. The cresyl violet–based Magic Red substrates (Immunochemistry Technologies; Bloomington, MN) (Z-Arg)2-cresyl violet and (Z-Arg-Arg)2-cresyl violet for cathepsin B, (Z-Phe-Arg)2-cresyl violet for cathepsin L, (Z-Val-Val-Arg)2-cresyl violet for cathepsin S, (Ala-Pro)2-cresyl violet for dipeptidyl peptidase IV, and (Z-Asp-Gln-Val-Asp)2-cresyl violet for caspase-3 are used for the imaging of their activity in living cells (Lee et al. 2003; Creasy et al. 2007). Uncleaved cresyl violet substrates show an emission peak at 570 nm when excited at 540 nm, and cleaved cresyl violet has an emission peak at 628 nm when excited at 540 nm (Figure 5) (Boonacker et al. 2003a). The activity can be imaged using confocal laser scanning microscopy (Boonacker et al. 2002, 2003a; Premzl et al. 2006) and measured per individual cell using flow cytometry (Creasy et al. 2007). In the latter study, activity of cathepsin B, L, and S was combined with immunofluorescence staining of leukocytes to detect cell lineage–specific activity in heterogeneous cell populations (Creasy et al. 2007).
Cathepsin B activity was visualized at the membrane of metastatic colon cancer cells (Van Noorden et al. 1998) and in endothelial cells during capillary-like tube formation (Premzl et al. 2006). Dipeptidyl peptidase IV activity was visualized at bile canalicular membrane domains of isolated rat hepatocytes and of hepatocytes in self-assembled spheroids. Cresyl violet production was measured flow cytometrically, showing a linear increase of fluorescence over time (Van Noorden et al. 1997b; Abu-Absi et al. 2002). It was also used in Th1 and Th2 cell lines to demonstrate that the multifunctional or moonlighting dipeptidyl peptidase IV (Figure 9) (Boonacker and Van Noorden 2003) has a signal transduction function but not its proteolytic activity to be directly related to its expression level (Boonacker et al. 2002). Proteolytic activity appeared to be regulated posttranslationally. It was also applied to detect natural substrates of dipeptidyl peptidase IV by determining fluorescence (cresyl violet) production in the presence or absence of candidate substrates such as β-casomorphin (Boonacker et al. 2003b). The caspase-3 substrate allows the detection of apoptotic cells (Lee et al. 2003). For a protocol for the use of cresyl violet–based substrates, see Boonacker et al. (2003a).
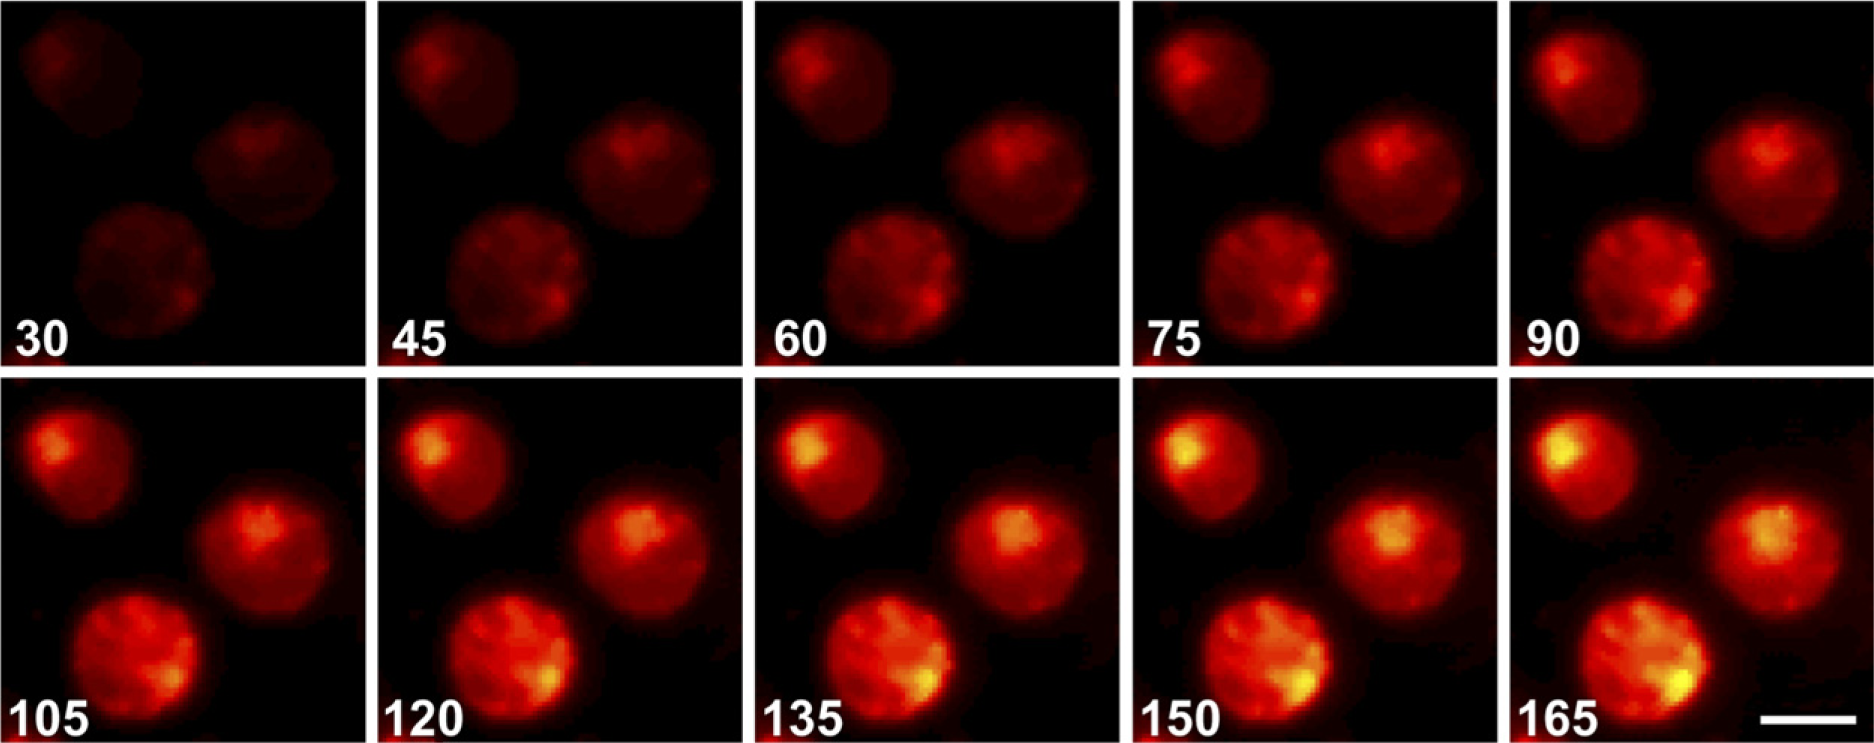
Gallery of confocal images of fluorescence in time of CD26/DPPIV–transfected intact living Jurkat cells using 20 μm (Ala-Pro)2-cresyl violet as substrate to localize DPPIV activity. The gallery consists of images captured every 15 sec from 30 sec up to 165 sec after starting the incubation. Fluorescence of the reaction product, cresyl violet, is represented by pseudocolors, with black representing no fluorescence, yellow strongest fluorescence, and red in-between fluorescence. Bar = 15 μm.
Quenched Substrates. The quenched near-infrared substrates based on Cy 5.5 fluorescence are commercially available as Prosense substrates (VisEn Medical). Fluorescence in the polymer substrate is quenched by the high density and thus close proximity of the fluorophore (Cy 5.5; Blum et al. 2009). When the polymer substrate is cleaved by a protease or peptidase, fluorescence occurs. These substrates are discussed in the section on in vivo metabolic mapping. They are mainly applied to non-invasively detect lesions in animals, such as tumors, inflammation, or atherosclerotic plaques. However, the substrates also have potential for metabolic mapping in living cells and tissues (Weissleder et al. 1999; Tung et al. 2000; Deguchi et al. 2006; Nahrendorf et al. 2007).
Kozloff et al. (2009) have used a polymer-quenched substrate to detect cathepsin K during osteoclast differentiation from macrophages. However, the large molecular size of the polymer substrates (molecular weight >100,000) (Blum et al. 2009) may cause problems with permeation into cells and, in particular, into intracellular compartments other than the endosomal compartments.
The fate of intracellular peptides generated by the proteasome for antigen presentation by major histocompatibility complex (MHC) class I was investigated by Reits and coworkers (Reits et al. 2003,2004; Neijssen et al. 2005; Herberts et al. 2006) using quenched fluorescein-based peptide substrates in living cells. These authors micro-injected quenched fluorogenic substrates into living cells and monitored their half-life as indicated by the increase in fluorescence over time (Figure 10). It was found that many peptides are lost between proteasome and MHC class I presentation due to activity of cytoplasmic peptidases. Most fluorogenic substrates had a surprisingly short half-life of only a few seconds. Peptides appeared to differ in susceptibility to peptidases (Herberts et al. 2006). Furthermore, it was established that tripeptidyl peptidase II handles most proteasome products with both exopeptidase and endopeptidase activity (Reits et al. 2004). Intracellular peptide trafficking via gap junctions was also demonstrated with the fluorogenic peptides (Neijssen et al. 2005), which allowed neighboring cells to present viral peptides to alert the immune system. The quenched fluorescein-based peptides are presently used for the analysis of poly-glutamine–containing peptide metabolism in relation to aggregate formation in living cells as early events in neurodegenerative diseases such as Huntington's disease (Raspe et al. 2009).
ABPs. ABPs are probes that selectively bind covalently to the active site of an enzyme with its so-called warhead. The warhead is linked to a tag that can be fluorescent (Fonović and Bogyo 2009) or, ideally, is fluorogenic and becomes fluorescent upon active site–warhead binding (Ovaa et al. 2003; Blum et al. 2005; Watzke et al. 2008). Active sites of cysteine proteases, threonine proteases, serine proteases, metalloproteases, and the proteasome have been fluorescently labeled in living cells (Blum 2008). The fluorescent ABPs have an important downside, because fluorescence of ABPs bound to the active site of enzymes and that of ABPs free in solution cannot be distinguished (Blum et al. 2005). The approach is erroneously called activity labeling, and the labeling with quenched substrates has even been called real-time imaging of enzyme activity (Blum 2008), which is certainly not the case. It should be clear that the ABP approach visualizes the number of active sites of specific enzymes in cells.
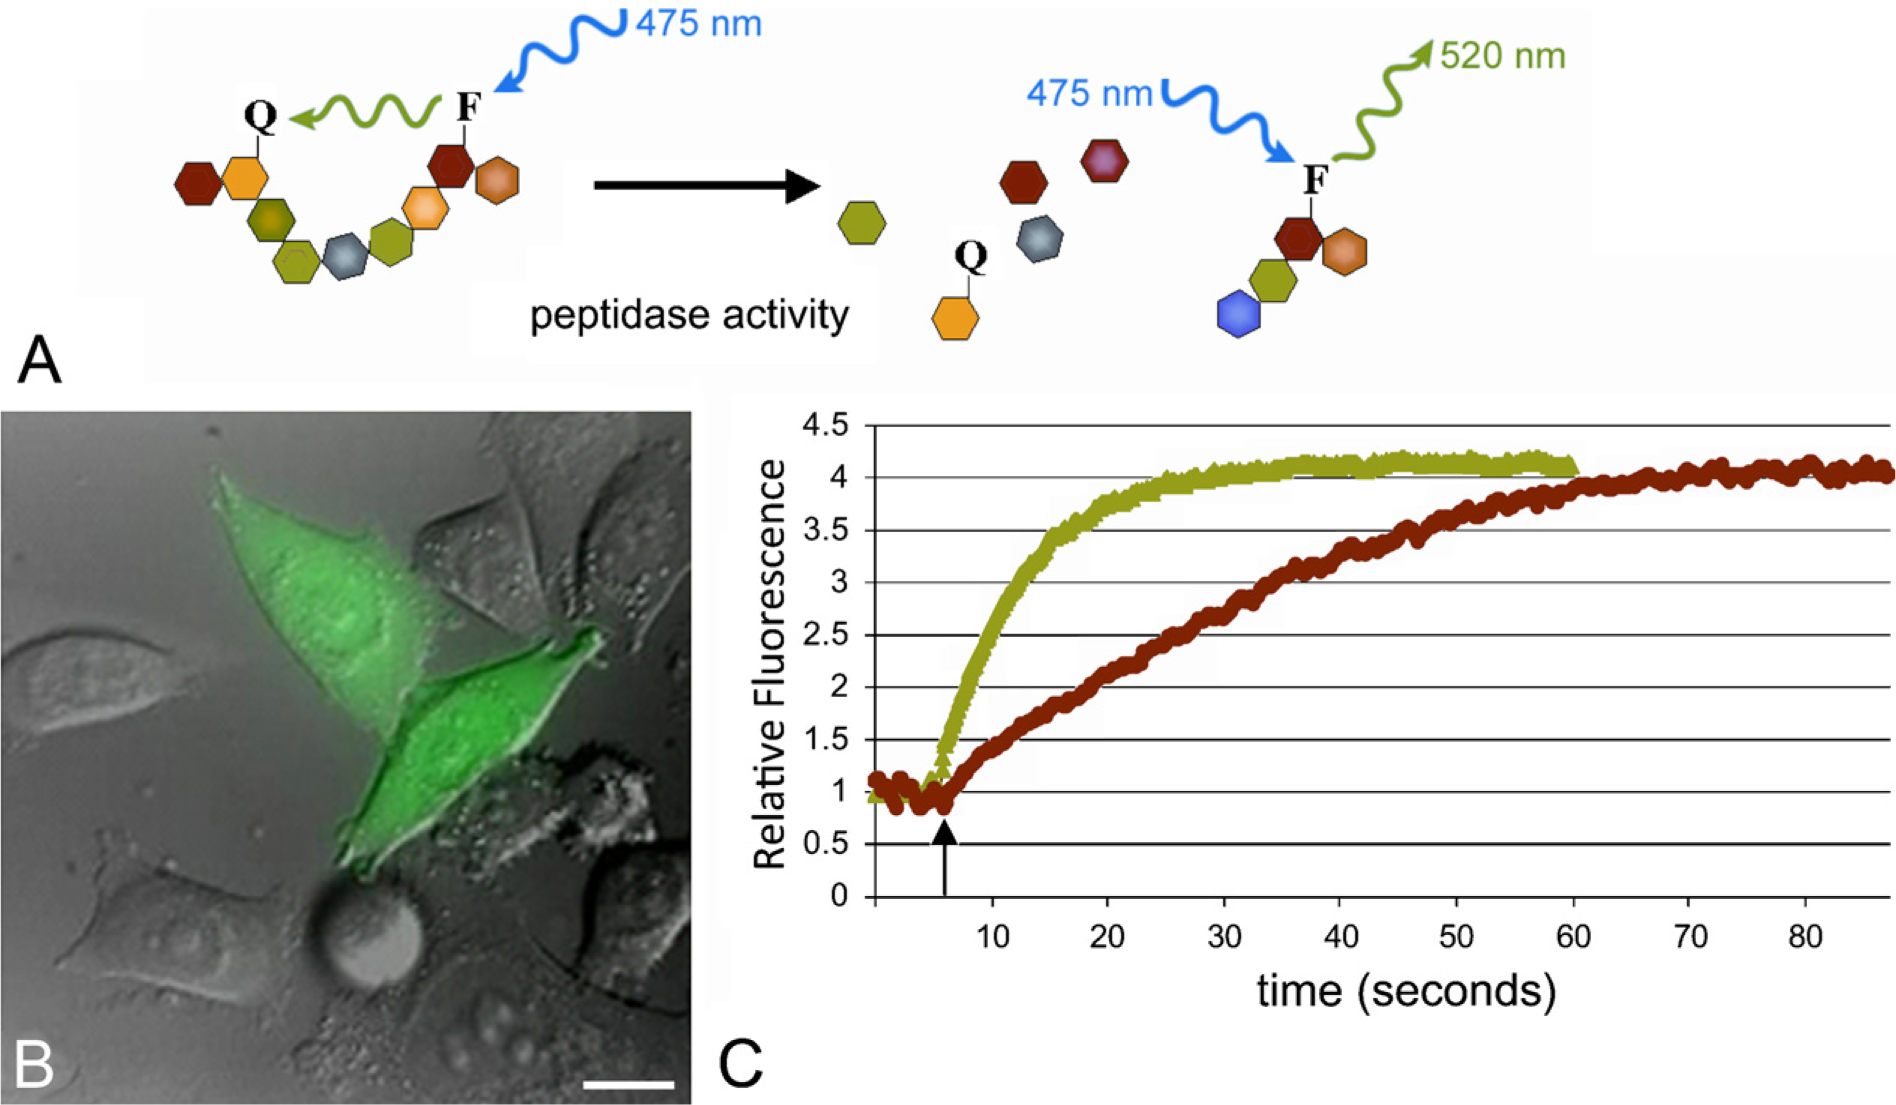
Measuring peptide degradation in living cells. A peptide substrate with a quencher (Q) and a fluorescein (F) group attached to two different amino acids
Active-site targeting with a selective inhibitor of an enzyme as warhead has been performed with fluorochrome-labeled inhibitor of caspases (FLICA) (Bedner et al. 2000). A correlation was found between FLICA fluorescence and the terminal deoxynucleotidyl transferase dUTP nick end labeling (TUNEL) assay for apoptosis in leukemic cells. Fluorescence of active-site–bound FLICA and free FLICA cannot be distinguished. Moreover, detection of apoptotic cells by FLICA is not as straightforward as initially assumed (Pozarowski et al. 2003).
Faust et al. (2008) described the synthesis of a barbiturate-based MMP-2 and MMP-9 inhibitor labeled with Cy 5.5. Active sites of MMP-2 and MMP-9 were imaged in living cells. However, it was not reported by the authors how bound inhibitor was distinguished from unbound inhibitor, inasmuch as binding did not affect fluorescence, and thus both forms have the same optical characteristics. See for protocols Blum et al. (2005,2007).
PhiPhiLux and CaspaLux Substrates. PhiPhiLux and CaspaLux caspase substrates (Oncoimmunin; Gaithersburg, MD) were introduced as cell-permeable fluorogenic caspase substrates containing quenched rhodamine (Komoriya et al. 2000; Telford et al. 2002). Cell permeation by these substrates by diffusion is surprising, because they contain a ring-like peptide of 18 amino acids with caspase cleavage sites and at both ends a rhodamine molecule bound to each other and thus quenched. It is even claimed that the substrates enter organelles of living cells (Telford et al. 2002). Despite these properties, the substrates have not been used very often in recent years to detect caspase activity in living cells except for the detection of apoptosis during epithelial cell shedding at the top of intestinal villi in vivo (Watson et al. 2005).
NucView Substrate. The recently developed DEVD-NucView488 caspase-3 fluorogenic substrate has been claimed to have superior properties for real-time detection of apoptosis in living cells compared with FLICA and PhiPhiLux substrates (Cen et al. 2008). The substrate is highly cell permeable and the product is strongly fluorescent when binding to DNA upon cleavage by caspase-3. Toxicity was not observed, and cells in apoptosis progressed normally in this process. The binding to DNA enables fluorescent imaging of apoptotic morphology. It was found that the percentage of cells that became fluorescent in the presence of DEVD-NucView488 most closely matched the number of apoptotic cells, as determined by annexin-V staining. It seems to be the substrate of choice for imaging apoptosis in real time in living cells.
FRET Substrates. FRET-based substrates are attractive substrates for metabolic mapping in living cells, as outlined in Boonacker and Van Noorden (2001). The levels of the substrate, containing two different adjacent fluorophores that cause FRET, can be determined in cells, as well as the product formation without the FRET phenomenon, enabling the determination of local kinetic parameters of enzymes. The PhiPhiLux caspase substrate has been modified into a FRET-based substrate (Myc et al. 2007).
Kinase activity has been visualized using a FRET-based substrate (Nagai et al. 2000). Two GFP variants flanking the kinase-inducible domain of the transcription factor cAMP-dependent protein kinase A was developed as substrate. Phosphorylation of the substrate reduces FRET between GFPs, enabling imaging activation dynamics in living cells. Because the substrate is expressed by cells by transcription of the transfected gene, there are no cell permeabilization obstacles. Hopefully, similar substrates will be developed for other kinases to allow kinase activity imaging in living cells. Moreover, specific phosphatase activity that dephosphorylates the same proteins can be imaged with the same approach. This approach is very promising for the future, provided that gene constructs are becoming available for proteins that are phosphorylated by specific kinases and dephosphorylated by specific phosphatases. For principles and protocols, see Baruch et al. (2004).
Chromogenic Substrates
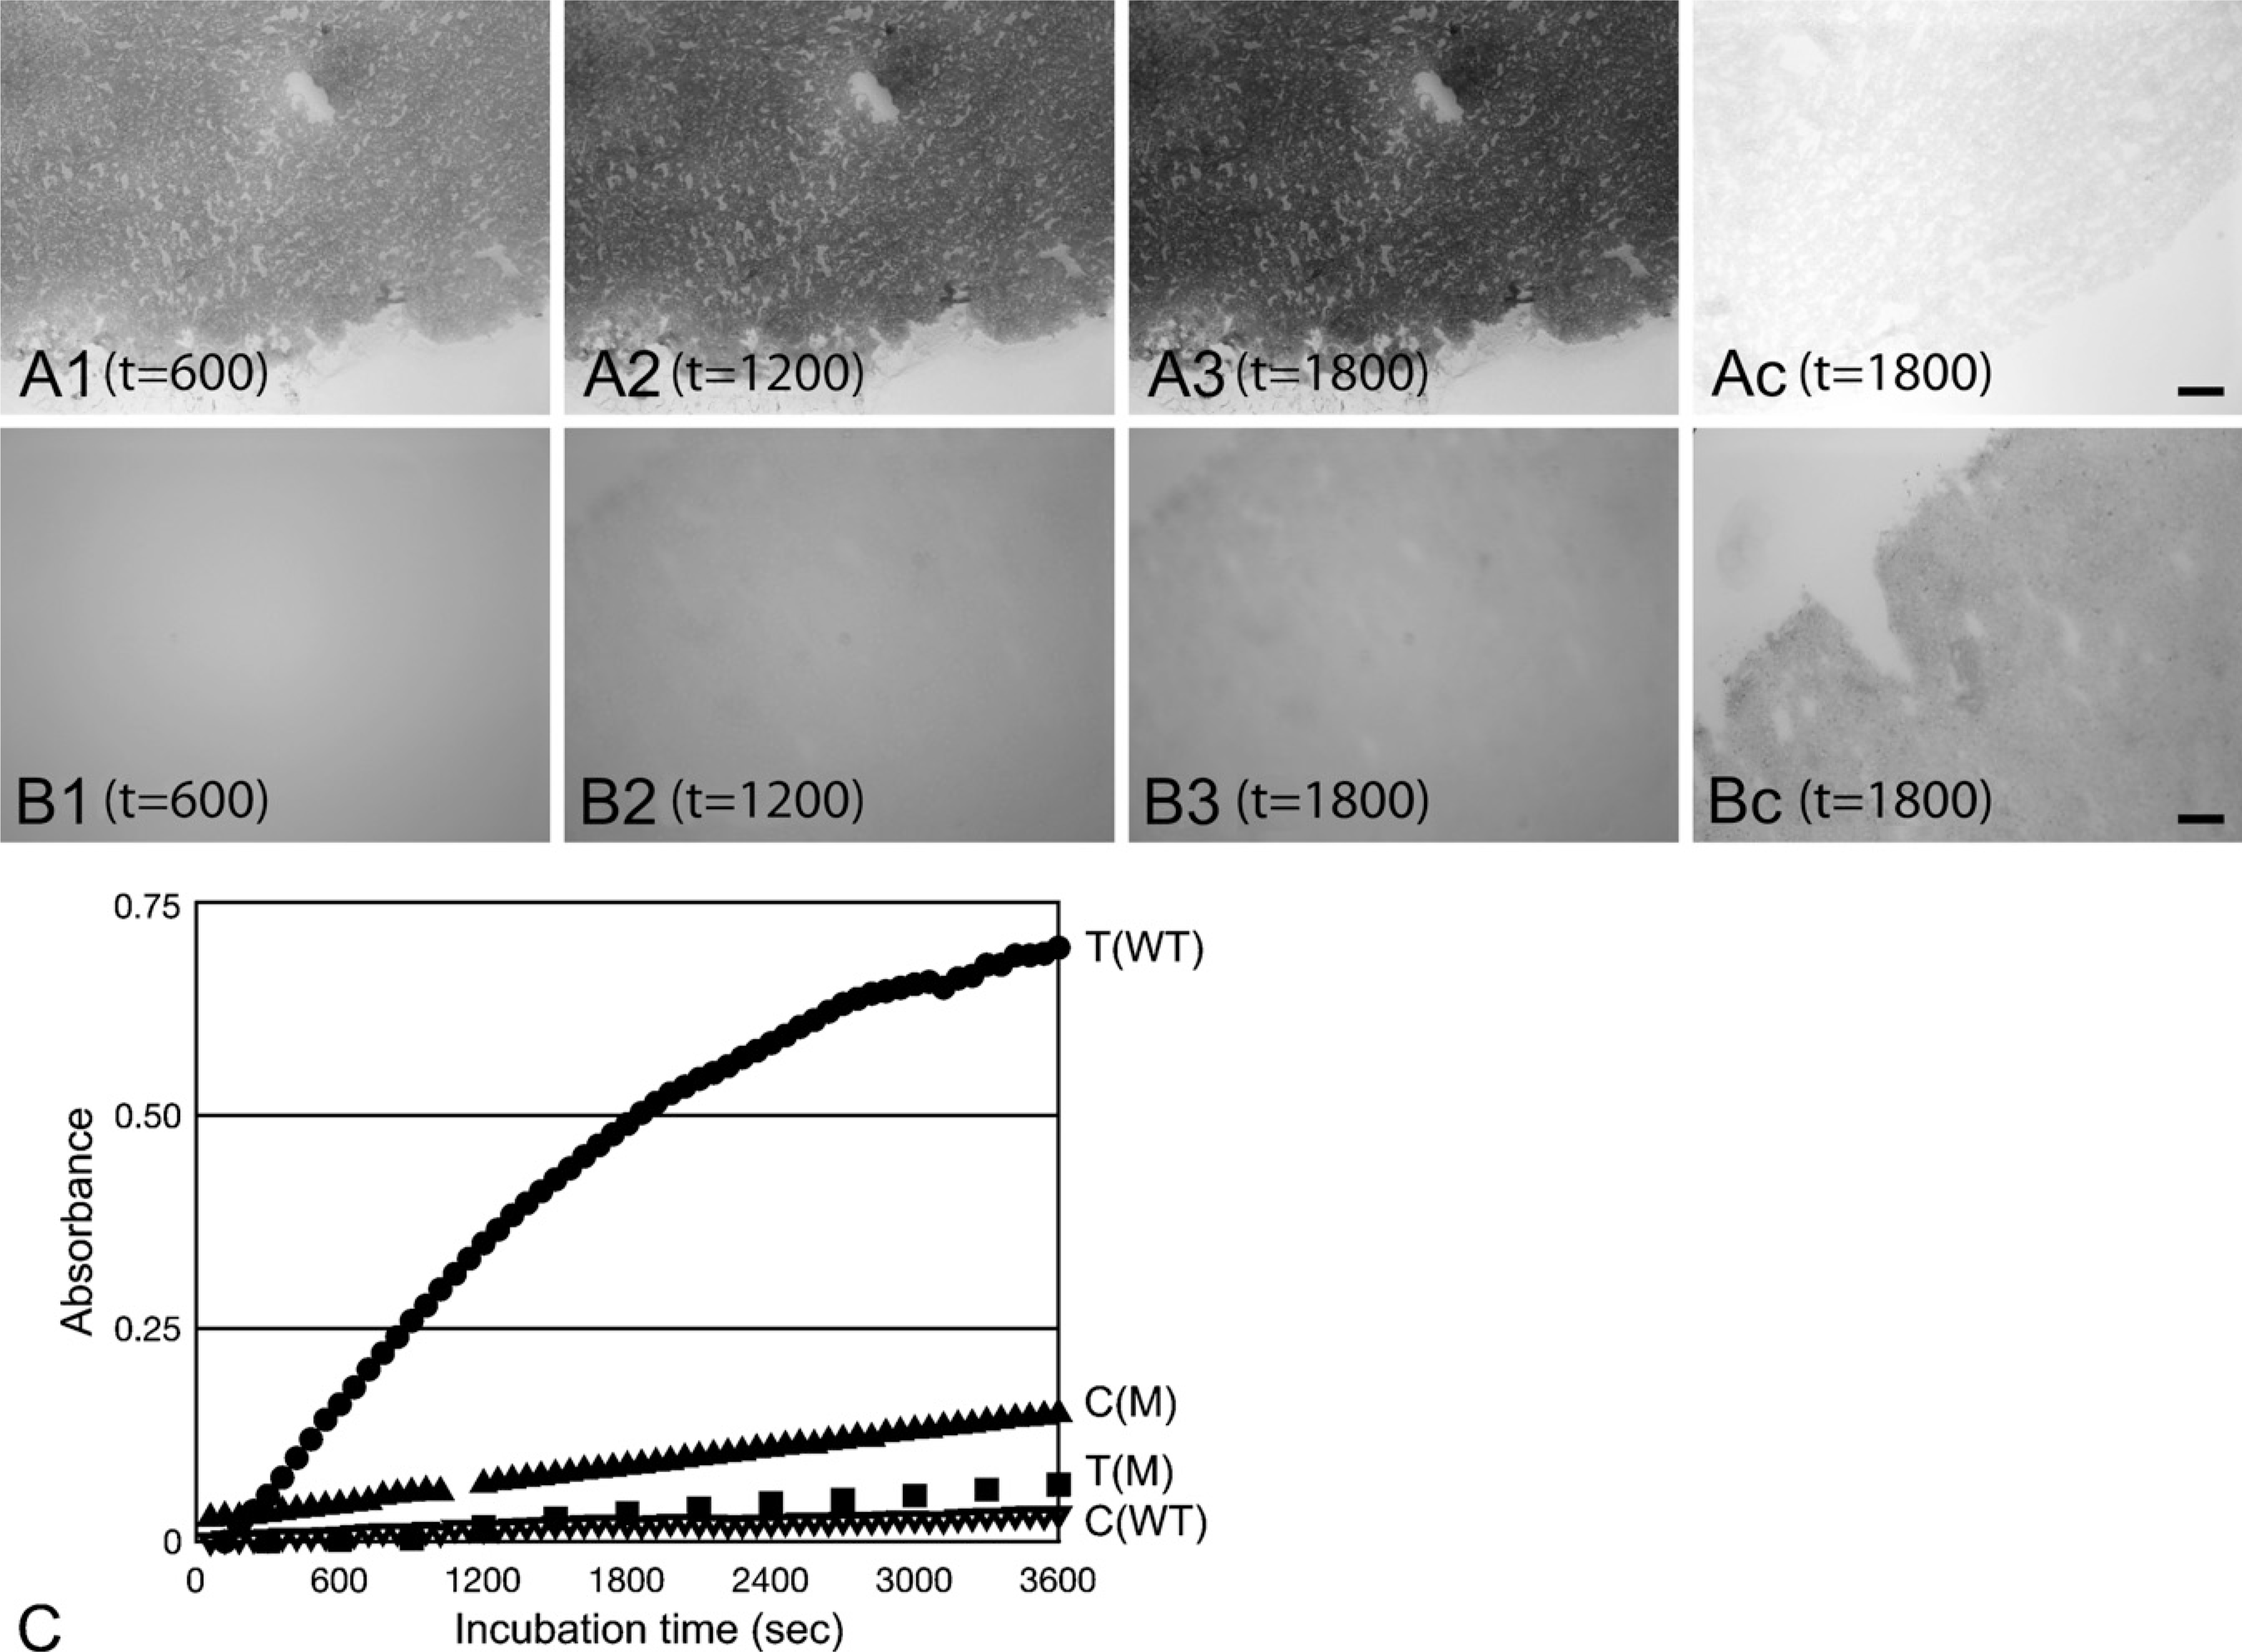
A number of synthetic substrates have recently been developed that are converted into a colored product by enzyme activity. These substrates are often both chromogenic and fluorogenic. As stated above, the advantage of colored reaction products over fluorescent products is the relatively low light dose needed to detect the colored reaction product in cells under the microscope, and thus these methods are less cytotoxic, compared to fluorescence-based methods. On the other hand, fluorescence products allow far better spatial resolution because fluorescence acts as a light bulb in the dark, whereas colored products absorb light (for example, compare Figures 1 and 2 with Figures 4 and 11). On the other hand, colored products can be measured quantitatively using image analysis on a per cell basis when imaging cells or on a per unit volume tissue when imaging tissue cryostat sections (Figure 3) (Chieco et al. 1994,2001). Chromogenic methods for unfixed cryostat sections are not reviewed here because valid specific and quantitative methods to image enzyme activity in unfixed cryostat sections have been reviewed in Lojda et al. (1979), Stoward and Pearse (1991), and Van Noorden and Frederiks (1992,2002), including protocols.
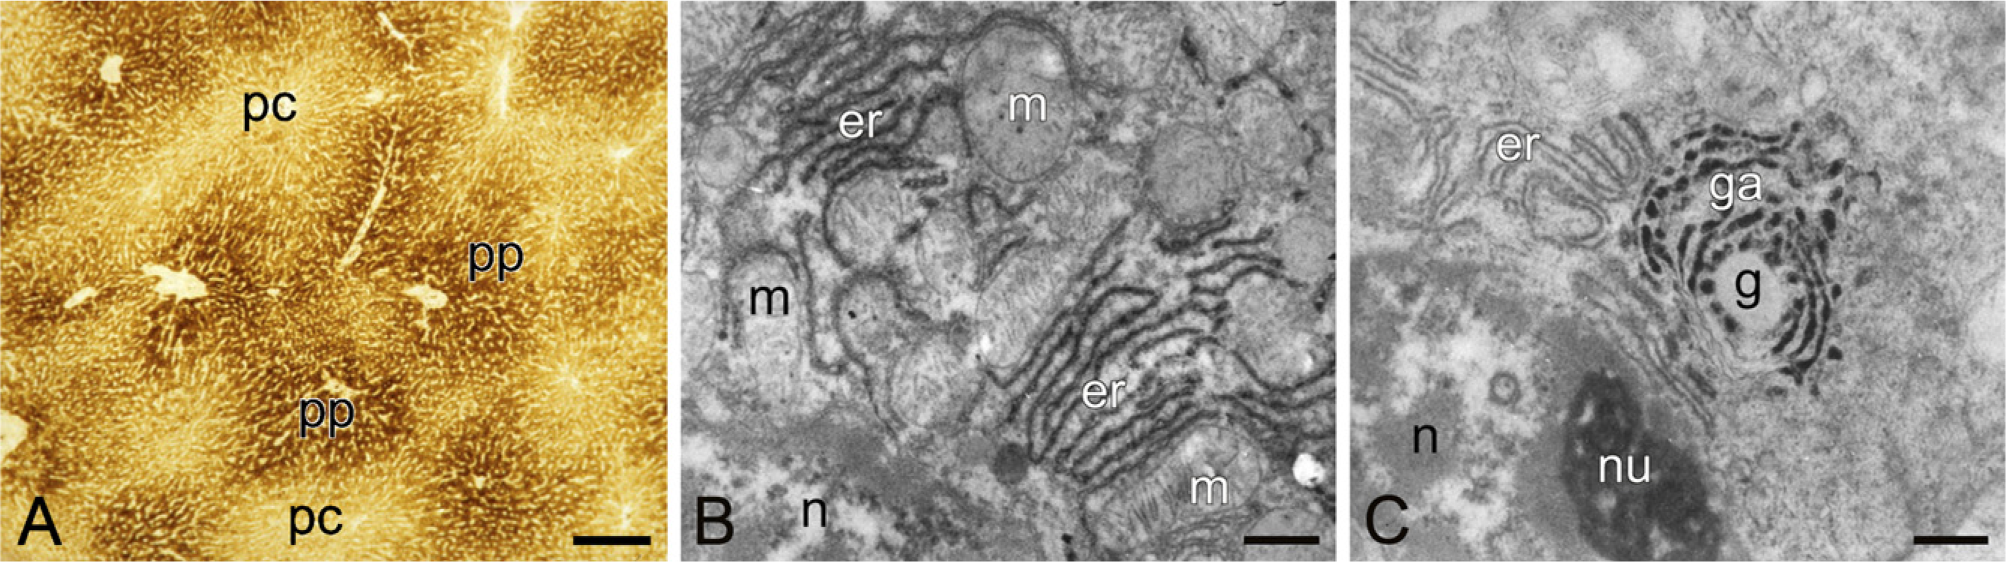
The bottom line of the methods is that the molecular composition of the tissue in the cryostat sections has to remain intact. When cryostat sections are incubated in an aqueous medium, large amounts of macromolecules diffuse out of the sections into the medium, leaving behind a skeletal-like image of the section. Therefore, the sections must be protected, and this is done by adding polyvinyl alcohol to the incubation medium to make it crowded, similar to the cytoplasm in the cryostat sections. In this way, only small molecules diffuse from the incubation medium into the sections and vice versa (Figure 11) (Van Noorden and Vogels 1989; Van Noorden and Frederiks 1992).
Alternatively, a semipermeable membrane is interposed between sections and gelled incubation medium, again keeping macromolecules in place in the sections (Song et al. 1996; Schellens et al. 2003). These protection measures keep both the activity of the enzymes and the morphology of the tissue in the section unaffected, in such a way that even electron microscopy can be performed after incubation (Figure 11). Frozen tissue in general has a morphology that can be used for electron microscopy (Vogels et al. 1993,2009), despite the fact that the general opinion is that this is impossible because of ice crystal formation during freezing. Even cryostat sections after enzyme incubation under tissue-protecting conditions show acceptable morphology. In this way, enzyme activity can be both precisely localized (Figure 11) and measured using image analysis (Figure 3) (Chieco et al. 1994,2001). Kinetic parameters in situ can be determined in this way. These parameters can be significantly different from those in diluted solutions (Van Noorden and Butcher 1991; Van Noorden et al. 1997a; Boonacker et al. 2002).
Winzer et al. (2001) applied the chromogenic tetrazolium salt method to quantify G6PD activity in living hepatocytes isolated from marine flounder, to detect effects of pollution on liver metabolism. This approach allowed them to unravel why female flounder, but not male flounder, develop liver cancer as a biological effect of chemical pollution in coastal and estuarine areas (Koehler and Van Noorden 2003). It was shown that NADPH was the key metabolite, because it is used for detoxification, particularly in livers of these organisms, whereas NADPH is also needed for vitellogenin (egg white) synthesis in the female liver for oocytes. It was concluded that the latter process has a higher priority than the NADPH-requiring detoxification processes because reproductive success is more relevant in evolutionary perspectives than the survival of the individual female.
Glucose-6-phosphatase
G6PD activity is localized with the same methods in human erythrocytes to detect G6PD deficiency, an X-chromosomally transmitted disorder of the erythrocyte that affects 400 million people worldwide. Males are either deficient or not deficient, but females can be heterozygously deficient, which results in a population of erythrocytes that is deficient and a population that is not (Figure 4). Metabolic mapping of G6PD activity is the only way to determine heterozygous deficiency (Peters and Van Noorden 2009). G6PD deficiency is mainly found in areas where malaria is or has been endemic. Malaria is treated with drugs that can cause severe hemolysis in G6PD-deficient individuals. It is recommended that an inexpensive and easy-to-perform test, such as the fluorescence spot test, be used to diagnose men and that metabolic mapping be used to diagnose women. These methods are being applied for diagnosis in various clinics (Gurbuz et al. 2005).
Gal-2SBPO is a novel dual chromogenic and fluorogenic substrate, a substrate for β-galactosidase, resulting in the product 2SBPO that has an absorbance peak at 630 nm and fluoresces at 670 nm. Peptide conjugates of 2SBPO have also been synthesized for metabolic mapping of proteolytic activity such as that of dipeptidyl peptidase IV (Ho et al. 2006,2007).
Another chromogenic and fluorescent substrate of β-galactosidase, DDAOG, is available as well for use in vivo and in living cells. Its product has far-red fluorescence properties. The substrate itself is also fluorescent. The Stokes shift is 50 nm to the red after β-galactosidase cleavage (Tung et al. 2004). The enzyme β-galactosidase is a frequently used reporter gene like luciferase and fluorescent proteins.
Novel Techniques
A number of interesting alternative microscopical approaches are being developed for imaging metabolic processes in live cells and tissues. These are briefly discussed here.
Scanning Electrochemical Microscopy
This technique employs an ultramicroelectrode, also known as a tip, to scan in close proximity of a surface, which can be the surface of an intact cell (Amemiya et al. 2008). Respiration activity of cells can be mapped by profiling levels of oxygen or of a chemical mediator, oxidized menadione, around cells (Yasukawa et al. 1998; Liu et al. 2000; Rotenberg and Mirkin 2004). Cancer cells, with or without metastatic potential, showed patterns different from those of non-malignant cells (Feng et al. 2003; Mauzeroll et al. 2004). ATP-dependent transmembrane pump activity of, for example, glucose and lactate can be profiled as well (Ciobanu et al. 2008). In this case, the ultramicroelectrodes contained immobilized glucose oxidase or lactate oxidase.
Polarization-sensitive Confocal Microscopy
Imaging enzyme activity with polarization-sensitive confocal fluorescence microscopy was developed by Bigelow et al. (2004). High-resolution maps were made of proteolytic cleavage of Bodipy-FL–labeled bovine serum albumin as substrate for trypsin and proteinase K. The principle of imaging is based on fluorescence anisotropy as a measure of the polarization state of fluorescence. The major advantage over quenched fluorogenic substrates is that both substrate and product are fluorescent but only the anisotropy differs. Therefore, local substrate concentrations can be determined in cell compartments as well as product formation.
Conclusions
Enzyme histochemistry is the oldest histochemical technique. Gomori founded enzyme histochemistry in 1939 when he published his method to detect phosphatase activity in cells. Immunohistochemistry and in situ hybridization were only introduced decades later. Despite the fact that giants like Novikoff, Karnovsky, Seligman, Pearse, De Duve, Holt, Chayen, Butcher, Lojda, and Gossrau extended and validated the enzyme histochemical armentarium (Stoward and Pearse 1991), the approach lost its impact in the ‘80s and ‘90s of the last century to immunohistochemistry and in situ hybridization. Genes and gene expression received almost all the attention. Studying enzyme activity was considered old-fashioned until scientists realized that gene expression tells us little about function. In the first decade of this century, enzyme activity localization and imaging had a strong revival because they focus on function. Imaging of living cells, tissues, and animals, in combination with localization of enzyme activity, became a strong match as metabolic mapping. The armentarium for metabolic mapping is expanding rapidly, and the list of enzymes that can be imaged by their activity is becoming longer. The future of metabolic mapping in living cells, tissues, and animals looks bright.
Footnotes
Acknowledgements
The author is very grateful to Trees Pierik for the excellent and careful preparation of the manuscript. The author would also like to thank Dr. Ron A. Hoebe and Elize Ten Hove, Dr. Ard Jonker and Nadia A. Atai, and Dr. Eric A. Reits, Department of Cell Biology and Histology, Academic Medical Center, Amsterdam, for providing Figures 2, 3, and 10, respectively; and Dr. Olaf Van Tellingen, Dutch Cancer Institute, Amsterdam, for providing ![]() .
.