
Abstract
Organotypic spheroids from malignant glioma resemble the biological complexity of the original tumor and are therefore appealing to study anticancer drug responses. Accurate and reproducible quantification of response effect has been lacking to determine drug responses in this three-dimensional tumor model. Lactate dehydrogenase (LDH) activity was demonstrated in cryostat sections of spheroids using the tetrazolium salt method. Calibrated digital image acquisition of the stained cryostat sections enables quantification of LDH activity. Fully automated image cytometry reliably demarcates LDH-active and LDH-inactive tissue areas by thresholding at specific absorbance values. The viability index (VI) was calculated as ratio of LDH-active areas and total spheroid tissue areas. Duplicate staining and processing on the same tissue showed good correlation and therefore reproducibility. Sodium azide incubation of spheroids induced reduction in VI to almost zero. We conclude that quantification of viability in cryostat sections of organotypic multicellular spheroids from malignant glioma can be performed reliably and reproducibly with this approach.
Keywords
M
Screening of cytostatic drugs is commonly carried out with the use of monolayer cell cultures. Apparent advantages of these tumor models are ease of culture and availability of assays that enable quantification of drug response effects. However, new agents with promising effects in these in vitro models repeatedly fail to be efficacious in patients (Wolff et al. 1999). Perhaps the biological behavior of human malignant glioma is not portrayed by monolayer cell cultures, and efforts toward development of a more complex biological model are worthwhile.
The organotypic multicellular spheroid (OMS) model retains the heterogeneity of the original tumor tissue in addition to the presence of extracellular matrix, vascular elements, and cell-cell interactions (Sutherland 1988; Hamilton 1998; Bates et al. 2000; Oudar 2000). A technique to culture OMSs has been specified for human malignant glioma (Bjerkvig et al. 1990). Fragmented surgical specimens are cultured in medium and closely resemble the original malignant glioma tissue histologically and morphologically, including glial fibrillary associated protein (GFAP) positivity, confirming the glial origin (Bjerkvig et al. 1990; Kaaijk et al. 1995). Quantification of drug responses in OMSs has been hampered by the heterogeneous character of the OMSs and their three-dimensional structure. To quantify drug response effects in the OMS model, we first introduce a viability score [the ratio of the lactic dehydrogenase (LDH)-active tissue area and total tissue area] and, second, present an image cytometry process that is automated for high-throughput facilitation. The activity of LDH (EC 1.1.1.27) is histochemically determined by reduction of a tetrazolium salt to its formazan, which delineates viable tissue in cryostat sections of OMSs as shown in the present study. Subsequent image cytometry with calibrated absorbance measurements of formazan production enables calculation of a viability index (VI).
This anaerobic glycolytic enzyme was considered as a viability marker for four reasons: (a) stained LDH-active and LDH-inactive tissue areas contrast sharply, allowing accurate discrimination using image cytometry; (b) established techniques also based on reduction of tetrazolium salt are in use for determination of experimental myocardial and hepatic infarction size (Frederiks et al. 1984,1989) and routine verification of human myocardial infarction at autopsy (Lie et al. 1975; Fishbein et al. 1981); (c) the technique has analogy with established cytotoxicity response assays using the same concept for monolayer cell cultures (LDH release and MTT assays) (Korzeniewski and Callewaert 1983; Decker and Lohmann-Matthes 1988; Legrand et al. 1992; Allen et al. 1994; Sepp et al. 1996; Hand et al. 1998); (d) LDH is abundantly present in human malignant glioma tissue (Egami et al. 1983; Fujii et al. 1984; Marzatico et al. 1986; Subhash et al. 1993; Oudard et al. 1996).
Here we present the reliability and reproducibility of an automated quantification method using LDH activity as a marker for viability in cryostat sections of OMSs.
Materials and Methods
Suppliers of Resources
Dulbecco's modified Eagle's medium was supplied by ICN Biochemicals (Aurora, OH) and normal human serum by BioWhittaker (Walkersville, MD).
Potassium dihydrogen phosphate, disodium hydrogen phosphate, sodium azide, and dimethylformamide were supplied by Merck (Darmstadt, Germany). Polyvinyl alcohol (average molecular weight 70,000-100,000) and nitroblue tetrazolium were supplied by Sigma. Sodium
Organotypic Multicellular Spheroids in Culture
Tumor specimens obtained at surgery from patients with malignant glioma were fragmented with number 10 and number 15 lancets and transferred to 48-well plates containing minimal essential medium as previously described (Bjerkvig et al. 1990), with slight modifications.
Minimal essential medium consists of Dulbecco's modified Eagle's medium with 10% heat-inactivated normal human serum, 2%
Gelatin Embedding and Cryosectioning
After harvesting, OMSs were embedded in plastic containers (20 × 30 mm) containing a liquefied solution of 8% gelatin at 37C in 100 mM phosphate buffer (pH 7.45). Gelatin embedding resulted in a better quality of the sections compared with various other embedding agents tested (data not shown). Multiple OMSs were embedded in one gelatin unit to incorporate OMSs from a 48-well plate all together. The unit was then snap-frozen in liquid nitrogen and stored at −80C until cryostat sectioning. Sectioning was carried out on a Jung Frigocut 2800-E cryostat (Leica Microsystems; Bannock-burn, IL) using disposable knives at a cabinet temperature of −22C to cut sections of 8-μm thickness.
Histochemistry of LDH Activity
Tetrazolium salt methods are established precipitation reactions for the localization of the activity of dehydrogenases. Enzyme-catalyzed oxidation of the substrate lactate by LDH releases protons that are picked up by the co-enzyme NAD. The reduced co-enzyme reduces an electron carrier (mPMS), which transfers the electrons directly to the tetrazolium salt as electron acceptor to generate formazan. Formazan is formed as a dark purple water-insoluble precipitate. LDH is a dehydrogenase whose activity can be determined by this histochemical technique (Van Noorden and Frederiks 1992).
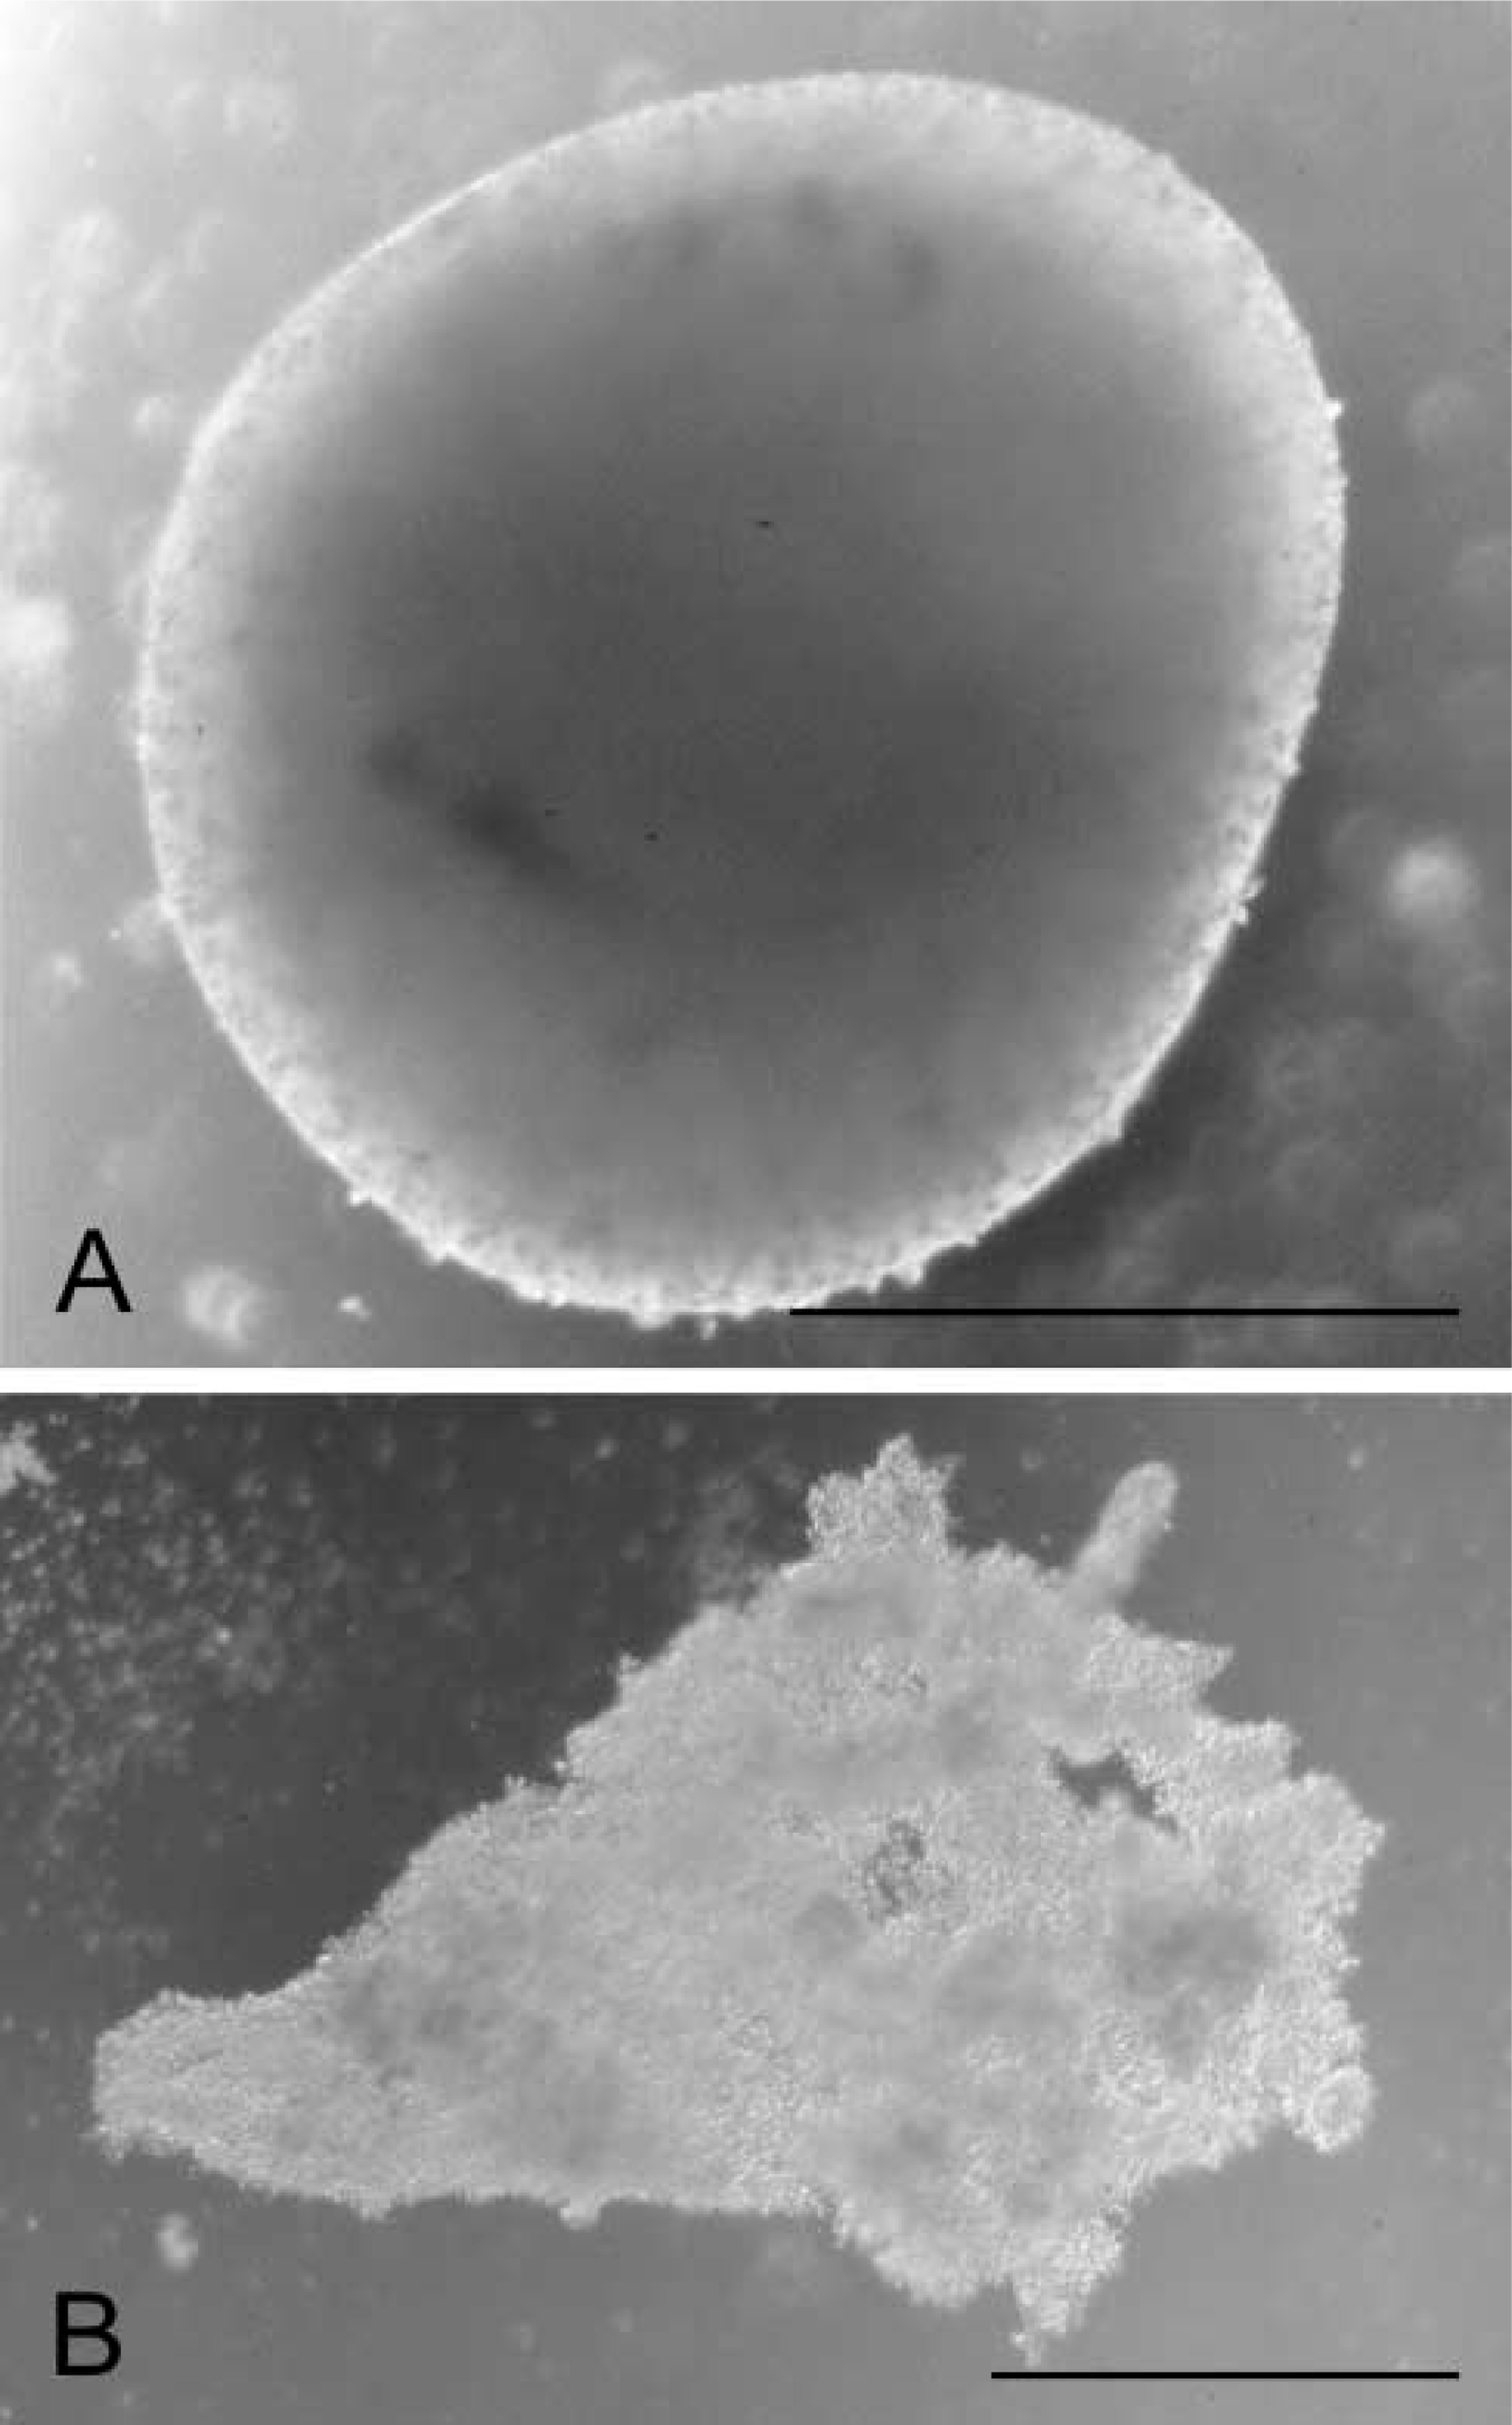
Phase-contrast micrograph of (
The incubation medium consisted of 18% polyvinyl alcohol dissolved in 100 mM phosphate buffer (pH 7.45) containing sodium
Kinetic Measurements of LDH Activity
End point measurements were designed to allow maximal contrast between LDH-active and LDH-inactive tissue compartments. Kinetic measurements of LDH activity were used to determine differences in absorbance values between LDH-active and LDH-inactive tissue compartments over time at RT and 37C [OMS of a 63-year-old man with a GBM with gemistocytary characteristics (A18)]. Control incubations were performed (on serial sections of the same OMSs) omitting the substrate lactate from the incubation medium (Van Noorden and Vogels 1989b).
Digital Image Acquisition
Video microscopy was accomplished with a CCD video camera (high performance CCD, model 4910; Cohu, San Diego, CA) mounted on a light microscope (Vanox AH-2; Olympus, Tokyo, Japan). The image acquisition setup and calibration have previously been described (Jonker et al. 1997). A monochromatic filter of the isobestic wavelength of the half-formazan and formazan (550 nm) was used (Van Noorden and Frederiks 1992). Images of OMS sections after LDH activity staining were acquired with a ×6.3/0.16 microscope magnification objective and frames were grabbed with the CCD video camera in 8-bit images of 786 × 512 pixels. Digital images were calibrated for absorbance measurements with a 10-step absorbance reference strip (Eastman Kodak; Rochester, NY) and pixels were scaled to μm Acquired images were archived and processed on a Macintosh computer (Cupertino, CA) with a customized macro in the public domain software application Object-Image v2.09 (Norbert O.E. Vischer; University of Amsterdam, Faculty of Science, Amsterdam, The Netherlands; available at http:// simon.bio.uva.nl/object-image.html).
Image Cytometry to Determine the Viability Index
Viability of tissue in an OMS section was calculated as ratio of the area (in μm2) expressing an absorbance value compatible with LDH-active tissue and the area (in μm2) expressing an absorbance value compatible with both LDH-active and LDH-inactive tissue. This ratio specifies the VI for a section ‘j’ of an OMS ‘i’:
The VI is a ratio ranging from 0 to 1. A VI of 0.00 represents a minimally viable OMS section, whereas a VI of 1.00 represents a maximally viable OMS section.
Two absorbance thresholds are required to discriminate between absence of tissue, LDH-inactive tissue, and LDH-active tissue. The absorbance thresholds were resolved by correlating contours of LDH-active tissue and LDH-inactive tissue in serial sections of OMSs after conventional HE staining and histochemical localization of LDH activity. Conventional HE staining is generally considered to be the standard for determination of viable tissue in OMS sections. Absorbance thresholds were established on the basis of 40 OMS sections in three separately calibrated acquisition sessions [tumor material from a 47-year-old man with a GBM (A27)]. Average absorbance values (± SD) for the thresholds were determined to be 0.10 (± 0.03) for the value discriminating between absence of tissue and LDH-inactive tissue and 0.40 (± 0.10) for discrimination between LDH-inactive and LDH-active tissue.
Image Procressing Algorithm
OMS sections usually show an outer rim with reduced LDH activity. This phenomenon is considered to be an artifact produced by embedding or cutting. This artifact obviously results in an underestimation of the VI. To exclude the artifactual rim from calculations of the VI, an image processing algorithm was implemented.
The concept of the image processing algorithm is based on the construction of a new OMS section contour to which VI calculations are limited. The new contour is created by shrinking the original OMS section contour to the size of the most frequently occurring distance between the original OMS section rim and LDH-active tissue.
The elementary processing steps are schematically drawn in Figure 2. An example of the algorithm applied to an OMS section is outlined in Figure 3.
To demonstrate the impact of this rim exclusion algorithm on the total tissue area measurement, an algorithm impact (AI) on total tissue area was calculated for each OMS section (n=4136) of 64 OMS
The original total tissue area is the sum of LDH-active and LDH-inactive tissue areas before application of the rim exclusion algorithm, and the new total tissue area is the area remaining after application of the rim exclusion algorithm.
Reliability of the Histochemical VI Analysis
The reliability of demonstration of viability by LDH activity in serial cryostat sections of OMSs was verified in relation to conventional assessment of viable vs nonviable tissue on HE-stained cryostat sections. These were compared with the outlines as determined by the automated cytometry contours after histochemical visualization of LDH activity.
Reproducibility of the VI
For any histochemical technique with application of automated cytometry analysis, perception of its reproducibility is required. Several sources of variation need to be considered, such as cryostat settings, preparation of chemicals, incubation medium, incubation period, image acquisition settings, and cytometric analysis. To test the robustness of all sources of variation after sectioning, the incubation to localize LDH activity, image acquisition and cytometric analysis were repeated on two separate samples of serial OMS sections for 32 OMSs from one tumor [from a 37-year-old woman with a GBM with a significant sarcomatous component (A15)]. Each sample consisted of an average of 5.5 (SD 1.5) sections per OMS. The VI for an OMS ‘i’ was calculated from K sections as:
The correlation between the two sets of 32 VI estimates was analyzed with a scatter diagram and the Pearson's correlation coefficient.
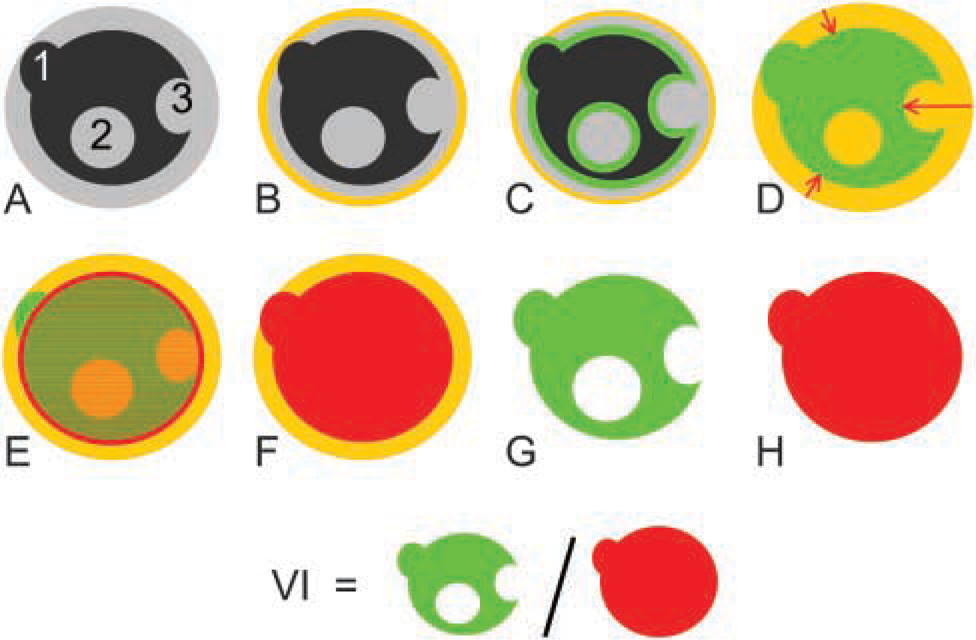
Schematic illustration of the fully automated image processing algorithm to determine the viability index (VI) in organotypic multicellular glioma spheroids (OMS) on the basis of LDH activity. (
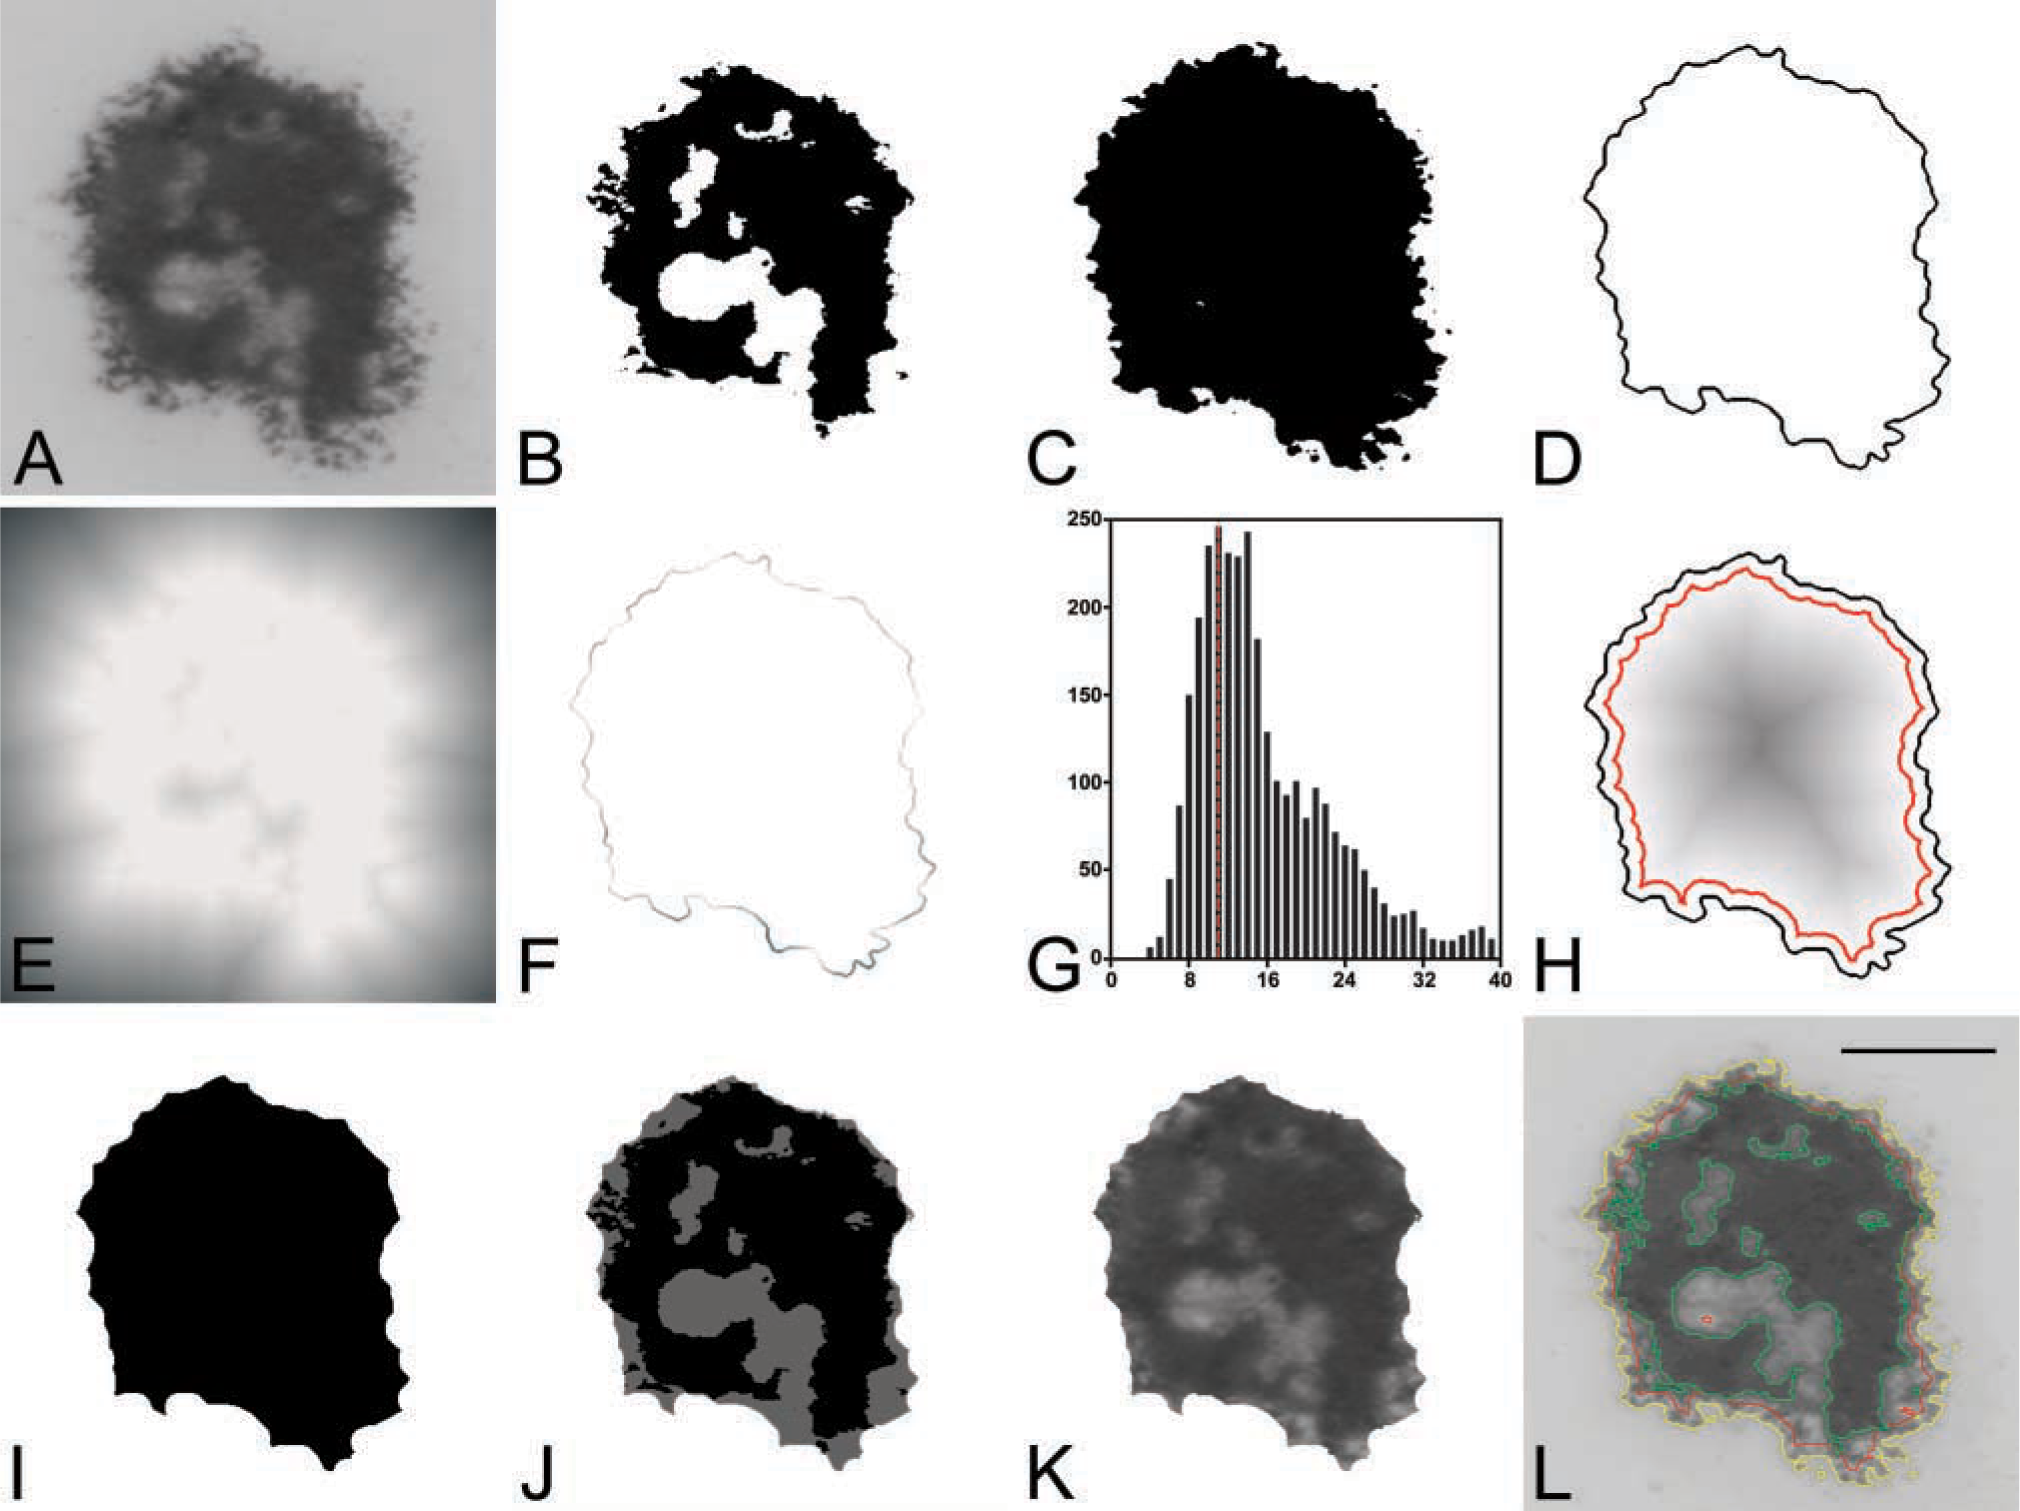
Rim exclusion algorithm to determine the viability index (VI) in glioma OMSs on the basis of LDH activity. (
Detection of Viability Reduction by the VI
The VI for OMSs is expected to detect treatment response in terms of reduction in viability. Therefore, an unequivocal viability-reducing stimulus should induce a substantial reduction in the VI. Sodium azide inhibits the oxidative phosphorylation in mitochondria (Smith et al. 1991; Smith and Wilcox 1994; Chang and Lamm 2003). This metabolic uncoupling results in acute cytotoxicity to both normal and malignant cells and provides a means to test the detection of viability reduction. For this experiment, 64 OMSs were produced from two tumors [from a 47-year-old man with a GBM (A27) and a 74-year-old woman with a GBM (A26)]. These OMSs were used as untreated controls and the VIs were determined according to eq. 3. These measurements were compared with the VIs of 8 OMSs produced from another tumor [from a 41-year-old man with an AA dedifferentiated from low-grade astrocytoma (WHO grade 2) who had received temozolomide before surgery (A30)]. OMSs were incubated in the presence of 10 mM sodium azide in culture medium for 1 week before snap-freezing and analysis.
Because of the non-normal distribution, a Kruskal-Wallis test was performed to test differences of the three VI group means.
Results
Kinetic Measurements of LDH Activity
Reaction curves describing formazan precipitation due to LDH activity in LDH-active tissue increase nonlinearly in time (Figure 4A) as described previously (Van Noorden and Vogels 1989a). The LDH-inactive tissue reaction curve is linear with time. On the basis of these kinetic measurements, we concluded that the maximal contrast between LDH-active and LDH-inactive tissue was obtained after 30 min of incubation at RT. Although the contrast may have increased further beyond 30 min, this incubation period was applied for end-point measurements to refrain from absorbance values above 0.8 to avoid the out-of-range error (Van Noorden and Butcher 1986). Reaction curves at 37C (data not shown) showed a rapid increase in absorbance over time, which we considered to be disadvantageous because incubation intervals that are too short may introduce a source of variation from timing error. Control reactions in the absence of lactate, i.e., the “nothing dehydrogenase” reaction (Van Noorden et al. 1985; Frederiks et al. 1989), showed a complete lack of formazan formation, indicating that endogenous substrate levels were very low. Some nonspecific formazan formation was observed in media containing lactate and NAD, and this was subtracted from all test reactions (Figure 4B).
Reliability of the Histochemical VI Analysis
The comparison between tissue appearance using conventional HE-stained sections of OMSs, OMS sections stained for LDH activity, and digital images with contours for LDH-active and LDH-inactive tissue areas provided by automated image cytometry is illustrated in Figure 5. OMSs shown are either predominantly LDH-active (Figures 5A-5C) or harbor complex alternations of LDH-active and LDH-inactive tissue areas (Figures 5D-5I), or are predominantly LDH-inactive (Figures 5J-5L). Although the tissue was sectioned in a cryostat, the morphology of the tissue sections is sufficiently maintained and major cutting artifacts can usually be avoided. When the HE-stained sections are compared with the LDH activity-stained sections, it is evident that LDH-active and LDH-inactive tissue areas contrast sharply after LDH activity staining. Viable and nonviable tissue areas in HE-stained OMS sections appeared difficult to determine on the basis of morphological aspects, such as the center of the OMS section in Figure 5A (located with ∗). This area shows marked LDH activity, which unambiguously ascertains viability of this tissue area (Figure 5B). Comparison of the LDH activity-stained sections with the digital images indicated that the reliability of the contour finding cytometry is manifest. Even complex contours of the LDH-inactive tissue areas in Figures 5E and 5H are detected correctly. The value of the rim exclusion algorithm can be appreciated from the way the LDH-inactive tissue area bordering the artifactual rim is handled in Figure 5K. The red line in Figure 5L outlines the OMS section contour that was used for the VI calculation after application of the rim exclusion algorithm. The large LDH-inactive tissue area is included in the OMS section enclosed by the red line. Furthermore, the mean AI (SD) for the analyzed sections all together was 23% (17%). In addition to this, decreasing VIs of tissue sections in Figures 5C, 5F, 5I, and 5L reflect the decreasing extent of LDH-active tissue areas in the successive OMS sections. Based on these observations, we conclude that, first, localization of LDH activity reliably separates LDH-active and LDH-inactive tissue areas. Second, these areas can be automatically segmented by image cytometry independently of the complexity of the tissue areas. Third, the impact of the rim exclusion algorithm is nontrivial, and fourth, the viability can be adequately quantified using the VI.
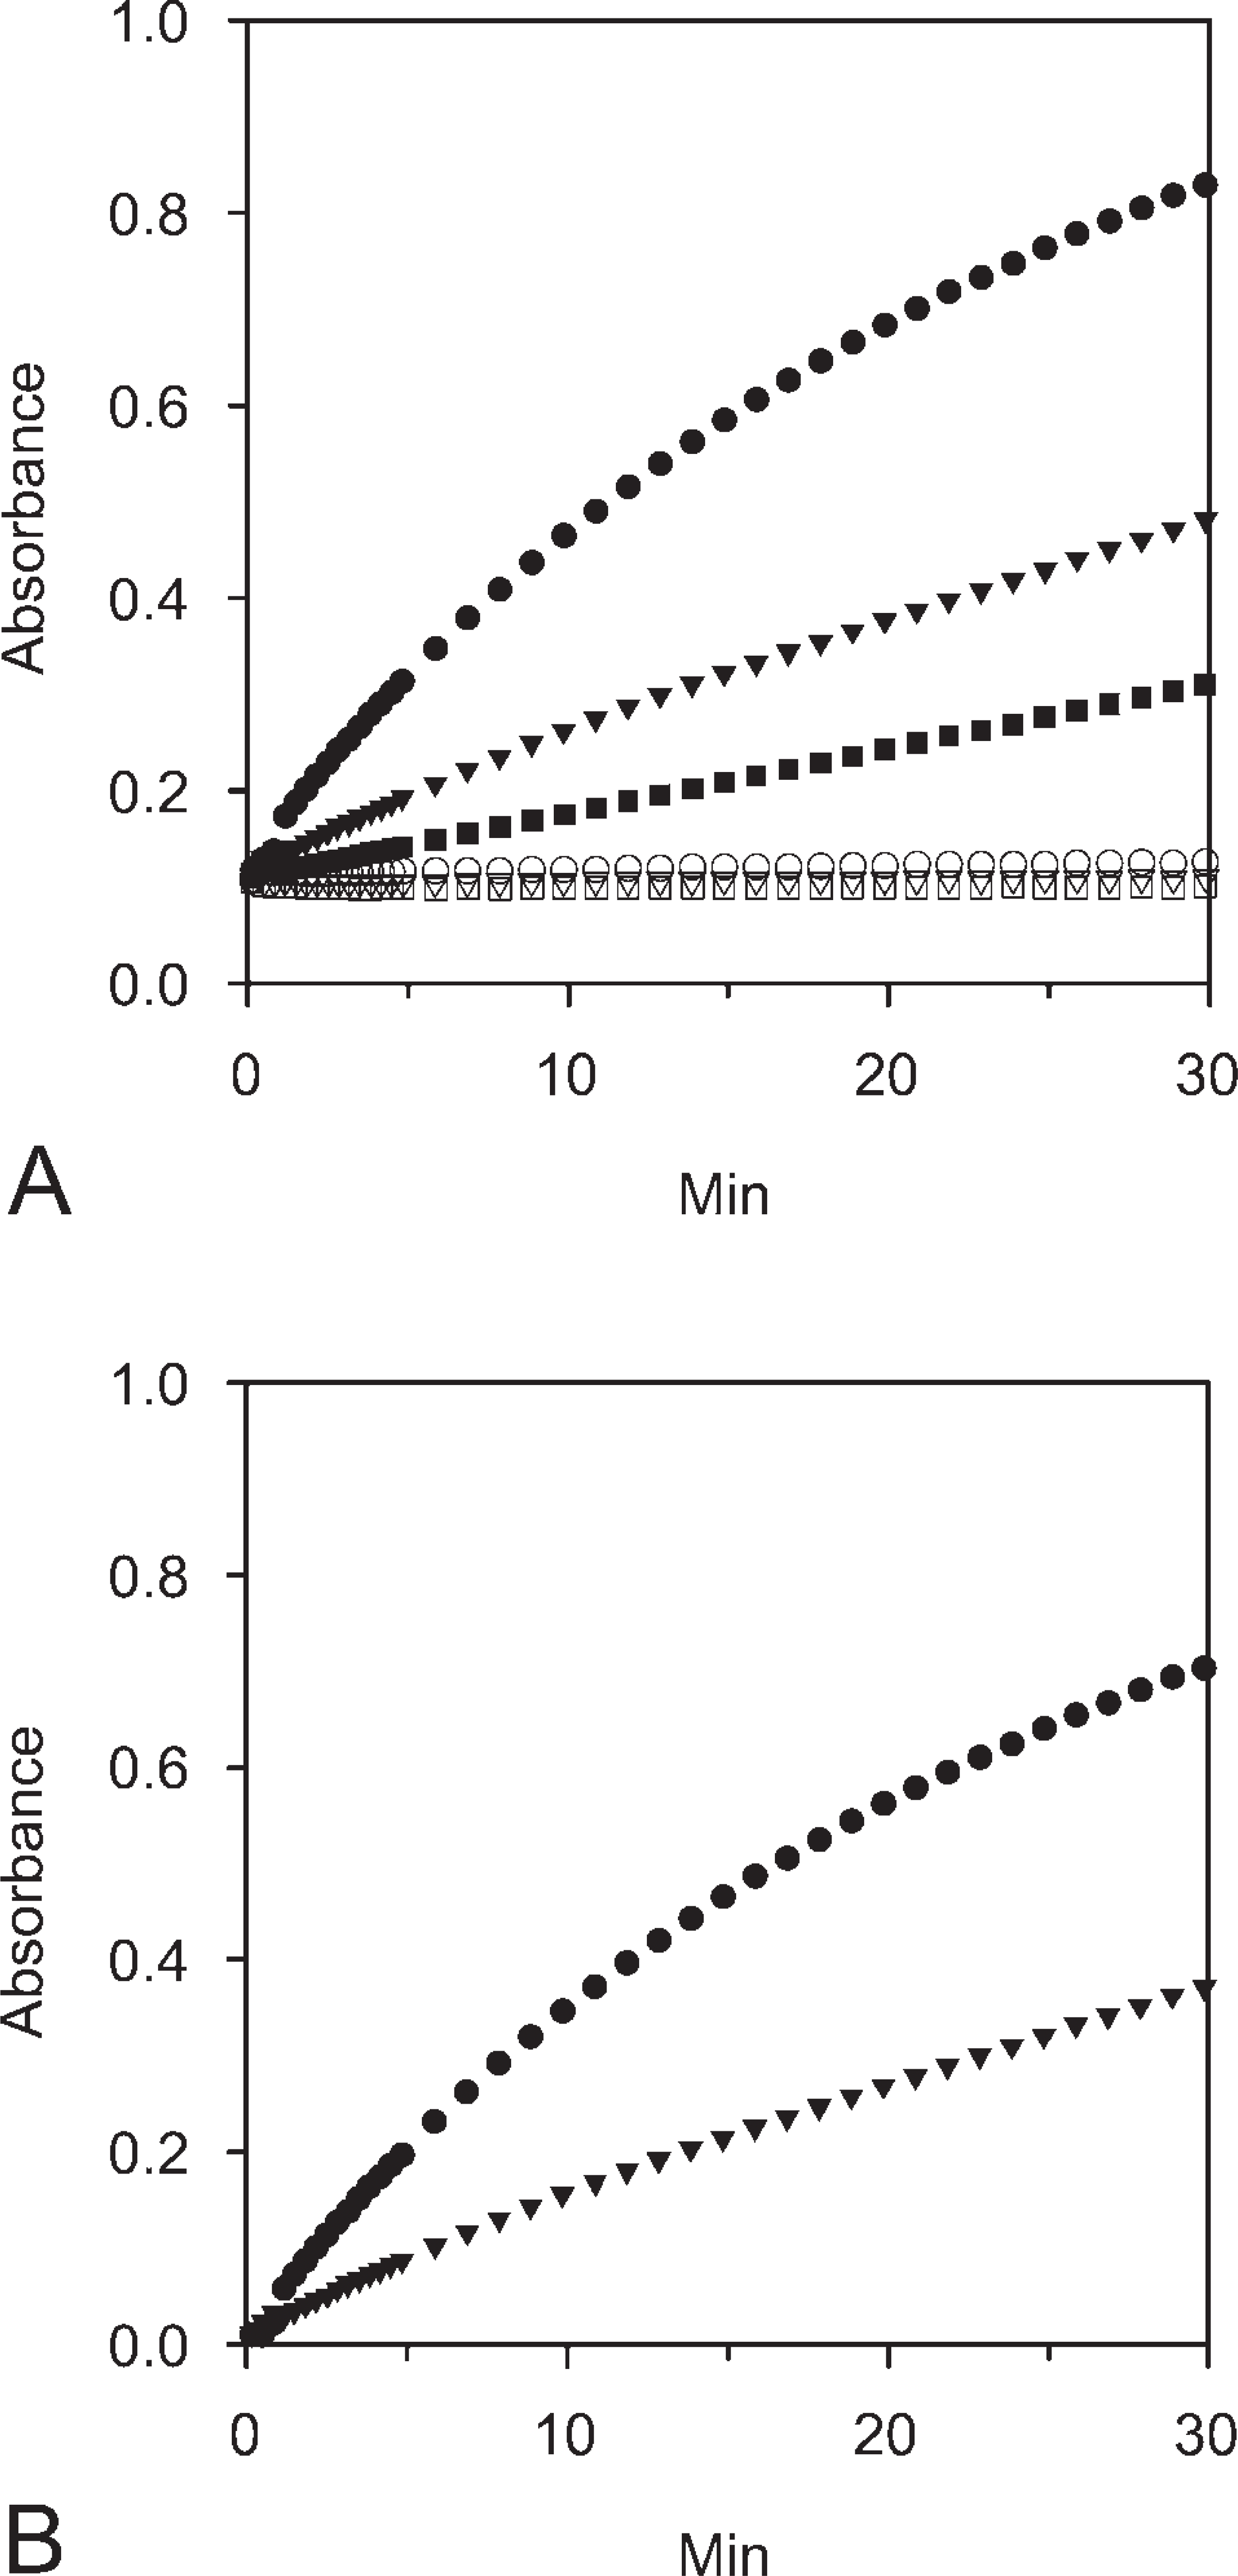
Time-dependent increase in absorbance values of formazan produced by LDH activity at RT in sections of human glioma spheroids. (
Reproducibility of the VI
According to the scatter diagram (Figure 6), the entire procedure of histochemical localization of LDH activity, digital image acquisition and cytometric analysis to determine the VI are reproducible (Pearson's correlation coefficient 0.935; p<0.01).
Detection of Viability Reduction by the VI
The frequency plot of untreated and sodium azidetreated samples is shown in Figure 7. These data highlight the detection of the cytotoxic effects of sodium azide by the VI. In fact, four of eight treated OMSs express a VI less than 0.02.
A number of interesting details arise from this frequency plot. First, the two untreated OMS groups have closely similar average VIs (0.72 vs 0.79) and distributions. Second, some overlap is observed in VI extremes for treated and untreated OMSs. On the one hand, there are respectively two and three OMSs with a VI less than 0.50 in the two untreated samples. Closer inspection indicated that the sections involved were correctly stained and processed to determine VIs. LDH activity levels and morphological aspects after HE staining were in agreement with LDH-inactive tissue with low viability. These specific OMSs harbor reduced levels of LDH activity, presumably due to spontaneous necrosis. On the other hand, a single outlier with a VI of 0.48 was found in the sodium azidetreated OMS group. This outlier contributes considerably to the average VI of 0.09 for sodium azide-treated OMSs. Again, closer inspection of the sections indicated that staining and processing to determine the VI appeared to be correct. Perhaps this OMS was less dependent on oxidative phosphorylation for its metabolic needs by having switched to anaerobic glycolysis and, as a consequence, became less susceptible to the toxic effects of sodium azide.
The Kruskal-Wallis test shows a χ-square of 22.8, d.f. 2, and p<0.001. This high significance is interpreted as strong statistical evidence for unequality of the three means. This effect is attributed to the significantly reduced VI in the sodium azide group. This finding of reduced VI after sodium azide treatment provides proof of principle for the validity of the VI to detect treatment response in OMSs.
Discussion
This report describes the quantification of viability in cryostat sections of organotypic multicellular spheroids (OMSs) from human malignant glioma on the basis of LDH activity using image cytometry.
This focus on the OMS tumor model to study the behavior of human malignant glioma is our answer to the multitude of treatment strategies that arise rapidly and demand a suitable model for screening of their potential. The ideal tumor model for this purpose would be a system that is rapid in providing results in the short term, valid with respect to the original responsiveness of tumors, efficient, and allows analysis of multiple aspects of tumor biology. On the one hand, it is obvious that assessment of the anticancer potential of an unselected panel of promising novel agents in malignant glioma patients, although highly biologically valid, is slow, inefficient, and ethically unacceptable. On the other hand, initial drug screening in malignant glioma research is generally based on observations with monolayer cell line cultures that allow rapid and efficient high-throughput analysis. However, the discrepancy between results obtained in these basic culture systems and human glioma responses is probably due to shortcomings in the validity of representation of human glioma biology by monolayer cell cultures (Wolff et al. 1999). The more complex three-dimensional OMS tumor model may provide a biological system that more closely represents the human glioma responsiveness because of the native presence of extracellular matrix structures, vascular elements, and cell-cell interactions (Sutherland 1988; Kaaijk et al. 1995; Hamilton 1998; Kunz-Schughart et al. 1998; Bates et al. 2000; Mueller-Klieser 2000; Santini et al. 2000).
However, a test to evaluate drug responsiveness is required for the OMS tumor model that under the best circumstances is rapid, accurate in terms of quantifiability, reproducible, based on transparent principles, takes advantage of the spatial information available from the three-dimensional structure, and allows multiple comparative analysis of different aspects of tumor responses in the same tissue material. Other approaches to quantify responsiveness in OMS models are in use, including growth in diameter (Bjerkvig et al. 1990; Jung et al. 1991; Chignola et al. 1994,1995; Weber et al. 1994), cell adhesion and migration assays (Bjerkvig et al. 1997; Narla et al. 1998; Ohnishi et al. 1998; Mahesparan et al. 1999; Santini et al. 2000; de Ridder et al. 2000), chemical dissociation to provide cell suspensions that are amenable to conventional monoclonal cell culture cytotoxicity assays (Freyer and Sutherland 1980; Freyer and Schor 1989), confocal laser scanning microscopy after fluorescence probing (Wartenberg and Acker 1995; Wartenberg et al. 1998; Walenta et al. 2000), and immunohistochemical detection of proliferation and apoptosis markers (Kaaijk et al. 1996,1997; Kolchinsky and Roninson 1997; Wharton et al. 2000; Bell et al. 2001).
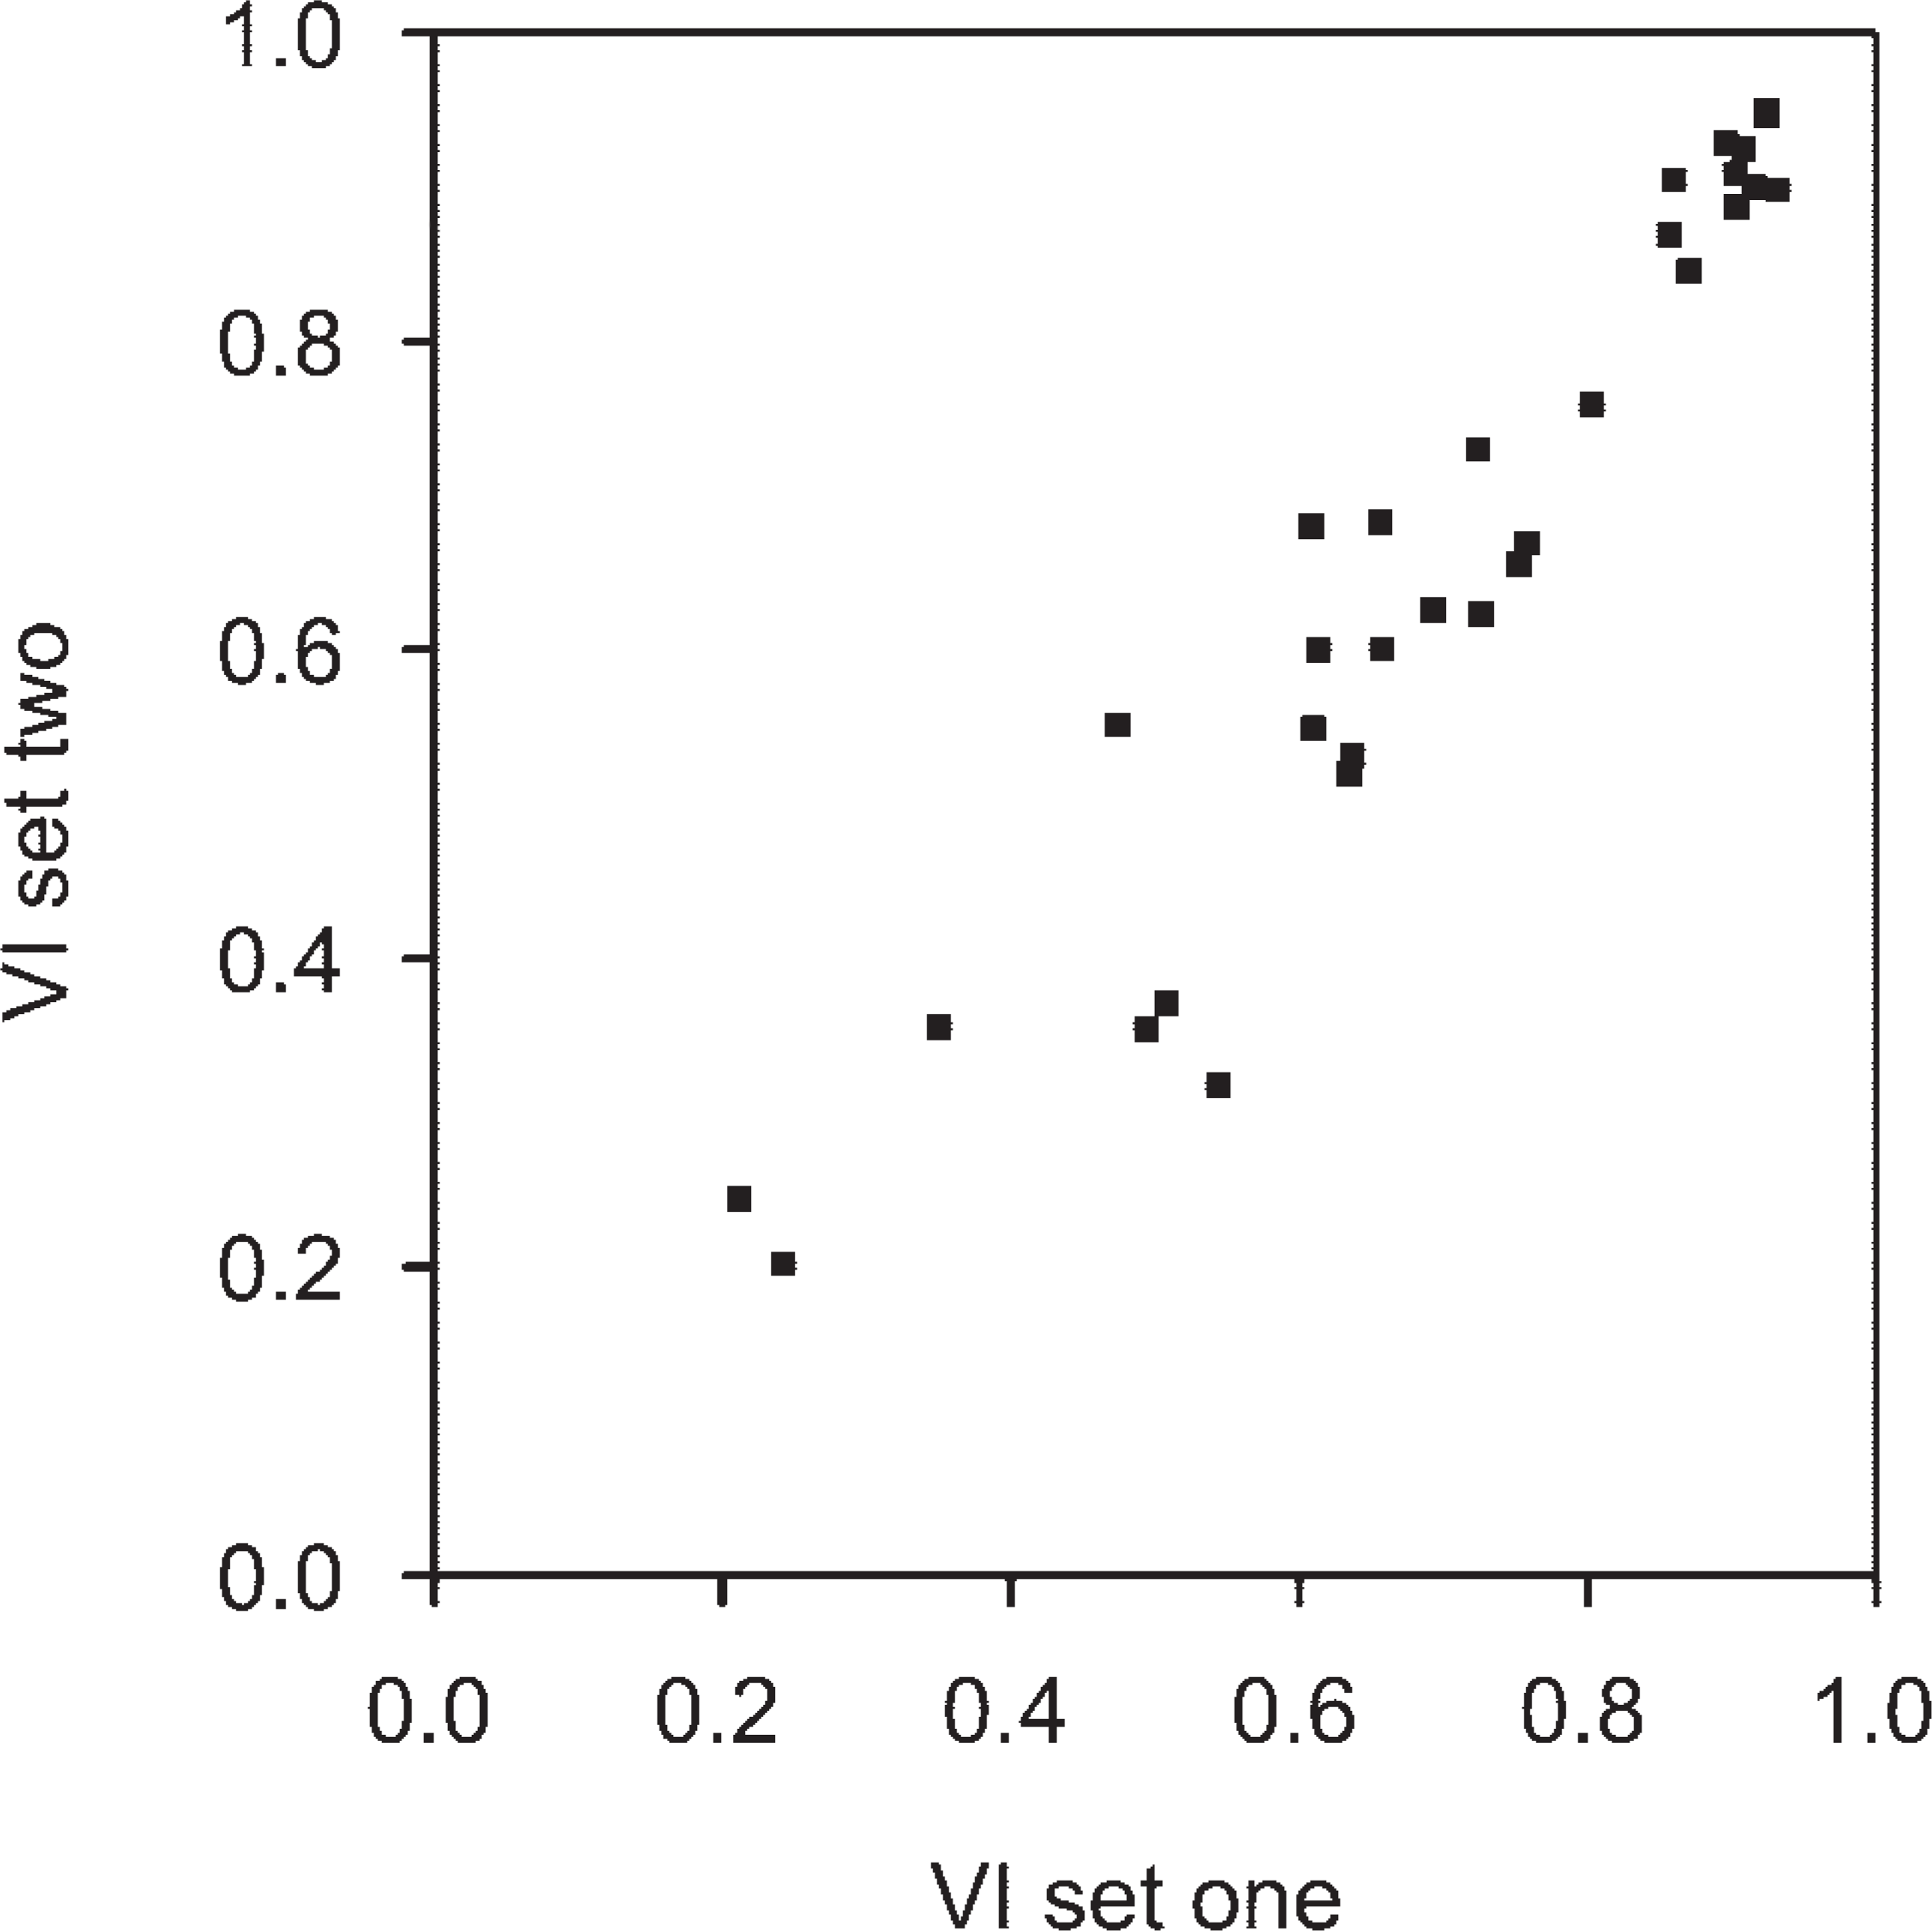
Scatter diagram of viability indices in two serial sets of the same 32 spheroids with histochemical detection of LDH activity, image acquisition, and cytometric analysis in separate sessions. Each dot depicts values obtained from an average of 5.5 (SD 1.5) sections of a spheroid. Pearson's correlation coefficient 0.935; p<0.01.
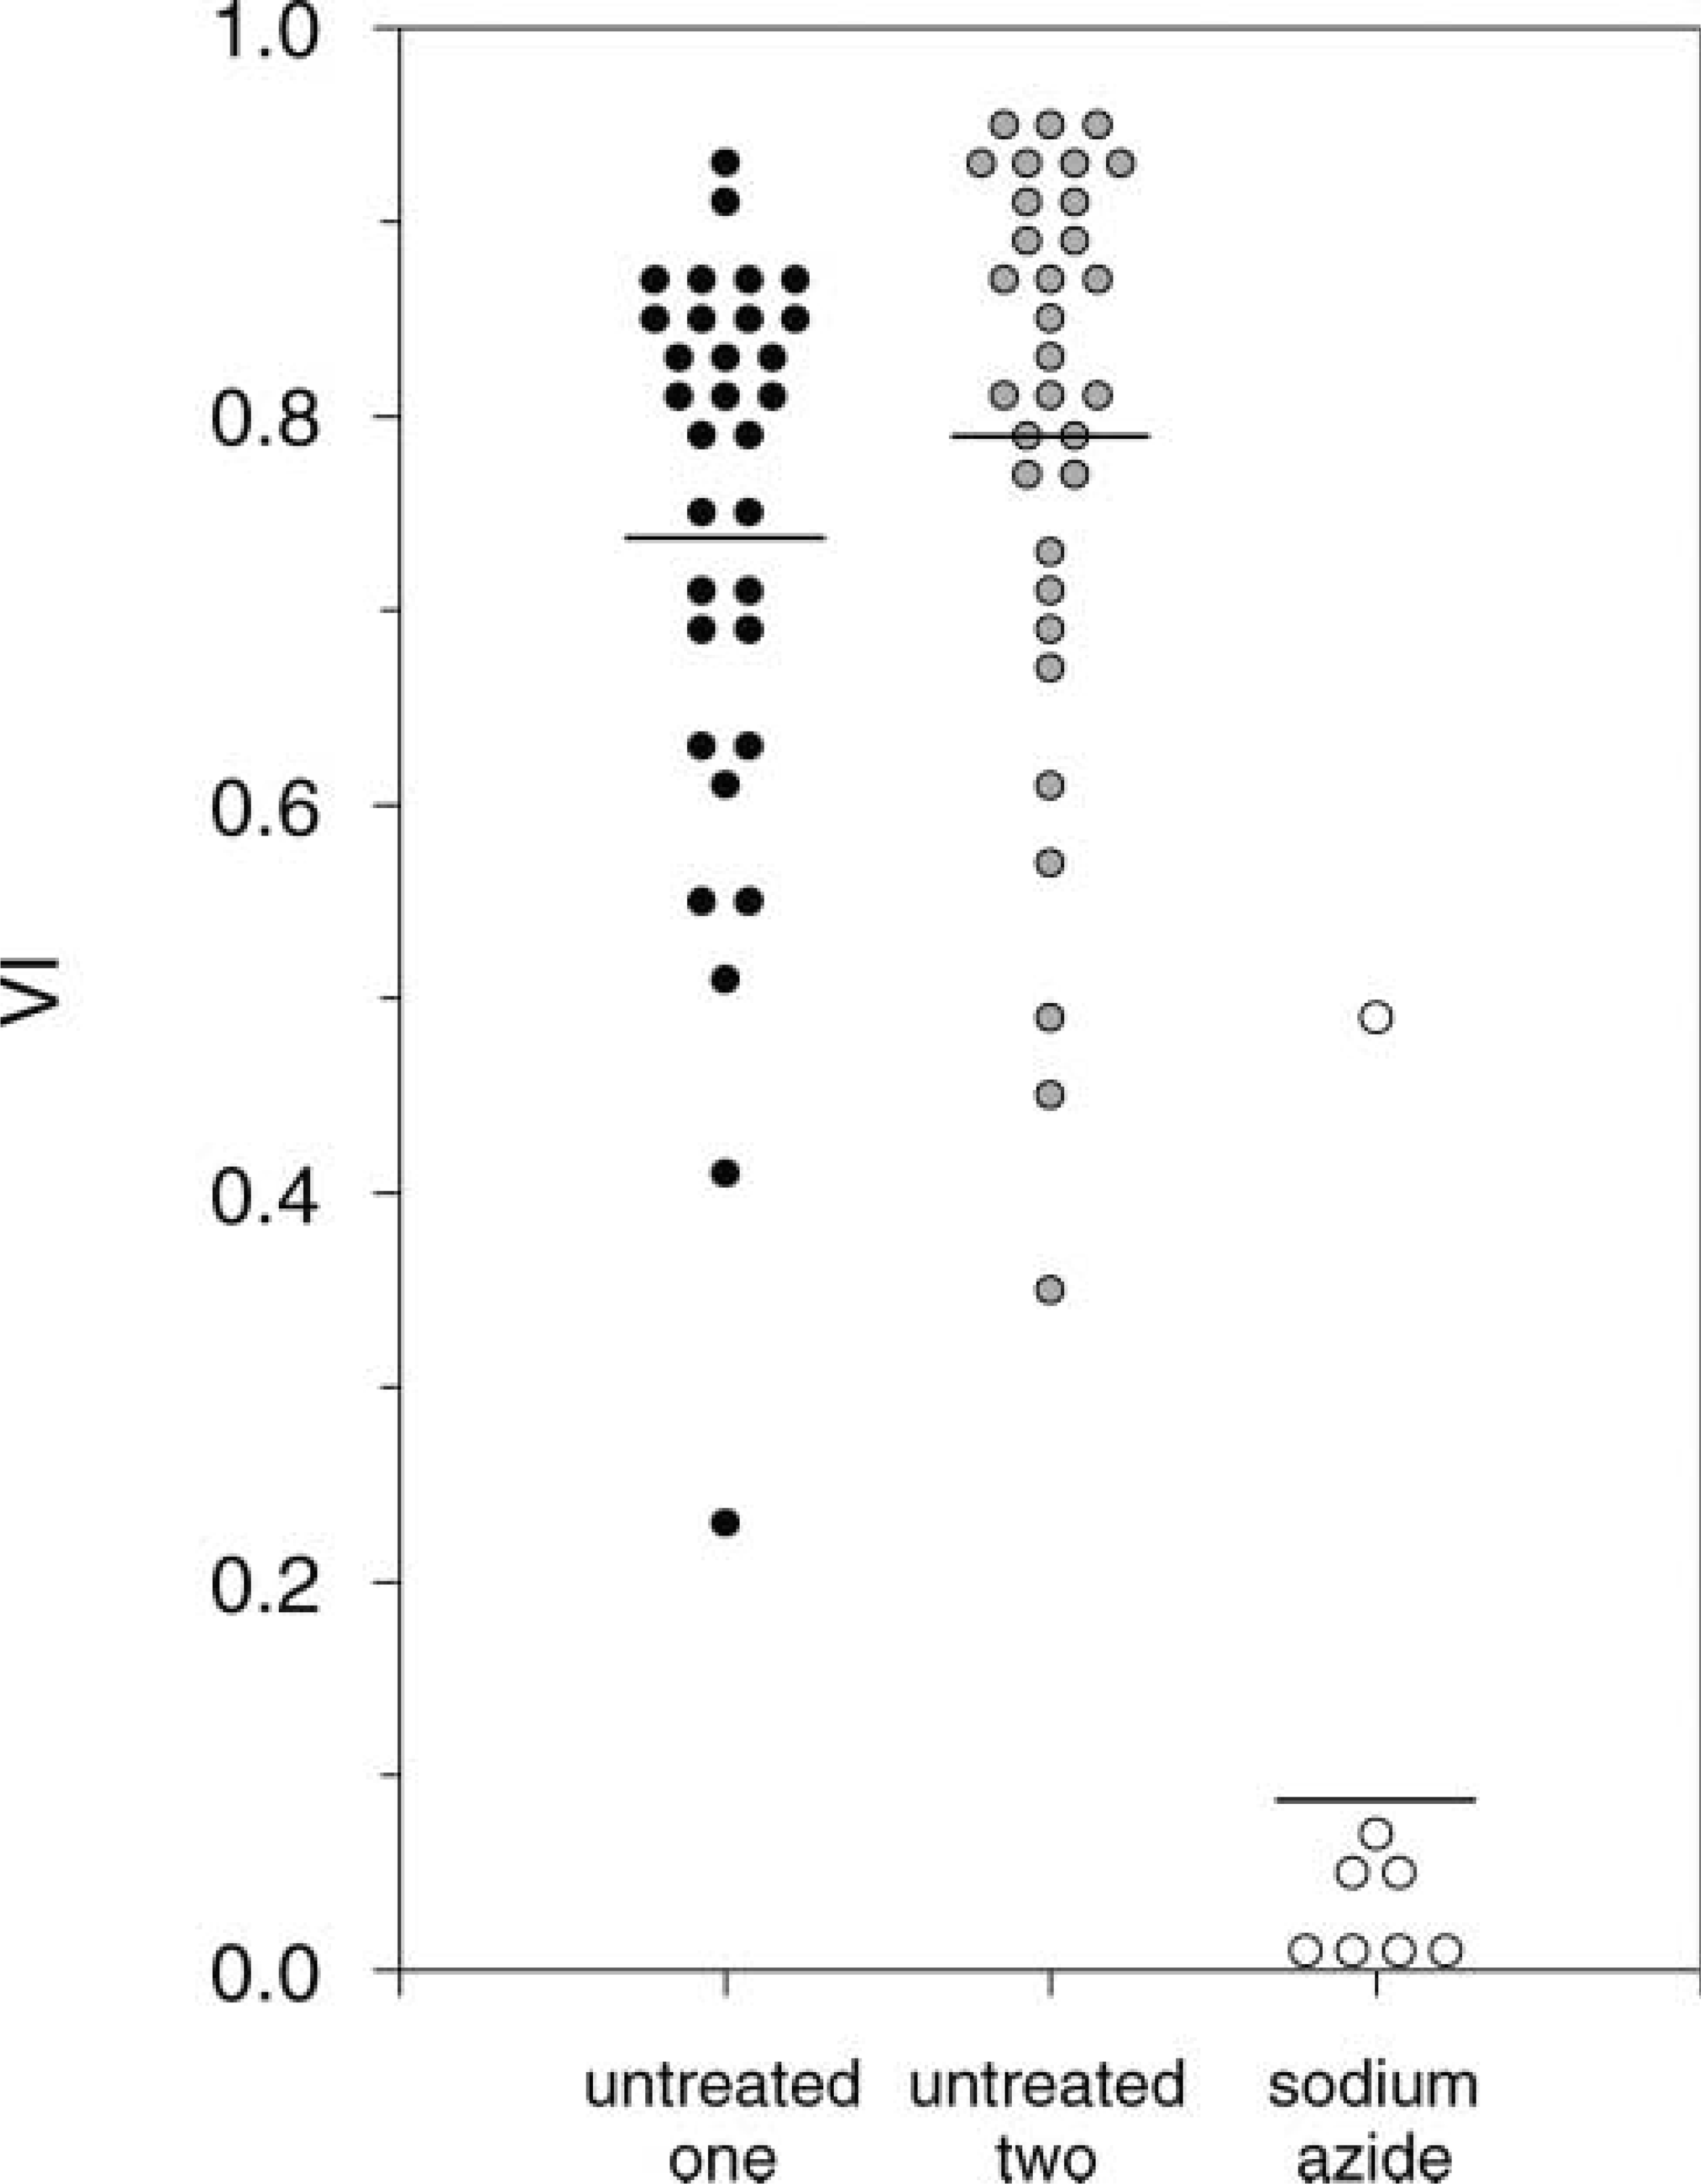
Frequency plot of viability indices for untreated spheroids from two tumors (n=32 for each) and sodium azide-treated spheroids (10 mM in culture medium for 1 week) from one tumor (n=8). Each dot represents one spheroid. The horizontal lines determine the average VI per spheroid group. Kruskal-Wallis χ-square of 22.8, d.f. 2, and p<0.001.
Before weighing the merits of these approaches, it is of importance to discern two categories of tumor spheroids. In the first place, there are multicellular aggregated spheroids that evolved from monolayer cell cultures by aggregation and, in the second place, there are OMSs with an architecture native to the surgical specimens from which they are grown. The latter OMSs stabilize in volume over time (Bjerkvig et al. 1990; Kaaijk et al. 1995) and are not susceptible to chemical dissociation (unpublished data from our laboratory) in contrast to the aggregated spheroids. Although these dissociative characteristics provide an opportunity for quantification of drug responsiveness in aggregated spheroids, the biological behavior of these aggregated spheroids is, again, probably affected by clonal selection and by deficiency of extracellular matrix and vascular elements.
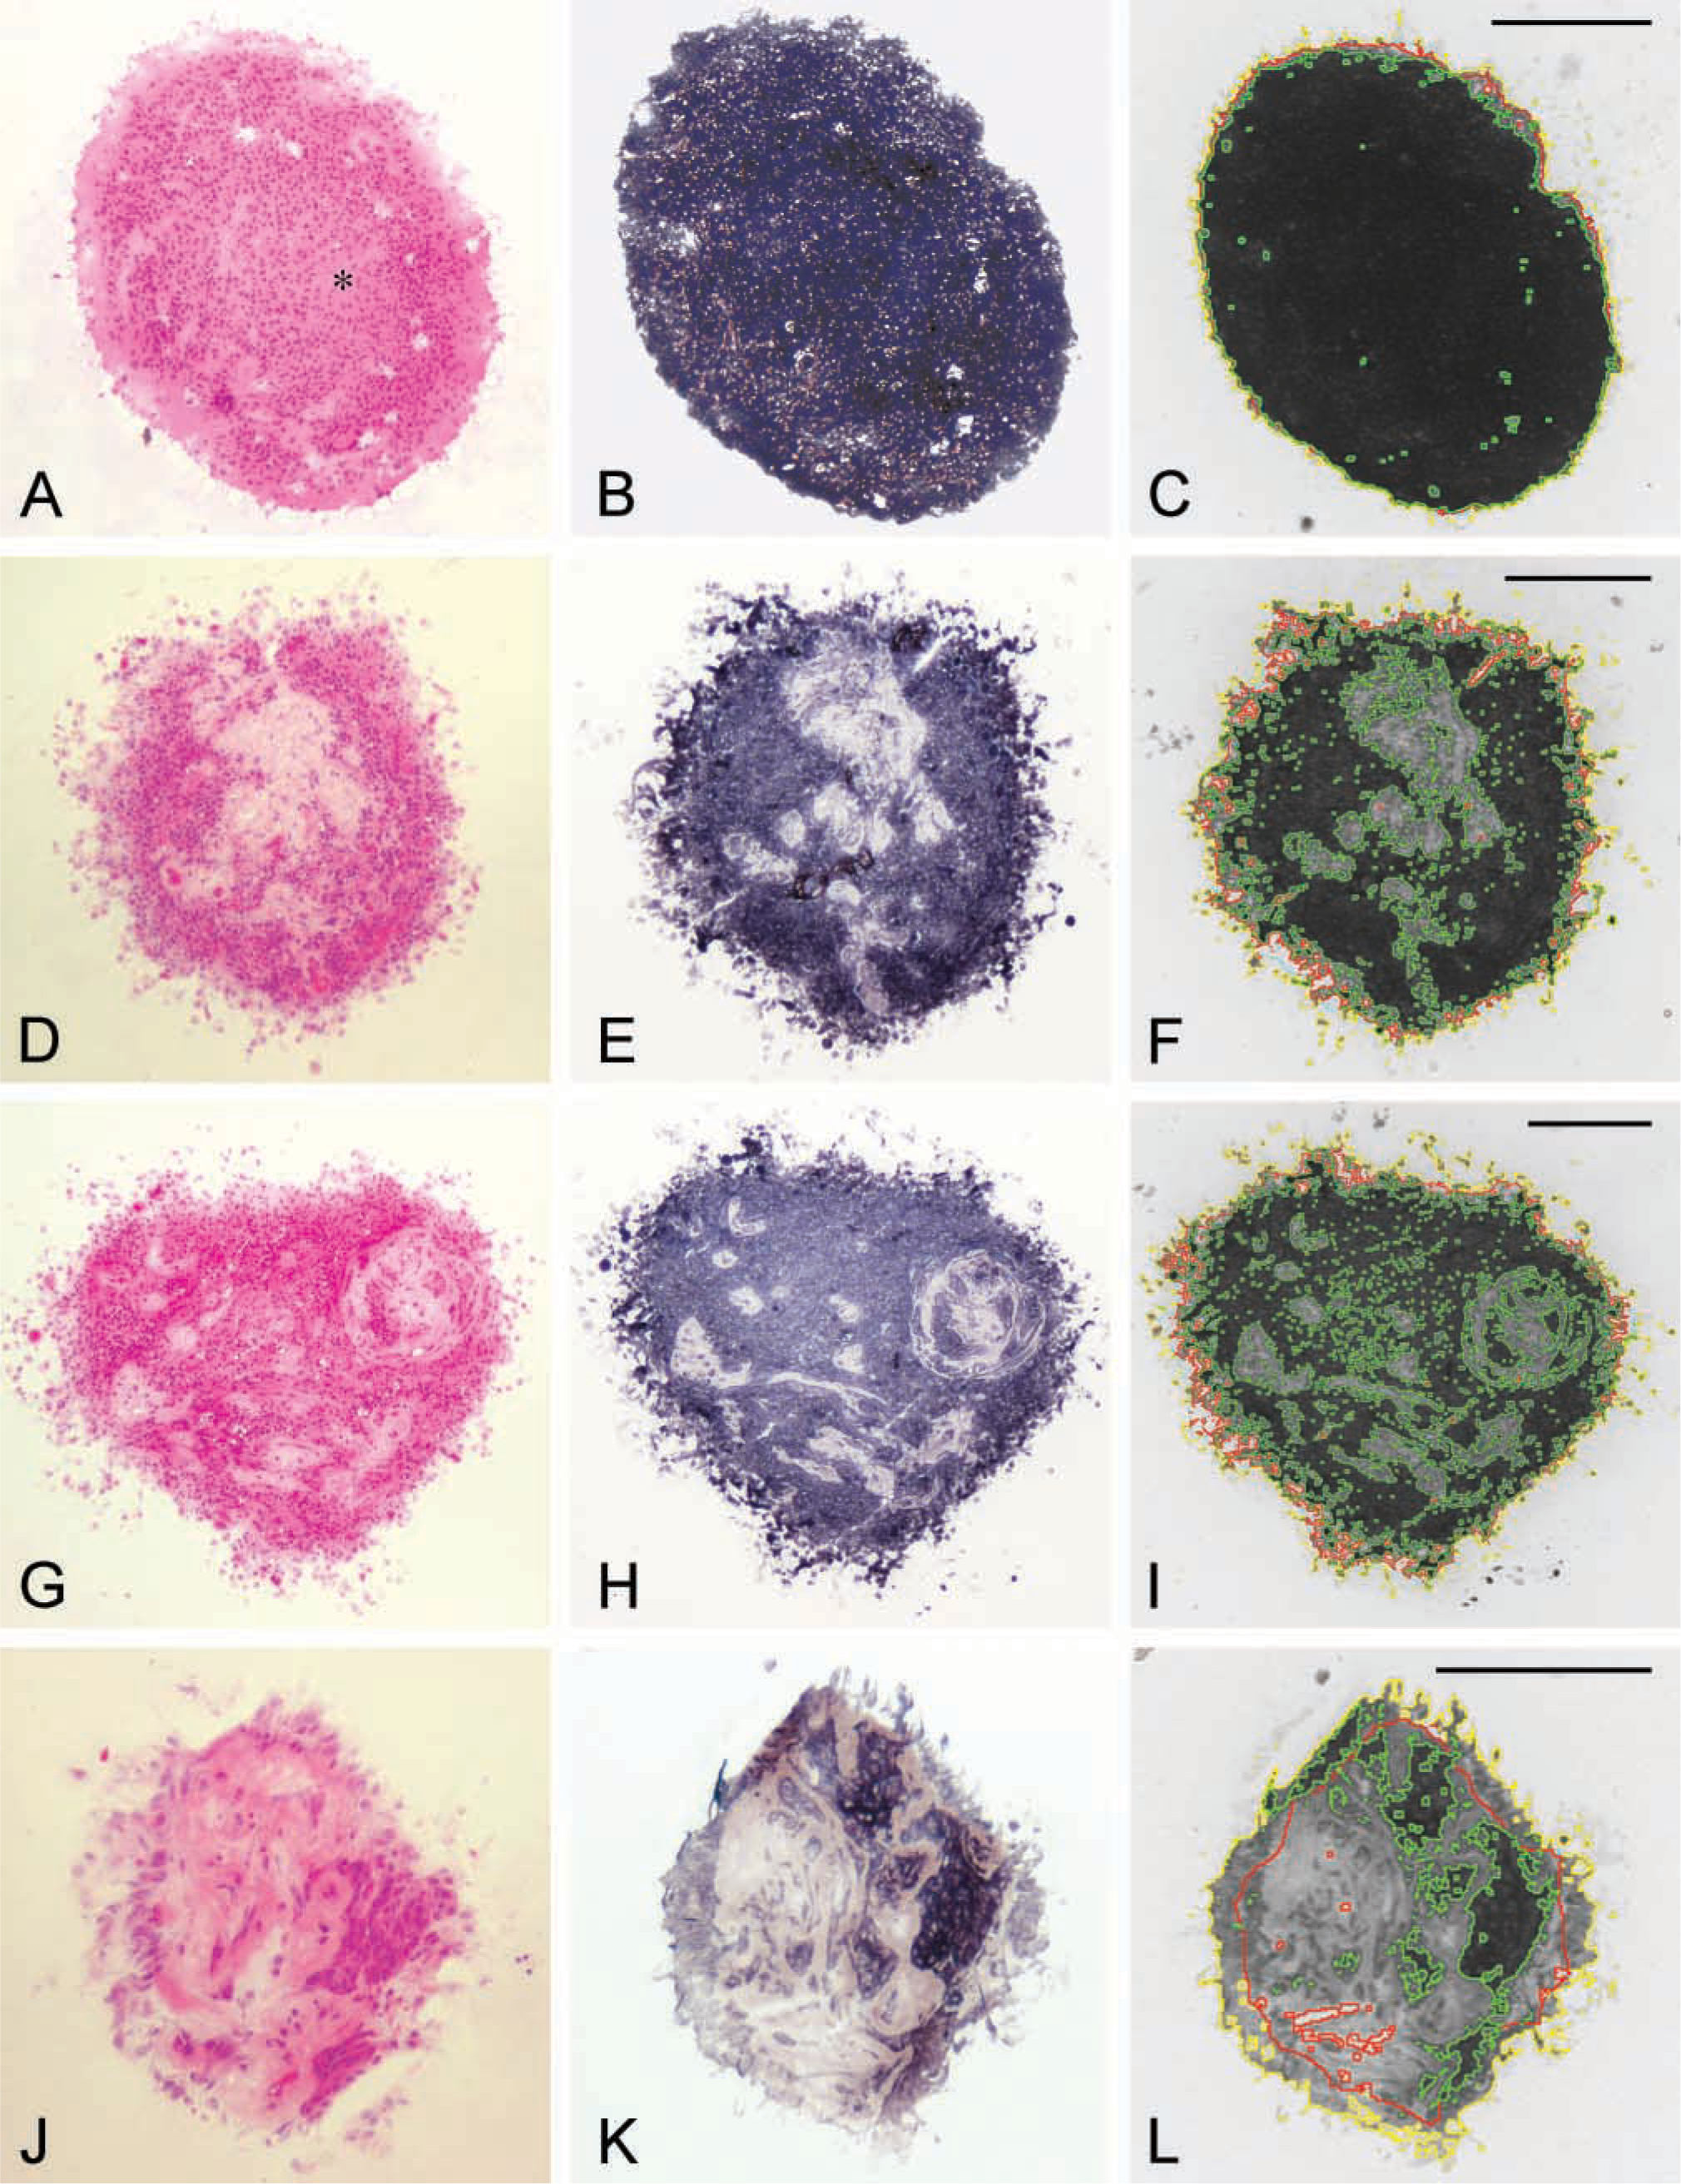
Sections of human glioma spheroids with various appearances of LDH-active and LDH-inactive tissue after HE staining (
Poor penetration of fluorescence probes in OMSs [up to ~60 μm from the margin (unpublished data)] impedes confocal laser scanning microscopy. Hence, immunohistochemical detection of cell proliferation and apoptosis markers is the only approach that provides spatial information and allows the serial analysis of multiple parameters in the same material. However, IHC markers are characterized by the fact that they provide information on one specific protein, which may be expressed only transiently. Therefore, a more general end point was pursued to determine the balance between cell proliferation and (programmed) cell death, which is of primary concern in the malignant glioma patient. One end point meeting this requirement is metabolic activity of cells, also referred to as viability. Here we show that tissue viability can be assessed in OMSs in analogy to various tetrazolium salt reduction assays available for cell cultures, and in essence provides an in situ application of the MTT assay. Quantification of LDH release from dying cells is an established approach to assessment of drug responsiveness in other tumor models based on diffusion of LDH from cells with a leaky plasma membrane, which is an early event in cell death (Frederiks et al. 1983, 1995; Korzeniewski and Callewaert 1983; Decker and Lohmann-Matthes 1988; Legrand et al. 1992; Allen et al. 1994; Sepp et al. 1996). Many commercially available kits provide colorimetric detection of dehydrogenase activity either indirectly by LDH released in the supernatant from the cytosol of dying cells [i.e., Cytotoxicity Detection Kit (LDH), Roche Applied Science; LDH Cytotoxicity Detection Kit, MoBiTec; TOX7-1KT, Sigma Aldrich] or directly by demonstration of dehydrogenase activity in viable cells [i.e., Cell Proliferation Kit I (MTT), II (XTT), III (WST1), Roche Applied Science; MTT Cell Proliferation Assay, ATCC (Rockville, MD); Cell Proliferation Assay Kit, Chemicon (Temecula, CA)]. Subsequent quantification can be accomplished by colorimetry of the supernatant in an ELISA plate reader for cell culture suspensions.
In the present study, localization of LDH activity in cryostat sections of OMSs is described as a tumor-responsiveness test. This test provides an assay that is rapid, accurate in quantification, reproducible, transparent by being founded on generally established concepts of tissue viability, enables the use of spatial information, and is available for further analysis of other aspects of tumor responsiveness in serial sections from the same tissue material. Furthermore, an example of sodium azide responsiveness has provided proof of principle for the validity of the VI to detect a cytotoxic response in OMSs.
Some issues remain to be resolved, however, before relevant results can be provided with this OMS tumor model and the LDH activity assay. In the first place, LDH-inactive tissue is interpreted as nonviable tissue based on the rationale that viable cells contain LDH and therefore that absence of LDH in tissue is in accordance with absence of viable cells. Nevertheless, the LDH-inactive tissue areas do not entirely consist of necrosis, according to preliminary analysis (unpublished data). Apparently, part of the LDH-inactive tissue stains positive for picrosirius red, indicating collageneous elements of the extracellular matrix. Other parts stain positive for vimentin IX, indicating vascular elements. In the second place, another important issue is whether the OMS model proves to be sufficiently biologically valid. The superior validity of the OMS model compared with the monolayer cell culture has only been theoretically deduced. In the third place, the outliers in VI in untreated and sodium azide-treated samples illustrate the need to compensate for the heterogeneity of OMSs by inclusion of multiple samples in a treatment group. Apparently, eight OMSs sufficed for statistical analysis in the sodium azide experiment. In general, the consequence of heterogeneity of tumor tissue needs to be addressed for a tumor model to be efficient. Crucial to this point are the minimal numbers of OMSs in a treatment group and the minimal numbers of cryostat sections per OMS required (given a predetermined biologically relevant detectable difference in VI, power, and significance level). These issues need to be addressed for this tumor model in succeeding studies.
We conclude that the viability of OMSs can be quantified in a rapid, reliable, and reproducible way using localization of LDH activity in cryostat sections with automated image cytometric analysis. This is an important advance towards relevant drug screening in this human malignant glioma tumor model.
Footnotes
Acknowledgements
Our gratitude is expressed to Professor Dr D. Troost, head of the Department of Neuropathology, for his contribution to interpretation of the HE-stained sections of OMSs, and to Ing P.J. van Amstel, head of the research laboratory of the Department of Pathology, for facilitation of the culture incubators and reagents.
We also wish to thank K.S. Bosch and W.M. Frederiks, PhD, from the Department of Cell Biology and Histology, for their contribution to the enzyme histochemical laboratory protocols and facilities.
Support with the software development provided by N.O.E. Vischer, PhD, software engineer at the Faculty of Biology, is kindly appreciated.