
Abstract
Tissue microarray (TMA) is a new high-throughput method that enables simultaneous analysis of the profiles of protein expression in multiple tissue samples. TMA technology has not previously been adapted for physiological and pathophysiological studies of rodent kidneys. We have evaluated the validity and reliability of using TMA to assess protein expression in mouse and rat kidneys. A representative TMA block that we have produced included: (1) mouse and rat kidney cortex, outer medulla, and inner medulla fixed with different fixatives; (2) rat kidneys at different stages of development fixed with different fixatives; (3) mouse and rat kidneys with different physiological or pathophysiological treatments; and (4) built-in controls. As examples of the utility, immunostaining for cyclooxygenase-2, renin, Tamm Horsfall protein, aquaporin-2, connective tissue growth factor, and synaptopodin was carried out with kidney TMA slides. Quantitative analysis of cyclooxygense-2 expression in kidneys confirms that individual cores provide meaningful representations comparable to whole-kidney sections. These studies show that kidney TMA technique is a promising and useful tool for investigating the expression profiles of proteins of interest in rodent kidneys under different physiological and pathophysiological conditions.
Keywords
I
Tissue microarray (TMA) was first introduced as a high-throughput tool for the study of protein expression patterns in cancer tissues (Kononen et al. 1998). By displaying large numbers of small cylindrical tissues from individual blocks on a single tissue slide, TMA has many advantages over conventional techniques: high efficiency, uniform reaction conditions, reagent conservation, multiple built-in controls, reduced damage to donor tissue blocks, easier automated imaging analysis, and rapid linking of molecular changes to clinical variables (Rimm et al. 2001; Torhorst et al. 2001; Su et al. 2006).
Although now widely used in cancer research, TMA has not been as widely used to investigate the patterns of protein expression in non-cancerous tissue in response to different physiological or pathophysiological alterations. Using our large archival tissue bank, we have constructed kidney TMA blocks that include different regions of mouse and rat kidneys fixed with different fixatives, developmental rat kidneys, mouse and rat kidneys subjected to different treatments, and built-in controls. As a proof of concept, we have evaluated the application of our TMA slides in kidney research by staining these slides with several molecules important for kidney function.
Materials and Methods
Kidney Samples
We utilized archival kidney samples from our laboratory. All kidneys were well-perfused through a transcardial aortic cannula with FPAS (3.7% formaldehyde, 10 mM sodium m-periodate, 40 mM phosphate buffer, and 1% acetic acid), GPAS (2.5% glutaraldehyde, 10 mM sodium m-periodate, 40 mM phosphate buffer, and 1% acetic acid), 4% paraformaldehyde, or 10% formalin, as previously described (Harris et al. 1994; McKanna and Zhang 1997; Zhang et al. 1997, 1999, 2006). After fixation, kidneys were dehydrated and paraffin-embedded.
TMA Construction and TMA Slide Preparation
Before constructing a kidney TMA block, serial 4-μm sections were cut from each donor block and stained with hematoxylin and eosin (H and E) for morphology. Kidneys were divided into three sections: cortex, outer medulla, and inner medulla. Using Beecher Instruments Tissue Array (Silver Spring, MD), tissue cylinders with a diameter of 1.0 mm were punched from four targeted areas in each section of each donor kidney and deposited into a 12 × 13 core (156 cores) TMA block. Each block contained 144 cores of kidney tissue samples and 12 cores of normal rat tissue samples as built-in controls; these included FPAS-fixed spleen, thymus, muscle, prostate, stomach, skin, brain, pancreas, lung, liver, colon, and heart from male adult rats. The kidney TMA blocks were heated to 37C for 30 min, and multiple serial 4-μm sections were cut, placed on charged slides, and stored at 4C. One section was stained with H and E for morphological evaluation. In our tissue bank, there is a sufficient supply of paraffin-embedded kidney tissues with different treatments to replace single tissue samples once it runs out. It requires only 4–5 days to design a TMA and for an experienced technician to access the original blocks, construct the TMA block, and produce serial sections. Because all the samples required already exist, constructing a new kidney TMA is quick and economical.
Immunohistochemical and Immunofluorescent Staining
Immunohistochemistry and immunofluorescence were carried out as described in our previous reports (Zhang et al. 1997; Yao et al. 2008). Rabbit anti-murine cyclooxgenase-2 (COX-2) antibody was used at a 1-μg IgG/ml dilution (Cayman Chemicals; Ann Arbor, MI). Rabbit anti-renin antiserum (a gift from Dr. Inagami, Vanderbilt University) was used at a 1:10,000 dilution. Goat anti-mouse Tamm Horsfall protein antibody (1:4000 dilution), goat anti-human aquaporin-2 antibody (1:400 dilution), and goat anti–connective tissue growth factor (CTGF, 1:200 dilution) were purchased from Santa Cruz Biotechnology (Santa Cruz, CA). Monoclonal antibody against synaptopodin (1:200 dilution) was purchased from PROGEN Biotechnik GmbH (Heidelberg, Germany). For synaptopodin staining, antigen retrieval was achieved by boiling slides in antigen-unmasking solution (H-3300; Vector Laboratories, Burlingame, CA). Serum or purified IgGs from non-immunized hosts were used as negative controls. There was no detectable immunostaining in our negative controls.
Quantitative Image Analysis
Based on the distinctive density and color of COX-2, renin, or CTGF immunostaining in video images, the number, size, and position of stained cells were quantified using the BIOQUANT true-color windows system (R and M Biometrics; Nashville, TN) equipped with digital stage encoders that allow high-magnification images to be mapped to global coordinates throughout the sections (Zhang et al. 1997). The expression levels of COX-2, renin, or CTGF were expressed as ratio of COX-2, renin, or CTGF immunostaining area vs core area.
Micrography
Bright-field images from a Leitz Orthoplan microscope equipped with a red/green/blue video camera (Digital Video Camera; Austin, TX) were digitized by BIOQUANT true-color windows system and saved as computer files. Contrast and color level adjustment (Adobe Photoshop) were performed for the entire image; i.e., no region- or object-specific editing or enhancements were performed.
Statistical Analysis
Values are presented as means ± standard errors. ANOVA and Bonferroni t-test were used for statistical analysis, and differences were considered significant at p<0.05.
Results
In the representative TMA (156 cores) slide, only two cores were lost, and one core occupied less than 10% of the core area (total 1.9% loss rate) (Figure 1). Our lower loss rate (1.9% vs 4.5% to 20% in tumors) probably results from well-fixed kidney samples (Su et al. 2006).
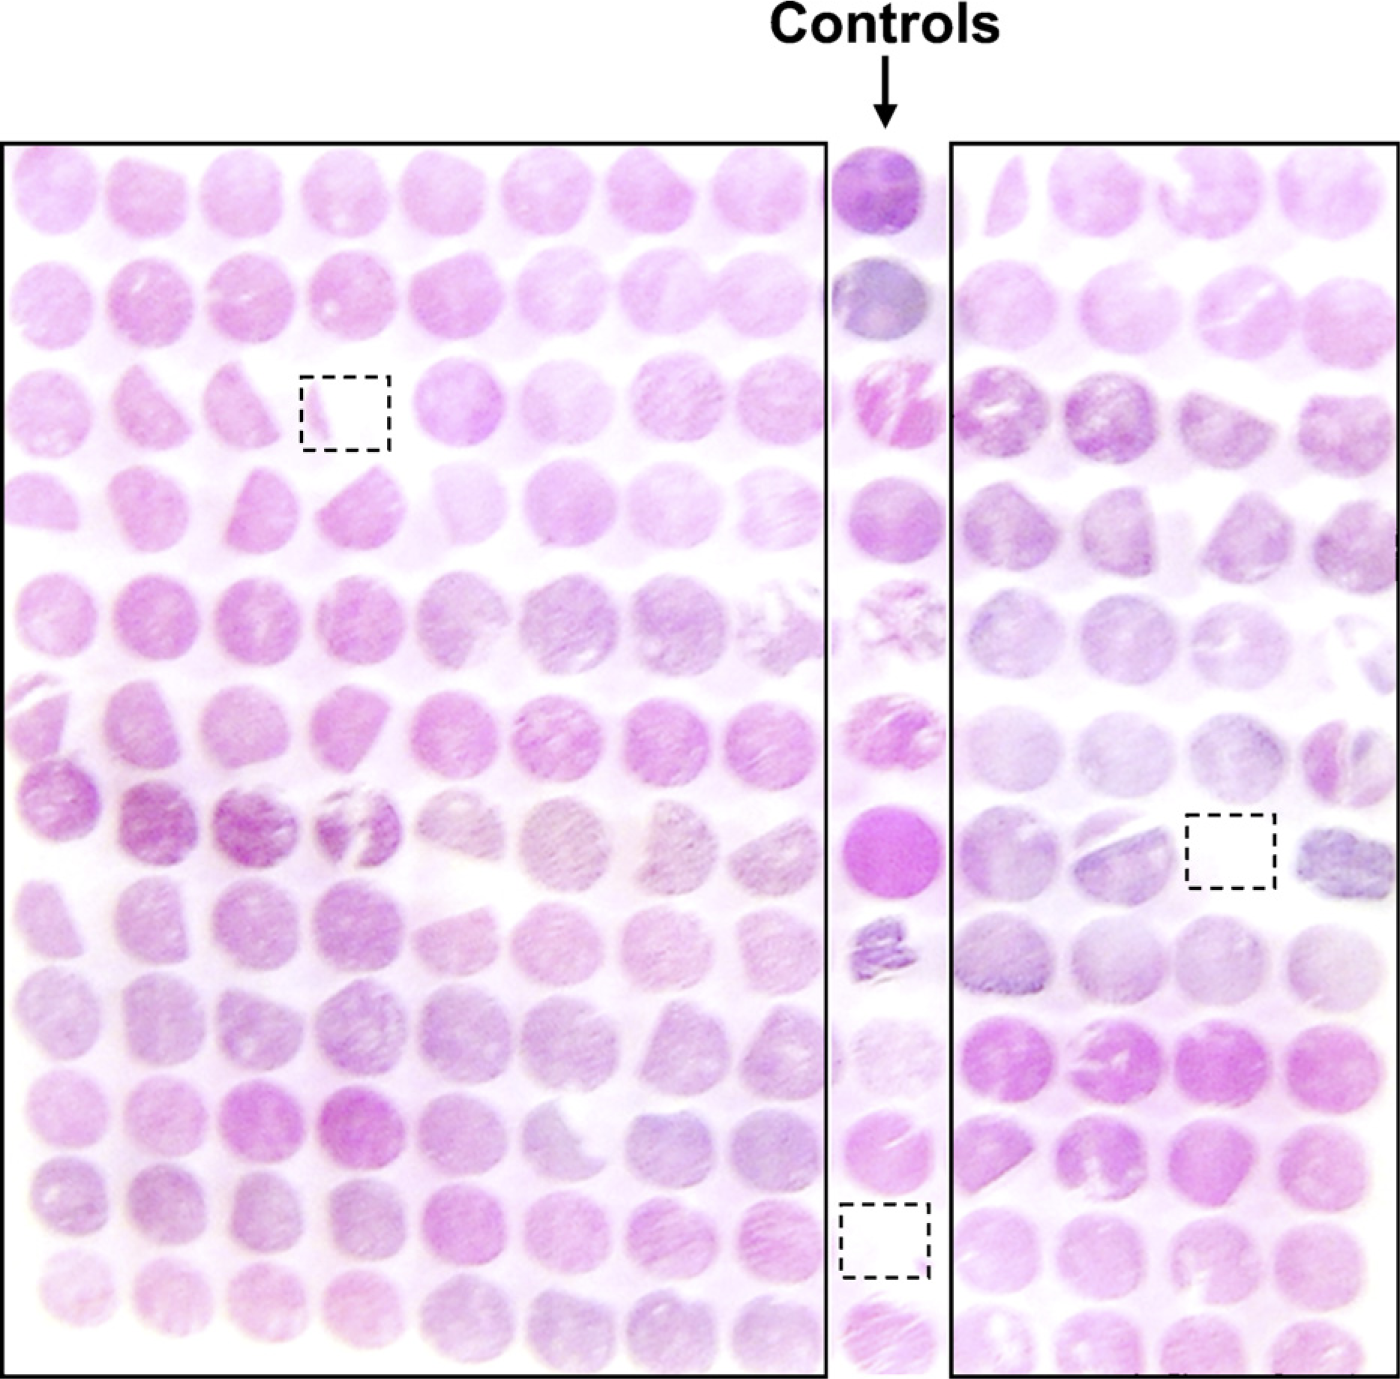
Design of the kidney tissue microarray (TMA). Cores with missing tissues or with tissues less than 10% of core area are indicated by boxes.
Tissue Fixation and Immunostaining
The immunostaining of some proteins is influenced by tissue fixation (McKanna and Zhang 1997). COX-2–derived prostaglandins are involved in kidney development and regulate vascular tone and salt and water homeostasis in the mammalian kidney (Harris et al. 1994; Zhang et al. 1997). In normal adult rat kidney cortex, COX-2 is restricted to the macula densa and associated cortical thick ascending limbs (Harris et al. 1994; Zhang et al. 1997). COX-2 immunostaining is dramatically affected by tissue fixation. As indicated in Figures 2A and 2B, COX-2 immunostaining was strong in newborn rat kidneys fixed with FPAS or GPAS without antigen retrieval. In contrast, COX-2 immunostaining was very weak in newborn rat kidneys fixed with 4% paraformaldehyde or formalin without antigen retrieval (Figures 2C and 2D).
Development and Protein Expression
The expression of some proteins in the kidney is subject to normal developmental regulation. COX-2 expression in rat kidney is developmentally regulated (Zhang et al. 1997). COX-2 expression in rat kidney cortex was higher in neonates [postnatal day 0 (P0)] (Figures 2A and 2B) and young rats (Figures 2E and 2F), lower in adult rats (Figure 2G), and barely detectable in old rats (Figure 2H).
Kidney Structural Heterogeneity and Protein Expression
In addition to cortical expression (Harris et al. 1994; Zhang et al. 1997), COX-2 is also expressed in the interstitial cells in the inner medulla, but is not expressed in the outer medulla (Zhang et al. 2002, 2004). In our kidney TMA slide, COX-2 immunostaining was obvious in the cortex but was not detectable in the outer medulla from the same rat kidney fixed with FPAS (cf. Figures 2G and 2M).
Tamm Horsfall protein and aquaporin-2 have been used as specific markers for thick ascending limbs and collecting duct (principal cells), respectively (Yao et al. 2008). In normal adult rat kidney, Tamm Horsfall protein immunostaining was found exclusively in the thick ascending limbs in the cortex and medulla (Figures 3A and 3B). In kidney cortex of normal adult rat, aquaporin-2 immunostaining was found in collecting duct epithelial cells, but not in intercalated cells (Figures 3C and 3D). In the medulla, aquaporin-2 was expressed in all collecting duct epithelial cells (Figures 3E and 3F). Synaptopodin is a specific marker of podocytes (Durvasula and Shankland 2006). In FPAS-fixed normal adult mouse kidney, synaptopodin immunostaining is restricted to podocytes in glomeruli (Figure 3J).
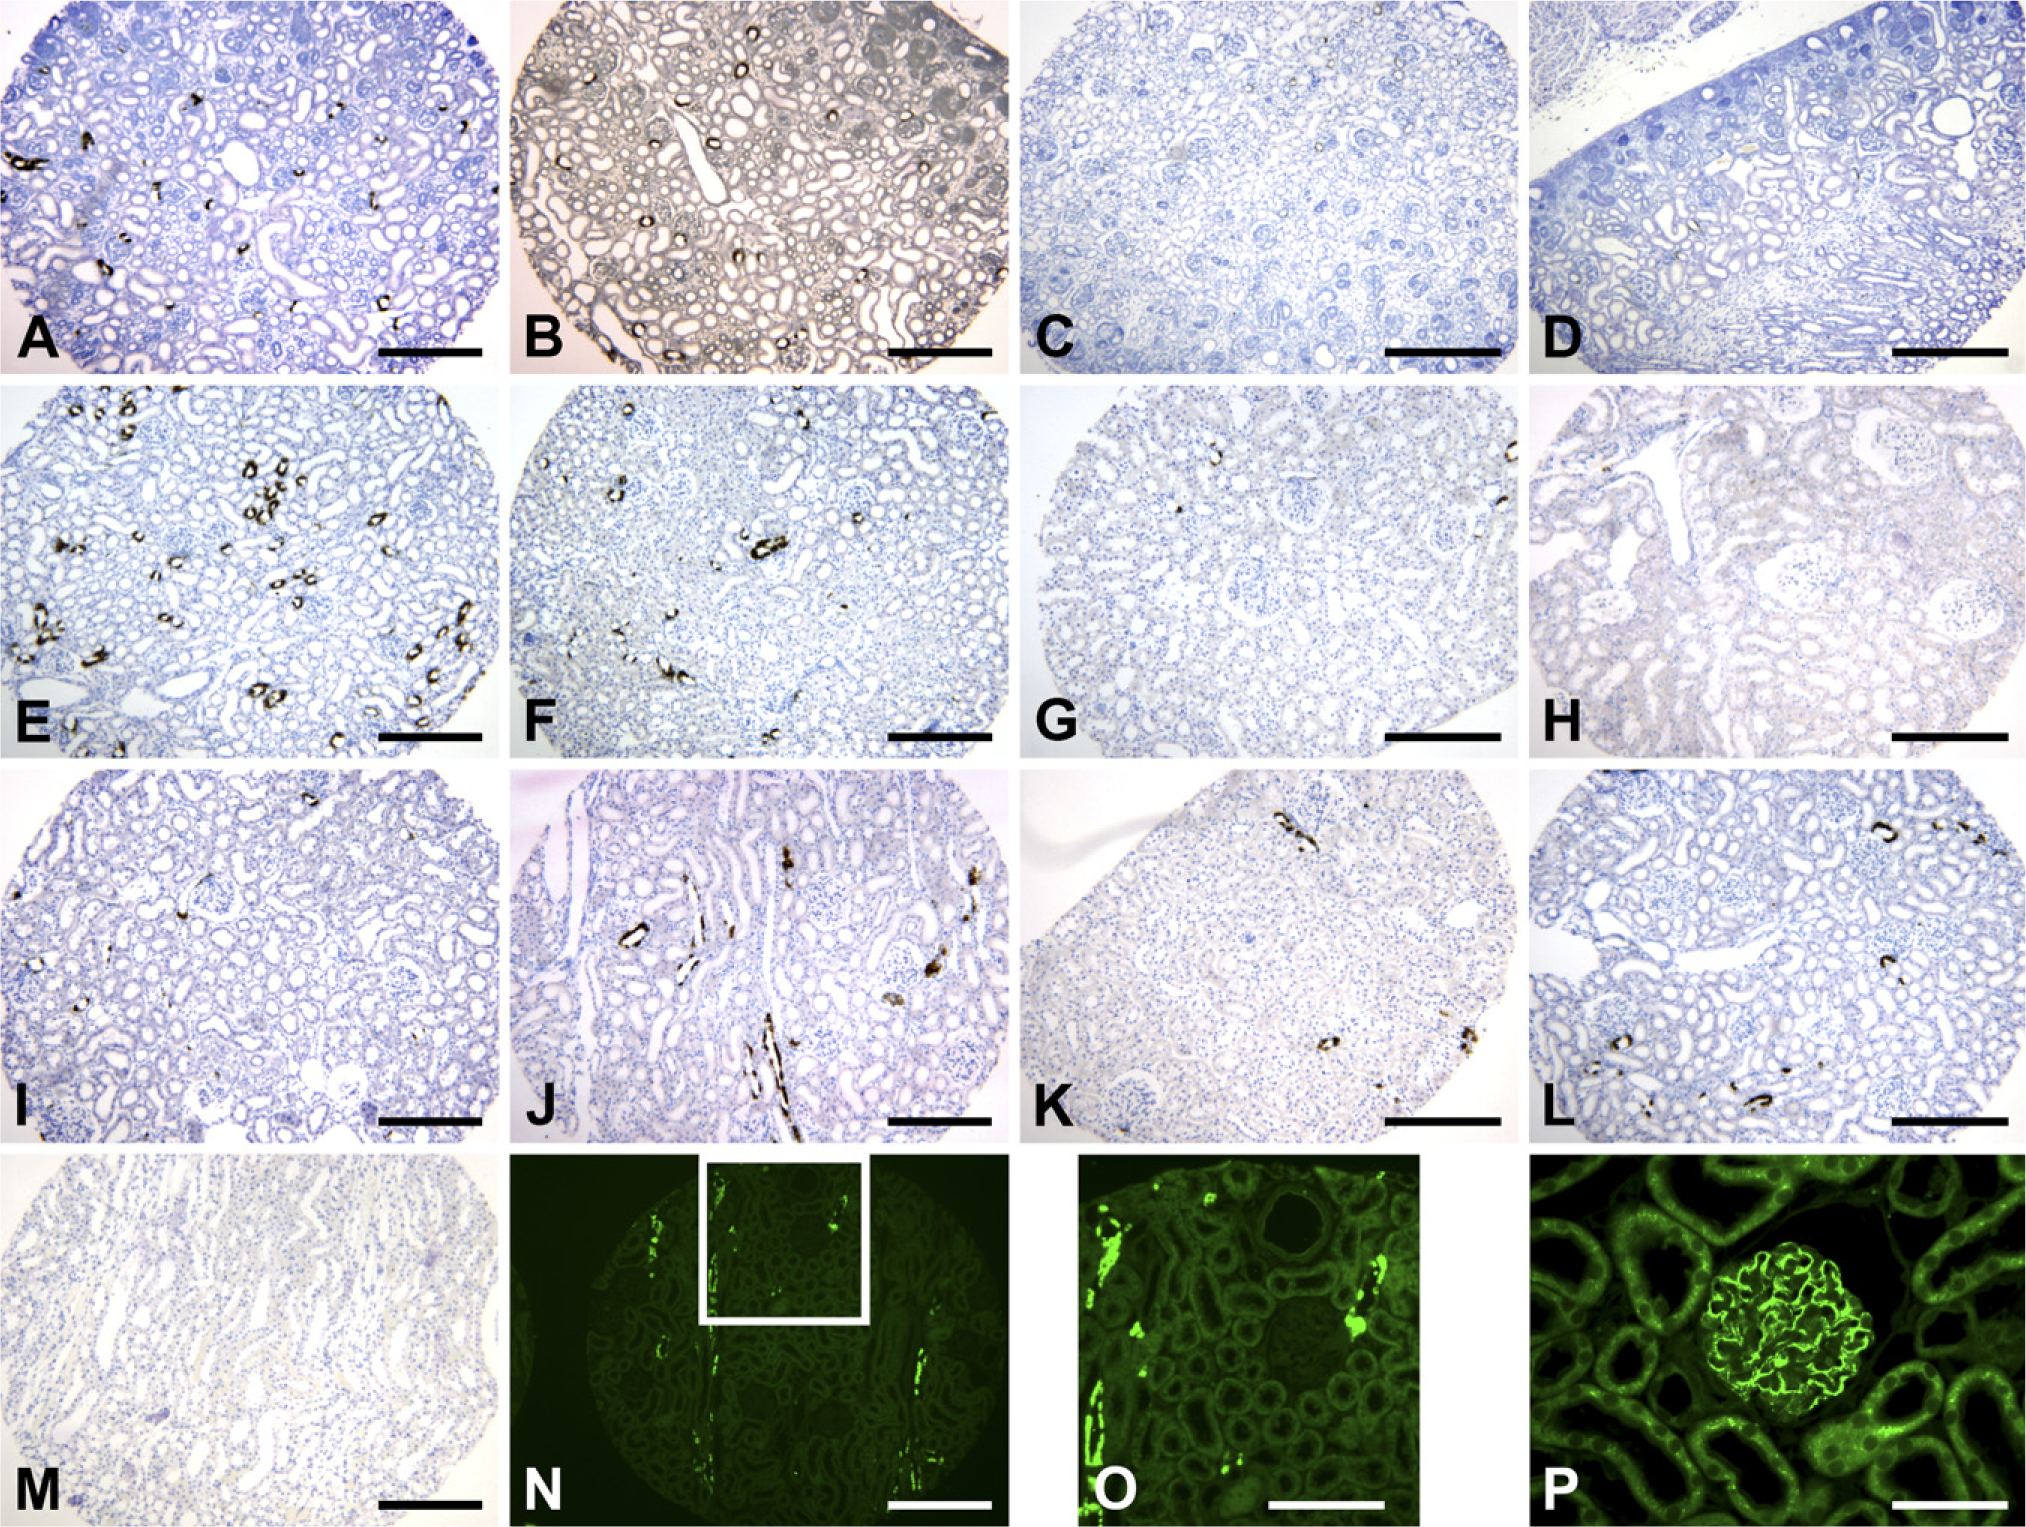
Characterization of cyclooxgenase-2 (COX-2) immunostaining in kidney TMA. COX-2 immunostaining in neonate rat kidney fixed with FPAS (
Kidney TMA and Semiquantitation of Immunostaining
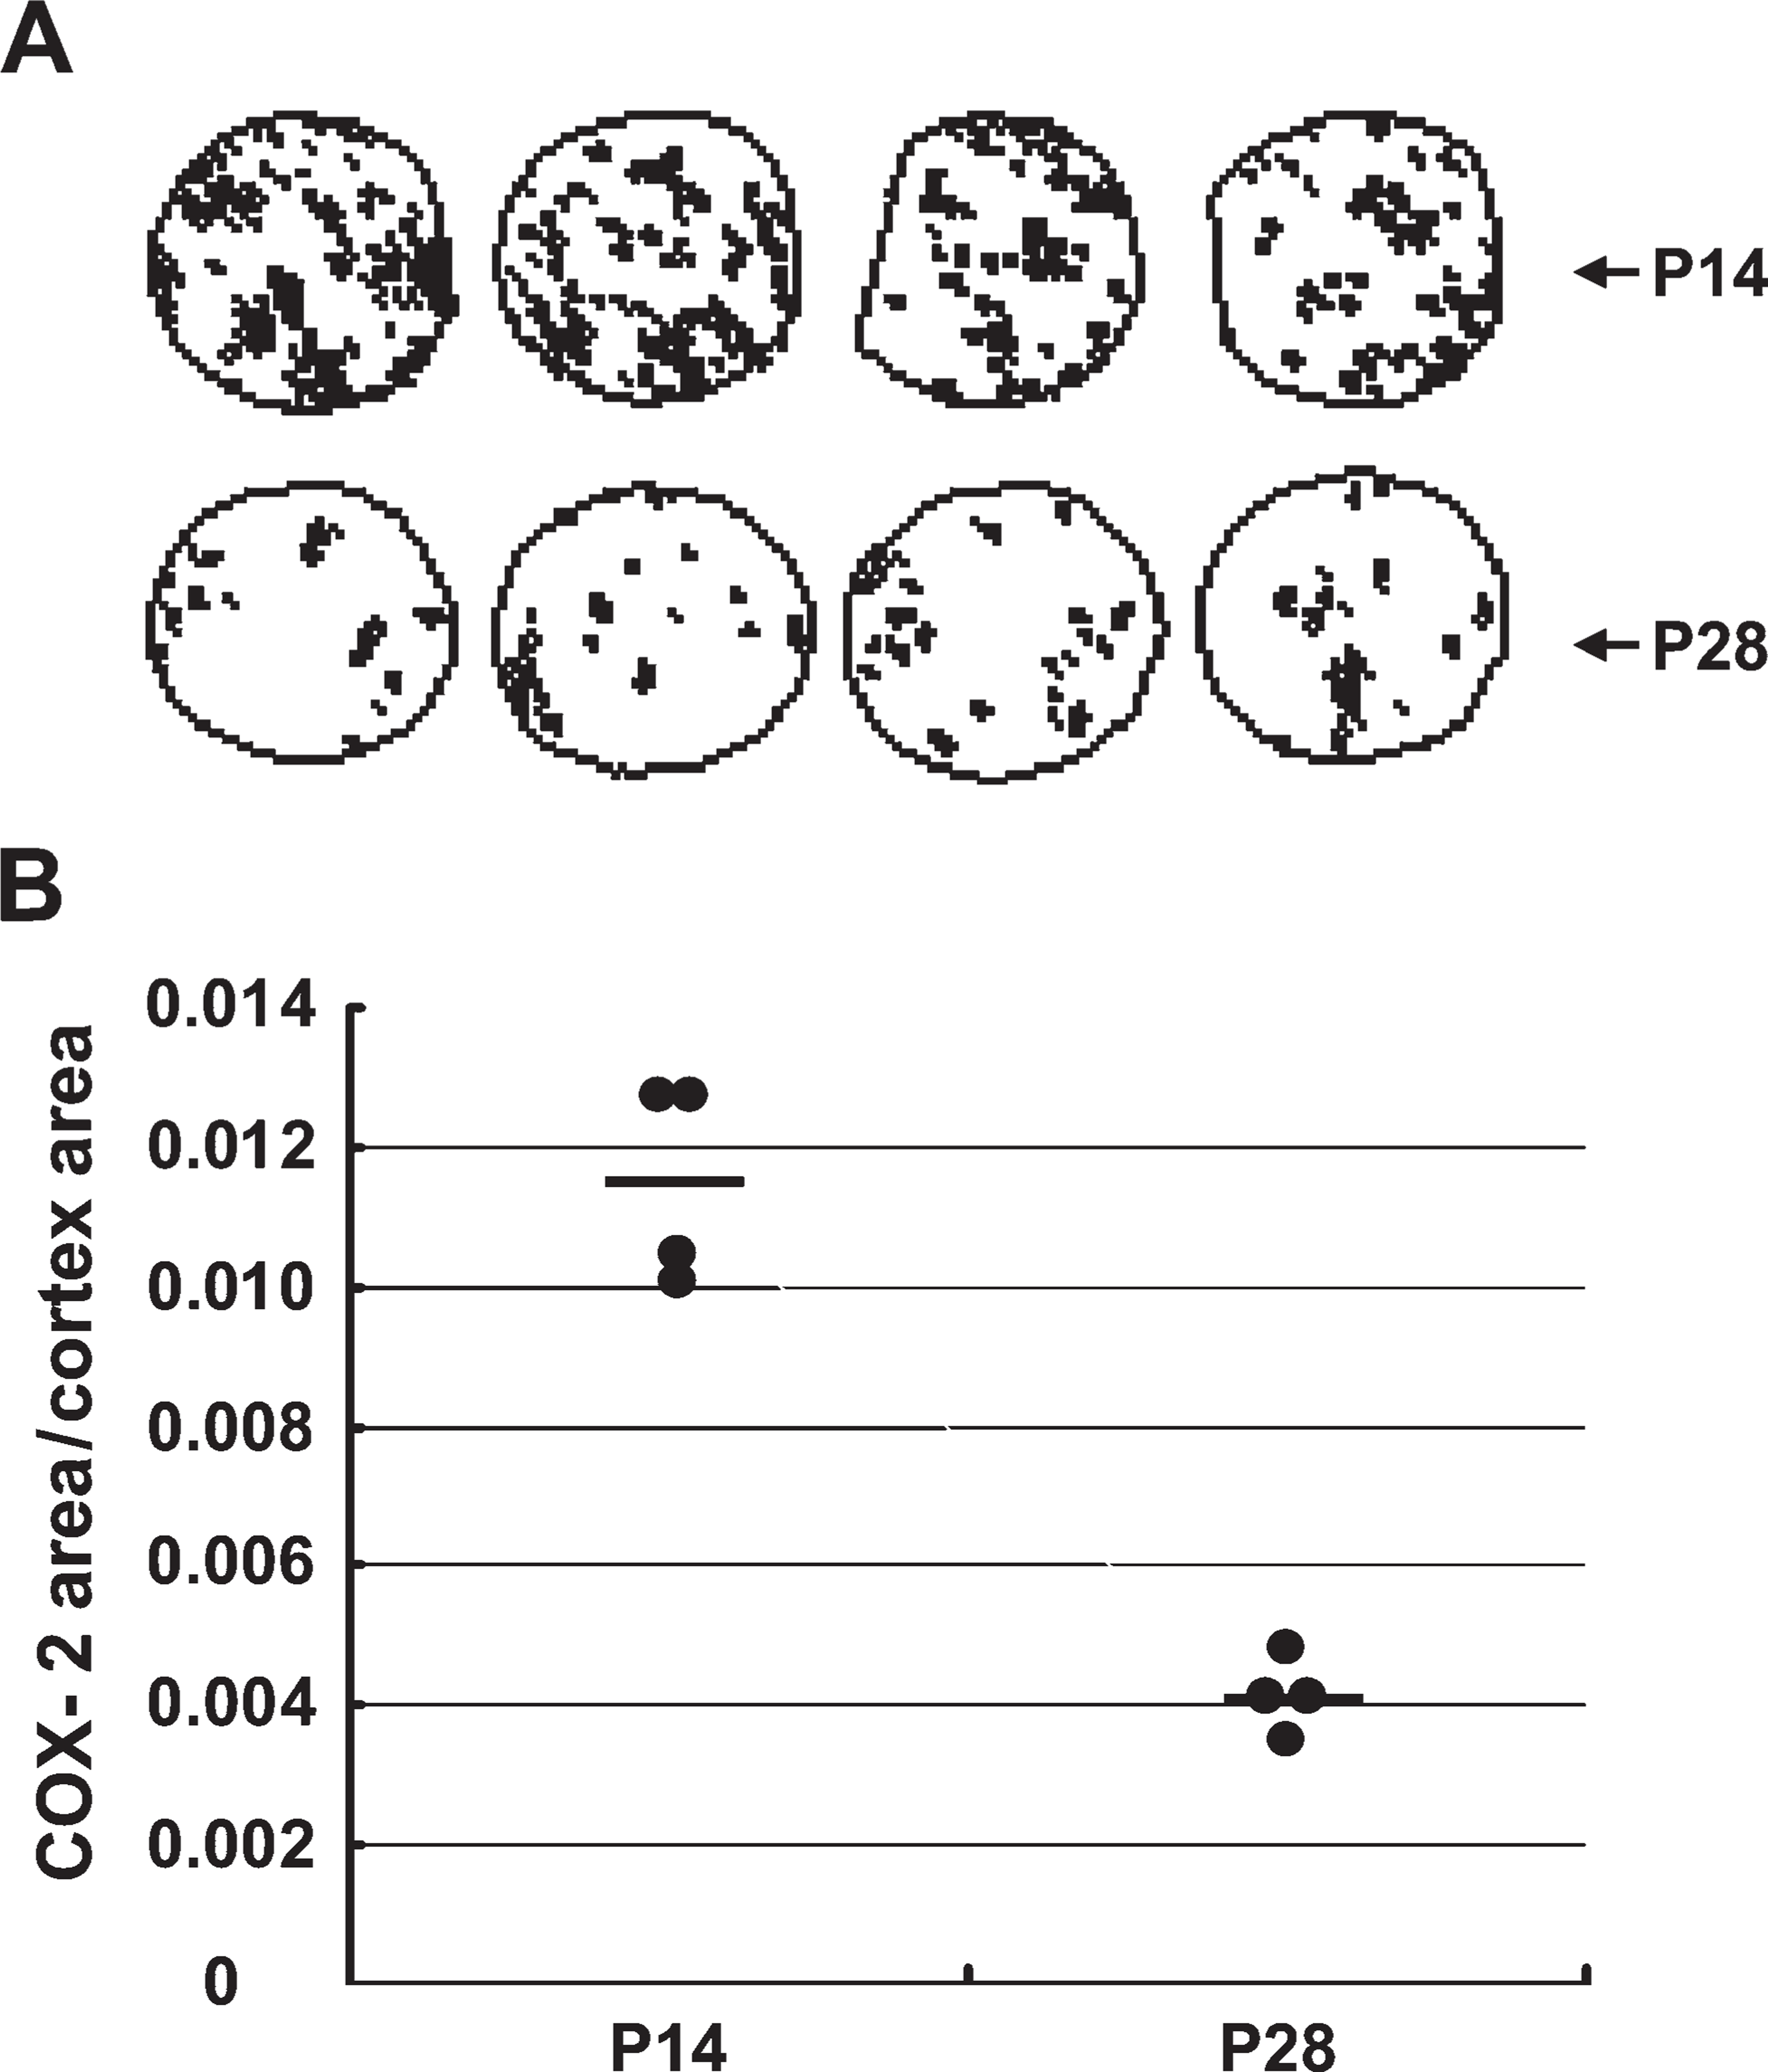
To investigate the variation of COX-2 immunostaining in individual cores from the same kidney cortex, semi-quantitation was carried out (Harris et al. 1994; Zhang et al. 1997). Figure 4A shows overviews of cortical COX-2 immunostaining in four cores from P14 and P28 rats. The variation of the ratio of COX-2 immuno-staining area to the core area from individual cores of P14 and P28 rat kidney cortex was small (P14: 0.0119 ± 0.0019; P28: 0.0040 ± 0.0004). The 3.4-fold increase in cortical COX-2 expression in P14 rats compared with P28 rats obtained from individual cores is similar to previously described results obtained from whole kidney (Zhang et al. 1997), indicating that individual cores are representative of the whole-kidney section in the kidney TMA slide.
Physiological or Pathophysiological Alterations and Protein Expression
Renal cortical COX-2 stimulates renin biosynthesis and release (Harris et al. 2004). Renin plays a key role in regulating salt and water homeostasis and hypertension by increasing the production of angiotensin II. Expression of renal cortical COX-2 and renin is regulated by salt restriction or by inhibition of the renin angiotensin aldosterone system (Harris et al. 2004). Cortical COX-2 expression in rat kidney was upregulated by treatment with a low-salt diet (2.91 ± 0.67-fold of control, n=4), adrenalectomy (5.92 ± 1.86-fold of control, n=4), the angiotensin-converting enzyme inhibitor, captopril (2.89 ± 0.46-fold of control, n=4), or the angiotensin II type I (AT1) receptor antagonist candesartan (5.61 ± 0.71-fold of control) (Figures 2G and 2I–2L) (Zhang et al. 1999, 2006).
Renal renin is predominantly expressed in the juxtaglomerular cells, granular smooth-muscle–like cells in the afferent arteriole (Harris et al. 2004). Renal renin expression in adult mice was upregulated in response to a low-salt diet (3.04 ± 0.52-fold of control, n=4) or candesartan (2.65 ± 0.31-fold of control, n=4) (Figures 3G–3I).
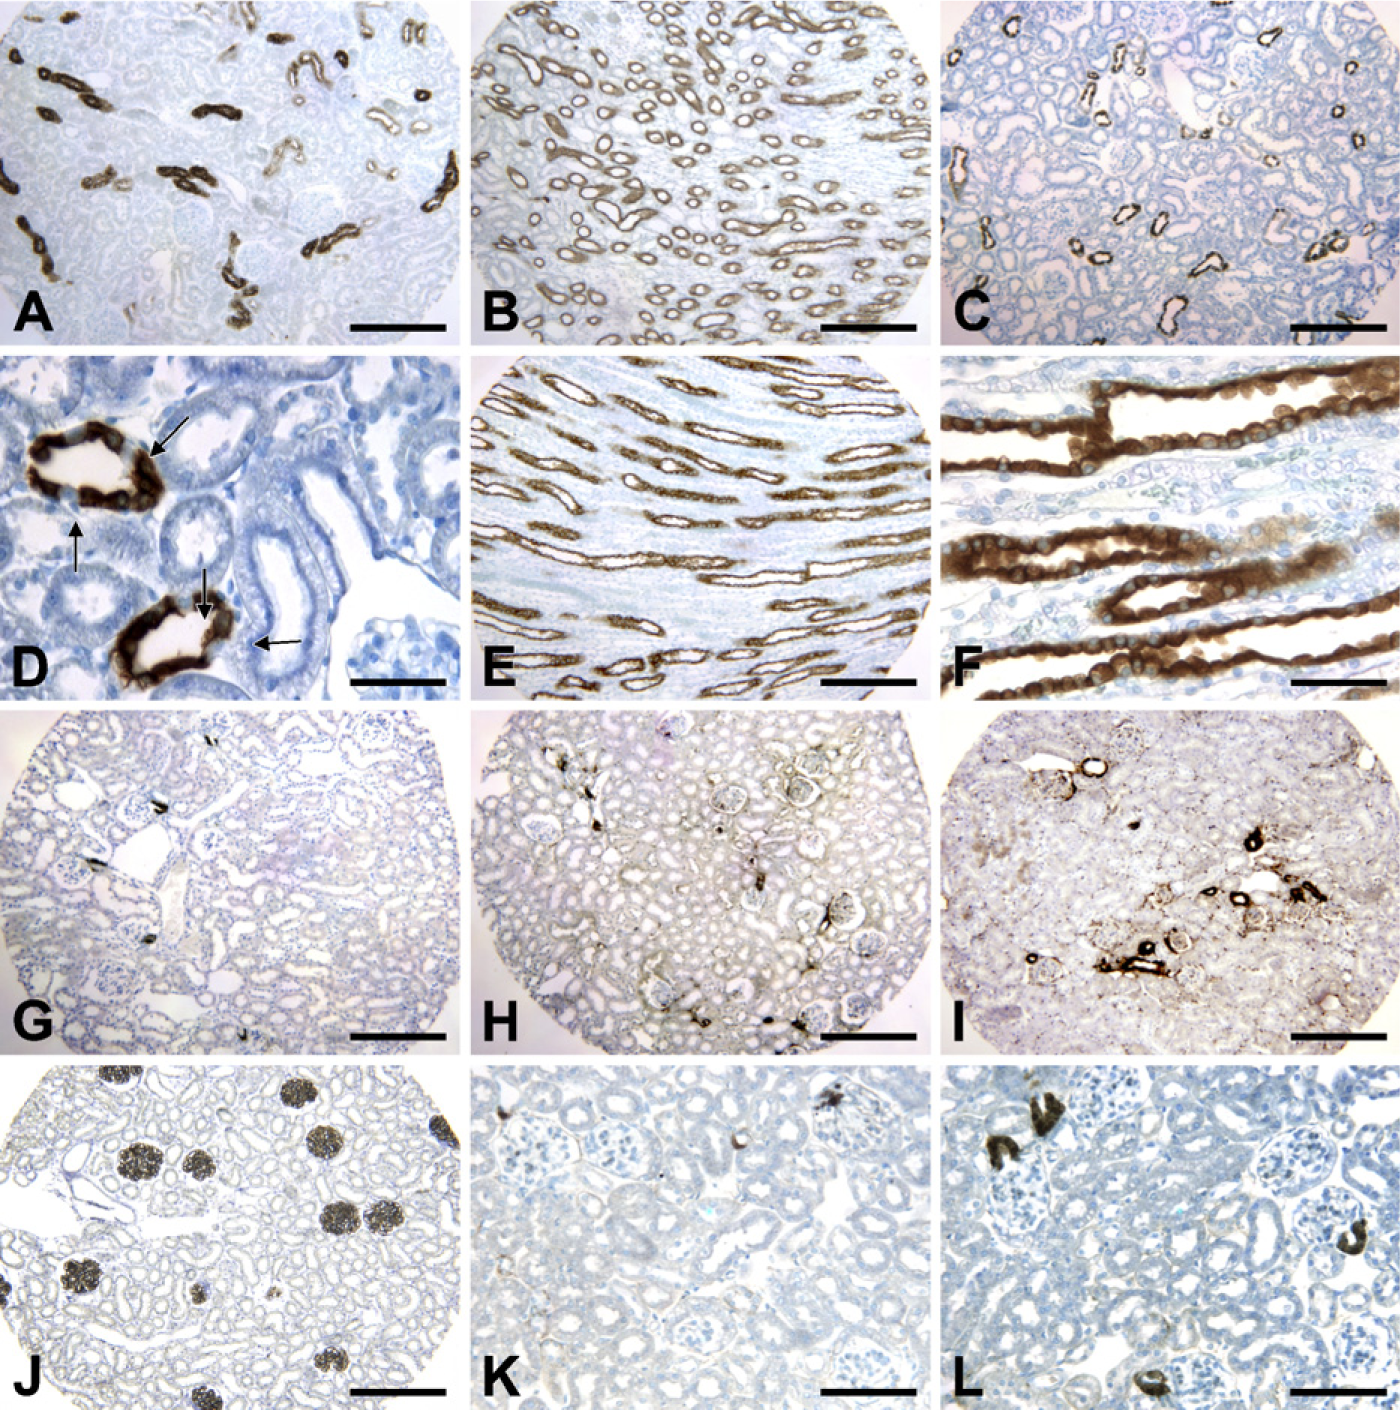
Tamm Horsfall protein immunostaining in rat kidney cortex (
FPAS Fixation and Immunofluorescence
In FPAS-fixed, low-salt–treated rat kidney cortex, strong COX-2–immunofluorescent staining was detected in the macula densa and cortical thick ascending limbs with low background (Figures 2N and 2O). In FPAS-fixed normal adult mouse kidney, synaptopodin-immunofluorescent staining was restricted to podocytes (Figure 2P).
Elevation of CTGF Expression in Mouse Kidney With AT1 Receptor Antagonism
CTGF has been implicated in the development of renal fibrosis (Chen et al. 2009). In our kidney TMA slides, CTGF expression was minimal in normal adult mouse kidney (Figure 3K). Unexpectedly, CTGF expression was increased dramatically in the afferent arteriole in mouse kidney treated with the AT1 receptor antagonist, candesartan (6.81 ± 1.67-fold of control, n=4) (Figure 3L).
Discussion
In the current study, we report the successful construction of TMA blocks from archival rodent kidneys and demonstrate their potential application to kidney research. We have demonstrated: (1) the application of TMA technology to the evaluation of the expression and localization of representative proteins known to be expressed in distinct locations in the kidney and to be regulated in response to developmental and or physiological maneuvers; (2) high reproducibility of immunostaining results between replicate cores; (3) evidence that the immunostaining patterns can be quantified using image analysis systems; (4) evidence that results from individual cores are likely to be representative of the whole-kidney section; and (5) an unexpected CTGF upregulation in afferent arterioles after treatment with an AT1 receptor antagonist.
(
The major criticism of TMA technology relates to whether a small fraction of a tissue specimen will represent the entire specimen (Rimm et al. 2001; Torhorst et al. 2001; Su et al. 2006). Such a potential limitation is especially true for the kidney, which is an organ that is highly heterogeneous in structure. Therefore, we have conducted multiple validation studies to optimize the sampling strategy. First, the kidney was divided into three separate sections: cortex, outer medulla, and inner medulla, according to structural and functional characteristics. These three sections could represent the kidney as a whole. Second, the number of individual cores from each donor was increased. Generally, three cylinders have been targeted from each donor block in cancer TMAs. To maximize the representation of the individual cores for the whole-kidney section, four areas were targeted from each section of kidney samples.
The second issue to be considered when constructing a kidney TMA block is that the protein expression of some molecules in the kidney is developmentally regulated. To facilitate the investigation of the developmental expression of target proteins, rat kidney cortex samples from newborn (P0), young (P14, P28), adult (3 months), and older (1 year) rats were included in the TMA block. As indicated in Figure 2, many COX-2–positive cells were found in neonate and young rat kidneys (Figures 2A, 2B, 2E, and 2F); only scattered COX-2–positive cells were found in adult rat kidneys (Figure 2G); and no COX-2–positive cells were found in old rat kidney (Figure 2H).
Optimal immunostaining requires appropriate tissue fixation. Formalin has been widely used, particularly in clinical investigation. However, some antibodies do not work in formalin-fixed kidneys even after antigen retrieval. We have long experience in investigating the effect of kidney fixation on immunostaining and have developed a practical protocol to determine the fixative(s) that are best suited for a specific antibody in kidney immunostaining (McKanna and Zhang 1997). We have found that in most cases, kidney sections fixed with FPAS, GPAS, formalin, or 4% paraformaldehyde will work for most commercially available or investigator-generated antibodies. For example, there was strong COX-2 immunostaining with minimal background staining in FPAS-fixed kidneys (Figure 2A), whereas GPAS-fixed kidneys gave strong staining but significant background staining (Figure 2B), and staining was weak in kidneys fixed with formalin or para-formaldehyde (Figures 2C and 2D). Moreover, antigen retrieval is still needed for some antibodies, for example, for the synaptopodin immunohistochemical and immunofluorescent staining indicated in the current study.
In addition to immunohistochemistry, kidney tissues fixed with FPAS are suitable for immunofluorescent staining and demonstrate low background immunofluorescence (Figures 2N–2P). Of note, kidney tissues fixed with GPAS are also suitable for in situ hybridization, as shown in our previous reports (Zhang et al. 1997,1999).
In the kidney, the expression of many important molecules varies in response to different physiological and pathophysiological conditions. For example, kidney COX-2 expression is altered in response to different stimuli (Harris et al. 1994, 2004; Zhang et al. 1997, 1999, 2002, 2003, 2004, 2005, 2006, 2009; Yao et al. 2005, 2006). Our kidney TMA blocks included mouse and rat kidneys with different treatments, among them low-salt diet, high-salt diet, adrenalectomy, and antagonism of the renin angiotensin aldosterone system.
To investigate the variation in immunostaining among individual cores and to determine whether immunostaining in individual cores can represent immunostaining in the whole-kidney section, COX-2 expression in the individual cores of P14 and P28 rat kidney cortex was quantitated with an image analysis system. As indicated in Figure 4, the variation of the value of COX-2 immunostaining area vs core area from individual cores was small. Of note, the ratio of cortical COX-2 expression in P14 rat kidney vs P28 rat kidney was similar to previous reports obtained from whole kidney (Zhang et al. 1997).
CTGF is an important mediator and marker of renal fibrosis. Angiotensin II has been shown to stimulate CTGF expression, and either angiotensin-converting enzyme inhibition or antagonism of AT1 receptors has been shown to reduce renal CTGF expression and to attenuate the development of diabetic nephropathy (Chen et al. 2009; Phanish et al. 2009). Surprisingly, using our kidney TMA, we found that AT1 receptor antagonism increased CTGF expression in juxta-glomerular cells in adult mouse kidney (Figure 3L). Renin has been reported to stimulate the expression of transforming growth factor β (TGF-β) in mesangial cells through an angiotensin II–independent mechanism (Huang et al. 2006). TGF-β and its receptors have been reported to be highly expressed in juxta-glomerular cells (Horikoshi et al. 1991; Liu and Ballermann 1998). TGF-β stimulates CTGF expression. We speculate that juxtaglomerular cell CTGF elevation due to antagonism of AT1 receptors is secondary to increased renin, which in turn stimulates the TGF-β pathway, leading to CTGF elevation, but further studies will be required to test this hypothesis. However, this unexpected finding illustrates the potential value of such screens using TMA.
It should be pointed out that our TMA primarily provides a tool for screening protein expression profiles under different conditions. Under some conditions, whole-kidney sections may still have to be used to reflect a disease process that might be focally distributed, such as often occurs in glomerulonephritis and interstitial nephritis.
In summary, we have successfully constructed TMA blocks that contain kidney tissues with a variety of different categories useful for determining the expression patterns of proteins of interest. The potential influences of kidney structural heterogeneity, development, and fixation, and of certain treatments in the expression of immunoreactive proteins, can be simultaneously addressed with such slides. Although TMA techniques have been used in renal cell cancer research (Li et al. 2007), and TMA slides of normal rat or mouse kidney are available commercially, this is the first report of the construction and demonstration of the potential utility of TMA slides that express a variety of different physiological and pathophysiological renal conditions. Therefore, our kidney TMA slides should provide a new tool for nephrology research exploring the expression and function of known or novel proteins of interest in the kidney.