
Abstract
The organization of F-actin in the ventricular system has been reported to display pronounced regional differences with respect to shape, size, and development. However, the real roles played by F-actin in these cells cannot be understood unless the precise localization of F-actin is defined. In the present study, we used double-fluorescence labeling to further examine the localization of F-actin in the ependymocytes and its spatial relation to the other two cytoskeletal components, microtubules and intermediate filaments. Then we converted fluorescence signals for F-actin to peroxidase/DAB reaction products by use of a phalloidin-based FITC-anti-FITC system. This detection technique provided an overview of the distribution of F-actin in the ependymocytes at the ultrastructural level, and has been proven to be helpful in correlating light and electron microscopic investigations.
T
The apical surface of ependymocytes, like that of other epithelial cells, is covered with a varying number of cytoplasmic protrusions, such as cilia and microvilli. It is well known that microvilli contain a core of F-actin, which extends from the tips of microvilli downward into the apical cytoplasm and is anchored to a circumferential network of F-actin, the terminal web (Hirokawa et al. 1982; Hagen and Trier 1988). Although previous electron microscopic (EM) examinations have demonstrated the presence of microfilaments in the apical regions of ependymocytes (Brightman and Palay 1963; Kohno 1969; McNutt 1978; Bruni and Reddy 1987), it is still difficult to imagine how F-actin is organized into a ring-like structure in the central canal but an uninterrupted belt-like network in the choroid plexus.
Although the most abundant cytoskeletal component, F-actin is extraordinarily difficult to study by morphological techniques because of its small size and its sensitivity to fixation and dehydration (Small 1981; Hirokawa et al. 1982). At present, phalloidin, a mushroom-derived toxin, is widely acknowledged as a highly specific probe for F-actin because it recognizes filamentous actin but not free actin monomers (Wulf et al. 1979). Correspondingly, a few methods using this probe have been previously developed to study the ultrastructural organization of F-actin (Lachapelle and Aldrich 1988; Castellani-Ceresa et al. 1991,1992; Deerinck et al. 1994; Capani et al. 2001). Several researchers have reported the use of an FITC-anti-FITC system to detect F-actin at the EM level (Castellani-Ceresa et al. 1991,1992). This F-actin detection method was employed here, because both FITC-conjugated phalloidin and anti-FITC antibodies are now commercially available. Moreover, FITC-labeled materials and protocols can be used for both light microscopy and EM studies (van Dam et al. 1991), thereby serving the purpose of this study.
In the present study, we used double-fluorescence labeling to further examine the localization of F-actin and the spatial relation of F-actin to the other cytoskeletal components in ependymocytes. Thereafter, we tried to convert fluorescence signals for F-actin to peroxidase/DAB reaction products by incubating the FITC-labeled sections with a biotinylated anti-FITC antibody followed by enhancement using the avidin–biotin–peroxidase complex (ABC) method. The central canal and choroid plexus were used here because they have been widely studied and well defined at the EM level.
Materials and Methods
Animals
A total of seven female adult Sprague-Dawley rats (400–450 g; CLEA Japan Ltd., Tokyo, Japan) were used in the present study. This choice was approved by the RIKEN Experimental Animal Committee. The work was performed in accordance with the Guide for the Care and Use of Laboratory Animals (National Academy Press, Washington, 1996).
Fluorescence Microscopic Studies
Three rats were perfused through the heart with 50 ml physiological saline under diethyl ether anesthesia, followed by 200–300 ml 4% paraformaldehyde in 0.1 M phosphate buffer (PB), pH 7.4. Cervical segments of spinal cord and diencephalons containing diencephalic choroid plexus were dissected out, postfixed in the same fixative for 2–6 hr at 4C, and then washed in a series of cold sucrose solutions of increasing concentration. The samples were embedded in OCT compound (Tissue-Tek; Sakura Finetek Japan Co. Ltd., Tokyo, Japan), frozen on dry ice, then cut into 40-μm-thick transverse sections using a freezing microtome (Yamato, Japan).
Immunohistochemistry was performed on free-floating sections. The cryosections were preincubated with 3% normal goat serum in 0.1 M PB containing 0.1% Triton X-100 for 30 min at room temperature and then incubated with primary antibodies overnight at 4C. A monoclonal anti–α-tubulin antibody (Clone DM1A; Sigma Chemical, St. Louis, MO) was used to examine microtubules. A monoclonal anti-vimentin antibody (Clone V9; Sigma) was used to detect vimentin intermediate filaments. A guinea pig polyclonal antibody against cytokeratins 8/18 (GP11; PROGEN Biotechnik GmbH, Heidelberg, Germany) and a monoclonal anti–pan cytokeratin mixture (of clones C-11, PCK-26, CY-90, KS-1A3, M20, and A-53-B/A2; Sigma) were used to examine cytokeratin intermediate filaments. As control, the primary antibodies were replaced with 0.1 M PB.
After several washes with 0.1 M PB, the sections were reacted with Alexa Fluor-conjugated secondary antibodies (Molecular Probes; Eugene, Oregon) and 2 μg/ml FITC-conjugated phalloidin (p5282; Sigma) in 0.1 M PB for 1 hr, and then reacted with 0.5 μg/ml 4'-6-diamidino-2-phenylindole (DAPI; Nacalai Tesque, Kyoto, Japan) in 0.1 M PB for 5 min at room temperature. The Alexa Fluor-conjugated secondary antibodies used here included Alexa 594–conjugated goat anti-guinea pig IgG antibody for guinea pig anti-cytokeratin 8/18 antibody and Alexa 594–conjugated goat anti-mouse IgG antibody for monoclonal anti–α-tubulin antibody, monoclonal anti-vimentin antibody and anti–pan cytokeratin antibody. DAPI was used here to stain the nucleus.
The sections were mounted onto glass slides with Immu-Mount (Shandon; Pittsburgh, PA), and examined with a laser scanning confocal microscope (Olympus FV1000; Olympus, Tokyo, Japan) under excitation wavelengths of 358 nm for DAPI, 488 nm for FITC, and 594 nm for Alexa 594, respectively.
EM Detection of F-actin
Four rats were fixed and dissected as described above. Cervical segments of spinal cord and diencephalons were postfixed in fresh fixative for 4–6 hr, then left in 0.1 M PB containing 5% sucrose overnight at 4C. The samples were cut into 50-μm-thick sections on a DSK microslicer (DTK-1000; Ted Pella, Dosaka EM, Kyoto, Japan).
Some sections were pretreated with 3% H2O2 in 0.1 M PB for 30 min before blocking to extinguish endogenous peroxidase. The blocking solution contained 0.5% bovine serum albumin (Sigma), 0.1% cold-water fish gelatin (Sigma), and 0.02% saponin (Nacalai Tesque) in 0.1 M PB (pH 7.4). Blocking for 1 hr was followed by an overnight incubation with 4 μg/ml FITC-conjugated phalloidin in 0.1 M PB rinse buffer (pH 7.4), containing 0.1% cold-water fish gelatin and 0.02% saponin, at 4C.
After thorough washes, the sections were mounted onto glass slides with a drop of 0.1 M PB, and examined at 488-nm excitation with the Olympus confocal laser microscope. Thereafter, the sections were soaked in 0.1 M PB, and removed from the glass slides. After additional washes, the sections were incubated with biotinylated mouse anti-FITC antibody (1:50, Clone FL-d6; Sigma) in 0.1 M PB rinse buffer for 2 days at 4C, and then processed with ABC for 1 hr at room temperature, according to the manufacturer's instructions (Vectastain ABC Kit; Vector Laboratories, Burlingame, CA). The sections were stained for peroxidase activity by preincubation in 0.05% DAB (Sigma) in 0.05 M Tris-HCl buffer (pH 7.2). After 30 min, the incubation medium was exchanged for fresh DAB solution containing 0.01% H2O2 and incubated on a shaker for an additional 15 min. The peroxidase/DAB reaction was stopped by three 10-min washes in 0.05 M Tris-HCl buffer followed by three more 10-min washes in 0.1 M PB.
The specificity of the staining for F-actin was verified by incubating sections by omitting FITC-conjugated phalloidin and by omitting the anti-FITC antibody. DAB-stained sections were photographed using a light microscope equipped with a digital camera (Eclipse; Nikon, Tokyo, Japan).
Some DAB-stained sections were fixed in 2.25% glutaraldehyde in 0.1 M PB containing 0.2% tannic acid for 1 hr, and then postfixed with 0.75% OsO4 in 0.1 M PB (pH 6) for 1 hr at 4C. This treatment has been recommended to protect F-actin from destabilizing during osmication and dehydration (Fifková and Delay 1982; Capani et al. 2001). After a brief wash with distilled water, the DAB sections and some unstained sections were dehydrated in increasing concentrations of ethanol and embedded in Epon 812.
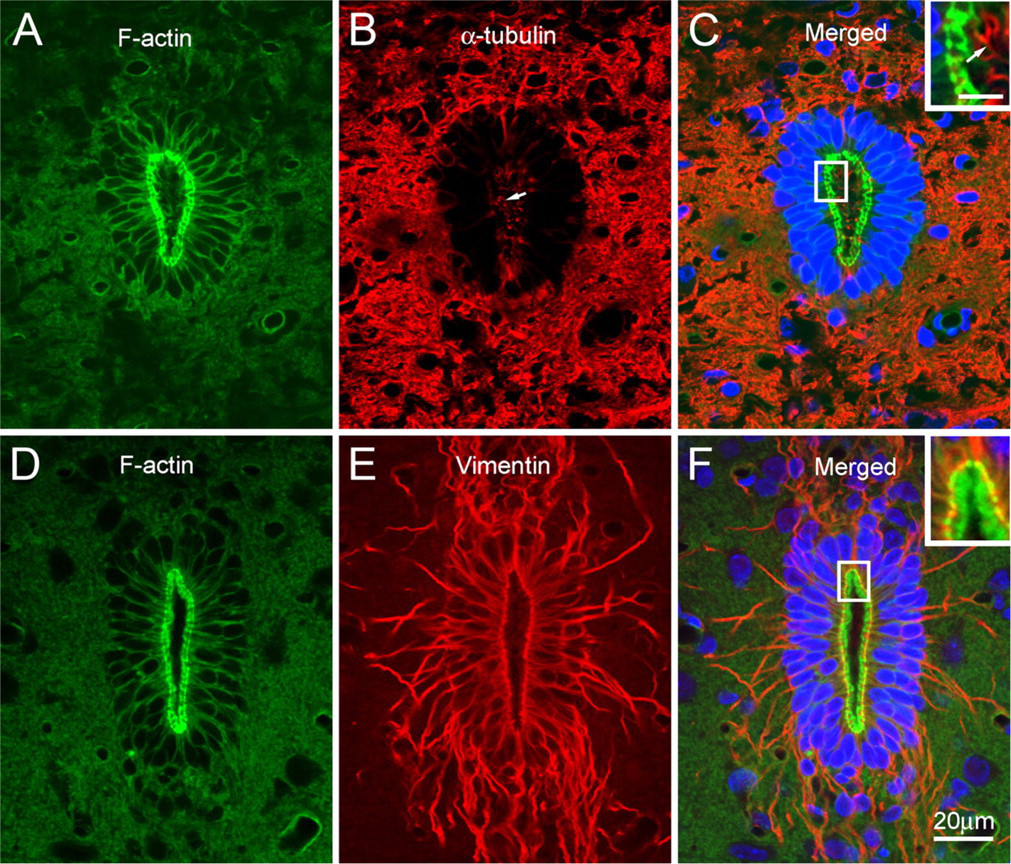
Fluorescence microscopic localization of F-actin, α-tubulin, and vimentin in the central canal. The ependymocytes of the central canal contain peripherally distributed F-actin
Ultrathin sections ≃100 nm thick were cut on an ultracut E ultramicrotome (Reichert-Jung Optische Werk AG; Wien, Austria), and collected on Formvar-coated slot grids. Ultrathin sections from the unstained samples were stained with 4% uranyl acetate and 0.3% lead citrate, and examined with a transmission electron microscope (Tecnai 12; FEI, Hillsboro, OR). The DAB-labeled samples were examined without heavy metal contrasting. EM images were recorded on Image Plates (FujiFilm; Tokyo, Japan), which were scanned with Fujifilm FDL 5000 and converted into digital images with the software program Image Gauge V4.0 (FujiFilm).
Results
Fluorescence Microscopic Studies on F-actin, Microtubules, and Intermediate Filaments in the Ependymocytes
In the central canal, the apical region of the ependymocytes was intensely stained with FITC-conjugated phalloidin (Figures 1A and 1D). In transversely cut sections, apically localized F-actin formed a ring-like structure, surrounding the lumen of the central canal. Fluorescence signals were also observed less intensely along the lateral cell margins.
α-Tubulin in the central canal was located mainly in the cytoplasmic protrusions of ependymocytes (Figure 1B). Double labeling showed that the positive structures protruding into the lumen did not contain F-actin (Figure 1C). Cytokeratins were not demonstrated immunocytochemically in the central canal with either anti-cytokeratin 8/18 or anti–pan cytokeratin antibodies (not shown). Instead, vimentin was found as the major intermediate filamentous component (Figure 1E). Apically localized vimentin filaments ran circumferentially beneath the apical F-actin network, and partially overlapped in the outer boundary of the F-actin ring (Figure 1F). From this circumferential network, vimentin filament bundles radiated into the subependymal zone and formed a root-like structure.
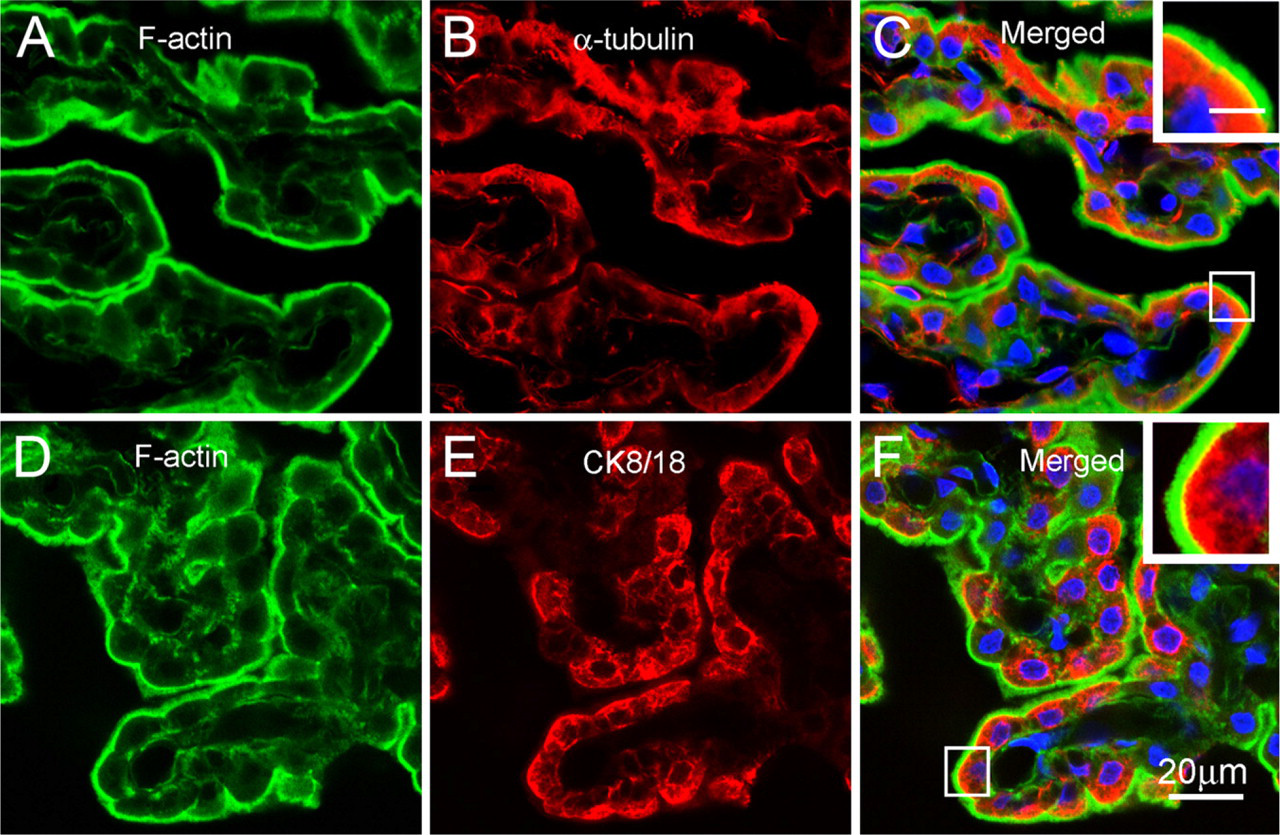
Fluorescence microscopic localization of F-actin, α-tubulin, and vimentin in the choroid plexus. In the choroid plexus, F-actin is localized predominantly in the apical region, appearing as a bright uninterrupted belt along the luminal surface
In the choroid plexus, FITC–phalloidin staining revealed a smooth and uninterrupted bright belt along the apical border (Figures 2A and 2D). The cytoplasm of the ependymocytes was rarely stained, but there were a few fluorescence signals in the stroma of the choroid plexus. The perinuclear cytoplasm of the choroidal ependymocytes was intensely labeled with anti–α-tubulin antibody (Figure 2B), but protrusions positive for α-tubulin were rarely observed on the luminal surface of the choroid plexus (Figure 2C). Cytokeratins 8/18 were found as the main intermediate filamentous component in the choroid plexus, and were localized in the perinuclear cytoplasm of the choroidal ependymocytes (Figure 2E). On the other hand, positive signals for vimentin were observed only in the stroma but not in the choroidal ependymocytes (not shown). Double labeling showed that both α-tubulin and cytokeratins were distributed beneath the apical F-actin network, with a partial colocalization with F-actin in the periphery of the apical F-actin network (Figures 2C and 2F).
EM Localization of F-actin in the Ependymocytes
By use of a phalloidin-based FITC-anti-FITC method, fluorescence labeling of F-actin was converted to a DAB reaction product visible by light microscopy. The overall distribution of reaction products for F-actin agreed well with that obtained by FITC-conjugated phalloidin staining and confocal microscopy (Figures 3 and 4). The specificity of this conversion was further confirmed by omitting FITC-conjugated phalloidin (Figures 3A and 3E) or by omitting the anti-FITC antibody (Figures 3B and 3F) in the immunostaining procedure.
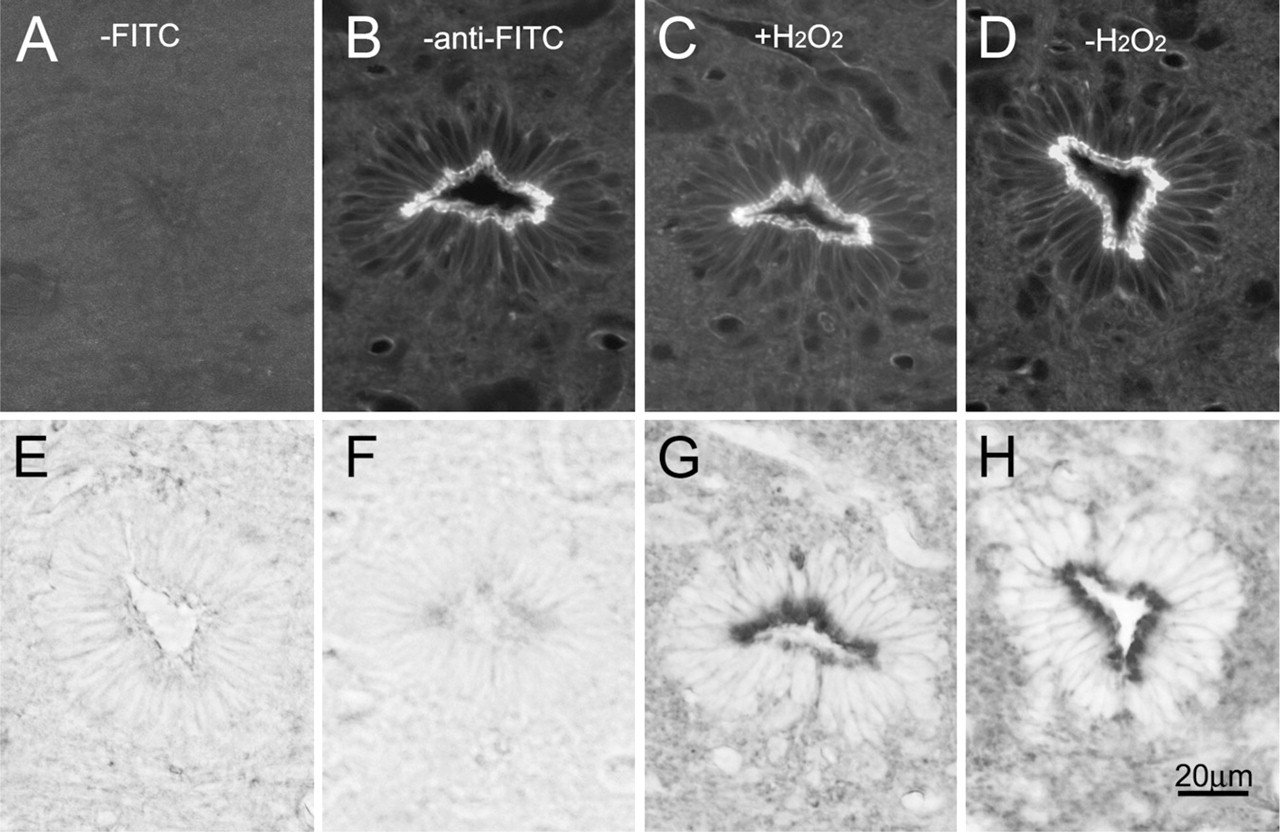
Comparison of F-actin staining in the central canal between fluorescence and light microscopic images. The panels in the upper and lower row show fluorescence and light microscopic images, respectively. It is worth mentioning that confocal laser scanning microscopy can visualize F-actin clearly with no interference due to out-of-focus noise.
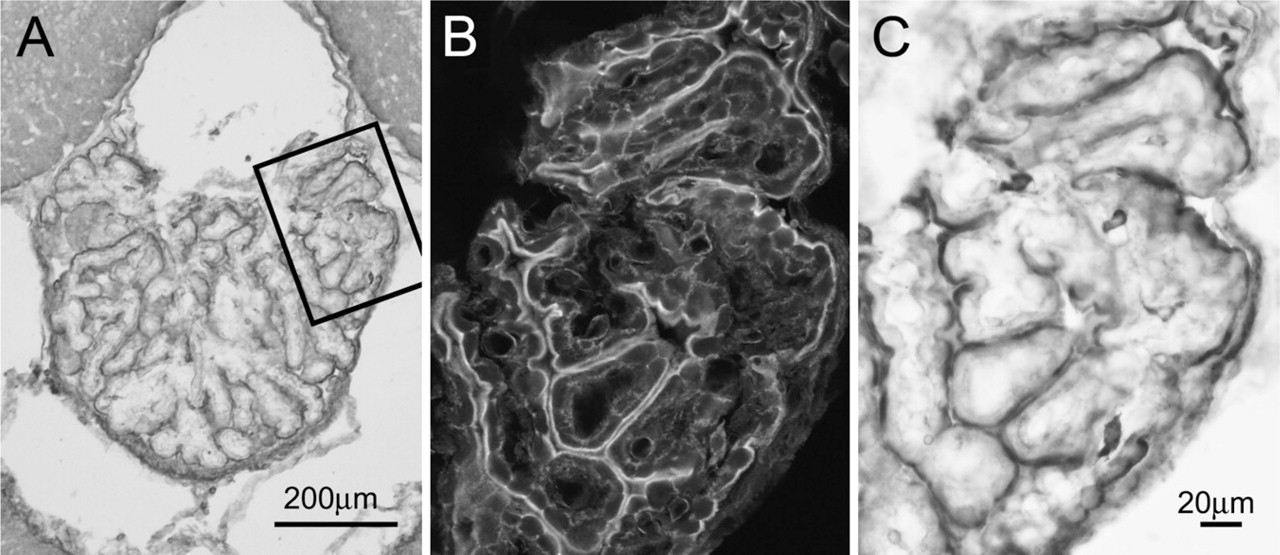
Comparison of F-actin staining in the choroid plexus between fluorescence and light microscopic images.
The apical region of the ependymocytes was intensely labeled with peroxidase/DAB reaction products in both the central canal (Figure 3) and the choroid plexus (Figure 4). As observed by confocal microscopy, the lateral cell margins in the central canal showed less-intense staining. Almost no discernable differences in the distribution of F-actin were noted in the samples pretreated with (Figures 3C and 3G) and without H2O2 (Figures 3D and 3H); however, the use of hydrogen peroxide often resulted in the folding of sections. Therefore, the results obtained from the samples without H2O2 treatment were presented here. Alternatively, unstained samples were used as negative control.
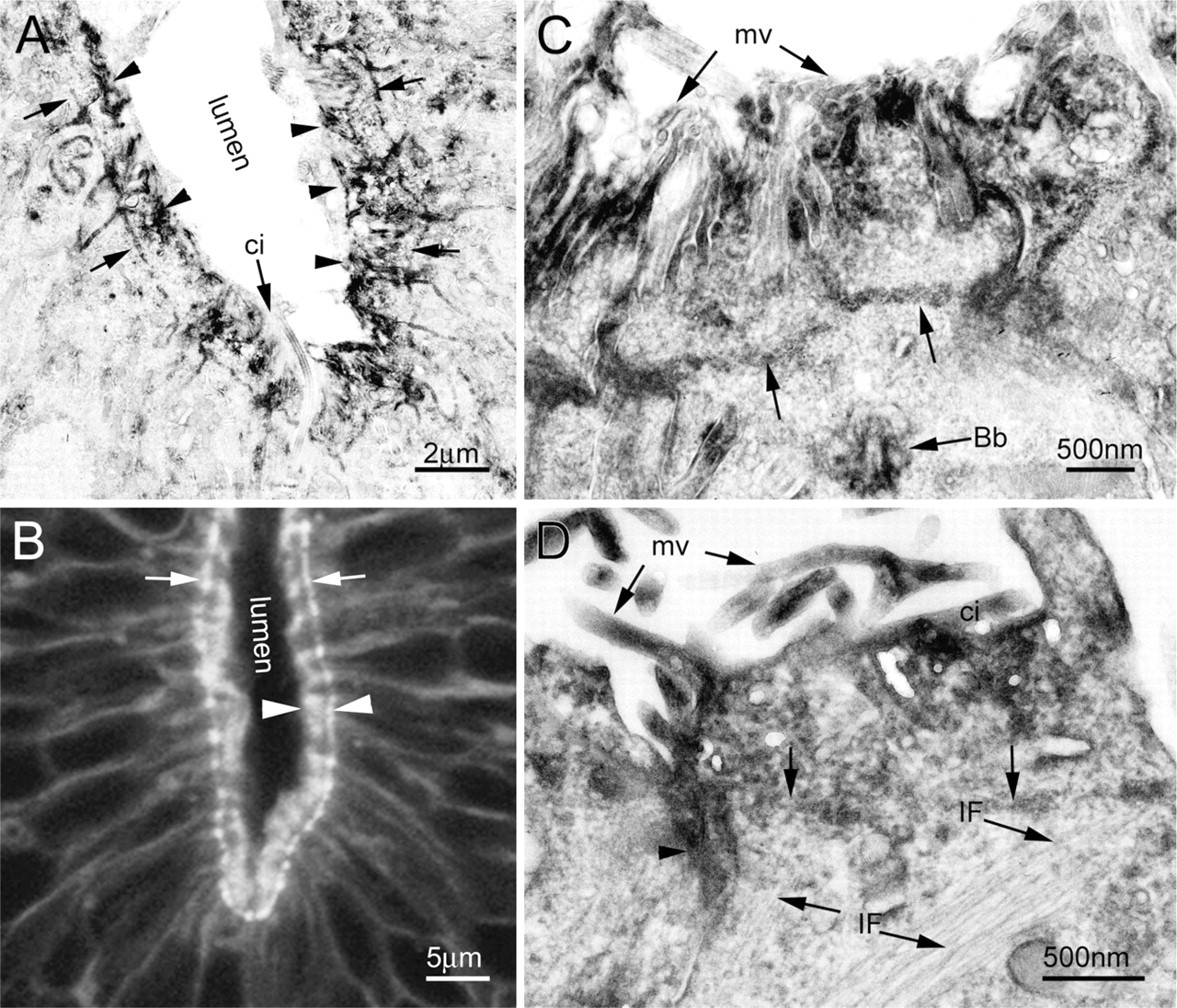
Under the electron microscope, the reaction products for F-actin were localized mainly in the apical aspects in the central canal (Figure 5). Microvilli were intensely labeled from the tip downward into the apical cytoplasm. Beneath the microvilli, there was an intensely labeled F-actin network running circumferentially and associated with the cytoplasmic sides of intermediate junctions (Figures 5A, 5C, and 5D). The cytoplasmic sides of intermediate junctions showed a darkened thickening (arrowhead in Figure 5D).
By comparing fluorescence and EM images, the circumferential F-actin network, the so-called terminal web, was found as the structural equivalent of the outer boundary of the F-actin fluorescence ring, whereas the width of the fluorescence ring defined at the light microscopic level was shown to be the distance between the terminal web and the tip of the microvilli (Figures 5A and 5B).
Not the whole cytoplasm between microvilli and the terminal web was completely labeled. The distal portion of cilia protruding into the lumen was rarely stained (Figure 5A), but basal bodies displayed a darkened appearance (Figure 5C). Intermediate filaments were unlabeled, but they were found to frequently loop up and connect to the circumferential F-actin bundles (Figure 5D).
On the other hand, no labeling was found in the negative control, although the terminal web was also visible in the apical region of the central canal (Figure 6). Blood vessels of various sizes present in the gray matter of the spinal cord showed complete labeling for F-actin under the confocal microscope, and were therefore used as positive control. Examination of capillaries at the ultrastructural level revealed continuous intense labeling in the luminal border of endothelial cells (Figure 7).
In the choroid plexus, microvilli were intensely labeled, whereas staining was relatively rare in the remaining cytoplasm (Figure 8A). The choroidal ependymocytes were characterized by a large number of pleomorphic microvilli that showed bulbous ends at their apexes. F-actin labeling was found along the length of the microvilli, but was often absent at the center of their bulbous ends. Cilia or junctional membrane thickenings were rarely encountered. Although there was patchy staining extending beneath the microvilli at their bases, there was no appreciable terminal web beneath the microvilli (Figures 8B and 8C). These were also confirmed in the negative control (Figure 8D).
Discussion
The cytoskeleton in living cells is composed of three separate filamentous networks: microfilaments, microtubules, and intermediate filaments (Bray and White 1988; Hollenbeck et al. 1989). Fluorescence microscopic studies showed that F-actin shares a similar localization and arrangement in the central canal and choroid plexus in the rat. In both types of ependymocytes, the apical F-actin network is further associated with the underlying intermediate filaments. A similar phenomenon has already been noted in intestinal epithelial cells (Hirokawa et al. 1982). Because the F-actin–rich cortex is able to exert a pull on all components associated with it, the association between F-actin and intermediate filaments in the apical cytoplasm is suggested to play an important role in maintaining the integrity of epithelial cells (Bray and White 1988; Hollenbeck et al. 1989).
Ultrastructural localization of F-actin in the central canal. The electron microscopic (EM) image in
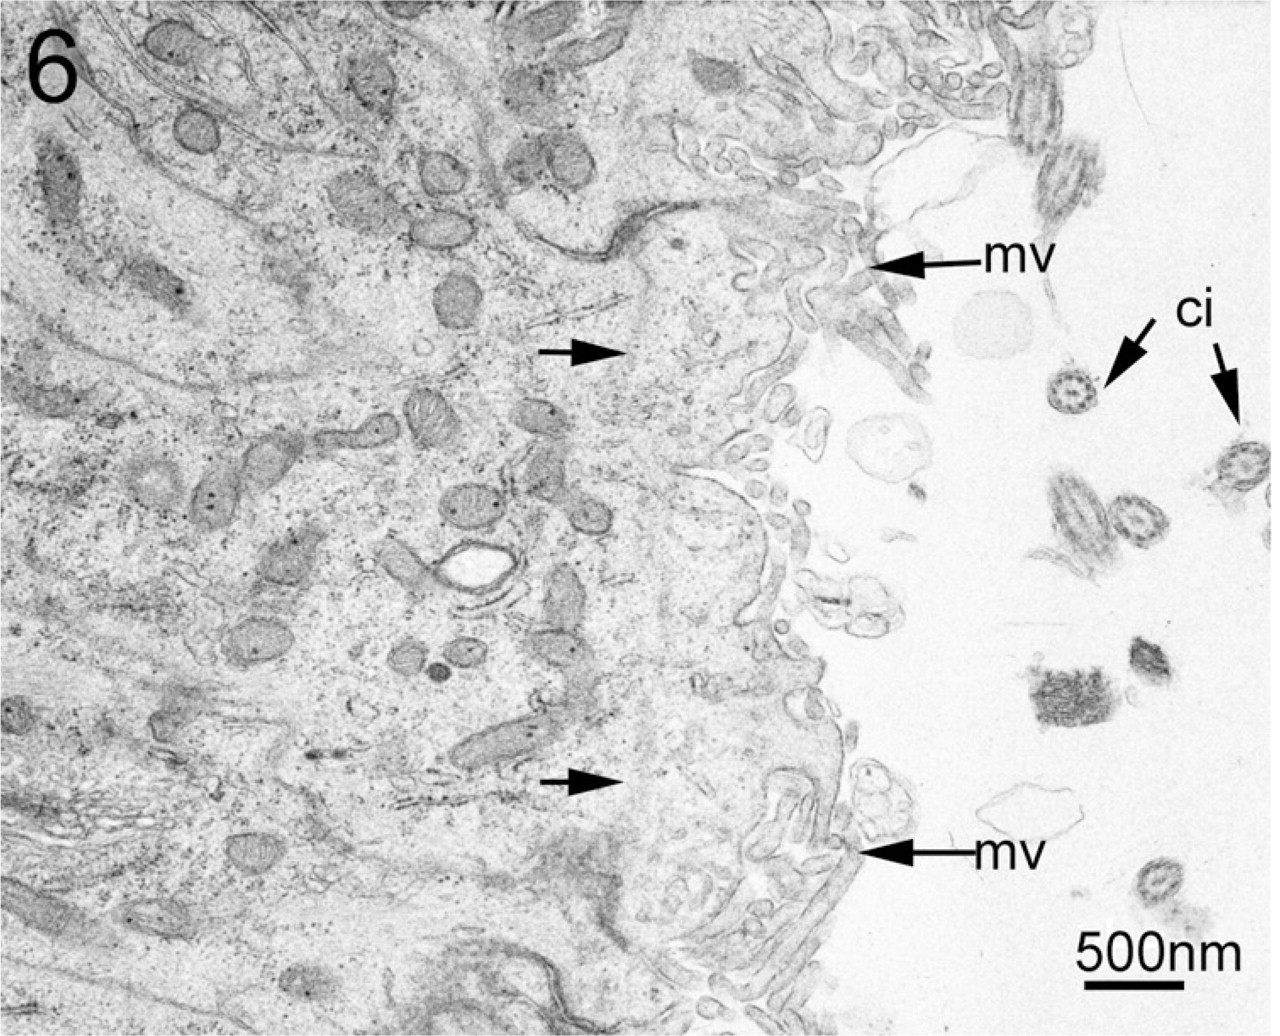
EM image from negative control. No labeling is found in the apical region of the central canal of the negative control. The apical surface of the ependymocytes is characterized by a profusion of microvilli (mv) and a varying number of cilia (ci, transverse-cut in this section). Terminal web (arrows) is discernable spanning between the neighboring junctions.
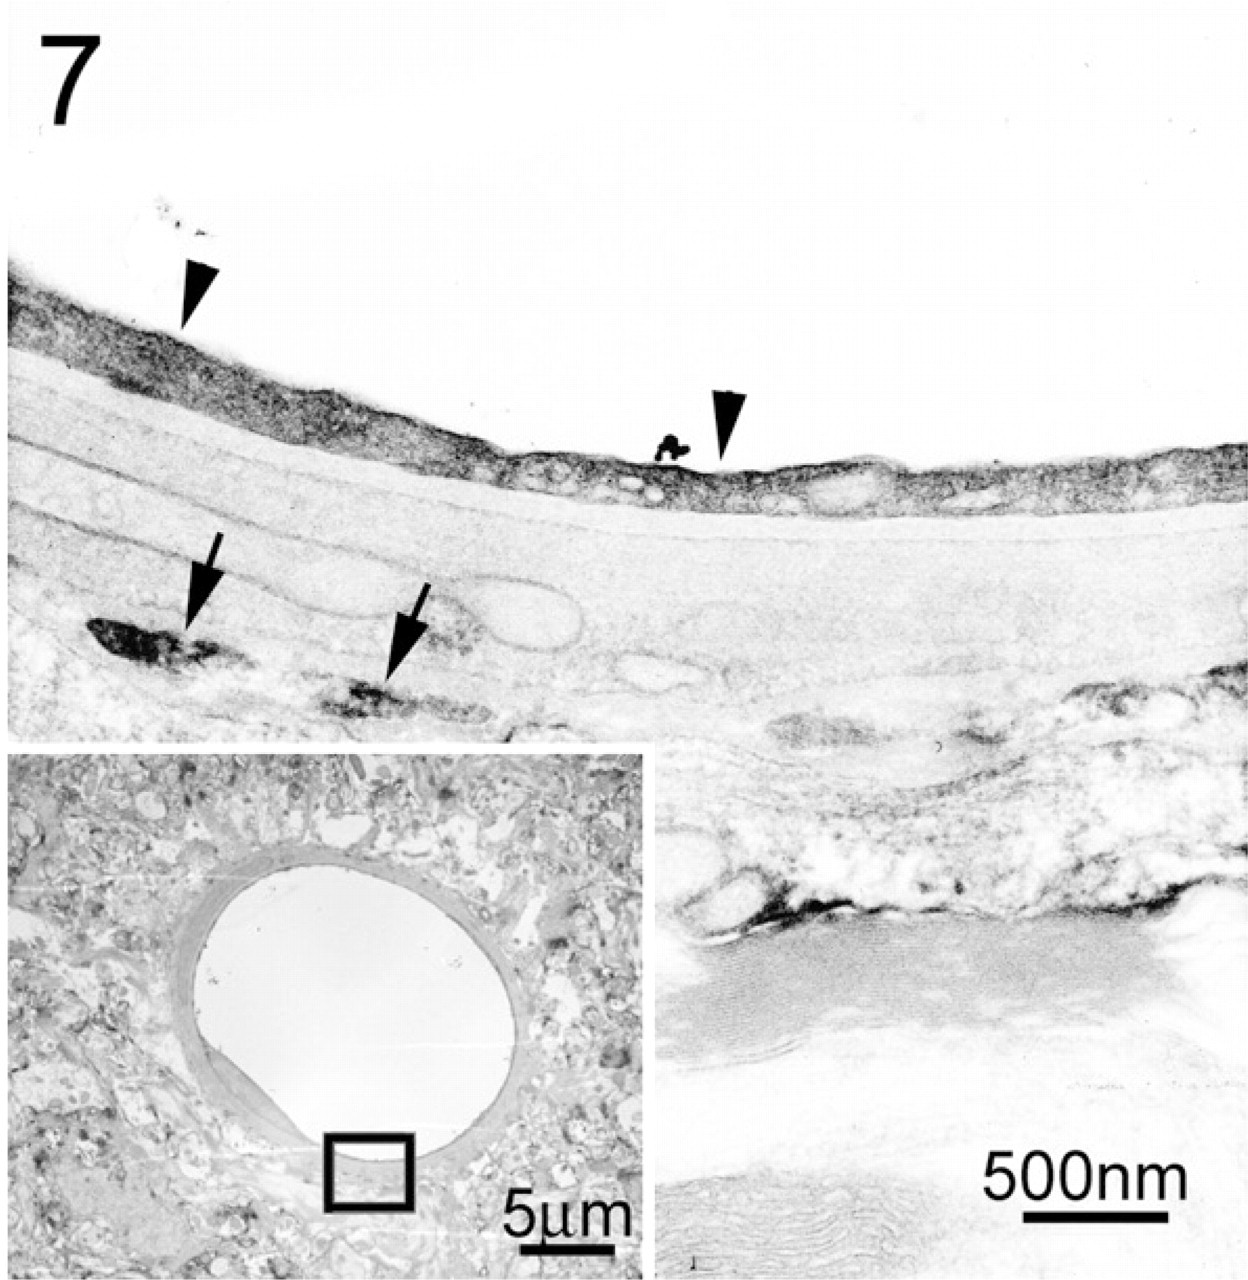
EM image showing a portion of a capillary (inset). Intense labeling for F-actin is seen continuously in the luminal border of the endothelial cell (arrowheads). Sporadic labeling is also observed in the perivascular glial endfeet (arrows).
On the other hand, there are several differences in the cytoskeletal composition and organization in the two types of cells. First and most important, the ependymocytes in the central canal contain only vimentin but not cytokeratin, unlike the choroidal ependymocytes, although both cytokeratins 8/18 and vimentin have been reported in the walls of the rat cerebral ventricles (Miettinen et al. 1986; Kasper 1992). Vimentin filaments are arranged into a polarized network in the central canal, whereas cytokeratins are more evenly distributed in the perinuclear cytoplasm in the choroidal ependymocytes. Second, microtubule-containing protrusions are much more abundant in the central canal, but rarely observed in the choroid plexus. This is consistent with the fact that choroidal ependymocytes are covered with sparse cilia (Del Bigio 1995). Moreover, although F-actin is localized predominantly in the apical cytoplasm of ependymocytes, the apical F-actin in the central canal has a ring-like appearance, apparently different from the smooth and uninterrupted organization of that in the choroid plexus.
To define more precisely the localization of F-actin, fluorescence labeling of F-actin was converted to peroxidase/DAB products by using the phalloidin-based FITC-anti-FITC technique. Subsequent examination of the DAB-stained sections by EM revealed that the distribution of reaction products displays the same pattern as the fluorescence signals for F-actin.
Consistent with the light microscopic observations, F-actin is localized predominantly on the luminal surface of both types of ependymocytes. In the central canal, microvilli and terminal web were found as the main components of the positive structures. F-actin bundles extend from the tip of microvilli downward into the apical cytoplasm, and are anchored to a circumferentially running F-actin network in the terminal web. It is such organization that gives rise to a ring-like appearance in the central canal. In the choroid plexus, however, no apparent terminal web is observed beneath microvilli, whereas intensely labeled microvilli are more densely arranged on the apical surface. Comparison of fluorescence and EM images suggested that the width of the apical F-actin network reported previously can be accounted for largely by the height of the microvilli.
Microvilli and terminal web are known as F-actin-rich structures in ciliated epithelial cells (Hirokawa et al. 1982; Hagen and Trier 1988). Although the presence of microfilaments has already been ultrastructurally demonstrated in the apical cytoplasm of ependymocytes (Brightman and Palay 1963; Kohno 1969; McNutt 1978; Bruni and Reddy 1987), the ultrastructural findings presented here have been successfully correlated to the light microscopic results, therefore making it possible to infer the functional meaning of the apical F-actin network reported in the ventricular system.
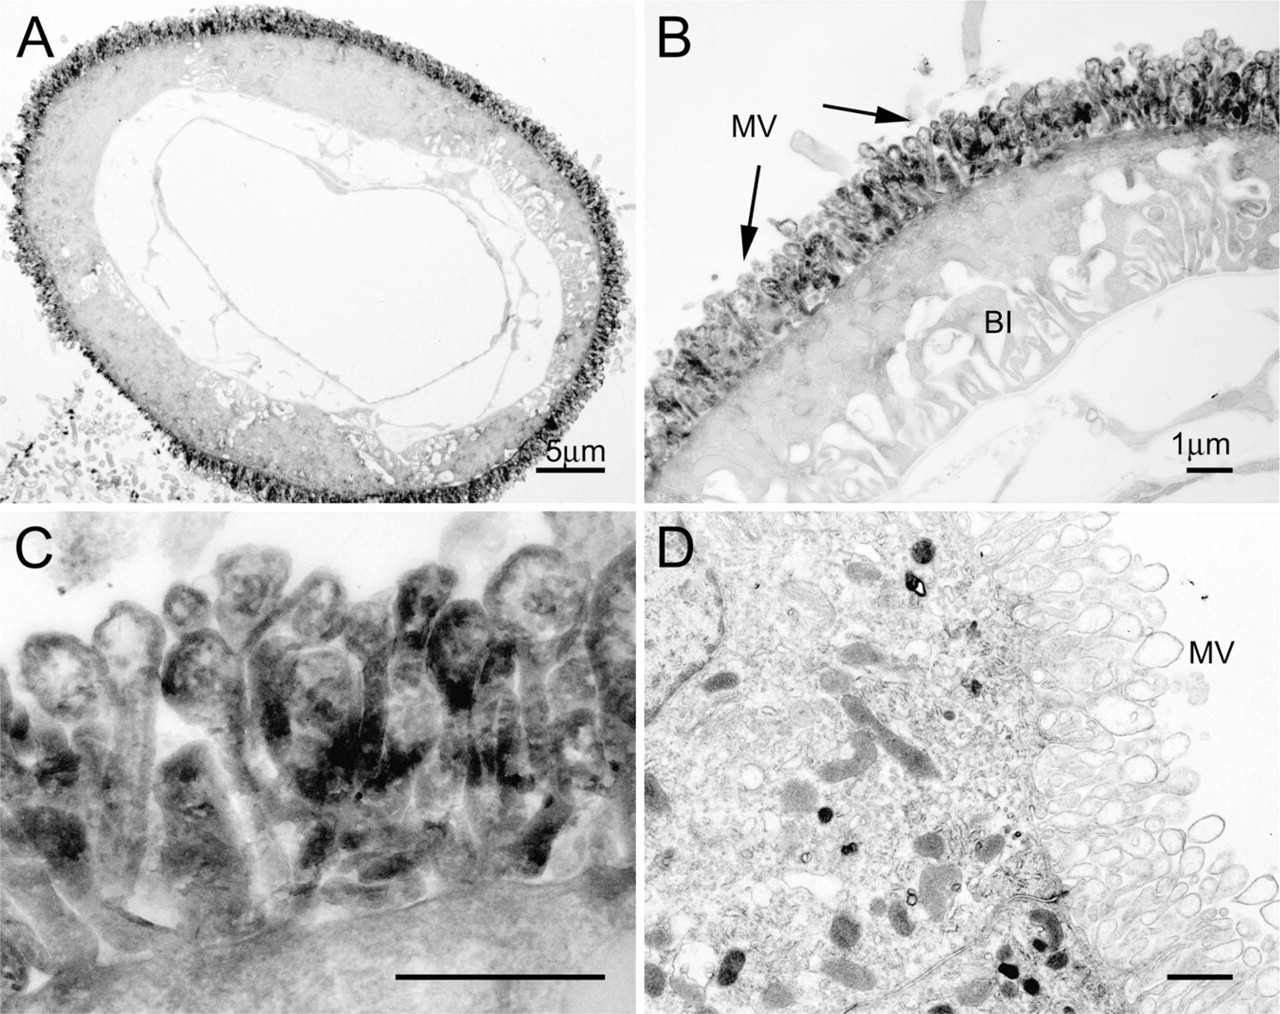
EM images showing the localization of F-actin in the choroid plexus. The apical regions of the choroid ependymocytes are intensely stained with the peroxidase/DAB reaction products, whereas the staining is relatively rare in the remaining cytoplasm
In adult rats, we previously described a regionally varying F-actin network along the apical surface in the ventricular system using FITC–phalloidin staining and confocal laser scanning microscopy (Li et al. 2007). By comparing the width of the apical F-actin network, we found that F-actin was most prominent in the lower cervical canal and significantly differed between the ventral and dorsal aspects above the medullary canal. Recently, we further examined the postnatal development of F-actin in the central canal, and found that the apical F-actin network increased in width after birth, and peaked in the third postnatal week (Li et al. 2008). No regional differentiation of F-actin was observed if the intervertebral spine movements of weanling rats were continuously restrained, suggesting that the organization of F-actin in the central canal is related to the postnatal development of vertebral motions.
According to the EM data available, microvilli do display regional differences along the ventricular system with respect to height as well as shape and density (Fleischhaller 1972; Ferraz de Carvalho and Costacurta 1976; Walsh et al. 1978; Yoshioka et al. 1985). For example, the dorsal wall of the cerebral ventricles above the medullary canal is often covered with scanty and short microvilli (Walsh et al. 1978; Yoshioka et al. 1985), whereas the luminal surface of the central canal and choroid plexus is generally characterized by a profusion of stout microvilli (Bruni and Reddy 1987; Del Bigio 1995). Although postnatal development of microvilli has not been reported in the central canal, a similar postnatal increase in height and number of microvilli has already been noted in the choroid plexus in the rat fourth ventricles (Keep et al. 1986). Because choroid ependymocytes are specialized for secretion of cerebrospinal fluid, the increase in the number and height of microvilli has been thought to be an instrumental adaptation (Keep et al. 1986; Gabrion et al. 1996; Mani-Ponset et al. 1997; Davet et al. 1998).
A variety of evidence, obtained mainly by studying other ciliated epithelium systems, has shown that microvilli can adapt to altered gravity, hydrostatic pressure, or flow rate by changing their shape, size, and number (Tilney and Cardell 1970; Maunsbach et al. 1987; Gabrion et al. 1996; Mani-Ponset et al. 1997; Davet et al. 1998; Doughty 1998). Therefore, it is possible that the microvilli of the ependymocytes may have a similar capability and are therefore able to organize themselves according to the differing demands of differently positional cells against external forces.
Unlike their counterparts in the central canal, the microvilli in the choroidal plexus contain a loose F-actin network that does not form a well-developed terminal web beneath the microvilli (McNutt 1978). Previously, Kohno (1969) has noted the presence of pronounced cross-striated microfilaments in the apical aspects of the central canal, which are now known as the so-called terminal web. Because similar structures are lacking or are less well developed in the cerebral ventricles, several authors have suggested that such structures act as a support that protects the lumen of the canal from collapsing during compression generated by movements of the spine (Brightman and Palay 1963; Kohno 1969; Bruni and Reddy 1987; Li et al. 2007,2008). These studies provided ultrastructural evidence showing that the F-actin bundles in the terminal web span the entire circumference of the central canal by associating with the intermediate junctions between adjacent cells. This circumferential F-actin network is further enforced by the underlying vimentin intermediate filaments. Our observations suggest that the apical F-actin, together with the intermediate filaments, is capable of transmitting tension from one cell to another, therefore playing a role in maintaining the structural integrity of the central canal.
Footnotes
Acknowledgements
The laboratory for Neural Architecture is now the Support Unit for Neuromorphological Analysis, Research Resources Center, RIKEN Brain Science Institute.
We are very grateful to Tsuyako Hayashida for her advice and generous help.