
Abstract
Localization of resident Golgi proteins to earlier (cis) or later (trans) Golgi compartments has traditionally required quantitative immunocytochemistry and electron microscopy, which are inaccessible to many researchers. For this reason, light microscopy has often been used, initially for localization of Golgi glycotransferases and, more recently, for other Golgi proteins (e.g., Arf1, GBF1, Rab6). Quantitation of light microscopic intra-Golgi localization can be problematic. We describe here a novel quantitative light microscopic methodology using linescans crossing the Golgi ribbon. Our method determines a localization for the unknown protein in a one-dimensional coordinate system in which 0.0 corresponds to localization of a cis marker and 1.0 to localization of a trans marker. We also describe a variant of this methodology in which Golgi morphology is simplified by nocodazole-induced dispersal into ministacks, allowing a fully automated analysis. In our assay, β1,4-galactosyltransferase-YFP and Golgin97 localize similarly to trans markers, whereas p115, GBF1, and p58-YFP are similarly near other cis markers. The medial Golgi protein α1,3–1,6-mannosidase II gives an intermediate localization in this assay. These methodologies may prove useful in instances where electron microscopy is technically difficult as well as when rapid analysis of large numbers of samples is required.
T
Golgi resident proteins include Arfs (Donaldson et al. 2005), Rabs (Zerial and McBride 2001), SNAREs (Nichols and Pelham 1998), tethers (Lupashin and Sztul 2005), and other proteins that regulate membrane trafficking pathways. These pathways are required for cargo transport between the ER and Golgi, between the Golgi and post-Golgi destinations (e.g., cell surface and endosomes (Rodriguez-Boulan and Musch 2005), and also within the Golgi apparatus (Rothman and Wieland 1996; Kartberg et al. 2005; Mironov et al. 2005). Other resident proteins have a variety of functions (e.g., posttranslational modification of cargo proteins). Thus, they are often found concentrated at locations within the Golgi stack, which can provide clues to their function (Rabouille et al. 1995).
Golgi resident proteins have been most commonly localized to subdomains of the Golgi apparatus using immunoelectron microscopy (IEM). This technique was applied extensively to localize Golgi glycosylation enzymes to subdomains of the Golgi apparatus, e.g., localization of β1,4-galactosyltransferase (GalT) to trans-Golgi cisternae (Roth and Berger 1982). Using similar techniques, other oligosaccharide-modifying enzymes were later localized within the Golgi apparatus, e.g., α1,2-mannosidase I to the early Golgi, α1,3–1, 6-mannosidase II (ManII) to medial compartments (Velasco et al. 1993) and late-acting enzymes such as β1,4-galactosyltransferase and α2,6-sialyltransferase to later Golgi compartments (trans and TGN; (Rabouille et al. 1995). Trans-Golgi network 38/46 kDa protein, TGN38/46, which cycles between the Golgi and endosomes, was shown by IEM to be present primarily in very late Golgi compartments (Luzio et al. 1990).
More recently, IEM has been used to localize proteins important in cargo trafficking through the Golgi apparatus to Golgi subdomains. The tethering proteins p115 (Nelson et al. 1998) and GM130 (Nakamura et al. 1995), the coat protein COPI (Oprins et al. 1993), and the cargo receptor ERGIC53 (Schweitzer et al. 1988; Saraste and Svensson 1991), all important in ER/Golgi trafficking, were localized to early Golgi compartments by IEM.
Electron microscopy has sufficient resolution to easily visualize individual Golgi cisternae but requires considerable specialized expertise (Geuze 1999). Electron microscopy facilities and skilled practitioners are not present at many research institutions (Geuze 1999). IEM also requires considerably more time and effort than immunofluorescence for virtually all steps including sample preparation, image acquisition, and image analysis. Antibodies that work for immunofluorescence sometimes fail to provide good results when used for electron microscopy, due to different and harsher sample preparation procedures.
For these reasons, immunofluorescence has been used to localize proteins to subdomains of the Golgi apparatus, at least since Berger and Hesford (1985) found different localization patterns for galactosyl- and sialyltransferase by epifluorescence microscopy and argued these proteins were in different Golgi subcompartments. After confocal microscopes became widely available, there was increasing use of immunofluorescence for intra-Golgi localization. Antony et al. (1992) first determined that Rab6 was localized to late Golgi compartments by confocal microscopy using a quantitative measure of overlap with cis and trans markers and were able to confirm this localization by IEM. Shima et al. (1997, 1998) compared the localization of a Golgi enzyme, NAGT I, in mitotic and interphase cells to a variety of markers with known localizations within the Golgi apparatus using confocal microscopy. As in the preceding study by Antony et al. (1992), the localization was subsequently confirmed by IEM (Shima et al. 1997).
Recent studies have also used confocal microscopy combined with immunofluorescence to localize proteins to subdomains of the Golgi apparatus, sometimes without IEM. These include the localization of the Arf-GEF GBF1 (Zhao et al. 2002; Garcia-Mata et al. 2003) and ER vesicle protein 46 (Orci et al. 2003) to cis-Golgi compartments and Golgin GCC88 to trans-Golgi compartments (Luke et al. 2003). In one recent study, a wide range of constructs derived from Arf1 was scored for localization to cis or trans compartments within the Golgi apparatus using light microscopy (Honda et al. 2005).
There are significant difficulties in localizing a protein within the Golgi apparatus using a purely light microscopic approach. The Golgi apparatus is extremely thin, with the main stack ~0.5 μm in thickness combined with cis and trans-Golgi networks of variable thickness. Stacks are organized in ribbons that can twist as they cross the cell (Rambourg and Clermont 1990). The Golgi ribbon will appear in projection on a two-dimensional light micrograph, likely in random orientations.
For localization of proteins within the Golgi apparatus, most of the above-cited studies use similar approaches. Cells are stained using antibodies directed against proteins known to localize to cis and trans compartments (e.g., p115 for cis and TGN38 for trans) and with antibodies against the unknown protein. Triple-color images are subsequently obtained with a confocal microscope, and colocalization is assessed visually.
In a quantitative variation of this approach, the image channels representing the cis, trans, and unknown marker are thresholded, and the fraction of pixels of the unknown protein colocalized with the cis and trans-Golgi markers is measured (Zhao et al. 2002; Honda et al. 2005). Consistent methodologies for choosing the threshold are usually not described, although one study (Zhao et al. 2002) used a cutoff of 40% of the maximum Golgi brightness for each channel. Quantitation of overlap between labels has the disadvantage that the area selected by thresholding in each channel can be highly sensitive to the exact threshold value selected. Furthermore, the required threshold value is strongly sensitive to background (non-Golgi) fluorescence, which can be substantial for some proteins with significant ER-localized or cytosolic pools.
In this report we describe and test a novel quantitative light microscopic methodology to determine the predominant suborganellar localization of Golgi proteins. Like the previously used methodologies, the unknown protein is scored relative to standard cis and trans-Golgi markers. However, we use a simpler approach consisting of analysis of peaks on linescans crossing the Golgi stack, taking advantage of the fact that a randomly oriented Golgi ribbon should possess some regions in which the cis and trans markers will show maximal separation (Figure 1A). Our methodology generates a number representing a location on a one-dimensional coordinate system in which the cis marker defines a value of 0.0 and the trans marker defines a value of 1.0. We show that the method gives the expected results when applied to Golgi proteins for which the location inside the Golgi is known. Additionally, we show that nocodazole treatment of cells, which re-organizes the Golgi apparatus into scattered and geometrically simplified ministacks (Thyburg and Moskalewski 1985; Cole et al. 1996), makes feasible automation of this method (with some modifications).
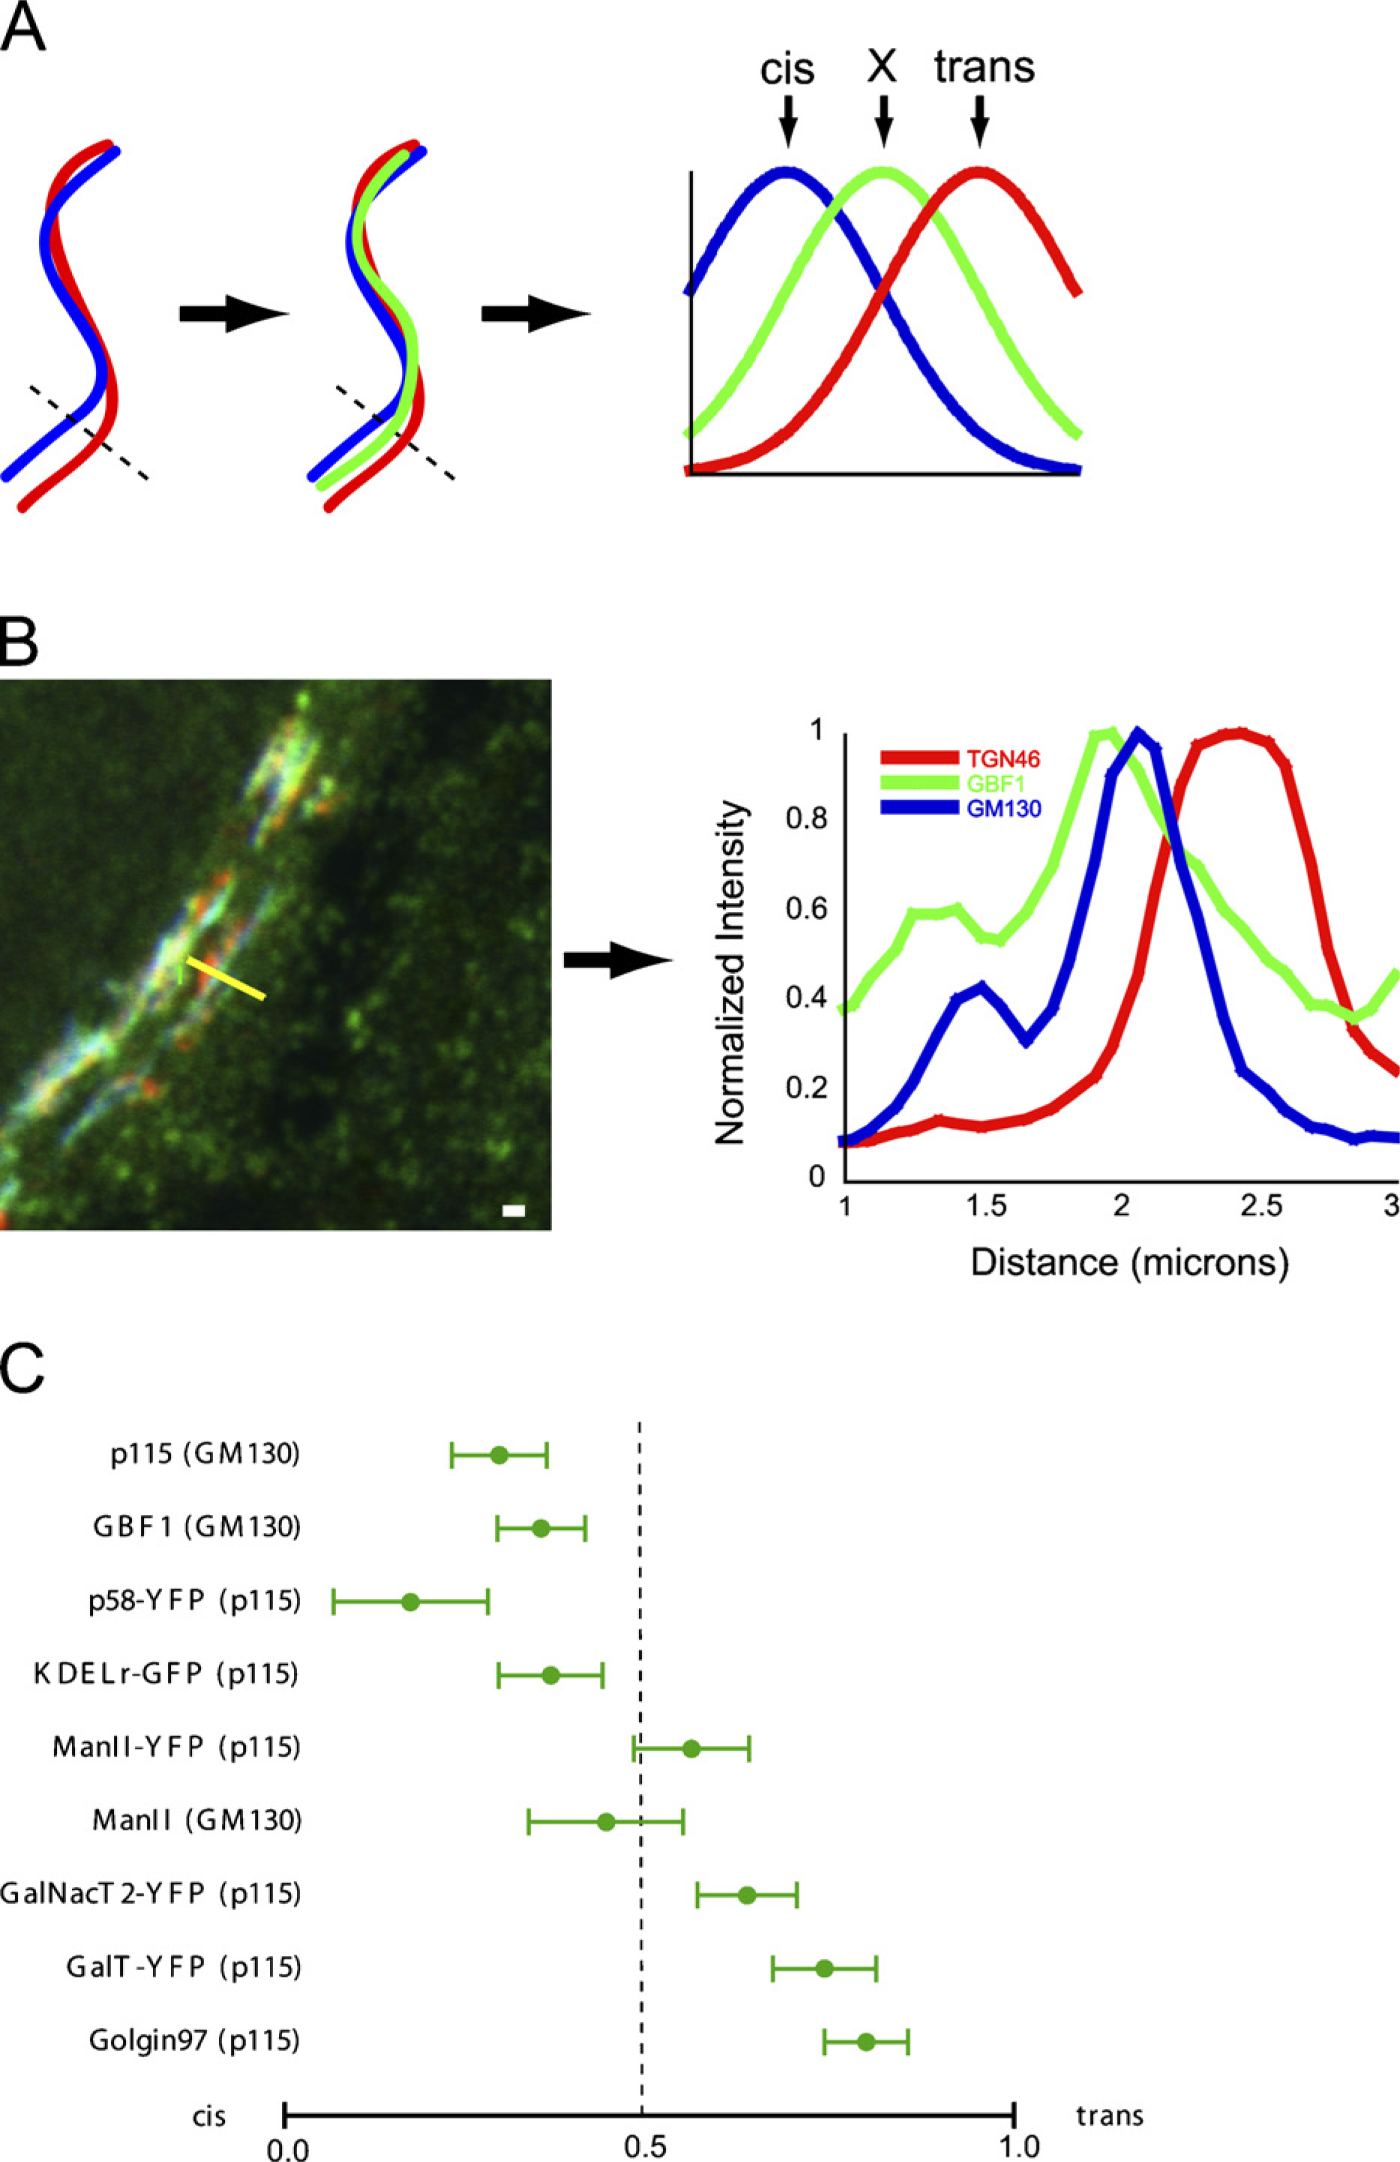
Scoring localization of proteins within the Golgi apparatus by analysis of linescans crossing images of the Golgi ribbon. (
Materials and Methods
Materials
All materials were obtained from Sigma Chemical Co. (Oakville, ON, Canada) unless otherwise stated. Rabbit polyclonal antibody directed against rat p115 (Nelson et al. 1998) was kindly supplied by Elizabeth Sztul. The 9D2 rabbit polyclonal antibody directed against human GBF1 (Zhao et al. 2006) was a kind gift of Paul Melançon. Sheep polyclonal antibody directed against human TGN46 was purchased from Serotec (Oxford, England). Mouse monoclonal antibody directed against rat TGN38 was purchased from Affinity Bioreagents (Golden, CO). Mouse monoclonal antibody directed against rat GM130 was purchased from BD Biosciences (Mississauga, ON, Canada). Rabbit polyclonal antibody directed against human ManII was purchased from Chemicon (Temecula, CA). Mouse monoclonal antibody directed against human Golgin97 (Molecular Probes; Eugene, OR) was a kind gift of Carlos Morales. All secondary antibodies were purchased from Chemicon except for Cy3-tagged anti-sheep, which was purchased from Molecular Probes. ManII-GFP and KDELr-GFP were kind gifts of Jeremy Simpson, and GalNacT2-YFP (Shima et al. 1997) was kindly supplied by Graham Warren. The creation of p58-YFP is described in Ward et al. (2001). The GalT-YFP construct is described in Zaal et al. (1999). Nocodazole (Sigma) was dissolved in DMSO to make a 5 mg/ml stock solution that was stored at −20C.
Tissue Culture and Transfections
HeLa and NRK cells were grown in DMEM medium with 10% fetal bovine serum (Invitrogen; Burlington, ON, Canada) as described previously (Presley et al. 2002). IM9 cells (Lesniak et al. 1974), a kind gift of Wilson Miller, were grown in RPMI 1640 medium (Invitrogen) with 10% fetal bovine serum, 2 mM L-glutamine, 100 U/ml penicillin, and 100 U/ml streptomycin. For transfection, HeLa and NRK cells were plated on 10-mm circular glass coverslips in six-well plates and transfected with Fugene (Roche Diagnostics GmbH; Mannheim, Germany) in 3-ml medium according to the manufacturer's instructions. IM9 cells were grown on coverslips pretreated with poly-D-lysine (0.1 mg/ml; Sigma) and were transfected using Lipofectamine 2000 (Invitrogen). Coverslips were incubated for 24 hr to allow expression of GFP/YFP constructs. For nocodazole treatment, cells were incubated in medium containing nocodazole (5 μg/ml) for 6 hr prior to fixation.
Immunofluorescence
For immunofluorescence, cells were plated on coverslips (Fisher Scientific; Nepean, ON, Canada), transfected, and grown in a 37C 5% CO2 incubator until 50–80% confluent. Coverslips were washed briefly in PBS (Invitrogen) and fixed for 10 min in 4% formaldehyde in PBS containing 4% sucrose. Coverslips were then washed for 10 min in PBS with 25 mM glycine and 23 10 min in PBS. Cells were subsequently permeabilized by incubation in 0.1% Triton in PBS for 2 min and washed 3 × 10 min in PBS. Coverslips were incubated in PBS containing 3% normal goat serum (PBS/NGS) for 1 hr. Subsequently, coverslips were incubated with primary antibody diluted in PBS/NGS for 1 hr, washed 33 10 min in PBS, and incubated with secondary antibody diluted in PBS/NGS for 1 hr. Coverslips were washed again in PBS (3 × 10 min) and finally mounted on slides using Geltol mounting medium (Thermo Electron Corporation; Pittsburgh, PA). Anti-p115 and 9D2 anti-GBF1 were used at a dilution of 1:100 and 1:50, respectively. Anti-TGN46 and anti-TGN38 were diluted 1:1000, and anti-GM130, anti-ManII, and anti-Golgin97 were diluted 1:300. Secondary antibodies were used at a dilution of 1:300.
Microscopy and Image Analysis
Images were acquired using a Zeiss 510-META confocal microscope (Carl Zeiss GmbH; Jena, Germany) equipped with a diode laser (405 nm), an argon laser (488 nm), and two helium-neon lasers (543 nm and 633 nm). Alexa 488 and GFP/YFP were visualized using 488-nm excitation and a 505–530-nm band-pass emission filter. Cy3 was visualized using 543-nm excitation and a 560–615-nm band-pass emission filter. Cy5 was visualized using 633-nm excitation and a 650-nm long-pass emission filter. All images were acquired at Nyquist resolution (70 nm/pixel) as recommended by the manufacturer, using a 363 numerical aperture (NA) 1.4 oilimmersion Plan-Apochromat objective lens (Carl Zeiss). Line averaging (163) was used to minimize noise. Image files were subsequently exported as 8-bit tagged image file format (TIFF), transferred to a Macintosh workstation running OS-X 10.4 (Apple Computer; Cupertino, CA), and converted to Portable Pixel Map (PPM) format using the ImageMagick utility. Subsequent processing is described in Results.
Results
Description of Linescan Analysis Methodology and Application to Proteins Visualized by GFP-Tag or Immunofluorescence
To test whether linescan-based methodologies could provide information on the location of proteins within the Golgi apparatus, we developed a methodology that we used to score the Golgi localization of several previously characterized proteins (Figure 1). HeLa cells on coverslips were stained with antibodies directed against cis and trans-localized Golgi proteins as well as with antibodies directed against a test protein. We used a sheep antibody against human TGN46 (Ponnambalam et al. 1996) to identify the TGN because it would not interfere with the use of mouse or rabbit primary antibodies against other proteins. The cis end of the Golgi was identified by staining with a mouse antibody directed against GM130 (Nakamura et al. 1995) or a rabbit antibody directed against p115 (Nelson et al. 1998), depending on the antibody used against the test protein (indicated in Figure 1). Test proteins were endogenous GBF1 (Zhao et al. 2002), ManII (Velasco et al. 1993), Golgin97 (Lu and Hong 2003), and p115 (scored against GM130), as well as transfected p58-YFP (Ward et al. 2001), KDEL receptor-GFP (KDELr-GFP), GalNacT2-YFP (Shima et al. 1997), ManII-GFP, and GalT-YFP (Zaal et al. 1999). Anti-p115 was used as the cis marker with both GFP constructs. GBF1, p58, and p115 have been previously shown to localize predominantly to early Golgi compartments (Saraste and Svensson 1991; Nelson et al. 1998; Zhao et al. 2002), whereas Golgin97 and GalT-YFP have been shown to localize to late Golgi compartments (Zaal et al. 1999; Lu and Hong 2003). The localization of ManII differs between cell types but is often found predominantly in cisternae near the center of the Golgi stack (Velasco et al. 1993). GalNacT2-YFP is typically found throughout the Golgi apparatus (Shima et al. 1997).
TGN46 antibody was visualized using a Cy3-labeled secondary antibody, the cis marker (p115 or GM130) with a Cy5-labeled secondary antibody, and the test protein with an Alexa 488-labeled secondary antibody (not required for the GFP constructs). Triple-label con-focal images were taken of the stained cells at Nyquist resolution with a NA 1.4 × 63 objective (70-nm pixel size) with line averaging of 16 to minimize noise. Pinhole size was 0.7 Airy units for the Cy5 channel and was adjusted for the other channels to give equivalent optical slice thickness. Correct spatial alignment of the three channels was critical for successful results. Alignment was verified using multicolor beads and/or cells in which the single protein GM130 was triple stained with Alexa 488, Cy3, and Cy5 secondary antibodies. We found that the use of line switching (which permits the essential simultaneous acquisition of all three channels) was helpful, but not required, for reliable colocalization. Thus, sufficiently good image alignment could be achieved on confocal microscopes incapable of simultaneous acquisition of all channels. Shifting of the slide or change in focus during image acquisition was most likely within the first few minutes after loading a slide (unpublished data). Thus, when line switching was not used, a 10-min “settling” period was allowed for each slide to stabilize prior to acquisition of the first image. We acquired images of 30 cells from each sample.
Images were subsequently opened in Metamorph. The green channel (GFP/YFP or Alexa 488) was blanked, and linescans were obtained manually from Golgi regions in which the cis and trans markers showed visible segregation (Figure 1A) because these regions are the most likely for the Golgi ribbon to be turned in a favorable orientation for analysis. Normally, Cy3 was displayed as red and Cy5 as blue for good visual discrimination. Linescans (4–8 pixels wide to reduce noise) were taken perpendicular to the long axis of the Golgi ribbon in areas in which Cy3 and Cy5 fluorescence showed maximal separation (Figure 1B). Afterwards, the fluorescence profile along the linescan was visualized for all three channels. Linescans were accepted when a single clearly discernable peak was found in each of the three channels. Linescans were most frequently rejected because secondary peaks appeared that were not apparent on visual inspection of the image. Three to five linescans acceptable by the above criterion were taken from each cell. Linescans were then saved to disk as text files and transferred to a Unix workstation (Linux or Mac OS-X).
Further analysis was automated. For reasons of efficiency, files containing linescan data were input to a Python script, which determined the spatial location along the linescan of the maximum pixel value in each of the three channels. However, locations of the peaks could also be determined manually using a spreadsheet program such as Microsoft Excel. Location of the maximum pixel value in the Cy5 (cis) channel was defined as 0 on a coordinate system representing the cis-trans axis of the Golgi apparatus, whereas the maximum pixel value in the Cy3 (trans) channel was defined as 1 in this coordinate system. Linescans were automatically eliminated from consideration if the total distance between the cis and trans peaks was <280 nm (10–15% of total linescans). Location of the maximum pixel value in the GFP channel was assigned a value in this coordinate system with allowed values ranging from −0.5 to 1.5. Values outside this range were considered non-physical and were discarded (<4% of linescans). All valid Alexa 488/GFP peaks from a single cell were averaged to give a single value for the cell. Data from 30 cells were acquired for each test protein, but some cells were excluded (2–11/sample) because it was not possible to obtain usable linescans by the previous criteria. Cells in which extended Golgi staining wrapped the nucleus gave the best results, whereas many of the discarded cells had compact Golgi morphologies.
Results of this analysis are shown in Figure 1. As expected, p115, GBF1, and p58-YFP gave numerical scores more cis than the other proteins. Interestingly, p115 and GM130 did not completely colocalize in doubly stained cells with p115 being less cis than GM130 (Figure 1C). Both Golgin97 and GalT-YFP showed localizations similar to TGN46. ManII was on average equidistant from the cis and trans markers, consistent with previous IEM (Velasco et al. 1993), but also showed a distinctly “dotty” appearance that made the analysis difficult (11/30 cells were discarded because satisfactory linescans could not be obtained). KDELr-GFP, ManII-GFP, and GalT-YFP by contrast gave a continuous ribbon-like staining that was easily analyzed. This could be due to limitations of the antibody used but could also indicate differences in localization between endogenous protein and GFP constructs. Recent studies indicate that endogenous Golgi enzymes may favor specific regions within Golgi cisternae (Kweon et al. 2004). GalNacT2-YFP, which is found throughout the Golgi apparatus, gave a localization score intermediate between ManII-GFP and GalT-YFP.
These results are consistent with the known locations of the proteins that were analyzed, although a protein with a broad Golgi distribution (GalNacT2-YFP) was not distinguished well from proteins with relatively narrow medial/trans Golgi localizations. The procedure described here is fast and well specified, relative to previously described overlap-based methods. However, linescans must be taken and then inspected manually, which creates some potential for the introduction of bias. Additionally, whereas average values determined from many cells are reproducible (data not shown), there is considerable variation between individual linescans. Thus, it is difficult to reliably localize a protein relative to cis and trans markers using only a single cell.
Application of Automated Methodology to Nocodazole-treated Cells
We did not consider complete automation of the procedure described above feasible due to the complexity of the Golgi ribbon in HeLa cells. However, nocodazole-induced Golgi mini-stacks appear as roughly circular punctae in light micrographs due to their tiny size. We tested whether the simplified geometry would make feasible a completely computerized analysis of cells. This required significant modifications. First, fluorescence peaks identified in three channels had to be assigned to Golgi ministacks and ambiguous assignments discarded (see Figure 2). A second modification follows from the fact that although fluorescence peaks can be identified on objects in images without much difficulty, the position of the peaks must be specified in two dimensions. Thus, the position of the fluorescence peak representing a test protein in a Golgi ministack is unlikely to lie directly on a line connecting the fluorescence peak representing the cis marker and the fluorescence peak representing the trans marker (see Figure 2E).
To test if an automated analysis was feasible, HeLa cells on coverslips were incubated with 5 μg/ml nocodazole for 6 hr. Ministacks were visualized using antibodies directed against p115 or GM130 and TGN46 as described above using the same set of endogenous and GFP-tagged test proteins described in Figure 1. Double-or triple-labeled images were then acquired at Nyquist resolution (0.07 μm/pixel) with line averaging of 16. Ministacks appeared as punctate structures scattered throughout the cytoplasm showing the test protein overlapping or closely apposed to p115 or GM130 and TGN46 reactivity (Figure 2A).
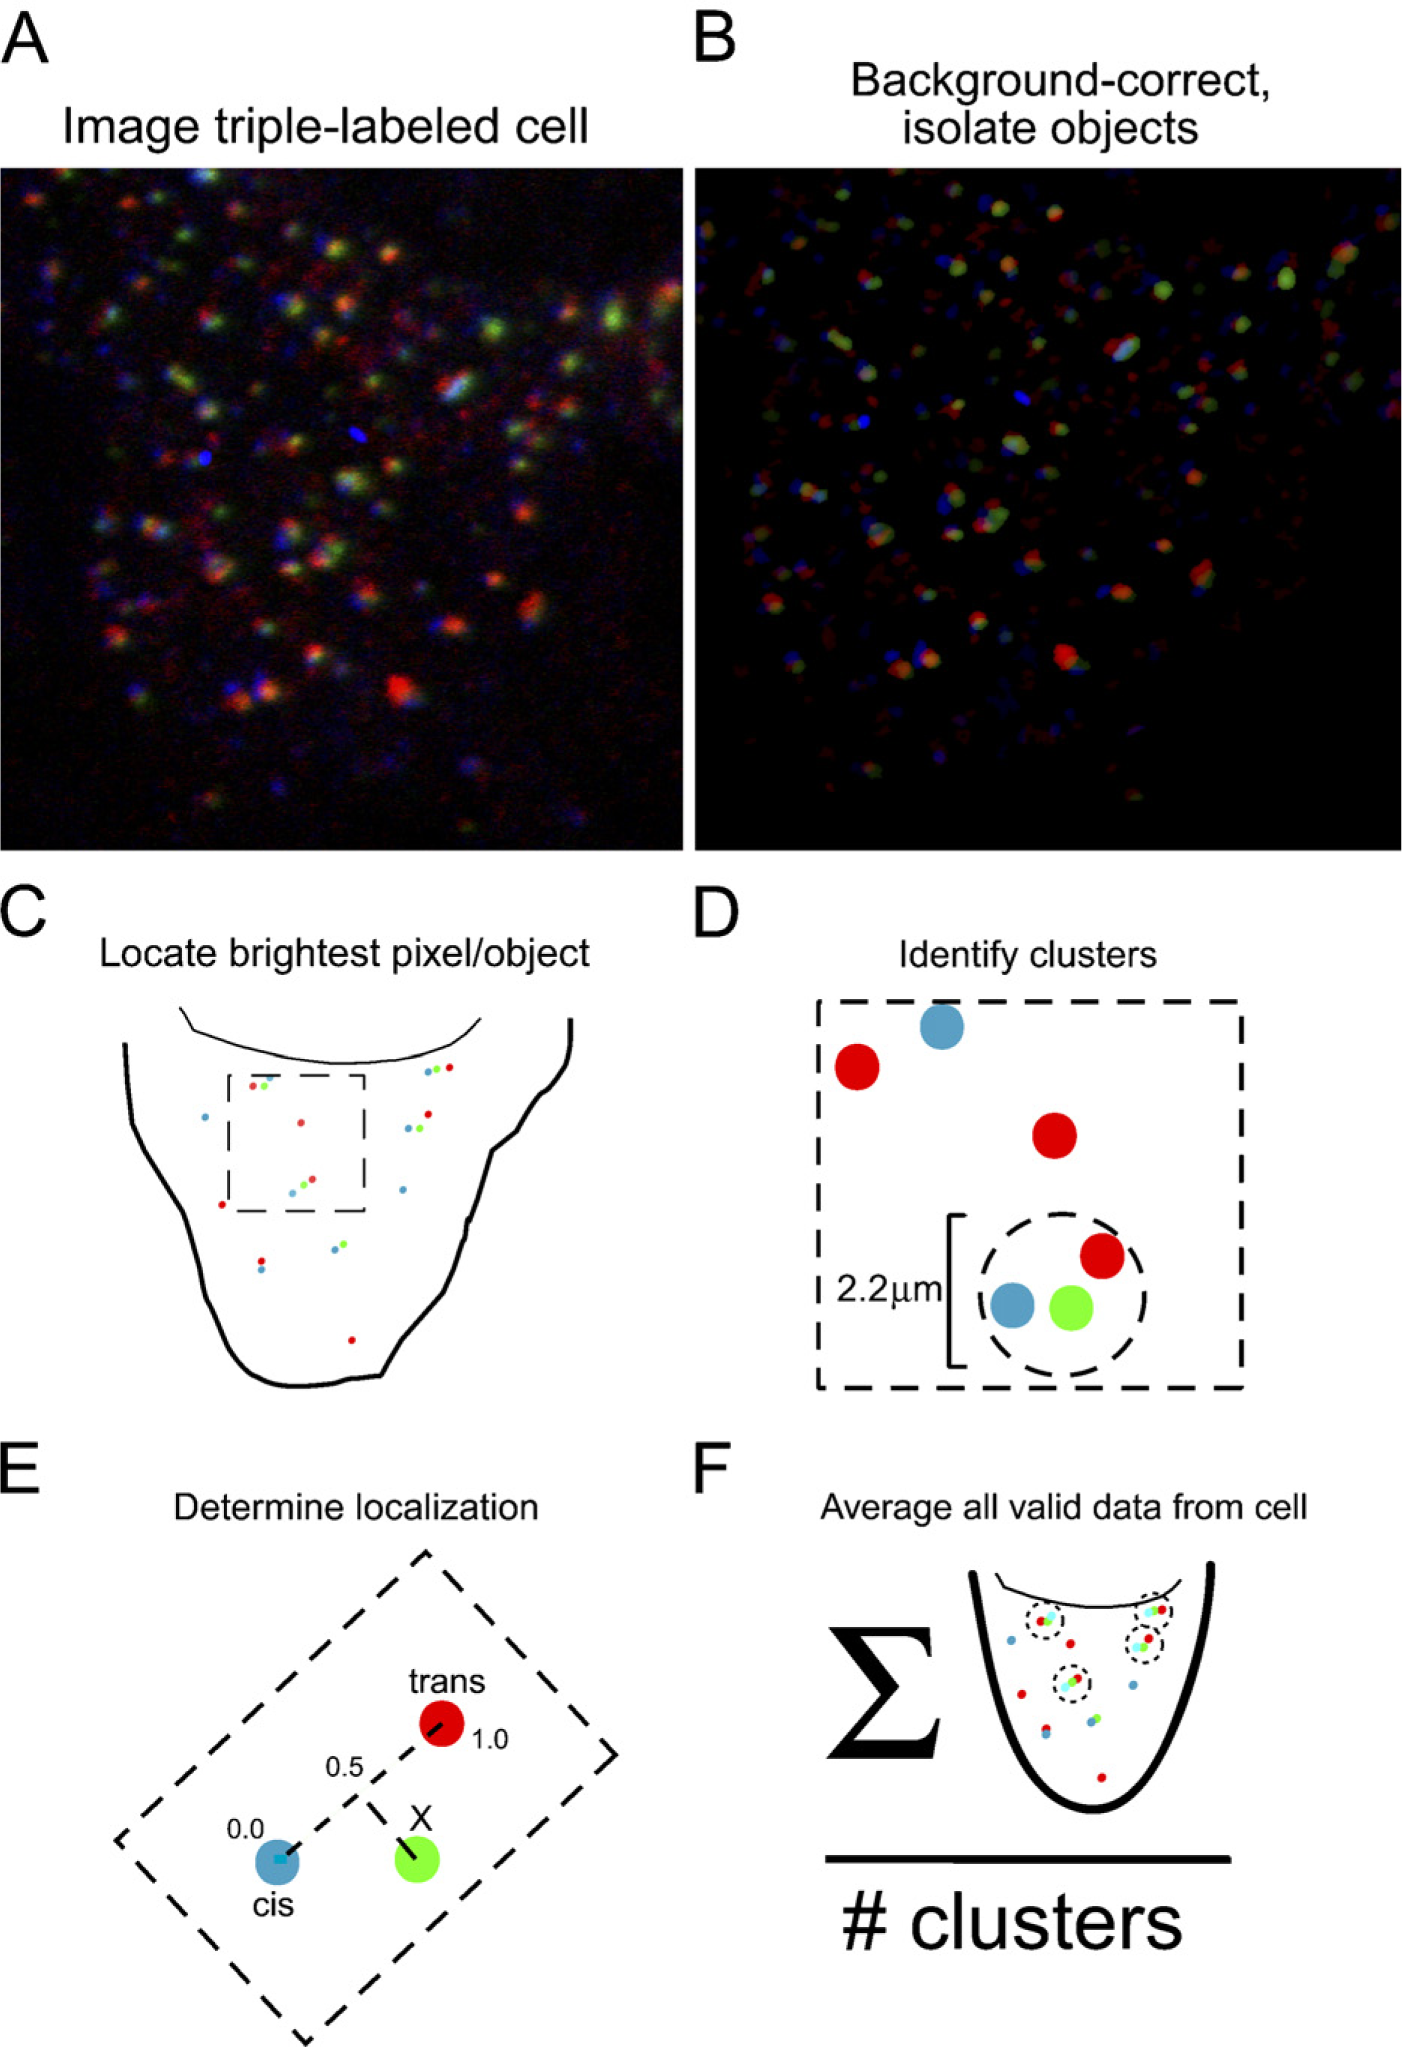
Schematic of automated analysis procedure for cells in which the Golgi apparatus was fragmented with nocodazole. (
A multistep procedure was used to identify fluorescence peaks in the images and to assign them to ministacks. Three-channel 8-bit color images were lightly blurred with a Gaussian convolution to reduce noise (standard deviation 1.0 pixel). Each channel was then background corrected by subtracting a median-filtered background image (neighborhood size 32 × 32 pixels) as described in Dunn et al. (1989) and subsequently thresholded globally using a relatively low threshold (pixel value of 16). Each object isolated was then locally thresholded to half the intensity of its brightest pixel as described in Dunn et al. (1989). Objects containing 6–200 above-background pixels were determined independently for each channel (Figure 2B), and the location of the intensity peak (brightest pixel) in each object was recorded (Figure 2C).
Analyzable ministacks were defined as consisting of exactly one object in each channel within a 1.1-μm radius of one object within each other channel (Figure 2D). To avoid ambiguity, the same unique set of objects was required to be obtained from a circle centered on each of the three objects. Normally, 10–20 ministacks in each cell met this criterion. For each ministack, a line was constructed from the location of the GFP object perpendicular to a line connecting the cis and trans objects (Figure 2E). The point of intersection of this line with the line connecting the cis and trans objects was calculated and used to determine the predominant intra-Golgi localization of the GFP (Figure 2E). The point of intersection was assigned a value on a coordinate system in which the position of peak intensity of the cis marker was defined as 0.0, and the position of peak intensity of the trans marker was defined as 1.0. An average value was determined for each cell from the position of the unknown protein in all valid ministacks analyzed (Figure 2F). Values were discarded prior to averaging if (1) the cis peak and trans peak were separated <0.28 μm, (2) the GFP peak was off-axis by more than one-third the total distance from the cis peak to the trans peak, or (3) if the values obtained were <-0.5 or >1.5. This procedure was completely automated using programs written in C and Objective Caml combined with a graphic user interface implemented in Python/Tkinter. The only user action was to draw a polygon, which defined the region contained by an entire cell onto a window presenting the image. The results of the completed analysis (including input file name, mean value of unknown protein, and number of identified ministacks) was written to a log file.
We obtained data from all the markers described except for GBF1, for which high background fluorescence prevented the identification of ministacks. Typically, on visual inspection of images, the test protein showed colocalization with cis or trans markers consistent with its known location. Representative images from two of the proteins are shown in Figures 3A and 3B. Results obtained from these images by automated analysis were similar to those obtained by manual data analysis of non-nocodazole-treated cells except that the values obtained from individual cells were spread over a narrower range (Figure 3C). However, cell-to-cell reproducibility was higher than with the manual method (compare Figures 1C and 3C), and the same proteins were found to be localized relatively cis or trans. This is true not only for the proteins shown but for a set of GFP-tagged Arf, Arl, and Rab proteins we are currently studying, the locations of which were examined by both methods described above in NRK and HeLa cells (unpublished data). There are several possible explanations for the narrower range of values observed in nocodazole-treated cells. We observed in images of nocodazole-treated cells that the cis marker often wrapped around the trans marker, appearing as approximately linear or crescent shaped. Storrie et al. (1998) previously observed similar wrapping of Golgi cisternae using IEM. This geometry is somewhat more complex than we had assumed and increases the possibility that the fluorescence peaks representing the cis, trans, and unknown markers will not be colinear. Another possibility is the presence of random data obtained by erroneous comparison of elements from different ministacks because random values would add a contribution that would probably tend to average to 0.5. However, intentional misalignment of the unknown channel relative to the channels representing the cis and trans markers resulted in the identification of only one to three spurious ministacks per cell. Cis-localized proteins and trans-localized proteins could still be reliably distinguished. Overall, the two methods were in remarkable agreement and gave results consistent with the known localizations of the proteins examined.
Application of Manual and Automated Methodologies to Other Cell Lines
To test whether our methods could be applied to a variety of cell types, we repeated the preceding experiments in NRK cells (manual linescan in non-drug-treated cells and automated analysis in nocodazole-treated cells), cells with thick ribbon-like Golgis, and in IM9 cells (manual analysis only), a human myeloma cell line with a small, roughly spherical Golgi apparatus. We examined a restricted subset of GFP/YFP-tagged Golgi proteins in these cell lines. These were KDELr-GFP, ManII-GFP, GalNacT2-YFP, and GalT-YFP in IM9 cells and, additionally, p58-YFP in NRK cells. Antibody to TGN38 was used to mark the TGN in NRK cells, whereas antibody to TGN46 was used to mark the TGN in IM9 cells. Anti-p115 was used in both cell lines as a marker for cis-Golgi.
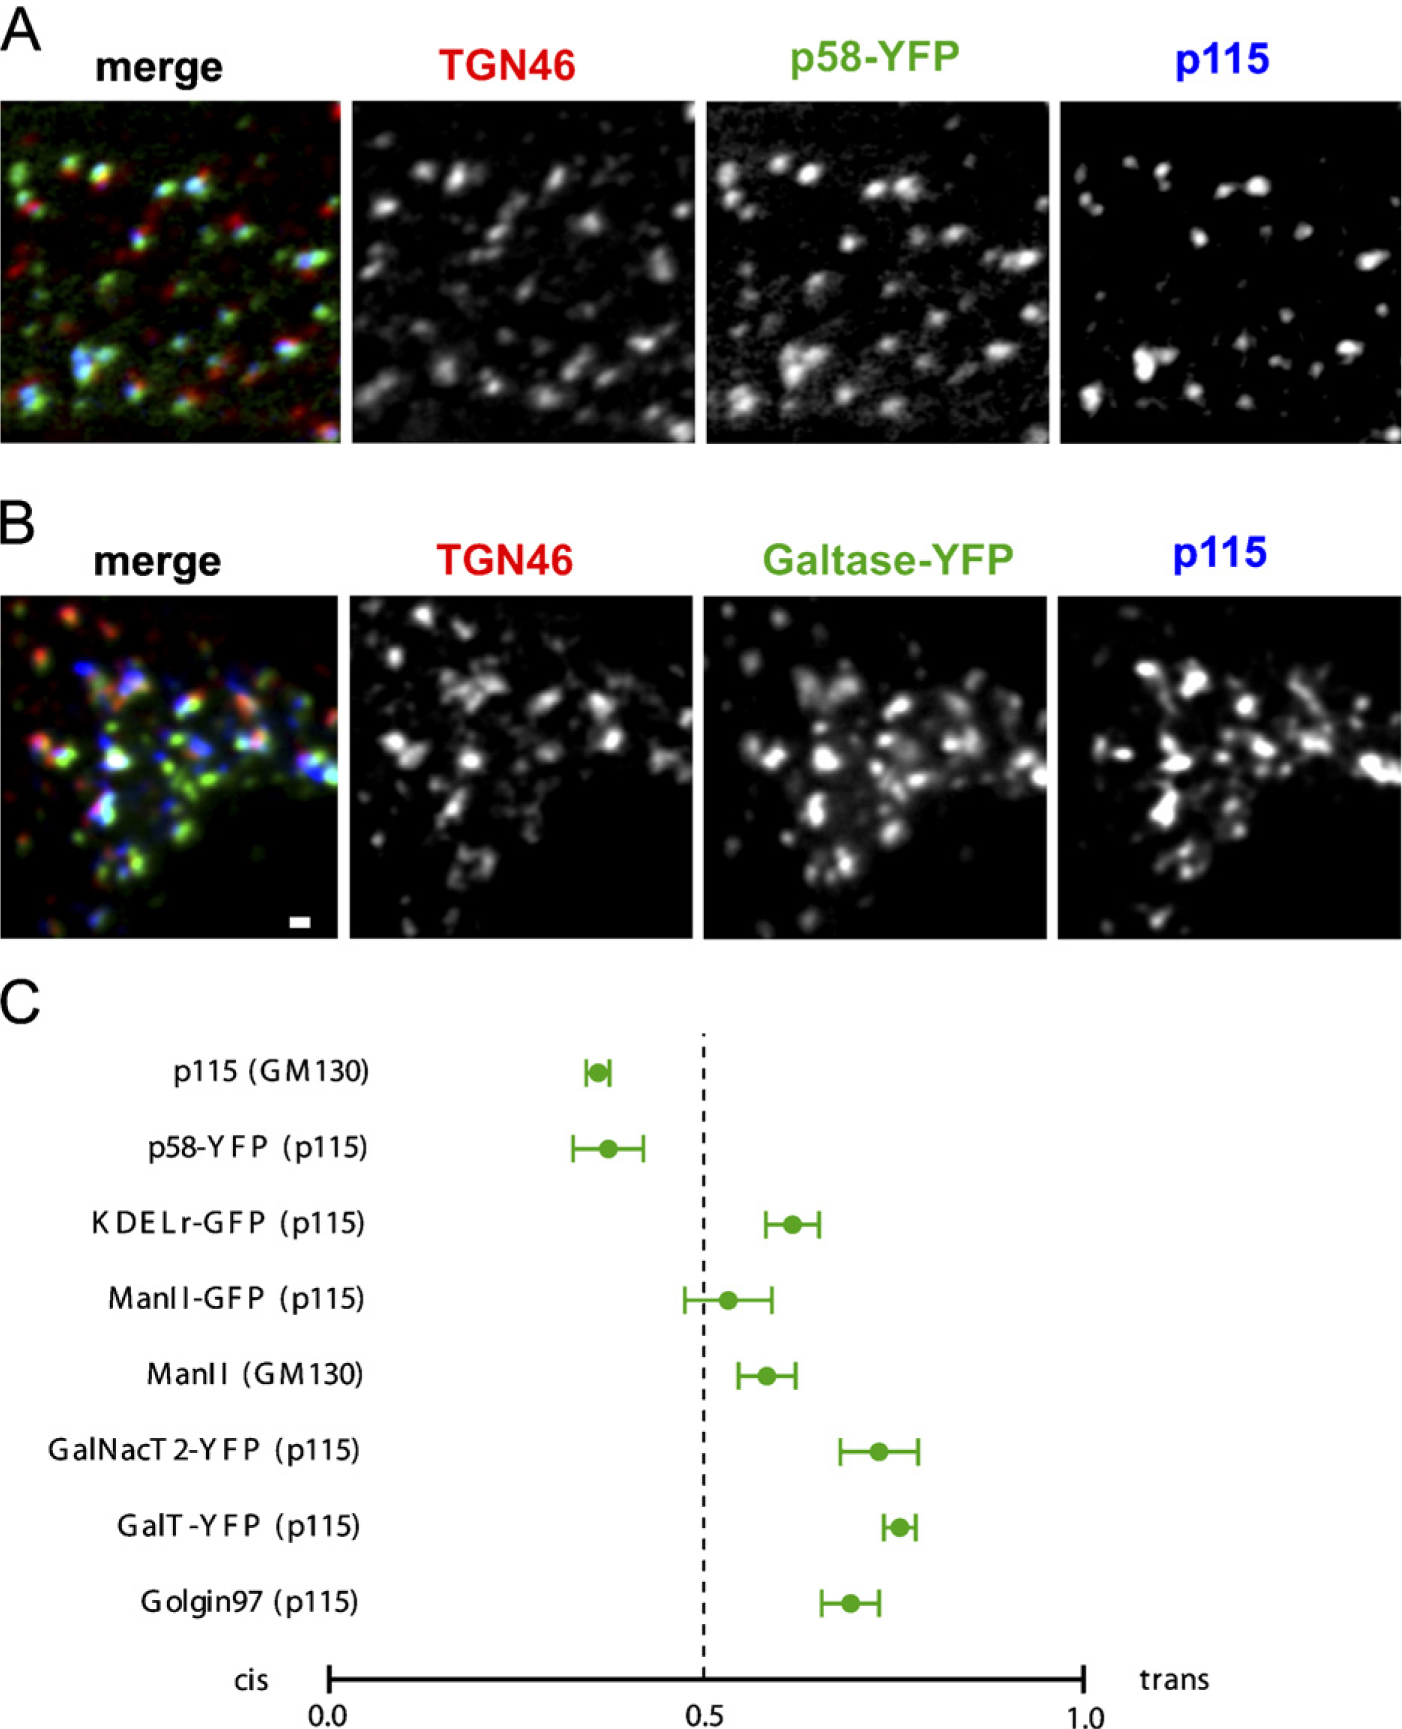
Results of automated analysis of nocodazole-treated HeLa cells. (
NRK cells showed subjectively better cis/trans separation than HeLa cells in both non-drug-treated and nocodazole-treated cells (see Figures 4A and 4B), facilitating rapid acquisition of linescans, whereas finding suitable regions for linescans in IM9 cells was more difficult (although possible) because they possessed small, compact Golgi regions (Figure 4C). However, results were generally consistent with our previous observations in HeLa cells (Figure 4) with p58-YFP showing a sharply cis localization in both manually scored and nocodazole-treated NRK cells and GalT-YFP showing a trans localization in both cell lines. In general, cell-to-cell variability was less in NRK cells than in HeLa cells and slightly greater in IM9 cells. GalNacT2-YFP showed the most significant variability between cell types, overlapping with ManII-YFP in its distribution in manually scored NRK cells and with GalT-YFP in nocodazole-treated NRK cells and in IM9 cells. This variability is not surprising given that GalNacT2-YFP is not strongly localized to a particular Golgi region. These results underscore that our methodology is applicable to a wide range of cell types for which cis and trans reference markers are available.
Discussion
We describe here two related approaches to localizing a fluorescently tagged protein within the Golgi apparatus and demonstrate that these approaches give results consistent with the known locations of several proteins within the Golgi apparatus. One of the methods described here requires some manual analysis of the image, which can be carried out using standard routines provided in widely used image-processing packages such as Metamorph. The other is a fully automated approach that eliminates human sources of bias but requires treating the cells with nocodazole as well as more involved computerized image analysis.
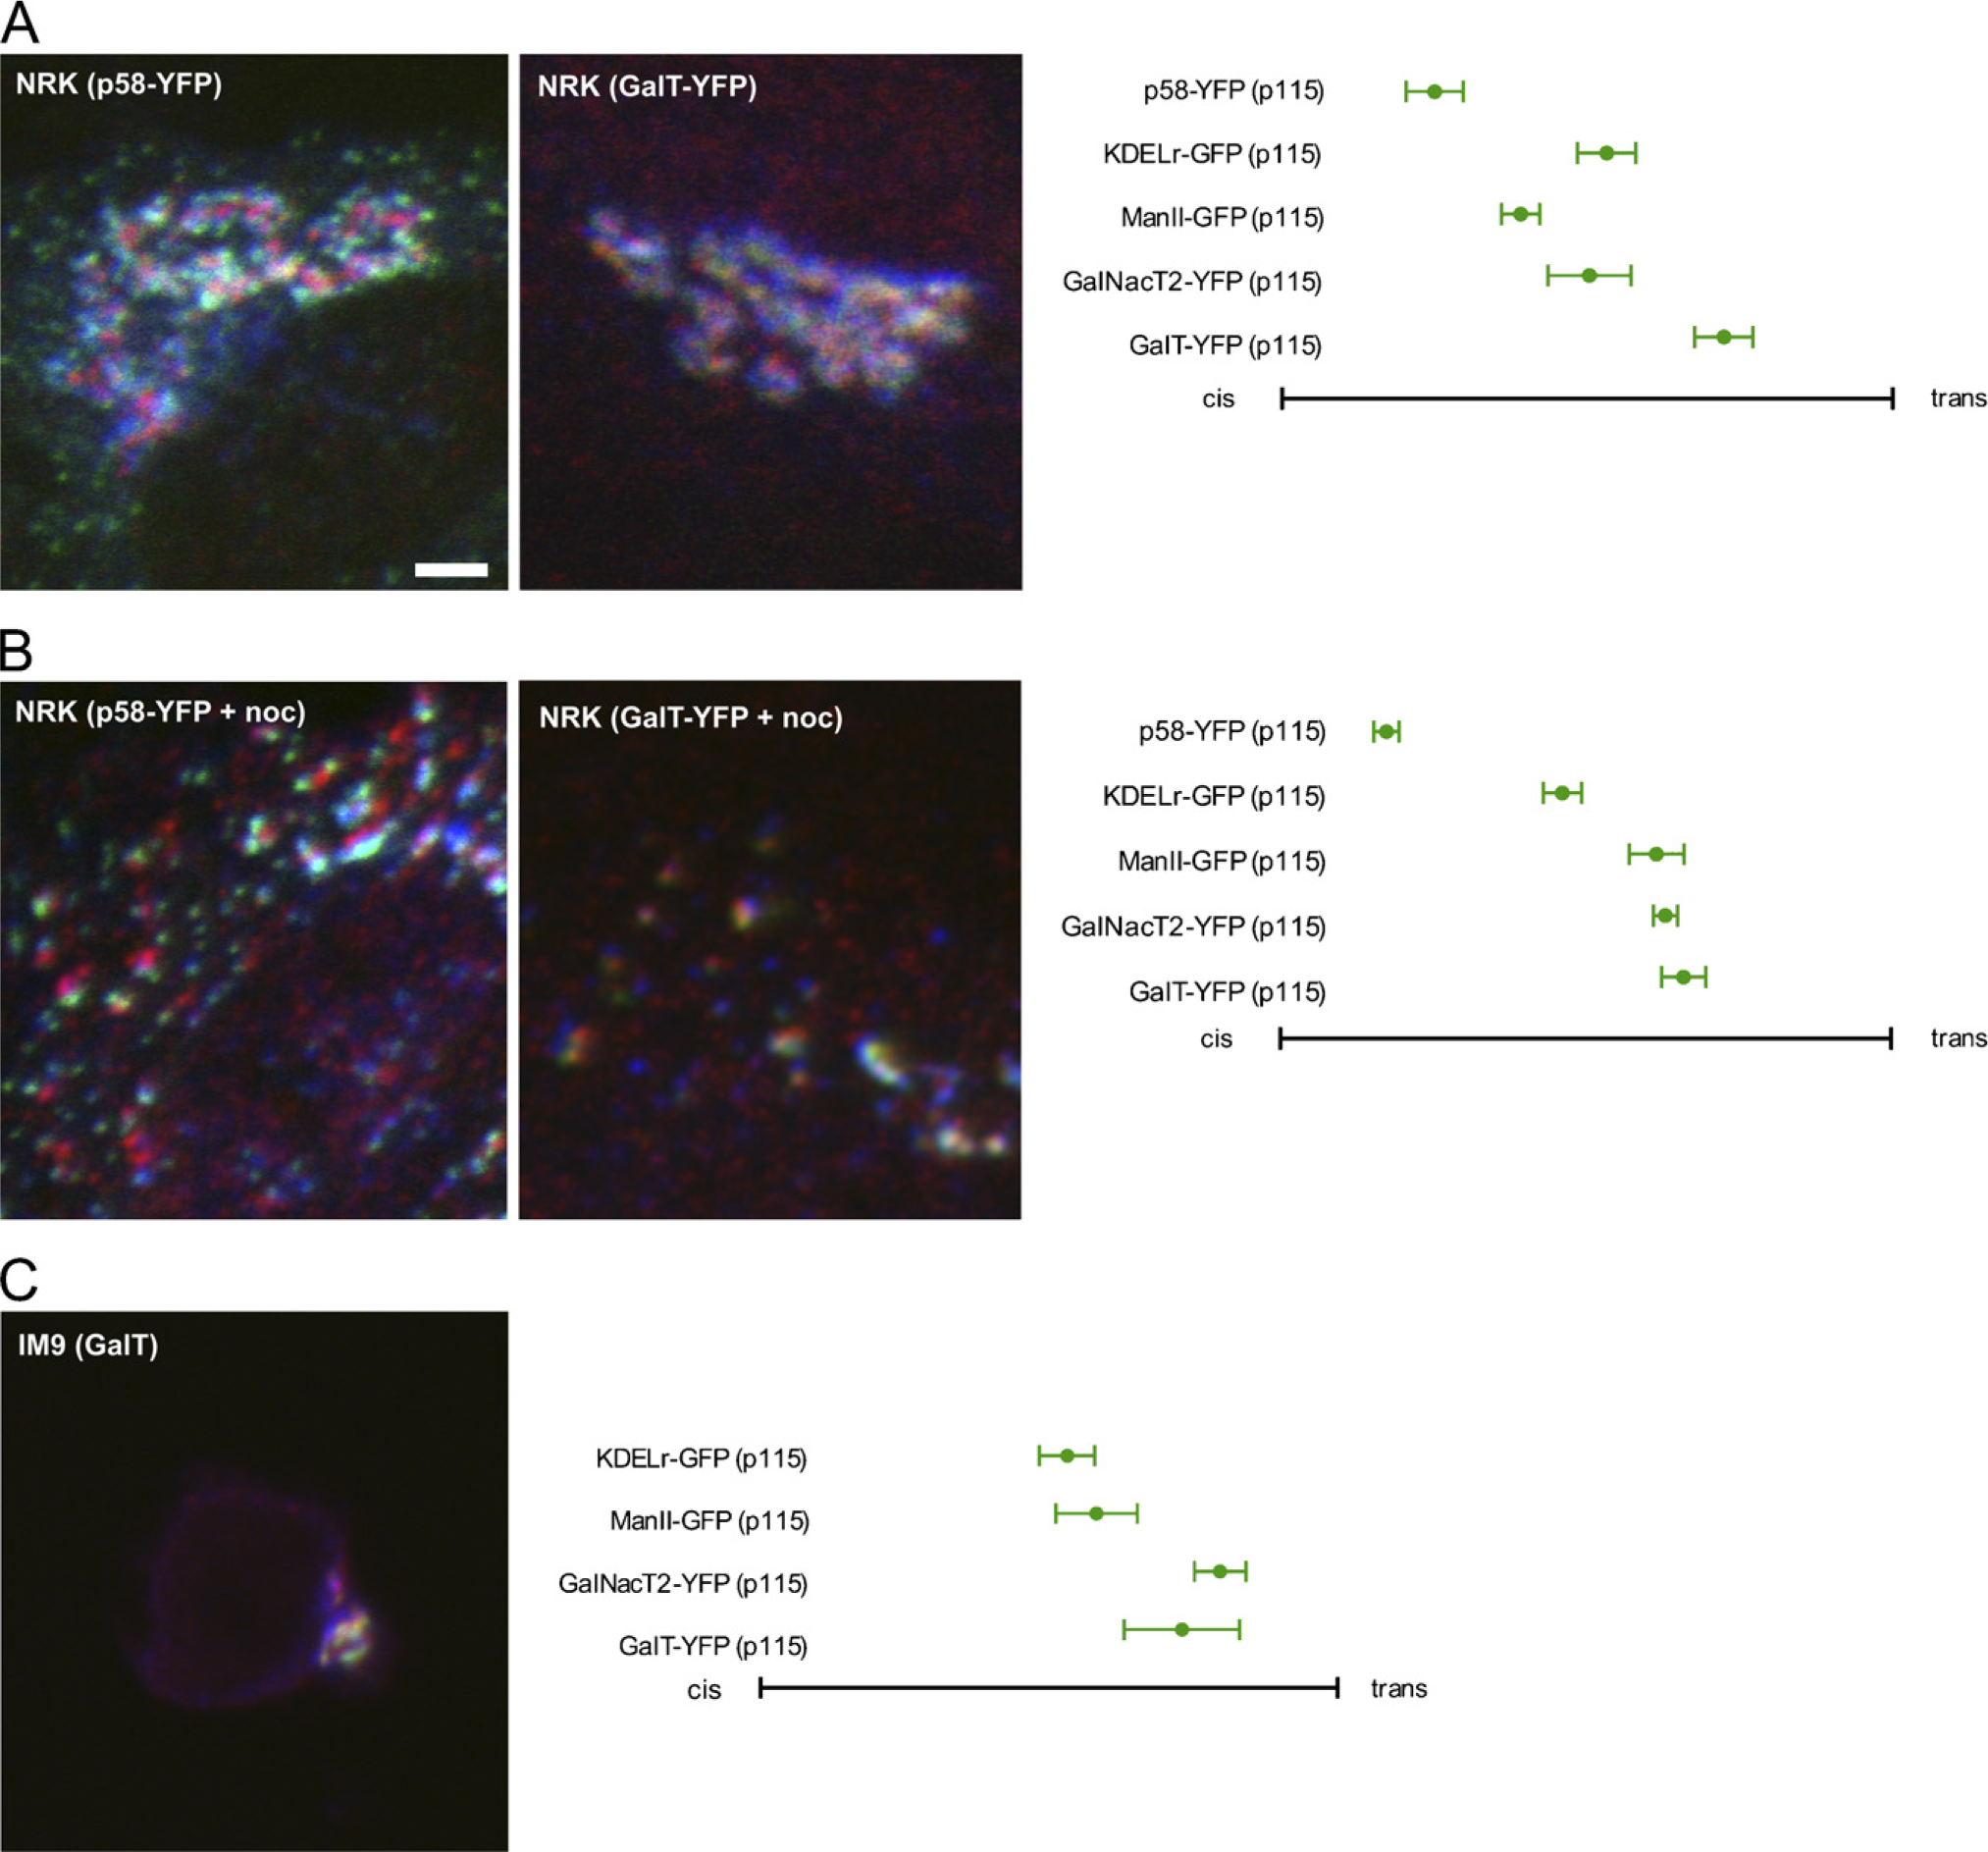
Manual and automated analysis applied to other cell lines. (
In the manual approach, we take linescans across the Golgi apparatus and map the spatial location of the peak intensity value for the protein to be localized, relative to the peak intensity of a cis and a trans/TGN reference. This differs from previous approaches in which overlap of the protein with a cis and a trans marker is scored and has the advantage of being a more intuitive measurement of the predominant localization of a protein within the Golgi apparatus. More importantly, we define a methodology to reduce the number of decisions that must be made to analyze any particular cell. This has two consequences: data analysis is faster relative to overlap-based methods, and the manipulations of the data required by the investigator are reduced. The investigator must choose favorable areas of the Golgi for the linescan but does not need to visualize the unknown protein in the image while doing so, only the channels containing the cis and trans markers. Additionally, a substantial fraction of the linescans must be discarded according to a single criterion, whether or not they contain three well-defined peaks.
Thus, there is some opportunity to bias the data, but we believe it is substantially less than with methods based on quantitating fraction of overlap of the unknown protein with cis and trans markers using previously described methods. A major problem with these methods is that the boundary of the Golgi area in a fluorescence image has usually been defined arbitrarily. Typically, boundaries are defined by adjusting thresholds by eye until reasonable results are obtained for each of three channels. The exact boundaries are highly sensitive to the thresholds used; thus, there is potential for two investigators to obtain substantially different results from the same image. This will be especially true if one of the proteins has a substantial non-Golgi pool, e.g., Arf1 (Vasudevan et al. 1998) or COPI (Presley et al. 2002). Thresholding the images at acquisition time (by adjusting microscope contrast and black level) is not different in effect than thresholding after acquisition and is subject to the same problems. In contrast, fluorescence peaks are defined exclusively by the image, and background is a problem only if it is substantial enough that the Golgi region in the cell cannot be easily visualized.
Overlap-based methods have potential for improvement not explored here. More sophisticated methods such as application of deconvolution analysis and careful correction for background (Rhee et al. 2005) can provide non-arbitrary methods to determine Golgi boundaries for overlap analysis. Application of a standard background correction such as median filtering prior to thresholding followed by application of an automated global thresholding method such as the algorithm by Otsu (1979) would likely also give reproducible results. One study (Zhao et al. 2002) globally thresholded to 40% of Golgi peak intensity in each channel, and such an approach could easily be combined with a background correction and automated. Thresholding locally using machine-determined criteria (e.g., the half-maximum of each Golgi fragment (Dunn et al. 1989) followed by quantitation of overlap is another refinement. Such methods give somewhat different information than by comparison of peak intensity and may be useful in combination with the methods described here. Our linescan-based methods should give unambiguous results with proteins primarily localized to cis/CGN or trans/TGN cisternae. However, a protein localized sharply to a single medial cisterna would likely be difficult to distinguish in our assay from a protein found throughout the Golgi apparatus because the peaks of the linescans obtained would give similar location scores as we often found for ManII-GFP and GalNacT2-YFP. Nevertheless, more substantial overlap with both cis and trans markers might be found in the latter case than in the former, although this needs to be tested.
Our second method is a variation of the first in which the locations of fluorescence peaks are determined on nocodazole-induced Golgi ministacks. The simplified Golgi geometry eliminates the need for manually taking linescans; thus, the analysis can be entirely automated. Because Golgi morphology is considerably affected by nocodazole treatment, some proteins might be relocalized. Our practice has been to use both methods on the same protein, determining its location manually by first using the linescan method and then automatically in nocodazole-treated cells. We have found good agreement between the two methods not only for the proteins described here but for most of a large selection of Ras-family GTPases in both HeLa and NRK cells (unpublished data).
Carefully performed IEM provides a more definitive localization of a protein within the Golgi apparatus but requires skills and facilities not available to many laboratories. IEM also requires significant time both for sample preparation and for image analysis. The time commitment may become prohibitive when large numbers of proteins must be analyzed (e.g., proteomic/genomic analysis) or when the effects of multiple point mutations on Golgi localization of a single protein must be analyzed (e.g., Honda et al. 2005). In contrast, the methodologies described here deliver results quickly. We can acquire confocal images of 15–30 cells in 1–3 hr. Image analysis time by the manual linescan method is comparable to or less than the image acquisition time. Image analysis of nocodazole-treated cells is much faster (a few minutes for 15–30 cells) because the only user action required is outlining the boundaries of each cell on a computer screen. Thus, these light microscopic methods provide a complementary approach to IEM. Variations of these methods may be applicable to rapid localization of proteins in subdomains of other organelles.
Footnotes
Acknowledgements
This research was supported by grants from the Canadian Institutes for Health Research (MOP-49590 and PRG-80153) and the National Institutes of Health (R21-GM-070588).
We thank Wilson Miller for IM9 cells, Elizabeth Sztul for antibodies directed against p115, Carlos Morales for antibody against Golgin97, Paul Melançon for antibodies directed against GBF1, Graham Warren for GalNacT2-YFP, and Jeremy Simpson for ManII-GFP and KDELr-GFP. We thank Eric Danek, Ryan Petrie, and David Verbich for critical reading of the manuscript and Jeannie Mui and Louis Hermo for valuable advice.