
Abstract
Correlative microscopy is a sophisticated imaging technique that combines optical and electron microscopes, with the most common approach being the integration of light microscopy and electron microscopy, known as correlative light and electron microscopy (CLEM). While CLEM provides a comprehensive view of biological samples, it presents a significant challenge in sample preparation due to the distinct processes involved in each technique. Striking a balance between these methods is crucial. Despite numerous approaches, achieving seamless imaging with CLEM remains a complex task. Exosomes, nanovesicles ranging from 30 to 150 nm in size, are enclosed by a lipid bilayer and released by various cell types. Visualizing exosomes poses difficulties due to their small size and minimal electric charge. However, imaging exosomes at high resolution offers a direct method to understand their morphology and functions. In this study, we evaluated exosome imaging with CLEM using a combination of confocal, transmission electron microscope, and scanning electron microscope (SEM). In addition, we conducted a comparative analysis of these two techniques, evaluating their suitability and efficiency in imaging nanoscale structures. In this study, we found that confocal-SEM correlation is more applicable for imaging exosomes. Moreover, we observed that exosomes were found in clusters in confocal-SEM correlation.
Introduction
The advancements in imaging technology have led to the evolution of correlative microscopy. This technique involves the combination of multiple microscopes, with the pairing of light and electron microscopes being particularly common. Such integrated systems are referred to as correlative light and electron microscopy (CLEM). 1
In this system, the fluorescent microscope provides a wide imaging area and gives general information about the localization of the molecule of interest that is fluorescently labeled. However, the fluorescent microscope resolution does not provide information about the ultrastructure of molecules. 2 Although electron microscopy (EM) has a narrow imaging area and difficult labeling process compared with fluorescence microscopy (FM), it excels in providing ultra-detailed image with its unique resolution capacity. Correlative microscopy, which combines the advantages of these two different microscopes, allows for the study of the structure and function of biological specimens at the highest resolution. Consequently, correlative microscopy yields comprehensive information from a single sample. 1
The fluorescent microscope offers a broad imaging area and provides general insights into the localization of fluorescently labeled molecules of interest. However, its resolution limitations prevent a detailed examination of molecular ultrastructures. 2 In contrast, EM has a narrower imaging scope and involves a more complex labeling process compared with FM. Nevertheless, EM offers exceptionally detailed images due to its unique high-resolution capabilities. Correlative microscopy, by integrating these diverse advantages of fluorescent and electron microscopes, enables the comprehensive study of both the structure and function of biological specimens at the highest possible resolution. Consequently, correlative microscopy yields much information from a single sample. 1
Nevertheless, this technique poses substantial challenges during sample preparation 3 due to the fundamental differences in the protocols for preparing samples for FM and EM. These procedures are inherently incompatible, necessitating a careful balance between preserving the fluorescent signal for FM and capturing the ultrastructural details required for EM. When devising a preparation procedure, it is crucial to establish a delicate equilibrium between these two imaging systems. As a result, it is imperative to conduct FM imaging before EM imaging. This sequence is essential to mitigate the quenching effect caused by electrons, contrasting agents, and the vacuum environment, which can adversely affect the fluorescent signal.
Exosomes, ranging in size from 30 to 150 nm in diameter, are nanovesicles emerging as a novel mechanism facilitating intercellular communication. Enclosed within a lipid bilayer, these vesicles originate from endosomes. 4 Exosomes, which originate from various cell types including erythrocytes, lymphocytes, dendritic cells, and cancer cells, are released into body fluids such as saliva, plasma, urine, amniotic fluid, bronchial lavage fluid, synovial fluid, and breast milk. 5 To study exosomes, isolation methods such as ultracentrifugation, sucrose gradient separation, or commercially available kits are used to extract them from body fluids. 6 These extracellular vesicles are commonly identified by surface markers, with CD63 being the most widely recognized. In addition, markers such as CD9, CD81, TSG101, and Alix are used for the detection and characterization of exosomes.7,8
Western blot, flow cytometry, dynamic light scattering, and nanoparticle tracking analysis are indirect methods that show the presence of exosomes. 9 However, transmission electron microscopy (TEM) is a technique that allows direct imaging of exosomes. This allows them to be identified based on their size and morphology.10,11
Nevertheless, it is not easy to interpret from black–white EM images without specific labeling. Correlative microscopy ensures an accurate result by combining fluorescent labeling and high resolution. 12 Therefore, correlation microscopy provides accurate and complementary sample information.13,14
The direct imaging of exosomes is crucial for gaining insights into their structure, function, locations, and behavior. However, due to the size range of viruses, which spans from 20 to 400 nm, visualizing nanosized exosomes, which could be smaller than viruses, presents a considerable challenge. 15
In this study, we used a correlative microscope to capture images of the isolated exosomes. For this purpose, exosomes isolated from HeLa cells were first labeled with anti-CD63 antibody and imaged using confocal microscope. Subsequently, they were contrasted and visualized under electron microscope. The acquired images were then correlated and evaluated. Therefore, exosomes were visualized by correlating data obtained from two different microscopes.
Materials and Methods
Cell Culture
HeLa cells were a gift from Esra Erdal Lab (Izmir Biomedicine and Genome Center, Turkey). HeLa cells were cultured in RPMI supplemented with 10% fetal bovine serum (FBS),
Exosome Isolation
Exosomes were isolated from HeLa cells using a Total exosome isolation reagent kit (4478359, Invitrogen Thermo Fisher, US). The kit procedure was then followed. Briefly, when HeLa cells were 70%–80% confluent, the medium containing FBS was removed, and the cells were washed three times with phosphate-buffered saline (PBS). Then, HeLa cells were cultured with FBS-free medium for 24 hr. After collecting the medium, it was centrifuged at 2000 × g for 30 min to remove cells and debris. Subsequently, 0.5 volumes of the Total Exosome Isolation reagent were added.
Incubate samples at 4C overnight. Following the incubation, samples were centrifuged at 10,000 × g for 1 hr at 4C. Afterward, the supernatant was discarded because exosomes were contained in the pellet. The pellet was resuspended with PBS, and the suspension was filtered using a 0.2 µm pores filter. Finally, it was stored at −80C for further studies.
Immunofluorescence
Exosomes were fixed on the grid with 2% Para-formaldehyde (PFA). Blocking was then performed with 0.1% BSA, and exosomes were incubated with anti-CD63 antibody (ab59479, Abcam, UK) for 1 hr at room temperature. Following incubation, fixed exosomes were washed with 0.1% BSA and then incubated with Alexa Fluor 488 antibodies (Thermo Fisher, US) for 1 hr at room temperature in the dark. Then, the fixed exosomes were washed three times with 0.1% BSA. Finally, samples ready for confocal imaging were placed in the correlative holder with the help of forceps. Exosomes were imaged with a Zeiss LSM 880 Confocal Microscope with a 40× water and 63× immersion objective.
TEM Imaging
Five μl of the isolated exosome sample is dropped onto a formvar grid (100 mesh) and incubated for 60 min at room temperature to absorb exosomes onto the grid. Then, the grid is washed three times with PBS. After washing step, exosomes were fixed on the grid with 2% PFA for 10 min. Afterward, the grid was washed three times with PBS to eliminate the fixative residue and then contrasted with 2% uranyl acetate. For this step, uranyl acetate was applied to the grid and then incubated for 15 min. Finally, the sample was air-dried for 5 min and then imaged using the Zeiss Sigma 500 Electron Microscope. 16
SEM Imaging
For SEM imaging, exosomes were fixed on the coverslip. Before fixation, coverslips were coated with 0.01% poly-
Preparation of Exosomes for Confocal-TEM Combination
First, all solutions to be used were passed through a 0.2-μm filter. A 5 μl sample of exosomes was fixed with 2% PFA for 10 min at room temperature. Subsequently, these exosomes were loaded on the grid and incubated for 1 hr at room temperature in a humidified chamber for adsorption onto the grid.
The grid was then washed three times with PBS. Subsequently, exosomes were blocked with 0.1% BSA for 1 hr at room temperature. The sample was incubated with anti-CD63 (1/10) antibody for 1 hr at room temperature. After the incubation, the sample was washed three times with PBS and then incubated with the secondary antibody Alexa Fluor 488 (1/20) in the dark for 1 hr.17,18 After incubation, the sample was washed three times with PBS and then positioned in the Zeiss TEM holder (Fig. 1B), facilitating correlation between the two microscopes. Subsequently, the sample was contrasted with 2% uranyl acetate, and TEM imaging was conducted using a Shuttle & Find-Zeiss Sigma 500 Electron Microscope.
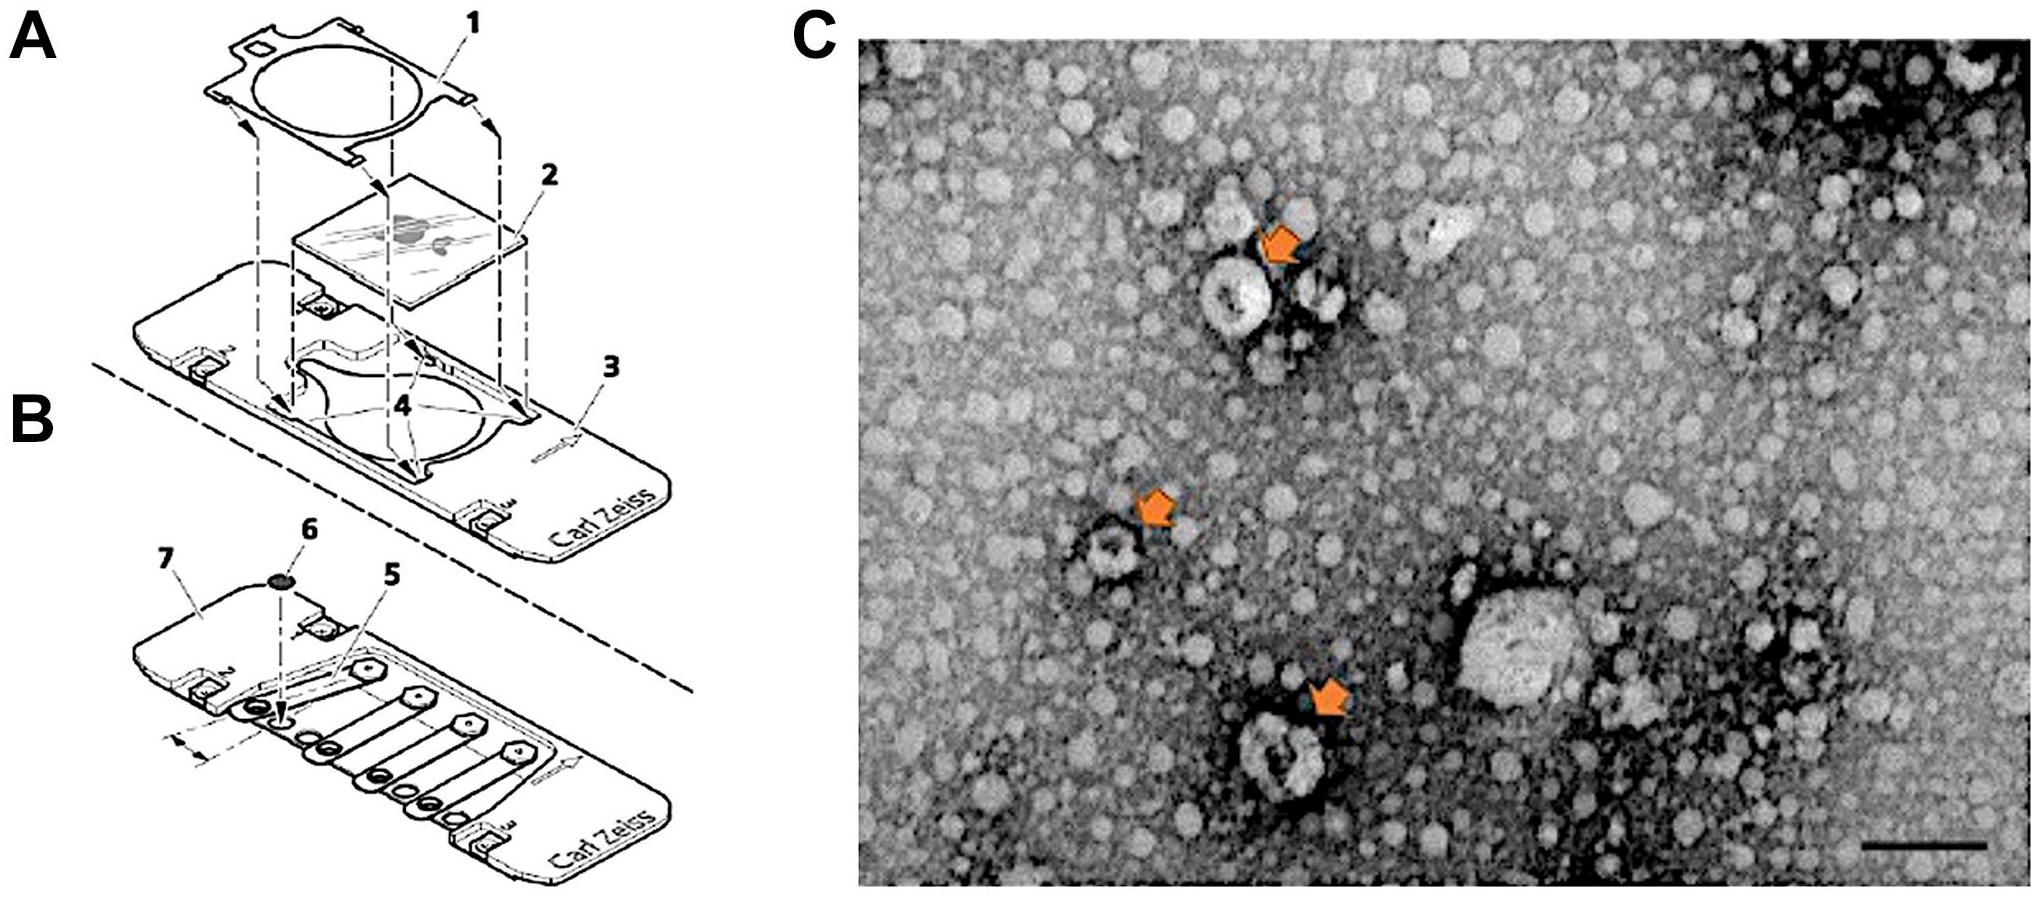
Scanning electron microscope (A) and transmission electron microscope (TEM) holder (B) for correlation. TEM images of isolated exosomes. Arrows show the isolated cup-shaped exosomes. Scale bar indicates 200 nm (C).
Preparation of Exosomes for Confocal-SEM Combination
Exosomes were initially fixed onto coverslips as described above. Subsequently, blocking was performed with 0.1% BSA for 30 min, followed by a 30-min incubation with anti-CD63 antibody. After incubation, exosomes were washed three times with PBS and were then incubated with Alexa Fluor 488 for 30 min in the dark. The sample was subsequently washed three times with PBS. All procedures were carried out at room temperature. 19 The coverslip was then positioned in the SEM holder (Fig. 1A) for confocal imaging. Upon completing the confocal image, the sample holder was covered with parafilm, leaving only the sample part exposed for gold plating with Quorum Q150R. Then, SEM imaging was performed.
Results
Imaging of Exosomes With TEM and Confocal Microscope
Exosomes derived from HeLa cells were loaded onto the grid and fixed with 2% PFA, imaged by TEM, and evaluated based on their size and morphology. Figure 2 shows exosomes smaller than 200 nm and cup-shaped.
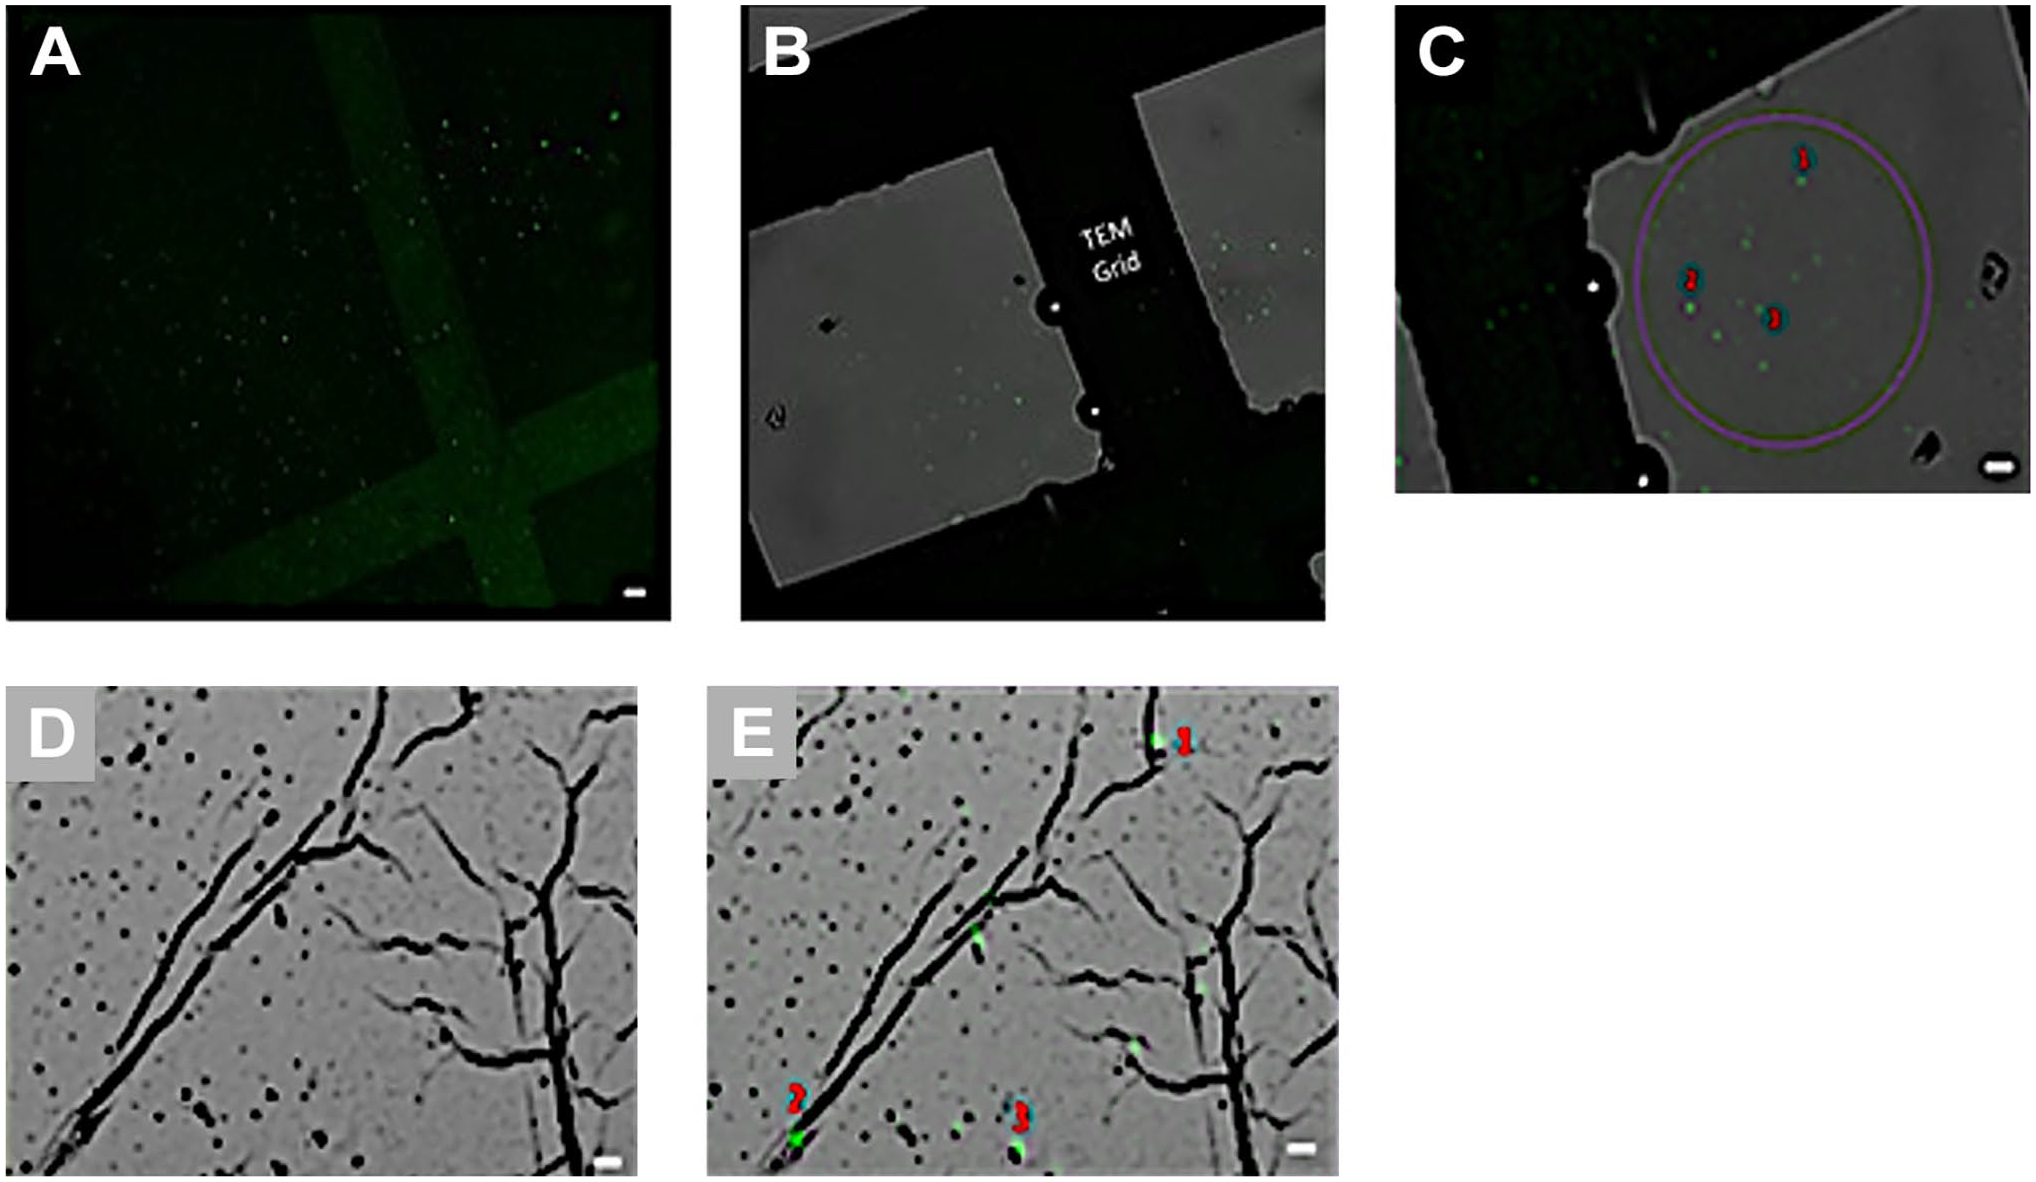
Confocal image of exosomes on grid (A) without and (B) with Transmitted light detector (T-PMT detector) (×40). Correlative images of exosomes by combination with confocal microscope and transmission electron microscope (TEM). (C) is confocal, (D, E) is TEM image of exosomes, determination of correlation points between 2 images showed with red numbers (C, E). Correlative microscopy image of exosomes (E). The scale bar indicates 2 µm.
To visualize exosomes through confocal microscopy, they were immobilized on a grid and labeled with the anti-CD63 antibody. However, imaging was performed using a T-PMT detector (Bright field detector) to facilitate correlation with TEM images. Figure 2 shows exosomes imaged with and without using the T-PMT detector (Fig. 2A and B).
In the correlative microscope, exosomes were observed as green dots due to the 200 nm resolution limit (Fig. 2A). High-resolution TEM and SEM images of these exosomes were then provided.
Imaging of Exosomes by Correlative Microscopy With Confocal-TEM Combination
Exosomes were loaded onto the grid for confocal-TEM correlation. Imaging of the confocal microscope was performed according to CLEM principles before TEM imaging to avoid quenching the fluorescent signal. For the correlation image, the grid was placed in the correlation holder to stabilize the sample between the two microscopes.
Before confocal imaging, a calibration step was undertaken using markers within the correlation holder. Subsequently, the coordinates of the images were determined with the assistance of these markers; these coordinates, recorded during confocal imaging using the Shuttle and Find program, were later used for the correlation process during TEM imaging.
Exosomes were imaged using confocal microscopy with a 40× T-PMT detector and a water immersion objective (Fig. 2C). As the sample in the holder could not be covered with a coverslip during imaging, ultrapure water was applied to prevent drying caused by the heat produced by the laser.
After capturing the confocal image of the exosomes, they were prepared for TEM imaging without being removed from the grid holder. For TEM imaging, exosomes on the grid were contrasted with 2% uranyl acetate and then air dried. Subsequently, the holder was positioned in the TEM adapter, and confocal images along with coordinates were loaded into the imaging program (Zen 2 SEM program) before initiating the imaging process.
During TEM imaging, the coordinates from confocal images were identified, and TEM images were captured from these specified areas. Subsequently, for precise adjustments, three correlation points were determined in each image based on the positions where the fluorescent signal was received, and these same points were also identified in the TEM image (Fig. 2C and D).
When selecting the correlation points, care was taken to avoid a narrow area, as narrowing could lead to a deterioration in correlation. Following the determination of these points, the correlation image was generated (Fig. 2E). The correlation images revealed an overlap of fluorescent signals with exosomes in the TEM image (Fig. 2C and E). Combining information from two distinct microscopes now confirms that these green dots indeed represent exosomes.
Imaging of Exosomes by Correlative Microscopy With Confocal-SEM Combination
Exosomes were fixed to the cover glass and were initially captured using a confocal microscope at 63× magnification. This specific magnification could not be applied during TEM imaging as the grid could not be covered with a coverslip. Consequently, for Confocal-SEM correlation, exosomes were imaged at higher magnifications under the confocal microscope.
After confocal imaging, the sample underwent preparation for scanning electron microscopy (SEM), involving drying and coating with gold particles using a Q150R coater. Subsequently, SEM imaging was performed (Fig. 3A and B). The correlative image showed an overlap between fluorescent signals and spherical structures (Fig. 3C and E). This observation validated the success of the correlation. Nevertheless, based on the results derived from the confocal-SEM correlation, it can be inferred that the green dots observed in the confocal microscope image originated from a cluster of exosomes rather than a single exosome.
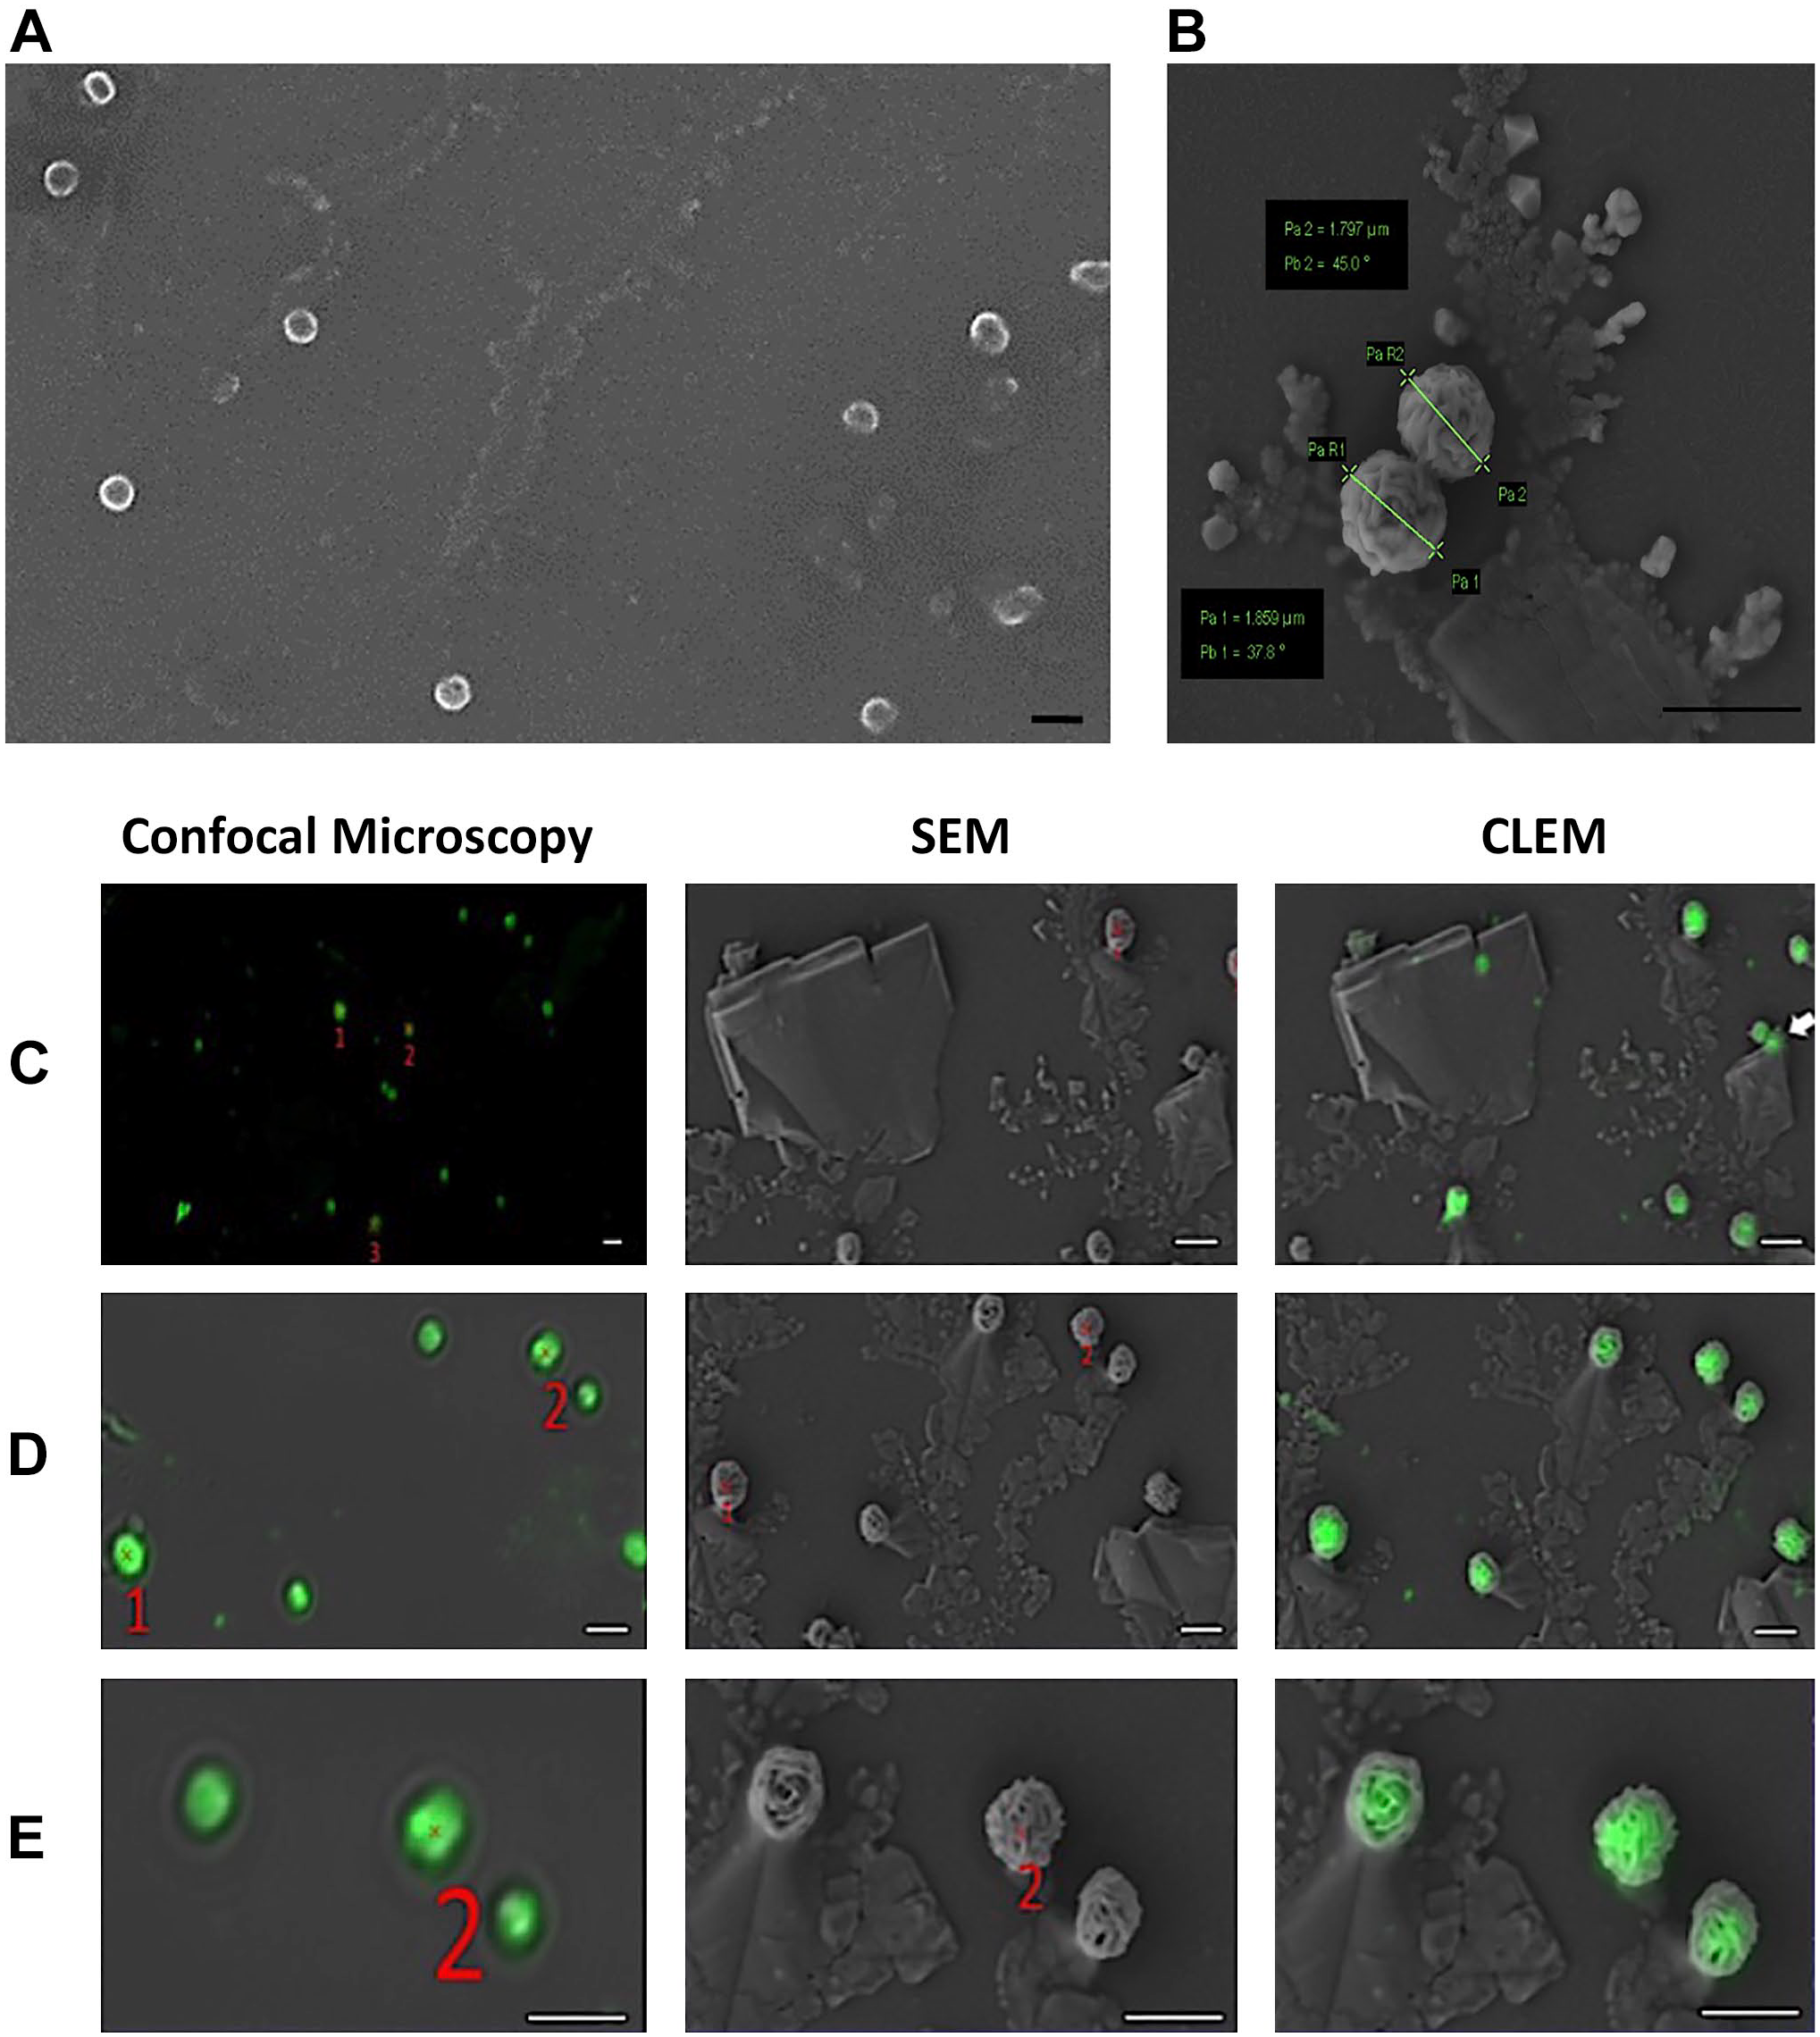
Scanning electron microscope (SEM) imaging of exosomes. Exosomes are seen as spherical structures (×3800) (A) with 1600–1800 nm in size (×16,000) (B). Correlation images of exosomes by combination with confocal microscope and SEM (C–E). The scale bar indicates 2000 nm. Abbreviation: CLEM, correlative light and electron microscopy.
As the sizes of the spherical structures were measured in the SEM image, it became evident that they could not be attributed to a single exosome. Consequently, drawing on findings from other studies, it can be asserted that these structures represent exosome clusters. 7 Previous studies have indicated that HeLa cell exosomes tend to form clusters. 15
In Fig. 3B, the diameter of the spherical structures was examined. Strikingly, it was observed that the diameters of these structures remained consistent across all images taken from different areas, measuring approximately 1600–1800 nm in size (each experiment was repeated three times).
In Fig. 3C, an exosome cluster, previously overlooked in the SEM image as it remained obscured under a salt crystal, became evident in the correlation image due to the fluorescent signal. Consequently, this correlation image provided a comprehensive view, filling in the previously missing part of the picture.
Figure 3C and E displays correlation images obtained from various regions of the sample. Notably, these images reveal a precise overlap of CD63 protein-specific fluorescent signals with the SEM image.
Figure 4 depicts a close-up view of exosome cluster-like structures. These structures appear as many interlocking rings or membranes.
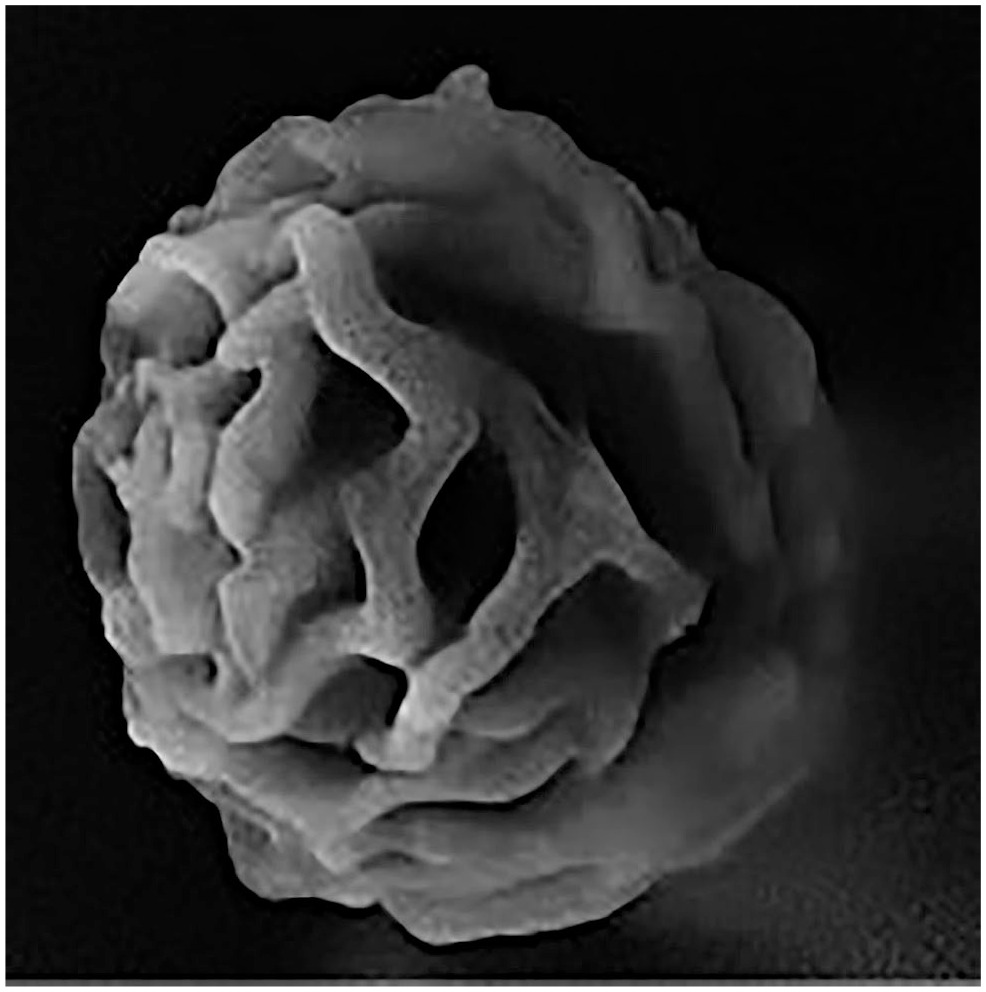
Scanning electron microscope imaging of an exosome cluster at ×80,000 magnification.
Discussion
The morphology and size of exosomes are critical for defining their physiological roles, distributions, and concentration in tissues. 20 The accurate way of determining these properties is to visualize them directly. To image them, TEM is usually used because their size is outside the resolution limits of most optical microscopes. However, exosomes are characterized based on their morphology and size by TEM.
However, if different structures with similar morphology and size coexist in the same area, the reliability of the results may become questionable. In such cases, the method lacks objectivity and requires supplementary support from diverse techniques. Correlative microscopy addresses this limitation by amalgamating two distinct microscopes, thereby enhancing the accuracy and reliability of the information obtained.
We used two distinct CLEM combinations, namely confocal-TEM and confocal-SEM. It is important to note that confocal-TEM correlation comes with several limitations. This is due to the necessity of capturing images without compromising the fluorescent signal, followed by working with chemicals that can cause the fluorescence signal to fade.
Here, it is necessary to determine the priority and balance very well. Another limitation is that you need a super-resolution microscope for the optical part of the correlative microscope, especially when working with nanosized samples. In this study, we have shown an example of how to image exosomes with a conventional confocal microscope if you do not have access to a super-resolution microscope.
Transparent and flat surfaces such as glass are used for confocal imaging. However, the formvar layer causes difficulties because it is less durable and transparent than glass. Specifically, it causes background interference that prevents clear visualization of nanostructures such as exosomes. In addition, the instability of the Formvar layer on the grid tends to crack or tear under laser heat. 21 We experienced all these problems in our study and ultimately obtained a low-quality TEM correlation compared with the SEM correlation.
The drying process also induces damage to the Formvar layer, leading to tearing or cracking. Cons-equently, the coordinates of the image areas captured by the confocal microscope are altered, resulting in the loss of the imaged area and rendering correlation unfeasible. Therefore, the process had to be multiple times to achieve the best image with minimal grid damage. Nevertheless, images of comparable quality to confocal-SEM correlation could not be obtained.
Another disadvantage of the Formvar grid is its incompatibility with immersion objectives, preventing the use of a 63× immersion objective in the confocal microscope for TEM correlation of exosomes. Consequently, exosomes were imaged at a lower magnification (40×), leading to a reduction in imaging quality. Given these limitations, the use of grids for CLEM poses challenges. 2
In our study, during confocal-SEM correlation, we observed a tendency of exosomes isolated from HeLa cells to form clusters. Likewise, other studies examining exosomes from HeLa cells have reported that these exosomes tend to aggregate in clusters rather than remaining freely dispersed. Edgar and colleagues reported that HeLa exosomes were in a cluster due to EM and biochemical analysis, and these structures were exosomes. Another study found that some immune cells, Epstein–Barr virus and infected B cells also produce clusters of exosomes. 15
In addition, another research group reported that exosomes isolated from mouse melanoma cells, such as B16F0 and SKBR3 cells, were found in clusters. 8 They also noted that in SEM analysis, the exosomes exhibited a tight adherence to their membranes, appearing to be completely fused. Importantly, the clustering phenomenon observed was deemed a natural process and not a result of the sample preparation procedure. This distinctive clustering behavior was not observed in other vesicles, such as apoptotic and necrotic bodies imaged by SEM. Furthermore, the rationale behind their appearance as clusters in the SEM image was attributed to the fact that SEM requires fewer preparation steps than the TEM procedure. 20
Consistent with these findings, we observed that exosomes isolated from HeLa cells formed clusters in the SEM image. Notably, our study used a comprehensive approach, utilizing both SEM and the CLEM procedure. Interestingly, our correlative images revealed that exosome clusters exhibited consistent diameters (1600–1800 nm) and morphology.
In conclusion, this study used correlative microscopy, specifically integrating confocal-TEM and confocal-SEM, to visualize isolated exosomes. The cor-relative technique not only enabled the differentiation of exosomes from various micro-vesicles based on their size but also provided insights into their unique molecular composition. It is worth noting that, in this study, confocal-SEM correlation proved to be more applicable than confocal-TEM correlation.
Furthermore, our observation of exosomes forming clusters in the confocal-SEM correlation revealed an intriguing consistency in the diameter of each exosome cluster. This behavior of exosomes needs to be evaluated in further studies.
Our findings emphasize the necessity of adopting a multi-platform approach for the comprehensive characterization of exosomes. Simply assessing them based on size and morphology may prove insufficient. The application of correlative microscopy in imaging has the potential to unveil numerous unknowns in various biological processes where vesicular structures play a crucial role. However, it is important to note that the sample preparation process for CLEM remains an area that requires further refinement.
Footnotes
Acknowledgements
We would like to thank the Imaging core of IBG-İzmir (International Biomedicine & Genome Center, İzmir/Turkey) for all facilties.
Competing Interests
The author(s) declared no potential conflicts of interest with respect to the research, authorship, and/or publication of this article.
Author Contributions
The authors have collectively contributed to this article as follows: design of the work (SD, EE, HAB), performing sample preparation and writing manuscript (SD), and imaging and analyzing the results (SD, HAB).
Funding
The author(s) disclosed receipt of the following financial support for the research, authorship, and/or publication of this article: This research received support from the Research Fund of Dokuz Eylul University (grant number 2018. KB.SAG.068).