
Abstract
The present study was performed to determine the influence of absence of angiotensin type 1A (AT1A) and/or AT1B receptor feedback regulation of kidney neuronal nitric oxide synthase (nNOS) and renin protein expression. Kidneys were harvested from wildtype (WT), AT1A −/-, AT1B −/-, and AT1A −/-AT1B −/- mice and immunostained for nNOS and renin protein localization. AT1A −/- and AT1A −/-AT1B −/- kidneys demonstrated an increase in the percentage of glomeruli with nNOS-positive afferent and interlobular arterioles compared with WT mice. Density of vascular nNOS immunostaining was 20-fold higher in kidneys of AT1A −/- and AT1A −/-AT1B −/- compared with WT mice. Density of macula densa nNOS immunostaining was 7-fold higher in AT1A −/-AT1B −/- than in WT mice. Percent of glomeruli positive for juxtaglomerular (JG) cell renin was 3-fold higher, whereas the density of JG cell renin immunostaining was 15-fold higher in kidneys of AT1A −/- and AT1A −/-AT1B −/- compared with WT mice. Kidneys of AT1A −/- and AT1A −/-AT1B −/- mice displayed recruitment of renin protein expression along afferent and interlobular arterioles. Absence of AT1 receptor signaling resulted in enhanced nNOS protein expression in both microvascular and tubular structures. Enhanced NO generation may contribute to the reduced renal vascular tone and blood pressure observed with blockade of the renin–angiotensin system.
Keywords
T
Targeted null mutations of genes of the major components of the RAS such as angiotensinogen (Agt) (Kim et al. 1995), renin (Yanai et al. 2000; Chen et al. 2007), angiotensin-converting enzyme (ACE) (Krege et al. 1995; Esther Jr. et al. 1996), and AT1 receptors (Ito et al. 1995; Sugaya et al. 1995; Matsusaka et al. 1996; Oliverio et al. 1998a, b; Tsuchida et al. 1998) result in reduced blood pressure and abnormal renal vascular and tubular structures. AT1A −/- mice have reduced blood pressure, slight papillary hypoplasia, hyperplasia of renin-producing granular cells (Ito et al. 1995; Oliverio et al. 1998b; Tsuchida et al. 1998), and significantly dilated efferent arterioles (Harrison-Bernard et al. 2003, 2006). AT1B −/- mice show no significant differences in blood pressure, renal architecture (Chen et al. 1997; Oliverio et al. 1998a), or renal microvascular responses to ANG II (Harrison-Bernard et al. 2006) compared with wild-type (WT) mice. However, AT1A −/-AT1B −/- mice exhibit marked hypotension, hypoplastic papilla, cortical cysts, renal arterial hypertrophy, renal microvascular disease, and tubulointerstitial injury (Oliverio et al. 1998a; Tsuchida et al. 1998; Le et al. 2004; Ouyang et al. 2005). We recently reported that renal juxtamedullary afferent and efferent arterioles of AT1A −/-AT1B −/- mice exhibit larger diameters at baseline, compromised vasoconstrictor responsiveness, and endothelial cell dysfunction (Park et al. 2007). AT1A −/-AT1B −/- mouse kidneys have increased mRNA expression of renin, inducible nitric oxide synthase (iNOS), and neuronal NOS (nNOS), whereas endothelial NOS (eNOS), ACE, and AT2 receptor mRNA expressions are unchanged (Ouyang et al. 2005). However, protein localization and quantification of nNOS and renin have not been previously determined in the kidneys of AT1A −/-AT1B −/- mice.
It is well known that NO plays an important role in the regulation of renal blood flow, glomerular filtration rate, sodium excretion, and tubuloglomerular feedback. Renal effects of NO are mediated by the enzymatic activity of eNOS, iNOS, and nNOS. Classically, NO derived from eNOS is thought to mediate the major effects on the underlying vascular smooth muscle cells. In the kidney, the strongest signals for nNOS immunocytochemistry, enzymatic activity, and mRNA expression are located in the macula densa (MD) cells of the thick ascending limb of the loops of Henle (Mundel et al. 1992). Nitric oxide derived from MD nNOS is an important regulator of renin release and modulates the tubuloglomerular feedback mechanism. It is interesting to note that expression of nNOS has been localized to the vascular smooth muscle cells of aortic (Nakata et al. 2007), cerebral (Tomimoto et al. 1994; Bennai et al. 1999), carotid (Boulanger et al. 1998), and renal interlobular arteries (Bennai et al. 1999). Therefore, regulation of renal microvascular tone by NOS results from the total production of NO by the endothelial, vascular, and tubular cells.
The purpose of the present study was to investigate the interplay of AT1 receptor subtype signaling on the regulation of nNOS and renin protein expression in the kidney. To perform these studies we utilized targeted disruption of each of the AT1 receptor subtypes and the combined deletion of both AT1 receptor subtypes in mice. Quantitative analysis of the number and density of positively stained renal vascular and tubular structures was performed. Our most important, novel finding was that AT1A −/- and AT1A −/-AT1B −/- kidneys demonstrated a significant increase in nNOS protein expression in afferent and interlobular arterioles compared with WT mice, which correlated with similar changes in renin expression. Also, this is the first time that nNOS protein has been colocalized with renin in recruited juxtaglomerular (JG) cells in the preglomerular vasculature.
Materials and Methods
Animals
The procedures used in this study were approved by the Animal Care and Use Committee of Louisiana State University Health Sciences and conducted according to the National Institutes of Health Guide for the Care and Use of Laboratory Animals. Establishment of the mouse colony was performed by rederivation of Agtr1a−/-Agtr1b−/- mice kindly provided by Dr. T. M. Coffman as previously described (Park et al. 2007). Genotyping of mice bred in our colony was performed in duplicate by PCR on DNA obtained by tail biopsy, as previously described (Harrison-Bernard et al. 2006; Shen et al. 2007; Swafford Jr. et al. 2007). Kidneys were obtained from adult male WT (n=6), AT1A −/- (n=3), AT1B −/- (n=3), and AT1A −/-AT1B −/- (n=6) mice that were bred in our colony (n=9) and obtained from Dr. T. M. Coffman (n=9).
Immunohistochemistry
Mice were anesthetized IP with 50 mg pentobarbital sodium. Kidneys were removed and cut coronally or sagittally at the depth of the papilla and prepared by immersion fixation in 10% buffered formalin overnight as previously described (Harrison-Bernard et al. 1997; Prieto-Carrasquero et al. 2004; Park et al. 2007). Kidneys were routinely processed for paraffin embedding and sectioned at a thickness of 3 μm (three serial sections/slide). Consecutive kidney sections were immunostained for α-smooth muscle actin (α-SMA), renin, and nNOS protein by immunoperoxidase technique. Sections were deparaffinized and hydrated in xylene, 100, 95, and 70% alcohol, and treated with 0.3% H2O2 in methanol (30 min) to quench endogenous peroxidase activity. They were then washed (Tris-buffered saline with Tween 20, S3306; Dako, Carpinteria, CA), incubated with biotin blocking system (X0590; Dako) in normal blocking serum (20 min), blotted, incubated with primary antibody (a) mouse anti-human smooth muscle actin monoclonal antibody (1:400, NCL-SMA; Novocastra Laboratories, Newcastle upon Tyne, UK), (b) rabbit anti-rat renin polyclonal antibody (1:4000, generously provided by Dr. Tadashi Inagami; Vanderbilt University), or (c) rabbit anti-rat nNOS polyclonal antibody (1:500, SC-648; Santa Cruz Biotechnology, Santa Cruz, CA) prepared in antibody diluents (90 min; Dako), washed, incubated with biotinylated secondary antibody (30 min), washed, incubated with Vectastain Elite ABC Reagent (45 min; Vector Laboratories, Burlingame, CA), and washed. Peroxidase activity was visualized with 0.1% 3,3′-diaminobenzidine (DAB, SK-4100; Vector Laboratories) and 0.1% H2O2 for 2 or 2.5 min. Sections were washed, counterstained with hematoxylin and bluing reagent, dehydrated in graded alcohol, xylene, mounted (Permount; Fisher Scientific, Pittsburgh, PA), and coverslipped. No immunolabeling was observed when the primary or secondary antibodies were omitted or replaced with an equivalent concentration of preimmune and normal serum. α-SMA immunostained was used to assist in the identification of renal vascular structures. Special care was taken to incubate each tissue section under identical conditions. Slides were imaged using a DP70 Digital Camera System mounted to a BX51 TRF Microscope (Olympus; Tokyo, Japan).
Quantitative Immunohistochemistry
The total number of glomeruli and the number of positively stained structures for each tissue section (2.5-min DAB incubation) were manually counted by two observers who were blinded as to the genotype of the tissue sections. Images of the entire kidney section were obtained using ×4 objective, printed in color, and used as a reference. Using an ×10 objective and viewing a 21-inch color monitor, the location of each glomerulus was indicated on the color print. Positive and negative structures were marked on the print for each glomerulus. The number of glomeruli with positive JG renin or JG cell nNOS immunostaining and the number of tubules with positive MD cell nNOS immunostaining were determined for each tissue section using ×40 and ×60 objectives. In addition, the number of renin- or nNOS-positive afferent arterioles, interlobular arterioles, and arcuate arteries was recorded. Positive structures were expressed as a percentage of the total number of glomeruli for each tissue section. Positive vascular nNOS immunostaining was confirmed by viewing the consecutively stained sections for renin and/or α-SMA.
For densitometric analysis of the immunoreactivity for nNOS and renin protein expression, 10 microscopic fields/section/animal were obtained using ×40 objective and identical image exposure camera settings for all tissue sections as previously described (Prieto-Carrasquero et al. 2004) (n=36; 2-min DAB incubation). Ten microscopic fields provided a thorough representation of the mouse coronal or sagittal kidney section. Images were obtained randomly in the cortical region and were representative of the entire tissue section. All images contained at least one glomerulus. Image-Pro Plus Software (Version 5.1.0.20 for Windows 2000/XP; Media Cybernetics, Bethesda, MD) system provides a computerized determination of the density of the immunoreactivity (sum of the intensity values of all the pixels of a counted object in an analyzed area) and the area (the area comprised of pixels having intensity values within the selected range) of staining in an unbiased manner. Threshold range of the colors of positive immunostaining (brown) was carefully selected so that both faint and strong staining was detected without a high level of background staining. Density of nNOS immunostaining was determined separately for MD cells and vascular tissues by manually outlining these structures. Density of renin immunostaining was determined for all positive JG cells and vascular structures in each field. Results are expressed in arbitrary units of the relative intensity normalized to the WT group.
Data Analysis
Statistical analyses were performed by one-way ANOVA or unpaired t-test as appropriate. Statistical analysis was performed using a statistical software program (SigmaStat 3.5); p<0.05 was considered statistically significant. Values are mean ± SE.
Results
WT, AT1A −/-, AT1B −/-, and AT1A −/-AT1B −/- Animals Kidneys were harvested from adult male WT, AT1A −/-, AT1B −/-, and AT1A −/-AT1B −/- mice with an average age of 4.4 ± 0.4 months (n=18). Body weights of WT, AT1A −/-, AT1B −/-, and AT1A −/-AT1B −/- mice were 32.8 ± 3.4, 33.7 ± 1.2, 31.3 ± 0.2, and 28.8 ± 1.3 g, respectively. Age and body weight were not different among the four groups.
Renal Histology of WT, AT1A −/-, AT1B −/-, and AT1A −/-AT1B −/- Mice
Light microscopic examination of the cortical and medullary regions of the kidney was performed by the authors without prior knowledge of the classification of the slides to the four genotypes. Kidneys of WT and AT1B −/- mice exhibited normal histology and were indistinguishable from each other. All kidney sections from WT and AT1B −/- mice were identified to these two possible genotypes. Five of the six kidneys from AT1A −/-AT1B −/- mice were correctly identified based on a severe kidney pathology, which included thinned cortex, hypoplastic papilla, cortical interstitial inflammation, prominent medial hyperplasia of interlobular arteries and afferent arterioles, tubular atrophy, and glomerular and tubular cysts. All kidneys from AT1A −/- mice were correctly identified based on the normal cortical and medullary architecture and the prominent recruitment of renin protein expression in the preglomerular vasculature.
Renal Immunohistochemical α-SMA, nNOS, and Renin Protein Localization
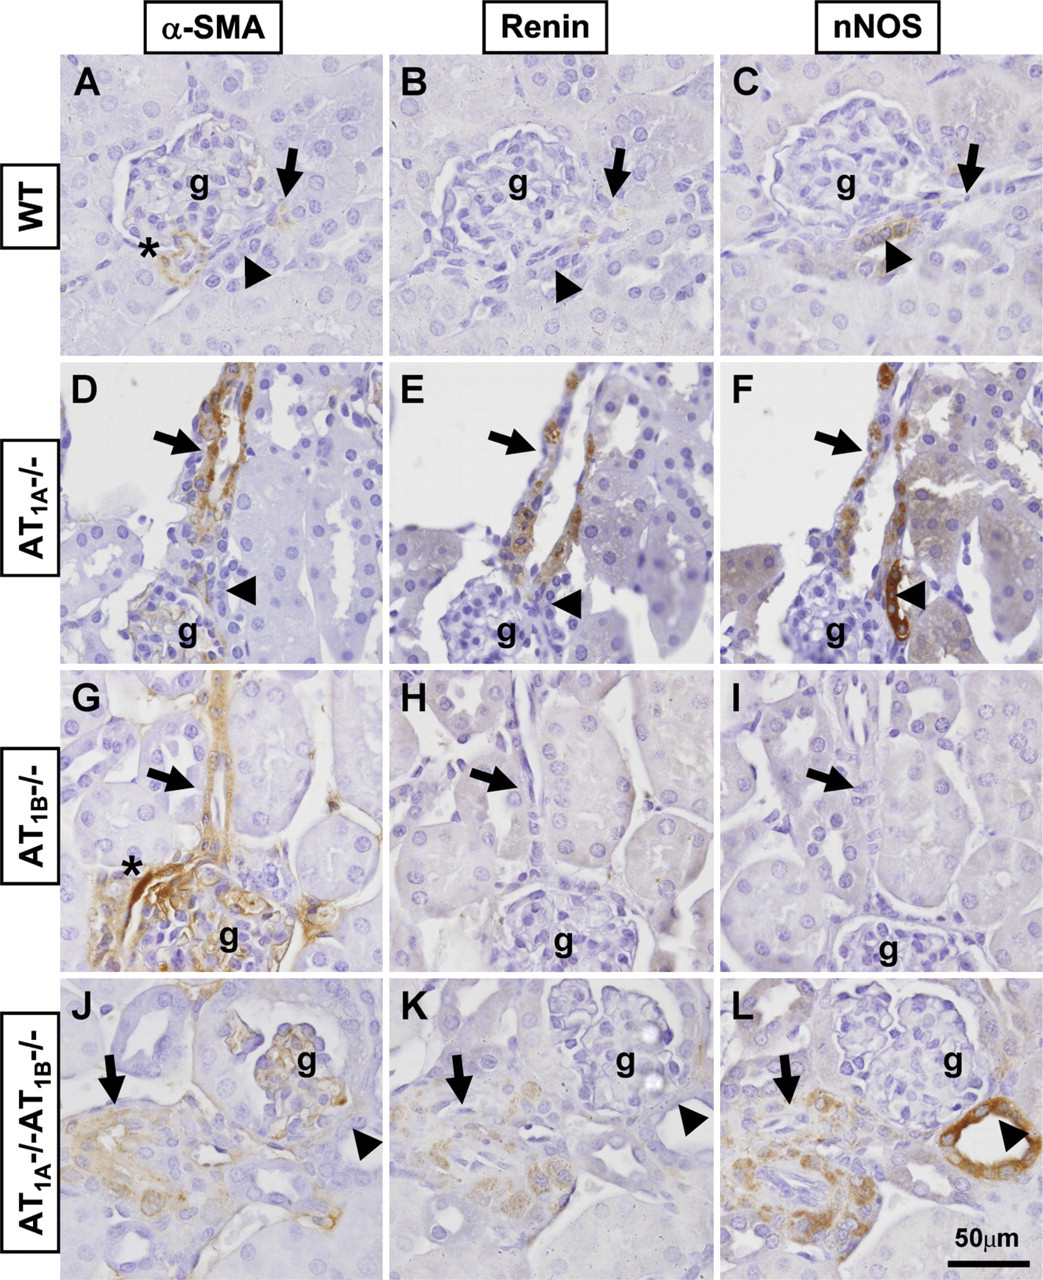
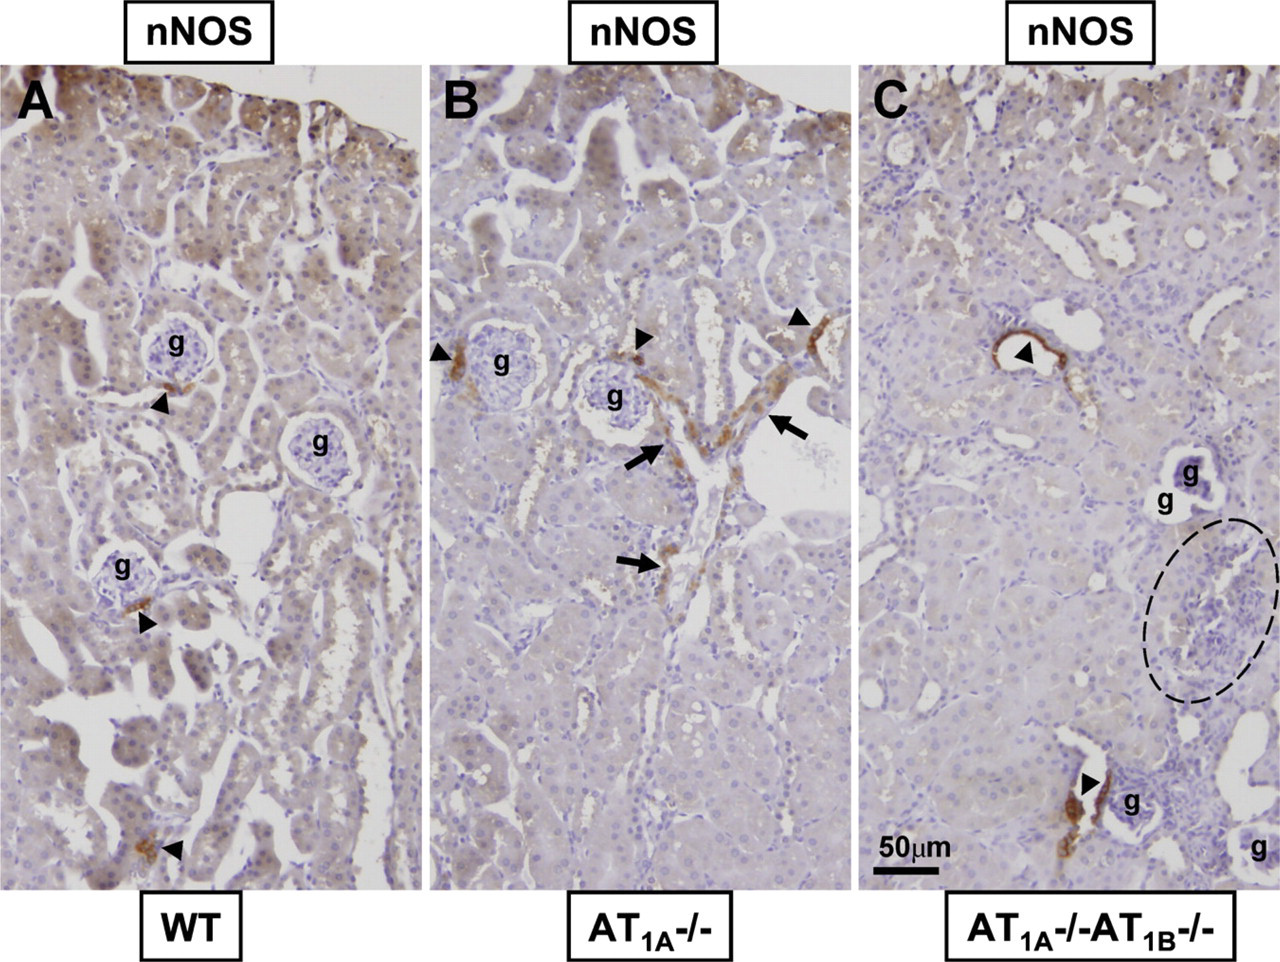
Consecutive kidney sections of WT, AT1A −/-, AT1B −/-, and AT1A −/-AT1B −/- mice were immunostained for α-SMA, renin, and nNOS protein localization and high-power micrographs were obtained (Figure 1). Positive α-SMA immunostaining was used as a marker for the identification of vascular structures within the kidney. Localization of the arcuate arteries and/or interlobular arterioles was used to distinguish afferent and efferent arterioles in each image. α-SMA-positive vascular smooth muscle cells in afferent and efferent arterioles are illustrated in Figures 1A, 1D, 1G, and 1J. Preglomerular arteriolar vessels were thickened in kidneys of AT1A −/- AT1B −/- mice. Renin protein expression is shown in consecutive sections for each genotype (Figures 1B, 1E, 1H, and 1K). In kidneys of WT and AT1B −/- mice, renin was only expressed in JG cells, which showed the typical epithelioid appearance and was never seen expressed along the length of preglomerular arterioles (Figures 1B and 1H). The number of renin-positive JG cells ranged from one to three per glomerulus in WT and AT1B −/- mice. In contrast, renin protein expression was significantly enhanced in JG cells and arterioles of kidneys from AT1A −/- and AT1A −/-AT1B −/- mice (Figures 1E and 1K). Dozens of renin-positive cells were observed in the JG region and vascular structures of AT1A −/- and AT1A −/-AT1B −/- mice. nNOS protein was expressed in the MD cells of all genotypes (Figures 1C, 1F, 1I, and 1L) and was strongly expressed in AT1A −/- AT1B −/- mice. To our surprise, nNOS protein was also expressed in the preglomerular vasculature of AT1A −/- and AT1A −/-AT1B −/- mice (Figures 1F and 1L). Representative low-power magnification of nNOS-positive structures of renal cortical tissue of WT, AT1A −/- and AT1A −/-AT1B −/- mice is shown in Figure 2. It is clear that there is enhancement in the number of nNOS-positive MD cells per glomerulus in AT1A −/-AT1B −/- compared with WT and AT1A −/- mice. Also, prominent nNOS immunostaining is observed in the preglomerular vasculature of AT1A −/- and AT1A −/-AT1B −/- mice. Evidence of infiltration of inflammatory cells in the renal cortex of AT1A −/-AT1B −/- mice is shown (Figure 2C). Together we have documented the renin protein expression profile of AT1A −/-AT1B −/- mice and identified novel nNOS expression in the vascular structure of AT1A −/- and AT1A −/-AT1B −/- kidneys.
Consecutively stained sections (
Quantitative Analysis of Immunohistochemical nNOS Protein Expression and Localization
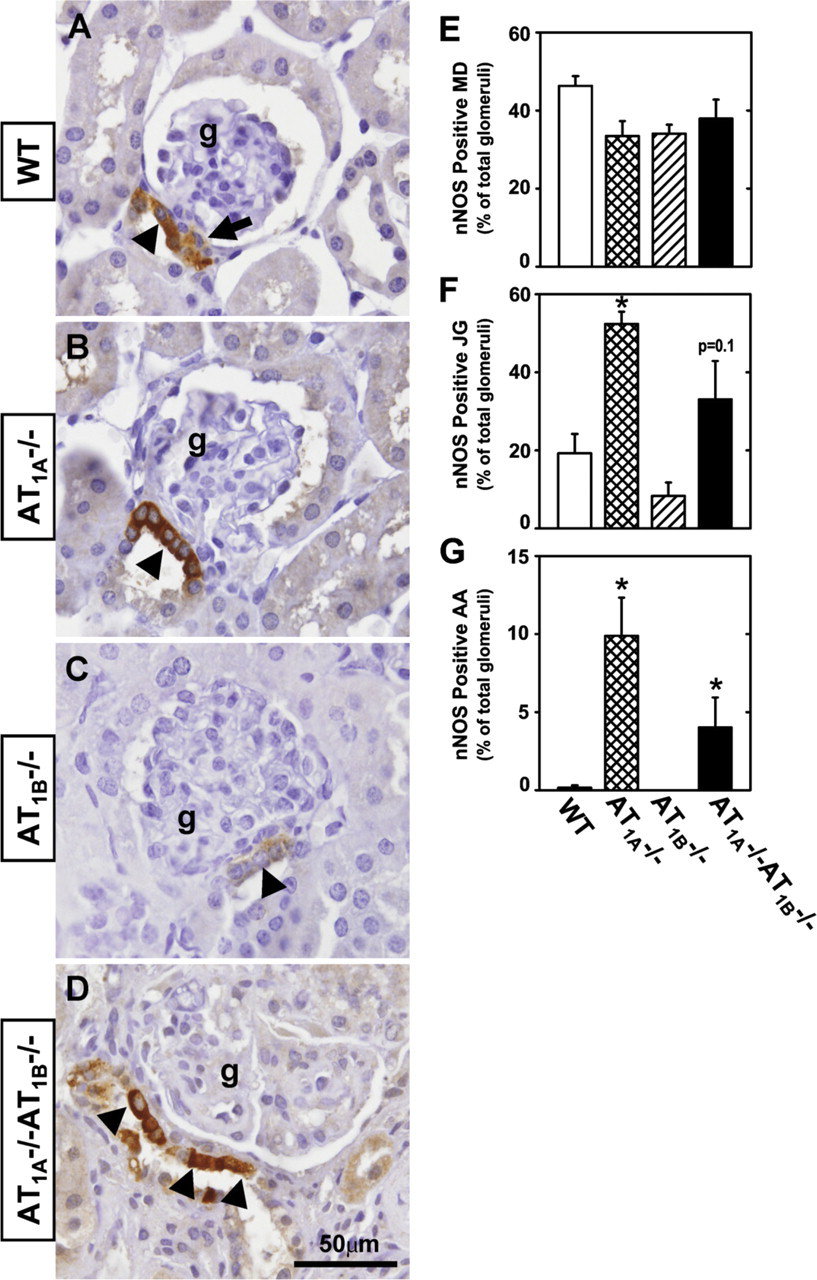
Manual counting of positive nNOS immunostained vascular and tubular structures combined with computer-assisted quantification of density and area of immunostaining were used for investigating the alterations in nNOS protein expression induced by deletion of the AT1 receptors in kidneys obtained from WT, AT1A −/-, AT1B −/-, and AT1A −/-AT1B −/- mice (Figure 3). The total number of glomeruli visible on each tissue section was counted manually and averaged 82 ± 6 glomeruli/section (n=36). The number of distal tubules with at least one nNOS-positive MD cell and the number of glomeruli with at least one nNOS-positive JG cell were counted (Figures 3A–3D). Percentage of the total glomeruli per tissue section with nNOS-positive MD structures was ∼40% and was not different among the four genotypes (Figure 3E). Careful examination of nNOS positively stained JG cells revealed that ∼20% of the total glomeruli of WT mice exhibited nNOS staining of JG cells (Figure 3F). Typically, only one to three JG cells demonstrated faint nNOS immunostaining in WT and AT1B −/- mice. nNOS immunostaining of AT1B −/- was not different from WT mice. However, kidneys of AT1A −/- mice displayed a significant increase in the percentage of glomeruli with nNOS-positive JG cells (52 ± 3%). Percentage of glomeruli with nNOS-positive JG cells in AT1A −/-AT1B −/- mice (33 ± 10%; p = 0.1) was between those of WT and AT1A −/- mice. Total number of nNOS-positive afferent arterioles per tissue section was counted. Examination of nine tissue sections from WT and AT1B −/- mice revealed that of all the visible afferent arterioles, only one afferent arteriole showed nNOS-positive cells. In comparison, a total of 46 afferent arterioles in AT1A −/- and 19 in AT1A −/- AT1B −/- kidneys were positive for nNOS protein expression. When expressed as a percentage of the total visible glomeruli, kidneys from AT1A −/- and AT1A −/- AT1B −/- mice exhibited a significant increase in nNOS-positive afferent arterioles (Figure 3G). All interlobular arterioles of WT and AT1B −/- kidneys were nNOS negative. Total number of interlobular arterioles with nNOS-positive vascular smooth muscle cells was 20 and 7 in AT1A −/- and AT1A −/-AT1B −/- kidneys, respectively, and was significantly different from WT mice (data not shown). The larger arteries of the kidney, arcuate arteries, were negative for nNOS protein expression in all genotypes evaluated.
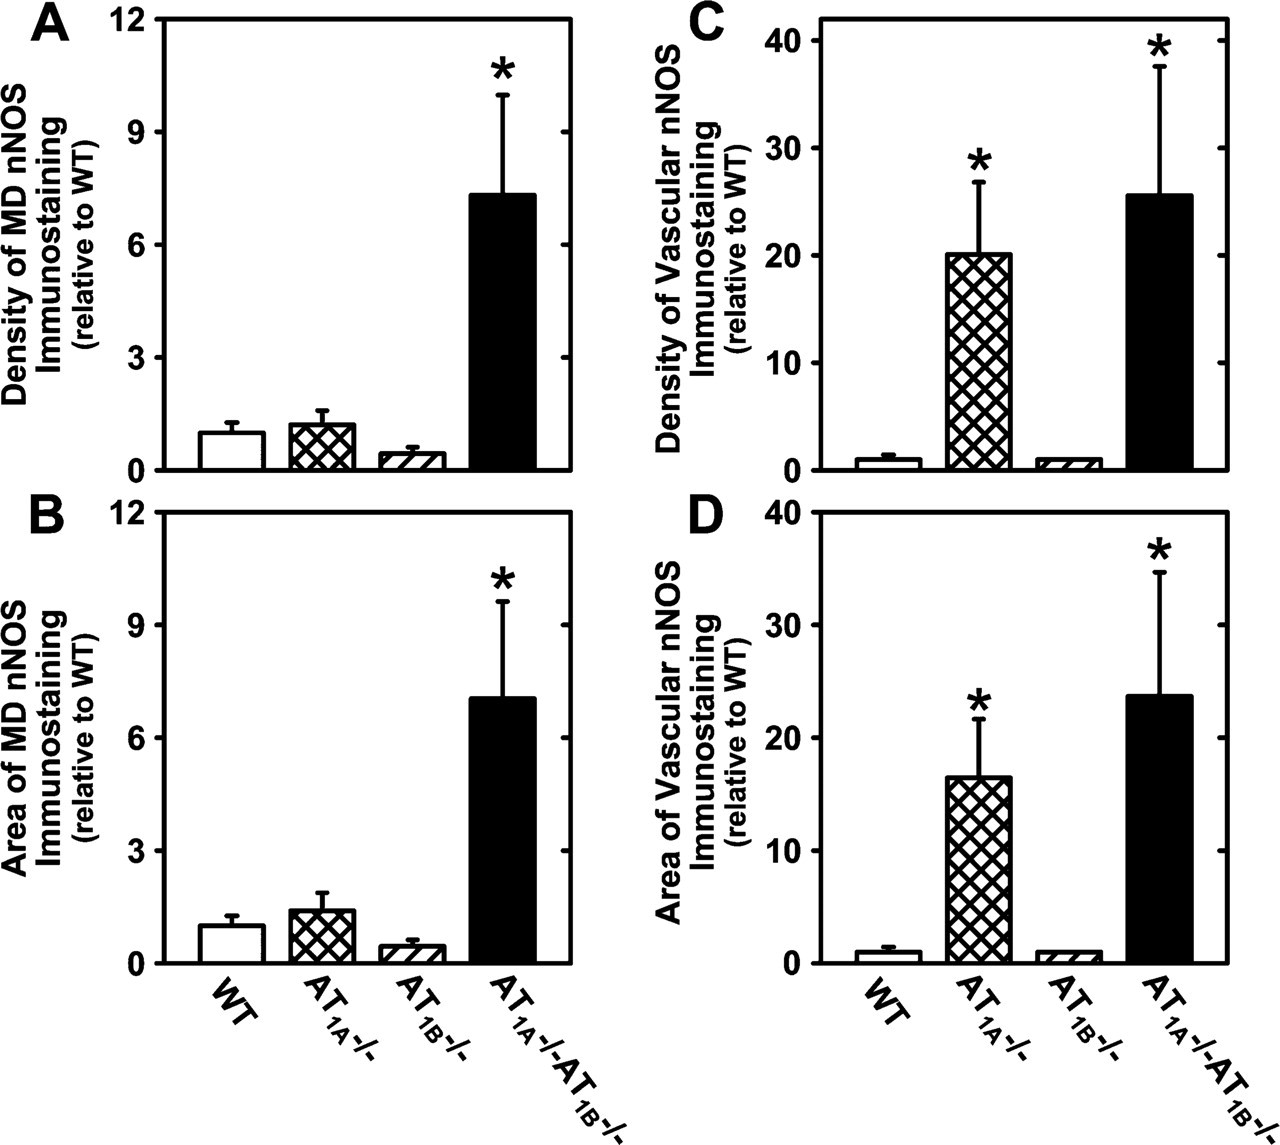
Density and area of nNOS immunostaining were determined separately for MD cells and vascular structures in 10 microscopic fields per tissue section (Figure 4). AT1A −/-AT1B −/- mice showed a 7-fold increase in the density and area of nNOS protein expression in MD cells relative to WT mice (p<0.05). MD nNOS protein expression in AT1A −/- and AT1B −/- was not different from WT mice. Density and area of nNOS immunostaining in all renal cortical vascular structures were assessed. Density of nNOS immunostaining in JG cells was not different between WT and AT1B −/- mice. However, there was approximately a 20-fold increase in the area and density of vascular nNOS immunostaining in AT1A −/- and AT1A −/-AT1B −/- mice relative to WT mice.
Representative nNOS immunohistochemical localization of kidney cortex of WT (
Therefore, using two different quantification tools, we determined the number of nNOS-positive vascular and tubular structures and the density of nNOS protein expression in these structures. Percentage of glomeruli with nNOS-positive MD cells is not different among the four genotypes, but density of nNOS protein expression is significantly enhanced only in AT1A −/-AT1B −/- mice. Percentage of glomeruli with nNOS-positive afferent arterioles is significantly increased in AT1A −/- and AT1A −/-AT1B −/- mice, as well as the density and area of nNOS protein expression in the renal vasculature. Therefore, absence of expression of both AT1A and AT1B receptor subtypes results in increased expression of nNOS in the tubular structures, whereas lack of expression of only the AT1A receptor subtype is associated with enhanced expression of nNOS in the renal preglomerular vasculature.
nNOS immunohistochemical localization (
Quantitative nNOS immunohistochemical analysis of kidney sections of WT (open bars), AT1A
−/- (crosshatched bars), AT1B
−/- (hatched bars), and AT1A
−/-AT1B
−/- (filled bars) mice. Density (
Immunohistochemical Assessment of α-SMA, Renin, and nNOS Protein Localization in AT1A −/- Mouse Kidney
Consecutive sections were immunostained for α-SMA, renin, and nNOS protein expression, and micrographs were obtained using an ×100 oil-immersion lens to demonstrate the cellular localization of these three proteins. A normal JG cell phenotype was observed in WT and AT1B −/- mice in which all JG cells were renin positive but α-SMA negative. Representative micrographs from an AT1A −/- kidney are illustrated in Figure 5. Hypertrophied JG cells are renin and nNOS positive but α-SMA negative. One population of typical vascular smooth muscle cells of the afferent arterioles and interlobular arteriole is strongly α-SMA positive but renin and nNOS negative. Another population of vascular smooth muscle cells of the afferent arterioles and interlobular arteriole is strongly renin and nNOS positive but faintly α-SMA positive. Mixed phenotype of cells expressing both renin and α-SMA was located between the typical smooth muscle cells and JG epithelioid cells as previously described by Kurtz et al. (2007). This second population of renal vascular smooth muscle cells represents a modification from the contractile phenotype to a synthetic phenotype and clearly illustrates the recruitment of nNOS and renin protein expression along the afferent arterioles and interlobular arteriole that was observed in AT1A −/- kidneys. It is interesting to note that many of the renin-positive cells are also nNOS positive. As expected, MD cells are nNOS positive but α-SMA and renin negative. This special colocalization for nNOS and renin represents the possibility that nNOS and renin expression may be controlled by similar AT1 receptor signaling pathways.
Quantitative Analysis of Immunohistochemical Renin Protein Expression and Localization
Renin protein expression was determined using quantitative immunohistochemistry methods in kidneys of WT, AT1A −/-, AT1B −/-, and AT1A −/-AT1B −/- mice (Figure 6). In WT and AT1B −/- mice, only a few JG cells (one to three cells) per JG cell apparatus (JGA) were positively stained for renin (Figures 6A and 6B). However, in AT1A −/- and AT1A −/-AT1B −/- mice, many JG cells (6–12 cells) per JGA were stained positively for renin (Figures 6B and 6D). Percentage of glomeruli with renin-positive JG cells was significantly higher in AT1A −/- and AT1A −/-AT1B −/- compared with WT mice, whereas AT1B −/- mice were not different (59 ± 1, 56 ± 9, 23 ± 3, 15 ± 5%, respectively; Figure 6E). Kidneys of WT and AT1B −/- mice displayed only JG cell renin; arterioles were devoid of renin protein. Examination of tissue sections from WT and AT1B −/- mice revealed that all afferent arterioles, interlobular arterioles, and arcuate arteries were renin negative. In comparison, in AT1A −/- tissues, 56 afferent arterioles, 20 interlobular arterioles, and 8 arcuate arteries were renin positive. Thus, renin expression was observed in small arterioles and larger arcuate arteries in the kidney. A similar trend of positive renin expression in preglomerular vessels was observed in AT1A −/-AT1B −/- mice (35, 17, and 4, respectively). When expressed as a percentage of the total visible glomeruli, kidneys from AT1A −/- and AT1A −/-AT1B −/- mice exhibited a significant 10-fold increase in renin-positive afferent arterioles (Figure 6F) and interlobular arterioles compared with WT mice.
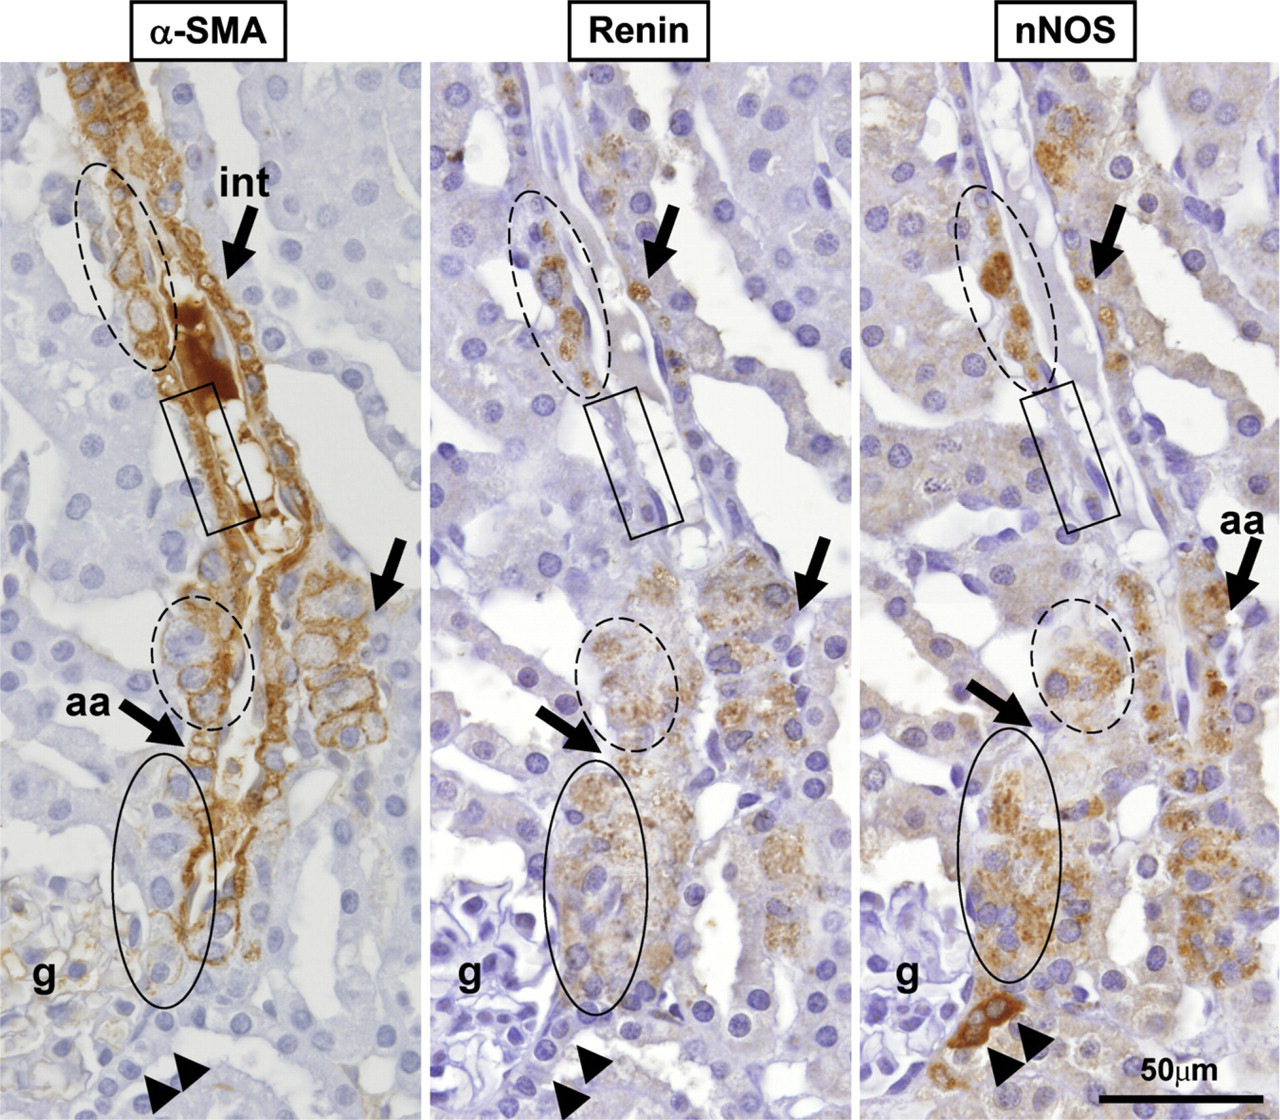
Consecutive sections demonstrating immunohistochemical staining features for α-SMA, renin, and nNOS in the cortical region of an AT1A −/- mouse kidney. Vascular smooth muscle cells of afferent arterioles (aa) and interlobular arterioles (int) are α-SMA positive (left panel). JG cells (solid oval) of a kidney lacking expression of the AT1A receptor is α-SMA negative but renin and nNOS positive. Recruitment of renin (middle panel) and nNOS protein expression (right panel) along the afferent arterioles and interlobular arteriole was observed in the AT1A −/- kidney (dashed oval). Note that the vascular smooth muscle cells that are weakly α-SMA positive are also renin and nNOS positive (dashed oval); however, vascular smooth muscle cells that are renin and nNOS negative are strongly α-SMA positive (solid rectangle). As expected, MD cells (arrowheads) are nNOS positive but α-SMA and renin negative. All images were obtained from the cortical region of the kidney using an ×100 oil-immersion lens. Each panel is the composite of two micrographs. g, glomerulus.
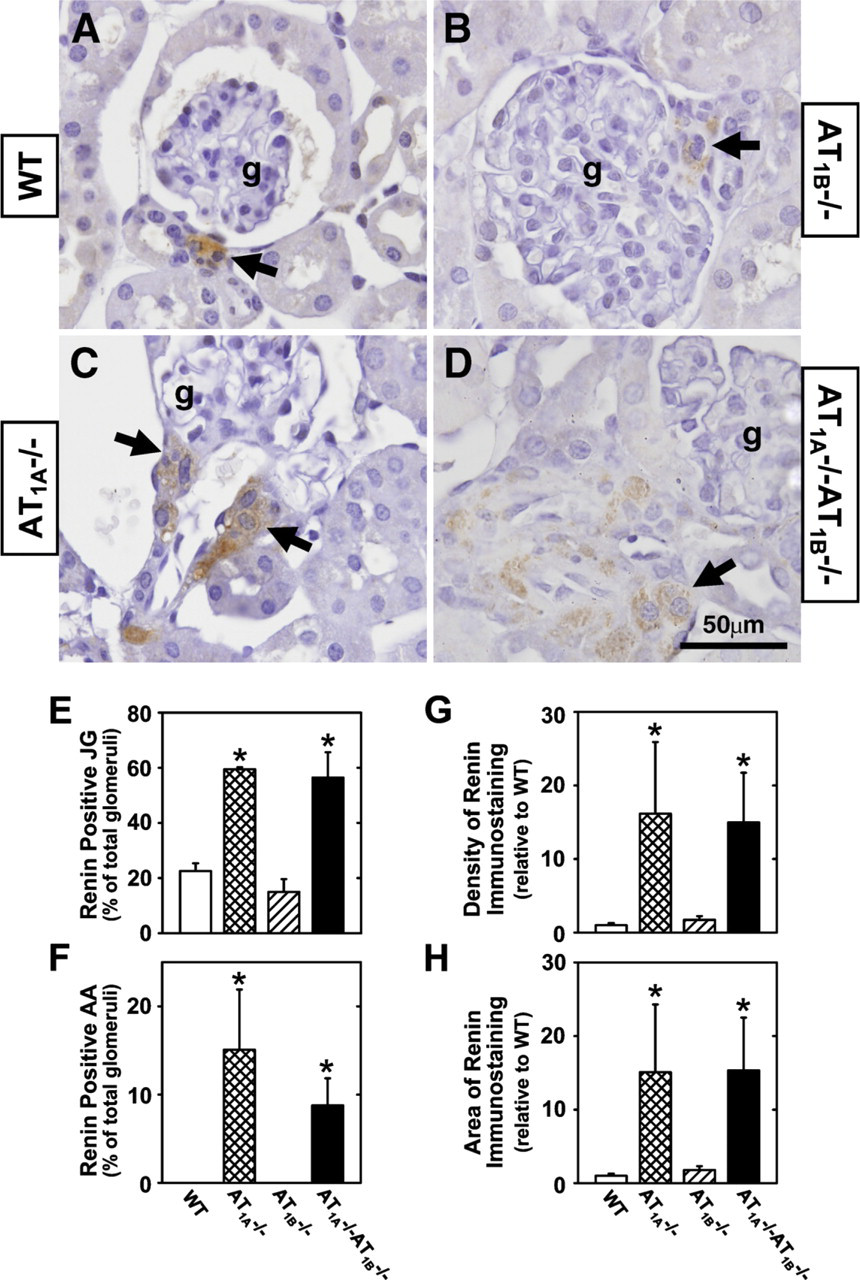
Renin immunohistochemical localization (
Quantitative assessment of the density and area of JG and vascular renin immunostaining was determined in the four mouse genotypes for the AT1 receptor (Figures 6G and 6H). AT1A −/- and AT1A −/-AT1B −/- showed a 16-fold increase in the density and area of renin expression in JG cells and preglomerular vasculature compared with WT mice (p<0.05). Renin immunostaining of AT1B −/- was not different from WT mice. These data suggest that the AT1A −/- receptor is the primary ANG II receptor involved in the regulation of renin expression in the renal vasculature.
Discussion
Pharmacological inhibitors of components of the RAS such as renin, ACE, and AT1 receptors are widely used clinically to treat patients with hypertension, heart failure, and nephropathy, indicating that this system plays an integral role in a number of cardiovascular and renal pathologies. In the present study we utilized transgenic animal models to determine the influence of the absence of function of the AT1A and/or AT1B receptor subtypes on the protein expression patterns of nNOS and renin in the kidney to determine the major AT1 receptor subtype responsible for the feedback regulation of renin and NO synthesis. We found that absence of either the AT1A or the combined absence of AT1A and AT1B receptor subtypes results in recruitment of nNOS and renin protein expression along afferent and interlobular arterioles. Enhanced expression of nNOS by MD cells was only observed in the AT1A −/-AT1B −/- compared with the WT mice. Together these data represent coordinated vascular expression patterns for nNOS and renin in an environment of absence of AT1A receptor signaling. However, upregulation of expression of nNOS in MD cells requires the total absence of AT1 receptor signaling.
Renal Histology
Microscopically, kidneys of WT and AT1B −/- mice displayed normal glomerular, vascular, and tubular structures with a clearly demarcated cortex, medulla, and papilla as described in detail by Kriz and Koepsell (1974). This is in agreement with the original descriptions of these mice made by Chen et al. (1997) and Oliverio et al. (1998a). In AT1A −/- mice, the kidneys displayed similar morphology as previously described by others (Ito et al. 1995; Sugaya et al. 1995; Oliverio et al. 1998b) exhibiting hypertrophy of the JG cells and proximal expansion of renin-producing cells along the afferent arterioles, without evidence for cortical thinning, cysts, or papillary atrophy (Oliverio et al. 1998b). Kidneys of AT1A −/-AT1B −/- mice displayed the severely abnormal phenotype consisting of hypoplastic papilla, renal arterial hypertrophy, cortical thinning, and infiltration of inflammatory cells previously described (Oliverio et al. 1998a; Tsuchida et al. 1998; Ouyang et al. 2005). However, nNOS and renin expression patterns had not been previously reported in AT1A −/- AT1B −/- mice. We found recruitment of nNOS and renin protein expression along the preglomerular vasculature and enhanced MD nNOS protein expression in AT1A −/-AT1B −/- mice. Therefore, we have presented, for the first time, a quantitative assessment of the renal morphology, nNOS, and renin protein localization of all four genotypes for the expression of the AT1 receptor subtypes.
Quantitative Analysis of Renal nNOS Protein Expression and Localization
Ouyang et al. (2005) reported that AT1A −/-AT1B −/- mice exhibit significant increases in renal nNOS mRNA and protein levels compared with WT mice. However, the histological localization of nNOS was not performed in that study. Based on the reports of Kihara et al. (1997) in the Agt−/- mice and Ouyang et al. (2005) in the AT1A −/-AT1B −/- mice and the predominant localization of nNOS to the MD cells, we were not surprised to find that MD nNOS protein expression was enhanced in the kidneys of AT1A −/-AT1B −/- mice. This enhanced synthesis of nNOS in the MD cells may provide a stronger NO signal to the afferent arteriole for modulation of the tubuloglomerular feedback signal, enhancement of renin release, and vasodilatory input. We observed that nNOS-positive cells were distributed beyond the original location of the MD and often occupied the entire cross-sectional profiles of the tubules, as has been described in Agt−/- mice (Kihara et al. 1997). Therefore, regulation of nNOS in MD cells appears to be a result of ANG II signaling through both the AT1A and AT1B receptor subtypes.
Expression of nNOS protein in the renal preglomerular vasculature in the AT1A −/- and AT1A −/-AT1B −/- kidneys was an unexpected and novel finding. A vascular smooth muscle cell source of NO production in the kidney under conditions of AT1 receptor blockade has not been previously reported. Localization of nNOS to the vascular smooth muscle cells has been reported in both renal and non-renal sites. Tomimoto et al. (1994) found that vascular smooth muscle cells in the tunica media of human cerebral blood vessels were weakly stained for nNOS, whereas staining was particularly intense in regions with atherosclerotic changes, which consists of macrophage infiltration and proliferation of fibroblasts. It should be noted that the kidneys of AT1A −/-AT1B −/- mice also demonstrate T-cell and monocyte infiltration representing an inflammatory response located in the cortical regions of interstitial fibrosis (Ouyang et al. 2005), thus presenting a link to the observation in the human vessels. Boulanger et al. (1998) demonstrated that nNOS protein and mRNA are expressed in vascular smooth muscle cells of the rat carotid artery. More recently, Nakata et al. (2007) showed that statin treatment significantly increases nNOS mRNA and protein expression in cultured rat aortic vascular smooth muscle cells and isolated mouse aortas. Most importantly, Bennai et al. (1999) reported the presence of NADPH diaphorase staining in the media and endothelium of renal interlobular arterioles of stroke-prone spontaneously hypertensive rats but not in control Wistar Kyoto rats. Together these data support a potential source for the generation of NO via nNOS within the vascular smooth muscle cells in disease states.
Quantitative Analysis of Immunohistochemical Renal Renin Protein Expression and Localization
Renin-expressing cells are restricted to a JG localization in the adult kidney (Sequeira Lopez et al. 2004; Sauter et al. 2008). Fischer et al. (1995) reported that in the 15-day-old rat kidney, 24% of glomeruli have an attached renin-positive JGA, which is consistent with what we found in the adult WT mouse kidney. The renin phenotype has not been previously described in the kidneys of AT1B −/- or AT1A −/-AT1B −/- mice. We found an increase in the number of renin-positive JG per glomerulus and a recruitment of renin staining proximally along the afferent and interlobular arterioles in AT1A −/- compared with WT mice. Kidneys of AT1A −/- AT1B −/- mice exhibited a similar renin phenotype as the AT1A −/- mice. The phenomenon of renin recruitment is a process whereby a threat to homeostasis, such as dehydration, hypotension, and hemorrhage, results in an increase in the number of renin-expressing cells along the preglomerular arteries, inside the glomerulus, and in the kidney interstitium, resembling the embryonic and fetal pattern (Sequeira Lopez et al. 2004; Sauter et al. 2008). Alternatively, the renin expression profile along the afferent arteriole in the AT1A and AT1A/AT1B null mice may reflect the persistent phenotype observed during kidney development. Lack of AT1A receptor expression and the resultant significantly reduced blood pressure may impede the normal progression of the developmental pattern of renin expression from the preglomerular vasculature to the specific JG cell region. Additionally, lack of AT1-mediated negative feedback on renin synthesis may be playing a role. It is not known if the fetal patterning of renin expression persists in the adult AT1A −/- and AT1A −/- AT1B −/- mice or if the process of recruitment occurs.
Co-localization of Renal nNOS and Renin in the Renal Vasculature
In addition to the developmental pattern of renal renin expression, there is a distinct developmental pattern of nNOS protein and mRNA expression in the porcine and rodent kidneys. The highest levels of nNOS expression are found in the newborn and the lowest levels in the adult kidney (Fischer et al. 1995; Ratliff et al. 2005). Fischer et al. (1995) reported the ontogeny of nNOS and renin in the rat kidney. The number of nNOS-positive distal tubule cells was maximal in the 6-day-old kidney, whereas renin expression was maximal in the 2-day-old kidney (Fischer et al. 1995). Therefore, the newborn rat displays high levels of expression of both of these proteins. Renin, nNOS, and AT1 receptor mRNA expression has been carefully detailed in microdissected afferent and interlobular arterioles during porcine kidney development (Ratliff et al. 2005). It is quite interesting that the preglomerular vascular expression of the AT1 receptor is lowest in the newborn and highest in the adult, whereas renin and nNOS expression are highest in the newborn and lowest in the adult. This pattern of low AT1 receptor and high nNOS and renin expression are also evident in the adult AT1A −/- and AT1A −/-AT1B −/- kidneys presented in this study. In terms of the regulation of nNOS and renin by multiple stimuli, again there are many circumstances in which nNOS and renin protein expression are coordinately regulated. Bosse et al. (1995) have shown parallel changes in renal nNOS and renin expression in the following models: two-kidney, one-clip Goldblatt hypertensive rats, chronic low-salt diet, chronic furosemide treatment, and inhibition of NOS with L-NAME. These parallel changes in NOS and renin suggest an involvement of NO formation in the regulation of renin or vice versa. It seems that the neonatal expression pattern of nNOS and renin persists in AT1A −/- and AT1A −/- AT1B −/- mice such that the absence of AT1 receptors alters the developmental expression profile of vascular nNOS and renin in the kidney.
We have found that blood-perfused juxtamedullary efferent arterioles of AT1A −/- mice (Harrison-Bernard et al. 2003, 2006) and afferent and efferent arterioles of AT1A −/-AT1B −/- mice (Park et al. 2007) studied in vitro exhibit significant dilation at baseline compared with WT mice. Contributing factors to the enlarged afferent and efferent arterioles may be a result of structural alterations in the vessels that occur during kidney development, or the absence of AT1 receptor-mediated suppression of vasodilator systems, or overall enhanced vasodilator effects on the kidney of AT1A −/- and AT1A −/-AT1B −/- mice. It is plausible that NO derived from nNOS may influence arteriolar tone in AT1A −/- and AT1A −/-AT1B −/- mice because an increase in vascular nNOS protein expression has been demonstrated in these mice in the present study. The physiological mechanism of the enhanced nNOS protein expression on renal afferent arteriolar tone will be addressed in future studies using pharmacological NOS inhibition in knockout compared with control mice.
Augmented nNOS protein expression was observed in the MD cells of AT1A −/-AT1B −/- mice, whereas AT1A and/or AT1B receptor deficiency resulted in increased nNOS expression in the primary resistance vessels of the kidney. Absence of AT1A receptors results in a greater percentage of JG cells expressing renin, higher levels of renin expressed in JG cells, and recruitment of renin-expressing cells in afferent and interlobular arterioles. Therefore, there appears to be a divergence between renin and nNOS caused by an additional deletion of the AT1B receptor.
We conclude that targeted deletion of the AT1 receptor is coupled to enhanced nNOS protein expression in renal microvascular and tubular structures and may provide an enhanced ability of the kidney to generate NO. We further speculate that the beneficial effects of inhibition of the RAS may be linked to enhanced expression of nNOS resulting in the local generation of NO within the vascular smooth muscle cells of renal resistance vessels.
Footnotes
Acknowledgements
Grant support for this study was provided by the National Institutes of Health (Grants DK-62003 and P20-RR018766).
The authors acknowledge the excellent technical assistance of Benjamin J. Bivona and Christopher J. Monjure.