
Abstract
Catalase (oxidoreductase, EC1.11.1.6) is a major enzyme involved in the decomposition of hydrogen peroxide (Chance et al. 1979). Catalase is localized in the matrix of peroxisomes in mammalian cells, including human and rat hepatocytes (Yokoda and Fahimi 1981; Bendayan and Reddy 1982; Yamamoto et al. 1988; Espeel and Van Limbergen 1995), bovine and rat kidney cells (Usuda et al. 1988; Zaar 1992), rat neuronal cells (Moreno et al. 1995; Zimatkin and Lindros 1996), and human neutrophils (Ballinger et al. 1994). Catalase has also been found in the cytosol of hepatocytes of sheep (Roels 1976), Rhesus monkey (Roels et al. 1977), and guinea pig (Roels et al. 1977; Geerts et al. 1984; Yamamoto et al. 1988; Bulitta et al. 1996). In addition, alterations in catalase subcellular localization have been observed in association with disease and stress conditions. For example, in the liver of patients lacking peroxisomes, catalase is found in the cytosol of hepatocytes (Kamei et al. 1993).
Several studies have been undertaken to examine subcellular localization of catalase in myocardial tissues. It has been known that catalase is localized in peroxisomes of cardiomyocytes (Herzog and Fahimi 1974, 1975; Hicks and Fahimi 1977; Fahimi et al. 1979; Yokoda and Asayama 1992). Interestingly, a study by Radi et al. (1991) has shown that catalase is localized in mitochondrial matrix of rat cardiomyocytes by biochemical and immunocytochemical methods. However, there were no other studies to support this observation.
Regardless of the subcellular localization, catalase activity in the heart is very low in comparison with other tissues. For example, the catalase activity per gram of heart tissue is about 2% that of liver in rats and mice (Doroshow et al. 1980; Ishikawa et al. 1986; Chen et al. 1994). It was hypothesized that low catalase activity in the heart is partially responsible for the high sensitivity of this organ to oxidative injury (Chen et al. 1994). This hypothesis was tested in our previous studies. We produced a transgenic mouse model in which only catalase, not other antioxidant components, was constitutively overexpressed specifically in the heart at different levels, ranging from 2- to 630-fold higher than normal (Kang et al. 1996). Using this model, we have demonstrated that elevation of catalase activities between 60- and 100-fold higher than normal protected the heart from the toxicity of doxorubicin, an anticancer drug that causes severe heart damage through production of reactive oxygen species (Kang et al. 1996). Furthermore, the catalase-overexpressing transgenic mouse hearts were significantly resistant to ischemia/reperfusion injury (Li et al. 1997) and to anoxia/reoxygenation-induced functional alterations (Chen et al. 1997).
Catalase activities in different lines of transgenic mice in comparison with that in non-transgenic controls a
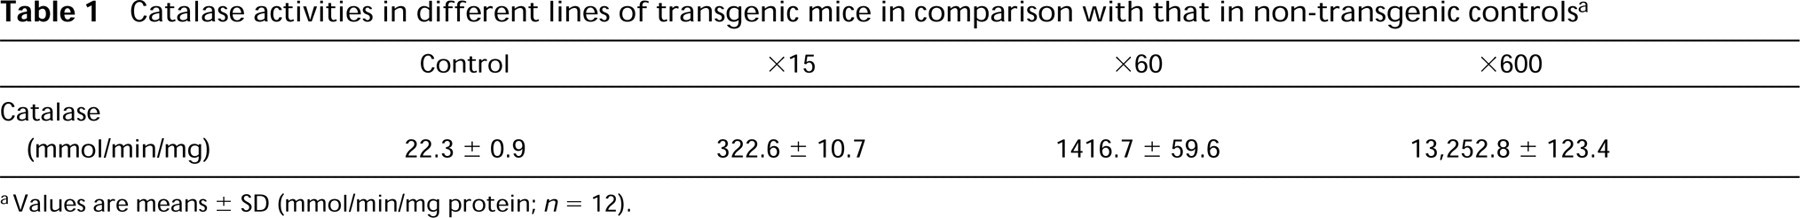
aValues are means ± SD (mmol/min/mg protein; n = 12).
Production of reactive oxygen species by doxorubicin occurs mainly in mitochondria and cytosol. It is therefore important to know the cellular and subcellular localization of the elevated catalase in the hearts of transgenic mice in order to gain a comprehensive understanding of the role of catalase in cardiac protection against oxidative injury.
Materials and Methods
All chemicals and reagents were obtained from Sigma Chemical (St Louis, MO) unless otherwise stated.
Animals
Cardiac-specific catalase-overexpressing transgenic mice and non-transgenic controls, aged 8 weeks and weighing about 25 g, were used for this study. The production of the transgenic mice and their characterization were described in detail previously (Kang et al. 1996). Among the 15 described transgenic mouse lines (Kang et al. 1996), three of them whose cardiac catalase activities are about 600-, 60-, and 15-fold higher than normal were used in the present study. All animals were kept in the Research Resource Center at the University of Louisville and the experimental procedures were approved by the Institutional Animal Care and Use Committee, which is certified by the American Association of Accreditation of Laboratory Animal Care.
Tissue Preparation
The hearts of anesthetized mice were perfused in situ as described previously (Kang et al. 1996), then removed and processed for light or electron microscopic examination, as described below. Kidneys and livers were also subjected to the same procedure for light microscopic examination.
Light Microscopic Immunocytochemistry
The heart tissue was cut into about 3-mm-thick slices, which were fixed with 10% formalin in PBS 0.01 M, pH 7.4, for 20 hr. The tissue slices were dehydrated in graded ethanol and embedded in Paraplast. Tissue sections of 5 ± were cut and mounted on silanized slides. Sections were treated with 3% H2O2 in PBS for 10 min to quench endogenous peroxidase activity. Sections were then incubated in 5% goat serum in PBS for 20 min to reduce nonspecific binding. After tapping the excess goat serum solution, sections were incubated overnight at 4C with a rabbit anti-catalase antibody (Calbiochem; La Jolla, CA) diluted 1:1000, then incubated for 20 min in biotinylated goat anti-rabbit IgG (Zymed Laboratories; San Francisco, CA), followed by incubation with HRP-streptavidin (Zymed) for 20 min. The antibody binding sites were visualized by incubating the tissue sections with DAB-H2O2 solution provided by a DAB kit (Zymed). Finally, sections were counterstained in 0.5% methyl green, dehydrated, and mounted.
To test the specificity of the anti-catalase antibody, an immunoblot analysis was performed. Briefly, heart tissues were homogenized and aliquots containing 10 μg protein were fractionated by SDS-PAGE. After transfer to nitrocellulose membrane, the membranes were incubated with the rabbit anti-catalase diluted 1:2000, then with the HRP conjugate of goat anti-rabbit IgG. An ECL detection system was used to visualize the membranes. A single binding band was identified, which corresponds to the molecular weight of catalase.
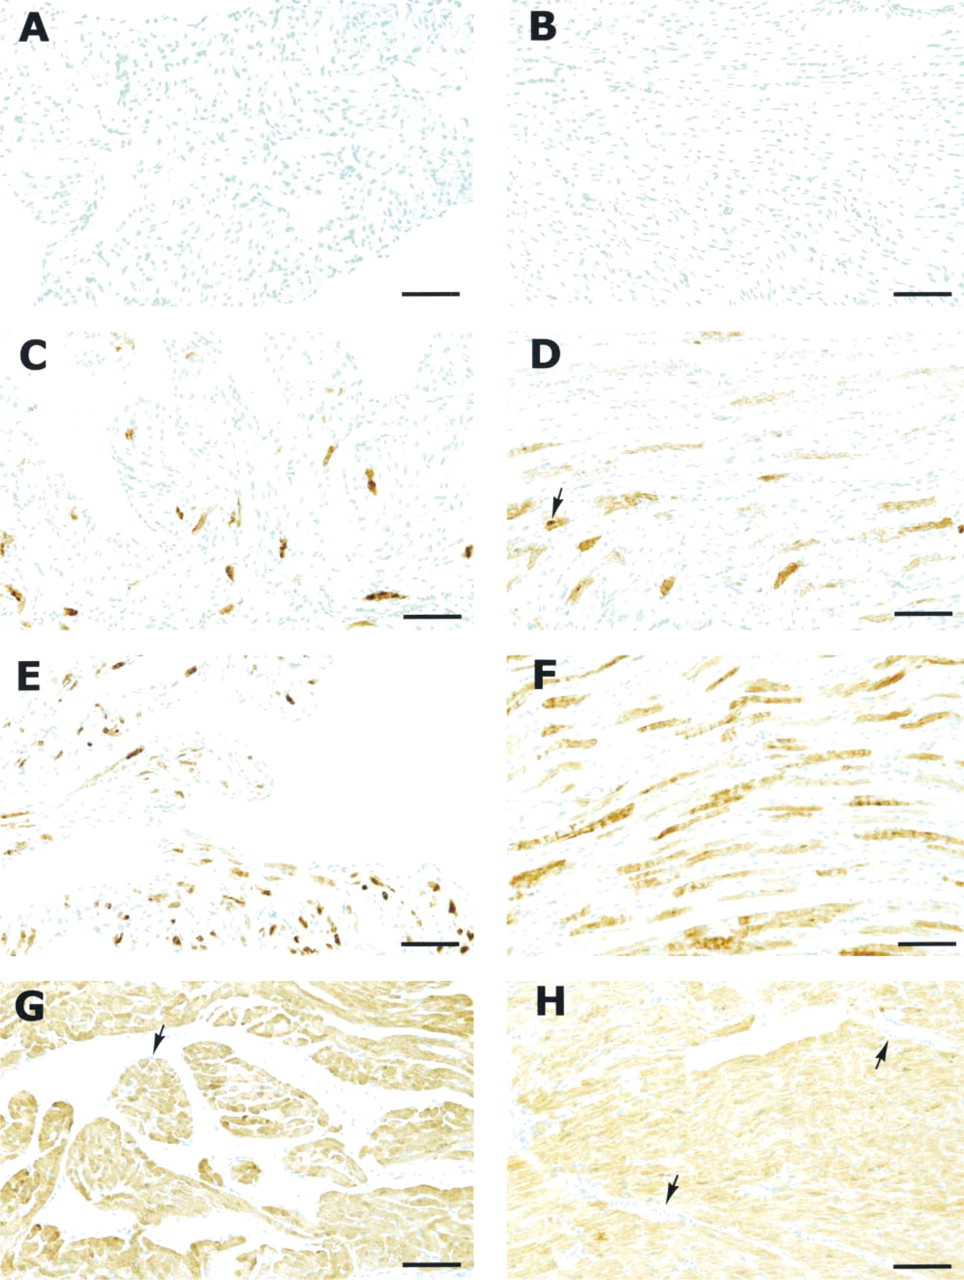
Immunocytochemical localization of catalase in atria and ventricles of non-transgenic and transgenic mice. Both atrium (
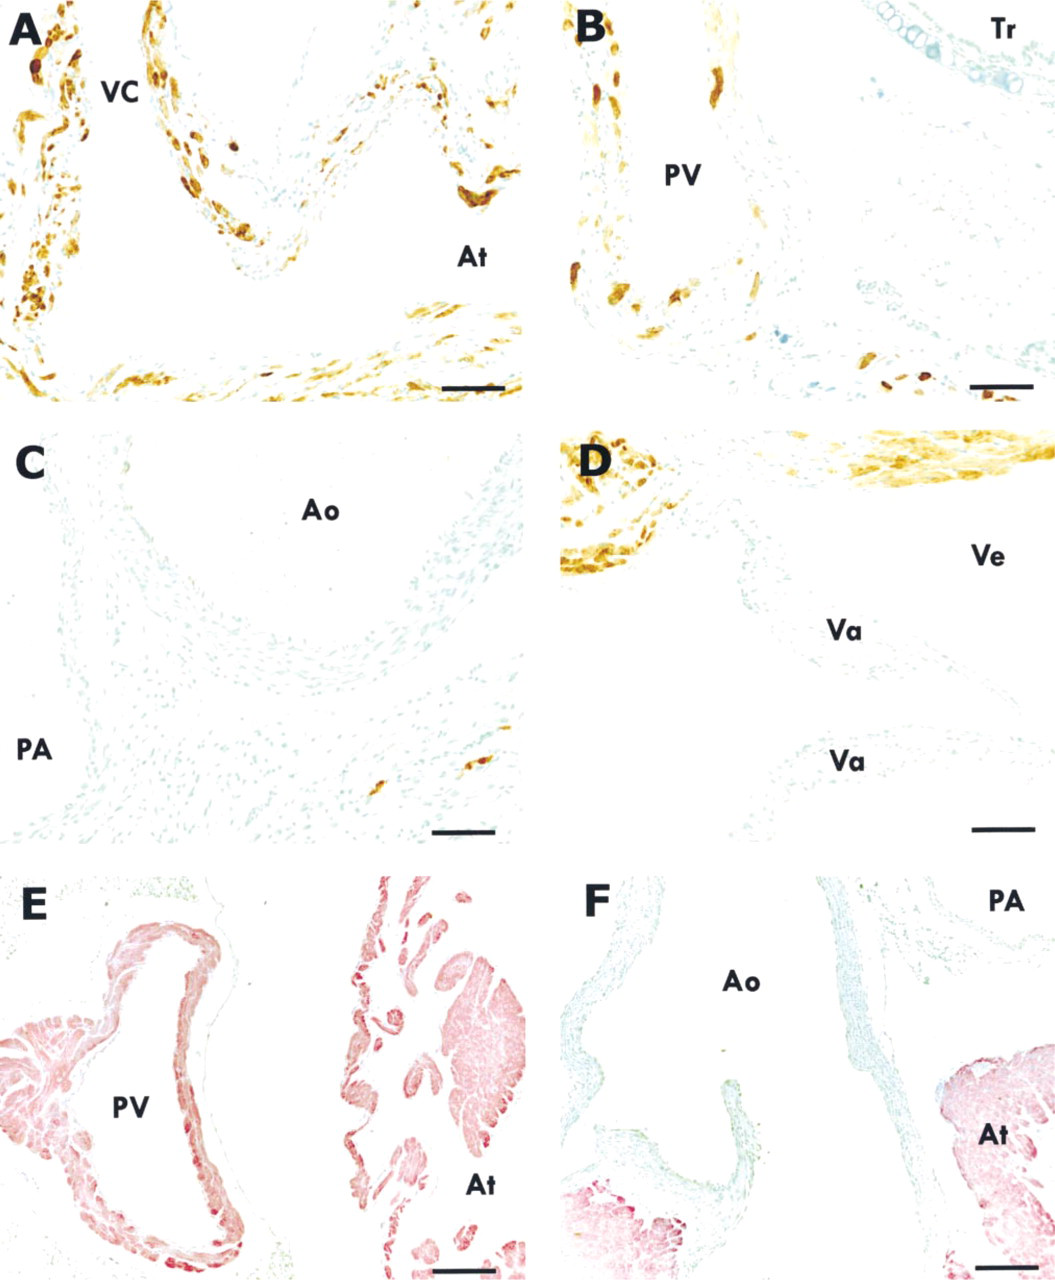
Immunocytochemical localization of catalase in the cardiac blood vessels and valves of transgenic mouse (60-fold elevated cardiac catalase activities). Positive staining was observed in the walls of vena cava (
Electron Microscopic Immunocytochemistry
Left ventricles were cut into pieces of about 1 mm3 and fixed in 2% freshly depolymerized paraformaldehyde with 0.5% glutaraldehyde in 0.1 M sodium cacodylate buffer, pH 7.4, at 4C for 2 hr. After rinsing in sodium cacodylate buffer, the samples were partially dehydrated with 50% and 70% ethanol and embedded in LR White. Ultrathin sections were cut on an LKB ultratome and collected on gold grids. The ultrathin sections were incubated with the rabbit anti-catalase antibody (1:250 dilution) overnight at 4C. After rinsing in 0.01 M PBS (pH 8.2), the ultrathin sections were incubated in protein A-gold (10-nm gold particles; British BioCell, Cardiff, UK) diluted in 0.01 M PBS (pH 8.2) for 2 hr. The ultrathin sections were then rinsed in distilled water and counterstained with uranyl acetate and lead citrate. The labeled ultrathin sections were observed with a Philips transmission electron microscope.
Quantitative Analysis
The number of cardiomyocytes that were immunoreactive to the conjugated anti-catalase antibody on the tissue slides was counted and expressed as percentage of total cardiomyocytes. The number of peroxisomes in cardiomyocytes on the immunogold-labeled ultrathin sections was counted and expressed as number per 100 ±2 cytoplasmic area. The diameter of peroxisomes was measured and the difference between the transgenic and non-transgenic cardiomyocytes was analyzed by Student's t-test. At least 50 fields from each slide were counted at X600 and X10,000 magnification for the light and electron microscopic examination, respectively.
Immunocytochemical Controls
The controls were conducted by (a) preadsorption of the rabbit anti-catalase antibody solution with an excess amount of catalase for 1 hr before incubation and (b) substitution of the rabbit anti-catalase with nonimmune rabbit serum.
Identification of Cardiomyocytes in Cardiac Blood Vessels
A monoclonal antibody against α-sarcomeric actin (Clone 5C5, isotype mouse IgM; Sigma) was used to identify cardiomyocytes in the walls of cardiac blood vessels because the α-sarcomeric actin is a specific protein that is present only in cardiac myocytes. Tissue sections were incubated with the antibody overnight at 4C, then with biotinylated rabbit anti-mouse IgM (Zymed), followed by alkaline phosphatase-streptavidin (Zymed). A red chromogen of New Fuchsin was used to visualize the binding sites.
Catalase Activity
Heart tissues were homogenized in 1% Triton X-100 in the assay buffer described below using a variable-speed tissue tearer (Biospec Products; Racine, WI) at about 20,000 rpm for 30 sec on ice. The homogenates were centrifuged at 6000 × g at 4C for 20 min. The supernatant was diluted with 1.5 volumes of the assay buffer (50 mM KH2PO4/50 mM Na2HPO4, pH 7.0). The enzyme activity was determined by the method described by Aebi (1984). Briefly, in a cuvette 2 ml of sample was added and the reaction was initiated by adding 1 ml 30 mM H2O2, and the change in absorbance at 240 nm was monitored at 25C for 1 min. A portion of the remaining sample was used for protein determination. Specific activity is expressed as ±ol H2O2/min/mg of protein. Protein was determined by the method of Smith et al. (1985) using bovine serum albumin as standard.
Results
Catalase activities in the hearts of the three transgenic lines are shown in Table 1. The results obtained from light microscopic immunocytochemistry to identify cell populations that contain high levels of catalase activities in the heart are presented in Figure 1. In contrast to the negative immunocytochemical reactions of the tissue slides obtained from the non-transgenic mouse heart (Figures 1A and 1B), highly immunoreactive cells were found in the myocardium of all three transgenic lines (Figures 1C-1H). The immunoreactivity was exclusively localized in the cardiomyocytes. The subcellular staining sites were mainly on the cytoplasm. However, nuclear staining was also found in all three transgenic lines. The ratios of the positive cells in the hearts were quite different among the three transgenic lines but agreed with the elevated activities of catalase in these transgenic lines. Further detailed examination revealed that in hearts containing catalase activity about 15-fold higher than normal, immunoreactive cells were present in both atrium and ventricle but occupied only about 25% of the total cell populations (Figures 1C and 1D). In hearts containing 60-fold more catalase activity, a large number of positive cells were observed in both atrium and ventricle (53% of the cell populations were positive; Figures 1E and 1F). In hearts with 600-fold more catalase activity, almost all cardiomyocytes were positive (Figures 1G and 1H). In the cardiac blood vessels, the antibody-stained cells were found in the walls of pulmonary veins and the vena cava (Figures 2A and 2B), which consist of cardiomyocytes, as identified by the staining of the antibody against α-sarcomeric actin (Figure 2E), a specific actin protein in cardiomyocytes. Positive cells were not found in pulmonary arteries, aorta, or cardiac valves (Figures 2C and 2D), which are not composed of cardiomyocytes (Figure 2F).
To confirm the specificity of catalase expression in the hearts of transgenic mice, catalase immunoreactivities in the kidneys and livers of transgenic mice were compared with those in non-transgenic mice. As shown in Figure 3, similar staining patterns were observed in both kidney and liver between the transgenic (myocardial catalase activity 600-fold higher than normal) and non-transgenic mice. In the kidney, the staining of the proximal tubules in the superficial cortex was weak, and the distal tubules and all the glomeruli were negative (Figures 3A and 3C). Strong staining was found on the cytoplasm of proximal tubules in the juxtamedullary cortex (Figures 3B and 3D). The tubules of Henle's loops and collecting ducts in the medulla were negative.
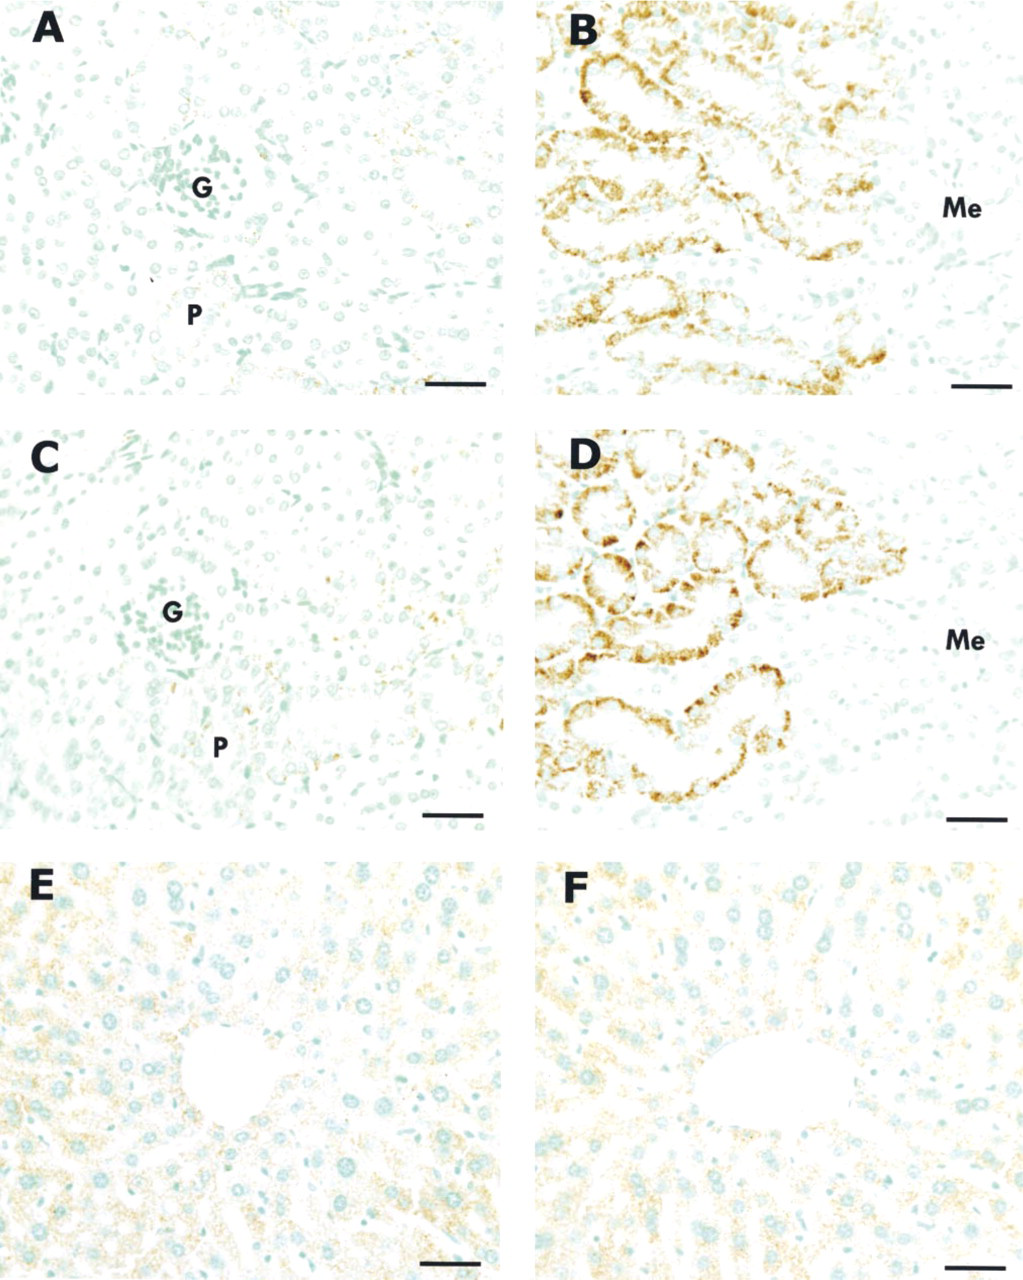
Immunocytochemical localization of catalase in the kidney and liver of non-transgenic and transgenic (600-fold elevated catalase activity) mice. The staining patterns in both kidney and liver were similar between the non-transgenic and transgenic mice. In the kidney of non-transgenic mouse, the proximal tubules in the superficial cortex showed weak staining (
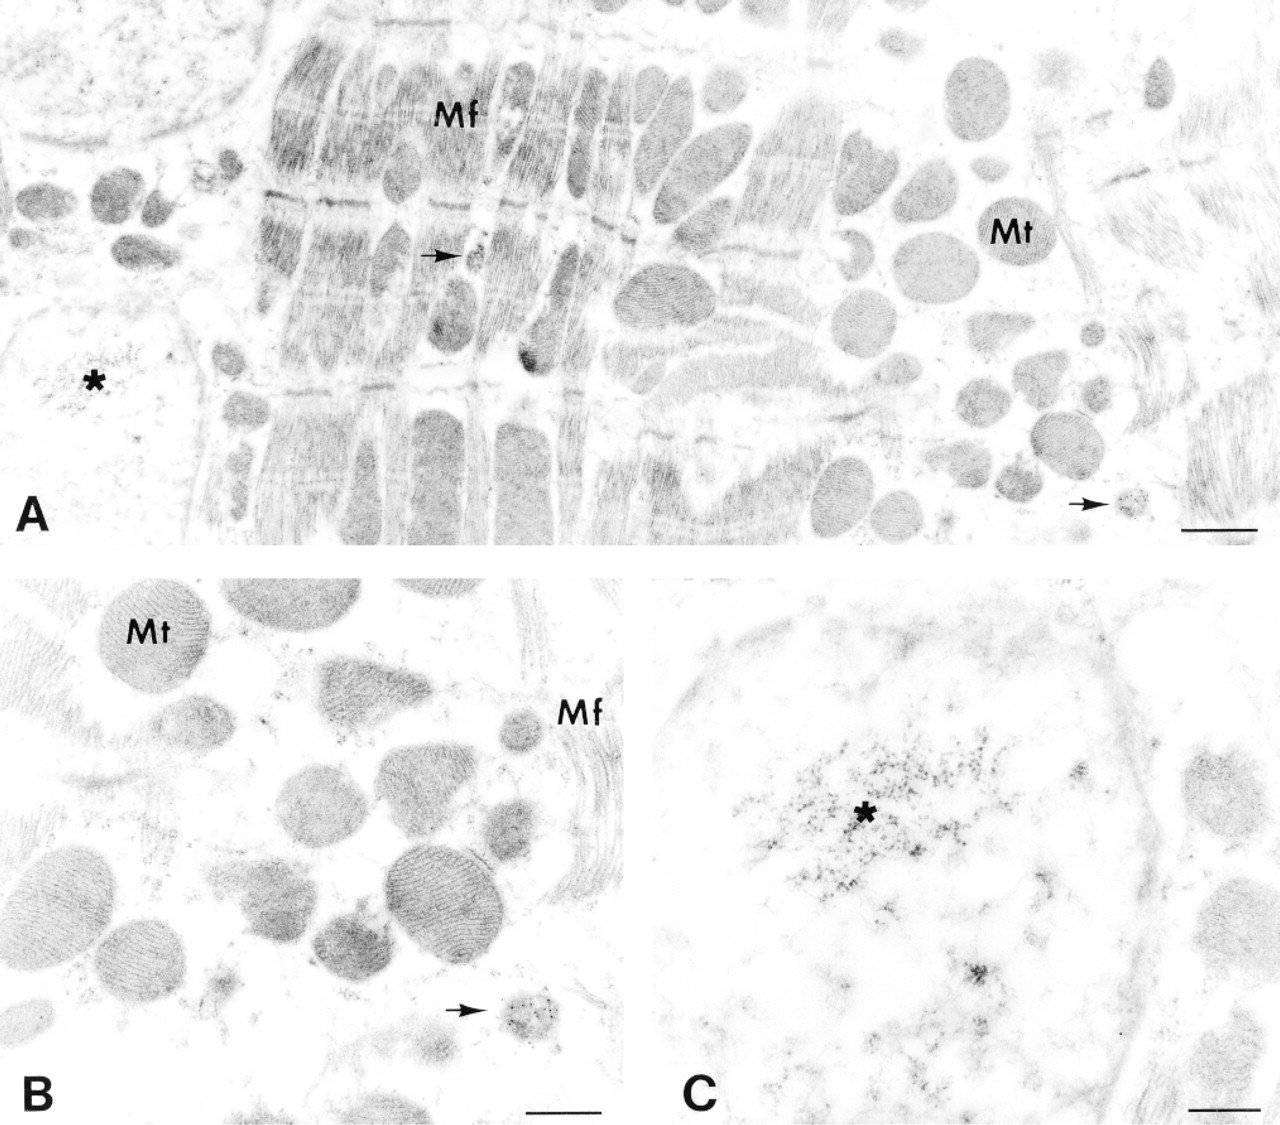
Electron photomicrographs of immunocytochemical localization of catalase in the cardiomyocytes of non-transgenic mice. Only two peroxisomes (arrows) were found in this section of the cardiomyocyte (
Liver tissue showed moderate staining, specifically in the hepatocytes (Figures 3E and 3F).
Electron microscopic immunocytochemistry was then applied to identify the subcellular localization of catalase in the transgenic heart. A few peroxisomes could be observed in the cardiomyocytes of non-transgenic mice (Figure 4A), and the gold particles that identify catalase were found only in peroxisomes (Figures 4B and 4C). In the transgenic mice, no obvious ultrastructural changes were found, except that the number of peroxisomes markedly increased from 3.2 ± 1.8/100 ±2 in non-transgenic myocardium to 9.0 ± 3.4/100 ±2 in the transgenic myocardium that contained catalase activities about 60-fold higher than normal (Figures 5A and 5D). The size of the peroxisomes was also significantly enlarged to 0.43 ± 0.12 (p<0.01) in the transgenic myocardium in comparison to 0.29 ± 0.09 ± in the non-transgenic control. Peroxisomes and myofibers showed strong labeling, whereas the mitochondria were totally negative (Figure 5B). The gold labeling in the nucleus was moderate (Figure 5C). Strong labeling was also observed on the sarcoplasm between the bundles of myofibers and in the margin area where the sarcoplasm was plentiful (Figure 5E).
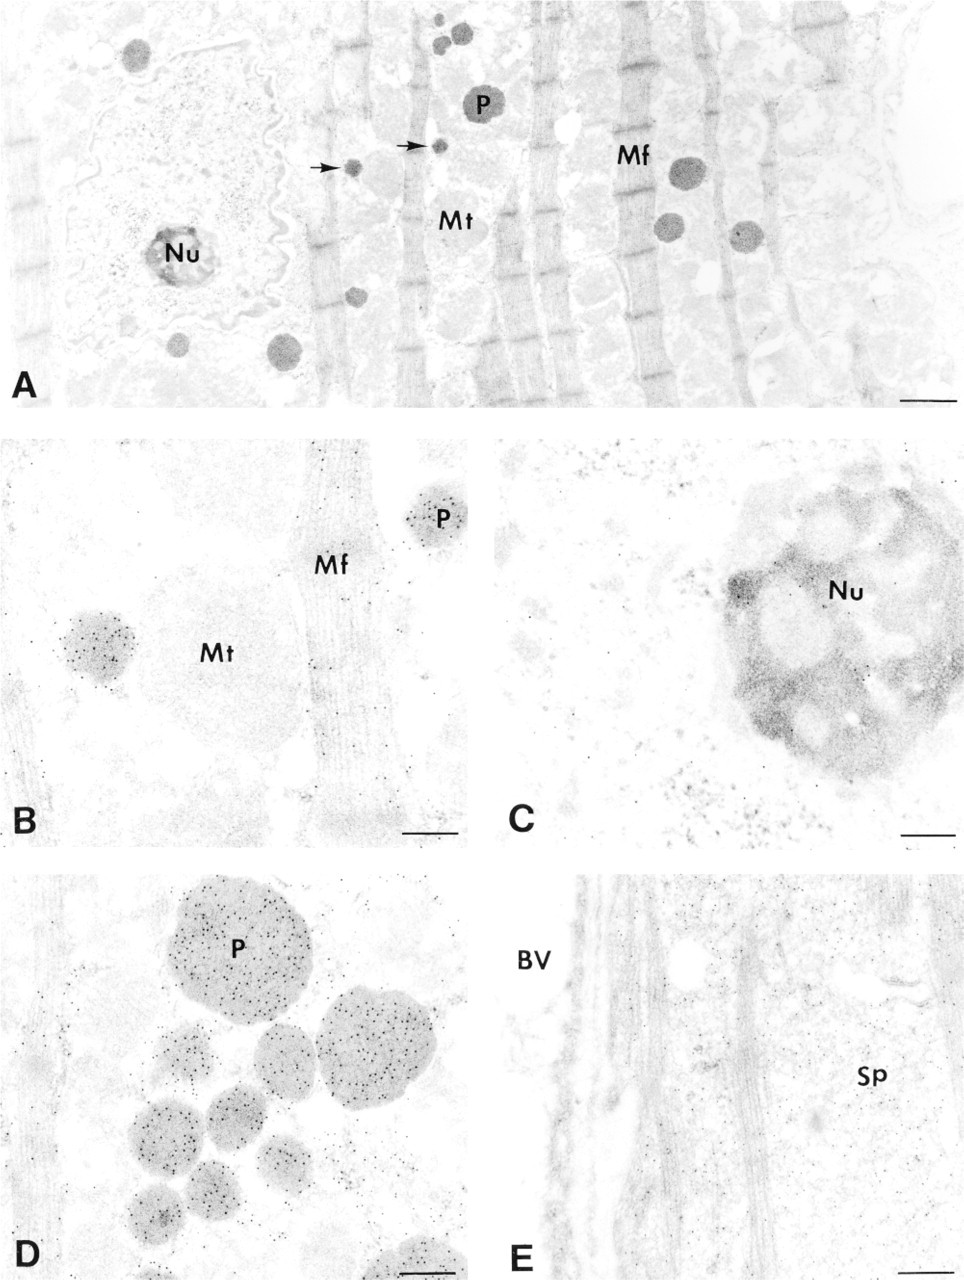
Electron photomicrographs of immunocytochemical localization of catalase in the cardiomyocytes of a transgenic mouse with 60-fold elevated catalase activity. Many peroxisomes labeled with gold particles were found in the cardiomyocytes (
Discussion
Light microscopic immunocytochemical examination of the cellular localization of catalase in the hearts of transgenic mice revealed that all of the immunoreactive cells were localized in the tissues that consisted of cardiac myocytes, including atrium, ventricle, pulmonary vein, and vena cava. The tissues that are not composed of cardiac myocytes, such as pulmonary artery, aorta, and all the valves of the heart, were not reactive to the anti-catalase antibody. This result demonstrates that the elevated catalase driven by the transgene, which contains a rat catalase cDNA that is linked behind the mouse α-cardiac myosin heavy chain promoter (Kang et al. 1996), is exclusively localized in the cardiomyocytes. This would be expected because the promoter used to drive the expression of the rat catalase cDNA should be activated only in the cardiomyocytes. An unexpected observation in the present study was that the overexpression of catalase does not occur in all the cardiomyocytes in transgenic mouse hearts containing elevated catalase activities of 15- or 60-fold higher than normal. However, the numbers of positive cells are correlated with the enzyme activities in the myocardium. On the other hand, the staining intensities among the positive cells were not different. Therefore, the differences in the catalase activities in the hearts among the three transgenic lines would result from the different numbers of positive cardiomyocytes.
Immunogold labeling and electron microscopic examination revealed that the elevated catalase activities were localized in peroxisomal and extraperoxisomal compartments. Extraperoxisomal catalase was found in both the sarcoplasm and the nucleus, but not in mitochondria. An important observation is that, in the immunoreactive cardiomyocytes of the transgenic myocardium, the number and size of peroxisomes dramatically increased. Among the positive cells, however, there were marked differences in the ratio of peroxisomal to extraperoxisomal catalase activity. In addition, some cells showed an increase in both the number and the size of peroxisomes that contain high levels of catalase activity, whereas others showed more increased numbers than enlarged size of peroxisomes, or vice versa.
Catalase has been considered to be a peroxisomal marker enzyme and has been used as an indicator of peroxisomal proliferation (Herzog and Fahimi 1974). In the present study, the elevated catalase activities probably resulted from, rather than resulted in, peroxisomal proliferation, because the enzyme elevation was driven by the transgene aforementioned. This observation raises a novel and fundamental biological issue related to peroxisomal proliferation. It suggests that catalase itself may trigger peroxisomal proliferation. Conditions that stimulate peroxisomal proliferation, often, if not always, involve physical or chemical stresses (Zipper 1997), which may upregulate catalase expression. For example, it has been shown that supplementation of the diet with nafenopin produced significant and sustained increases in the number of peroxisomes in the livers of rats. This increase is associated with significant increases in catalase activity and in the concentrations of catalase protein (Reddy et al. 1974). It is possible that nefenopin upregulates gene expression for both catalase elevation and peroxisomal proliferation. However, the transgene constructed and the transgenic mice produced from the transgene are catalase-specific. It is therefore unlikely that other genes, particularly the genes for peroxisomal proliferation, would be affected directly by the catalase transgene. To further test the effect of catalase on peroxisomal proliferation, it is important to examine whether inhibition of catalase synthesis can prevent peroxisomal proliferation, which will be investigated in our future studies.
The heart tissue was much less immunoreactive to the anti-catalase antibody than were the kidney and liver in the non-transgenic mice. Furthermore, the immunogold labeling showed that catalase was present only in the matrix of peroxisomes, and the number of peroxisomes in the cardiomyocytes is very small in the non-transgenic mice. Therefore, the weak staining of the non-transgenic myocardium observed by immunocytochemical light microscopy agreed with the small number of peroxisomes in the cardiomyocytes observed by electron microscopy and with the low catalase activities determined by the enzymatic assay.
Mitochondrial localization of catalase in rat cardiomyocytes has been reported only in one study (Radi et al. 1991). In contrast, it has long been known that catalase is localized in peroxisomes of cardiomyocytes (Herzog and Fahimi 1974, 1975; Hicks and Fahimi 1977; Fahimi et al. 1979; Yokoda and Asayama 1992). In the present study, even under the condition of over-expression, catalase was totally absent in mitochondria. The results obtained from this study therefore suggest that the peroxisome is the major compartment for catalase in cardiomyocytes. Under conditions of catalase overproduction, peroxisomal proliferation in the cardiomyocytes takes place, resulting in increases in the number and size of peroxisomes. However, when the production of this enzyme is over the limitation of the peroxisomal accommodation, it remains in the cytosol.
Although the transgenic catalase was not localized in mitochondria, which are critical organelles for production of reactive oxygen species from doxorubicin, the extramitochondrial localization of this enzyme in the transgenic mouse heart appears to be highly effective in protecting against the cardiotoxicity of doxorubicin. This is evidenced by the results obtained from the present study and those shown in our previous studies (Kang et al. 1996). Other studies have shown that, in guinea pig and rat, cytoplasmic catalase functions in decomposition of H2O2 produced in the endoplasmic reticulum (Premereur et al. 1986). These studies therefore demonstrate that although the localized action of catalase is important, it also participates in decomposition of H2O2 produced by remote organelles.
Footnotes
Acknowledgements
Acknowledgments
Supported in part by National Institutes of Health grant CA68125, by a US Department of Agriculture grant #9604531, and by the Jewish Hospital Foundation, Louisville, Kentucky. YJK is a university scholar at the University of Louisville.
We thank Donald Mosley and Cathie Caple for technical assistance.