
Abstract
The clinical and pathological features of fluorosis are similar to amelogenesis imperfecta (AI) caused by FAM83H mutations, suggesting that excess fluoride could have effects on the expression of Fam83h. Our previous study found that Fam83h was downregulated by fluorosis induction in ameloblasts; the purpose of this study was to underline the importance of understanding the relationship between fluoride administration and Fam83h expression in vivo. A total of 80 healthy female adult Kunming mice were randomly divided into control group or F group that induced the clinical features of fluorosis. Immunohistochemical staining on sections of the embryo mandible regions was performed at different developmental stages. Mouse primary ameloblast-like cells of the two groups at E13.5, E15.5, and E18.5 were cultured and examined for the expression of Fam83h. The expression of Fam83h in the F group was significantly lower than that in the control group; however, Fam83h was observed clearly in the whole enamel organ in the control group. Our findings shed new light on the potential effects of Fam83h in fluorosis using a mouse model and revealed that high fluoride decreased the expression of Fam83h. This may be one of the reasons for the occurrence of fluorosis.
Introduction
Fluorosis is a defect of the enamel mineral content and apatite crystal formation caused by excess fluoride intake during amelogenesis. 1 The clinical and pathological features of fluorosis are similar to amelogenesis imperfecta (AI) caused by Family with sequence similarity 83, member h (FAM83H) mutations, suggesting that excess fluoride could have effects on the expression of Fam83h. Our previous study found that Fam83h was downregulated by fluorosis induction in ameloblasts; therefore, we deduced that the reduction of Fam83h expression could be a vital factor underpinning the pathological mechanism responsible for fluorosis. 2
FAM83H is an obscure gene that is related to autosomal-dominant hypocalcified AI (ADHCAI) in humans. 3 FAM83H is critical for proper tooth enamel calcification, 4 but the precise gene expression patterns in dental enamel formation and etiological mechanism for fluorosis are not clear.
High concentrations of ionic fluoride have been found in many regions, which may lead to a chain of events that has dire physical and cosmetic consequences. As many people suffer severely from fluorosis, it is crucial to obtain a better understanding of the mechanisms regulating the pathogenesis of fluorosis and the effect of FAM83H on preventing the potential health hazards of fluoride.
Therefore, the purpose of this study was to underline the importance of understanding the relationship between fluoride administration and Fam83h expression in vivo. In this study, we established a fluorosis-induced murine model by providing water containing fluoride and analyzed Fam83h expression patterns by comparing its expression in mice exposed to fluoride or distilled water during tooth development.
Materials and Methods
Animal Treatment
A total of 80 healthy female adult Kunming mice were housed in the Laboratory Animal Center of the First Affiliated Hospital of Henan University. The mice were randomly divided into 2 groups (n=40/group): distilled water (control group) or 50 ppm fluoridated water (F group). The noon hour on the day of appearance of the vaginal plug was regarded as embryonic day 0.5 (E0.5), while the noon hour of the day of birth was taken as postnatal day 0.5 (PN0.5). Once a vaginal plug was confirmed, the mice were exposed to the experimental water, and the embryos were obtained from time-mated pregnant mice.
Ethical clearance was obtained from the institutional ethical committee.
Dental Fluorosis (DF) Phenotyping
At postnatal week 1.5 (PN1.5w) and postnatal week 4 (PN4w), the mice from the control and F groups were given a complete oral examination. The determination of DF was made clinically over the lower incisor tooth surfaces, according to a modified Thylstrup-Fejerskov (TF) index. 5
Immunohistochemical Staining
Embryos at each developmental stage (daily intervals at E13.5, E15.5, E18.5) and postnatal mice from different mothers and periods (PN3) were humanely killed by cervical dislocation, and embryos were removed from the pregnant mice. The heads (E13.5, E15.5) and mandibles (E18.5, PN3) of embryonic and postnatal mice were fixed with 4% paraformaldehyde (PFA) overnight at 4C and embedded in paraffin. Samples were sectioned at a thickness of 5 μm and heated at 65C for 3 hr. After deparaffinization and rehydration, the sections were treated with pepsin (Zhongshan; Beijing, China) for 10 min. Endogenous peroxidase activity was blocked by incubating sections in 3% H2O2 in methanol. Sections were blocked in 1% BSA/PBS and incubated overnight at 4C in a humidified chamber with Fam83h primary antibody (orb183479; Biorbyt; San Francisco, CA) diluted at 1:200. The sections were washed and stained using the SP kit (SP-9001; Zhongshan Golden Bridge; Beijing, China) according to the manufacturer’s instructions. The positive control of embryonic and postnatal mice were used for all the antibodies whereas the negative control was obtained by omitting the primary antibody. 6 The stainings were visualized by diaminobenzidine solutions (Maixin Biotech; Fuzhou City, China).
Cell Culture and Purification
The first molar germs of control group and F group at each developmental stage (daily intervals at E13.5, E15.5, E18.5) were obtained and minced, treated enzymatically (0.25% trypsin and 0.04% EDTA) for 20 min at 37C, shaking once every 5 min. DMEM medium with 20% FBS (HyClone; Thermo, MA) was added to the suspended cells to abandon the digestion. The cells were cultured in DMEM medium, supplemented with 20% FBS and 1% penicillin/streptomycin (HyClone), at 37C in a humidified atmosphere of 5% CO2 in air. Epithelial and mesenchymal cells have a different tolerance to trypsin. The cultured cells, after the addition of 0.25% trypsin, were observed to have a long spindle form, fiber-like cell-edge contraction, while epithelioid cells had no obvious change. Then, the medium containing FBS was added to suspend digestion, and adherent cells were washed. The medium was then added to culture. After a week, the digestion was repeated again.
Cell Identification and Exposure
Mouse primary ameloblast-like epithelial cells were identified for the expression of the cytokeratin 14 (K14) and amelogenin (AMELX) at protein level by means of immunofluorescence. The epithelioid cells were cultured on the slides and washed with PBS, then fixed by 4% formaldehyde and permeabilized in 0.4% Triton X-100. After blocking with 5% BSA for 1 hr at room temperature, the cells were incubated overnight with K14 (10143-1-AP; Proteintech; Rosemont, IL) and AMELX (sc-36892; Santa Cruz Biotechnology; Dallas, TX) diluted at 1:200, followed by incubation with Alexa Fluor 488 fluorochrome conjugated secondary antibody (Thermo Fisher Scientific; Waltham, MA) in the dark for 1 hr. Nuclei were counterstained with 4′,6-diamidino-2-phenylindole (DAPI). Then, the samples were analyzed under the fluorescent microscope (Olympus IX81; Japan). The expression of Fam83h was detected with real-time PCR and Western-blotting examination.
Quantitative Real-time PCR and Western Blotting
Quantitative real-time PCR (QPCR) and Western blotting were performed as previously described. 2 Fam83h primary antibody (orb183479; Biorbyt) was diluted at 1:1000 or GAPDH (ProMab Biotechnologies; Richmond, CA), followed by incubation with horseradish peroxidase-conjugated secondary antibody (Antgene; Wuhan, China) for 1 hr at room temperature. Immunocomplexes were visualized using chemiluminescence, and then exposed. The relative integrated density of protein bands was analyzed by National Institutes of Health (NIH) ImageJ 1.48v, and then normalized to that of the GAPDH.
Statistical Analysis
The results of Q-PCR and Western blot are shown as mean ± SD from three independent experiments. Statistical calculations were performed by Student’s t-test using Statview software (SAS Institute Inc.; Cary, NC). Significance was assigned to p<0.05.
Results
DF Evaluation
DF was evaluated clinically (Fig. 1). At PN1.5w, the mice in the F group had developed DF, and their lower incisors and molars appeared white, chalky opaque, and thin; the molars even appeared with characteristic brown staining and were more susceptible to decay. At PN4w, quite robust fluorosis was seen in the F-group mice, with striations and chalky, opaque enamel being particularly prominent. In contrast, the control group showed normal tooth development at PN1.5w and PN4w.
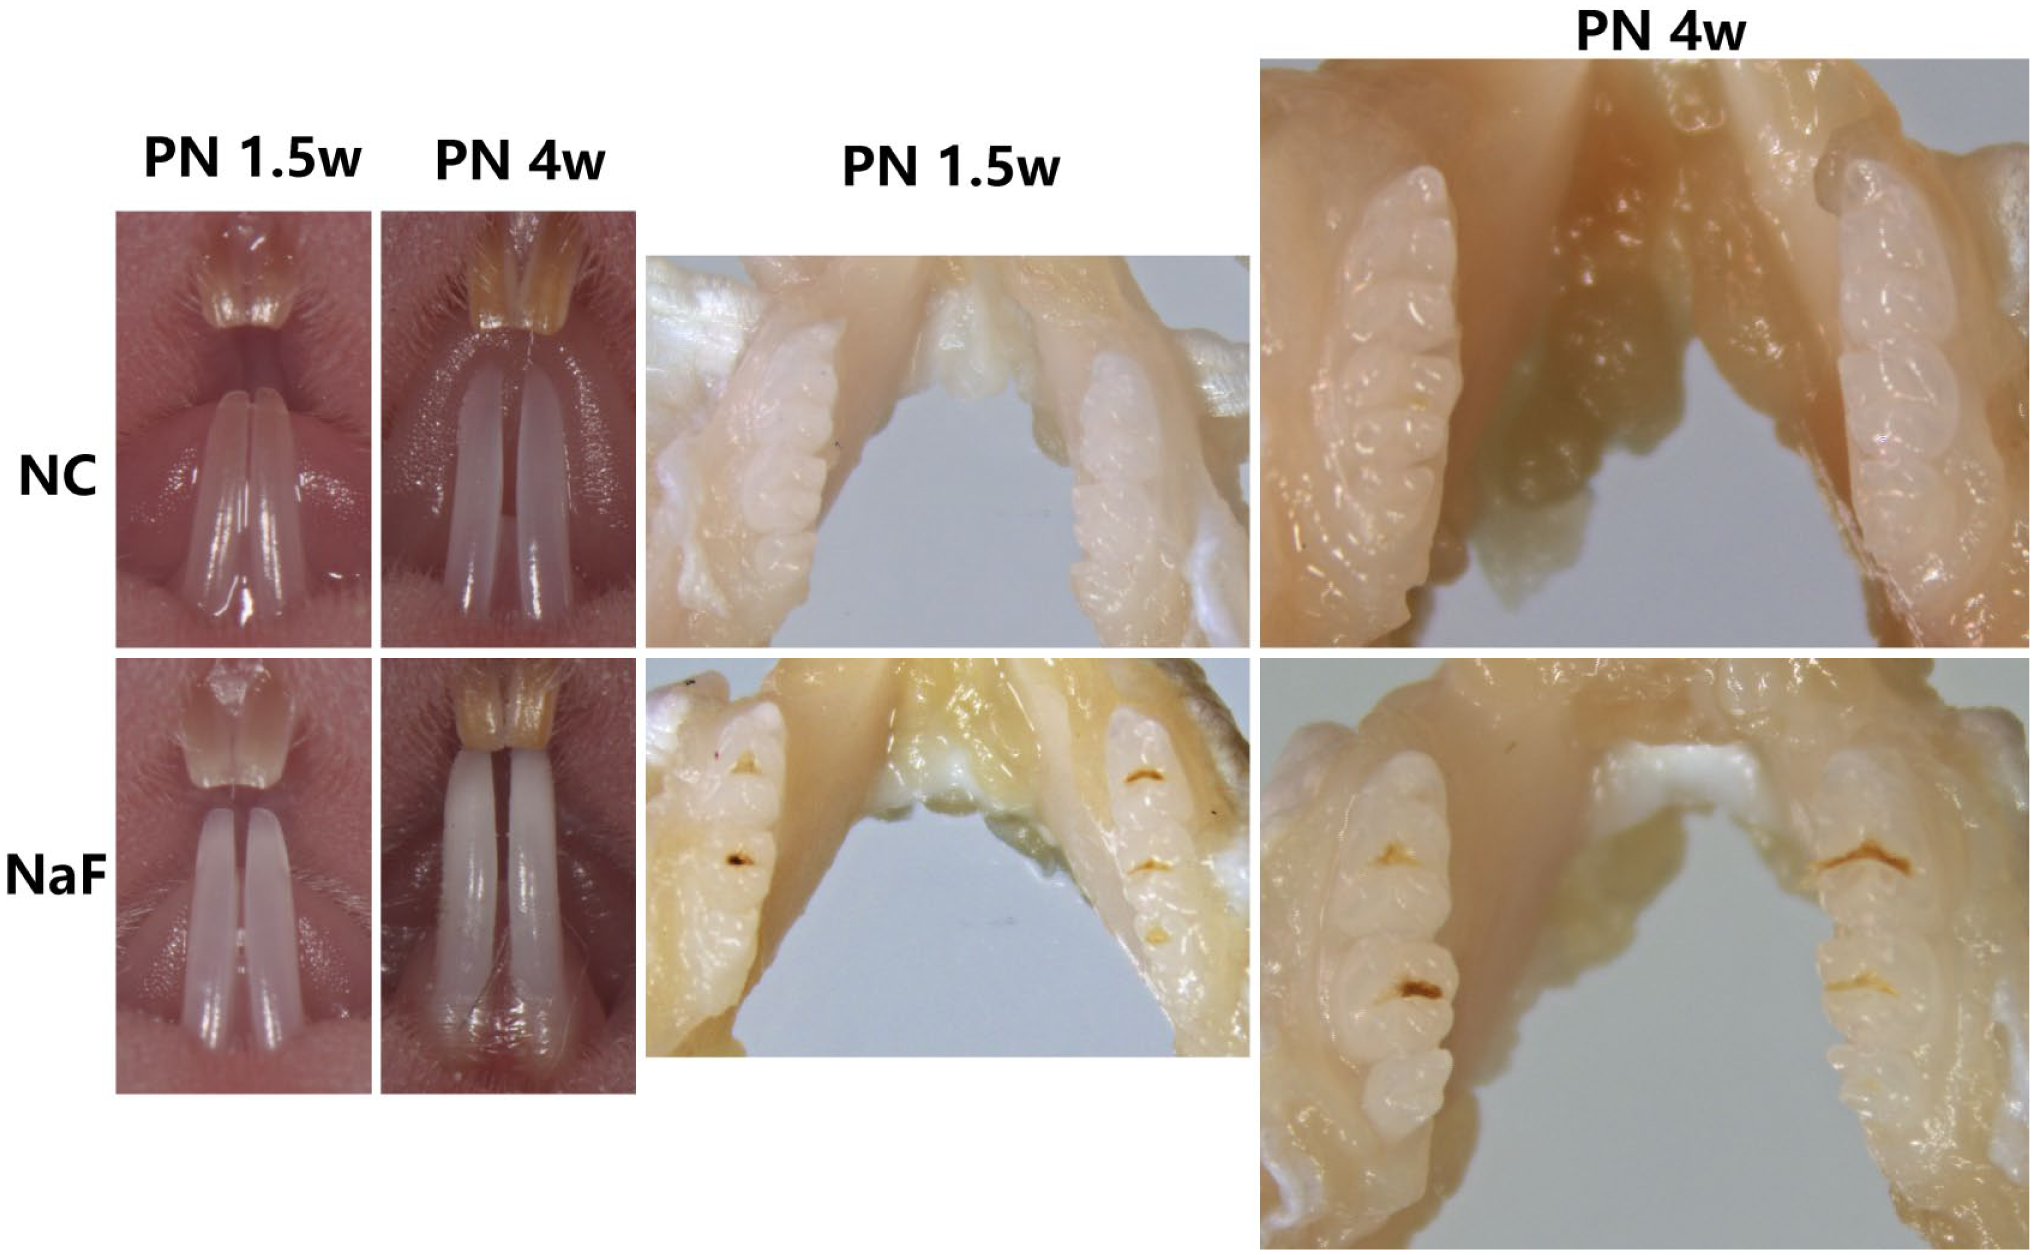
Robust dental fluorosis seen in the F group. The diffuse yellow-orange color present in the teeth at PN1.5w and PN4w was typical of normal tooth color development in the control group. In comparison with the control group, the lower incisors and molars obviously showed white, chalky opaque enamel in the F group. Especially at PN4w, when the lower incisors of the mice showed dramatic color and character changes, the molars even appeared with characteristic brown staining and were more susceptible to decay in response to fluoride. Abbreviations: PN1.5w, postnatal week 1.5; PN4w, postnatal week 4.
Fam83h Expression in Mouse Molar Development
To study the spatial and temporal pattern of Fam83h expression, we performed immunohistochemical staining of sections of F-group and control-group embryo mandible regions at E13.5 (Fig. 2A and B), E15.5 (Fig. 2C and D), E18.5 (Fig. 3A and B), and PN3 (Fig. 3C–F). At E13.5, Fam83h was not detected in the F group (Fig. 2A), whereas Fam83h was localized to a limited subset of cells in the molar epithelium of the control group (Fig. 2B). The developing first molar of E15.5 F-group mice showed detectable but very weak immunohistochemical staining over the inner enamel epithelium of the apical bud, and the pulp mesenchyme showed weak expression (Fig. 2C). However, Fam83h was highly expressed in the outer and inner enamel epithelium, stratum intermedium, enamel knot, and the dental papilla in the control group at E15.5 (Fig. 2D).
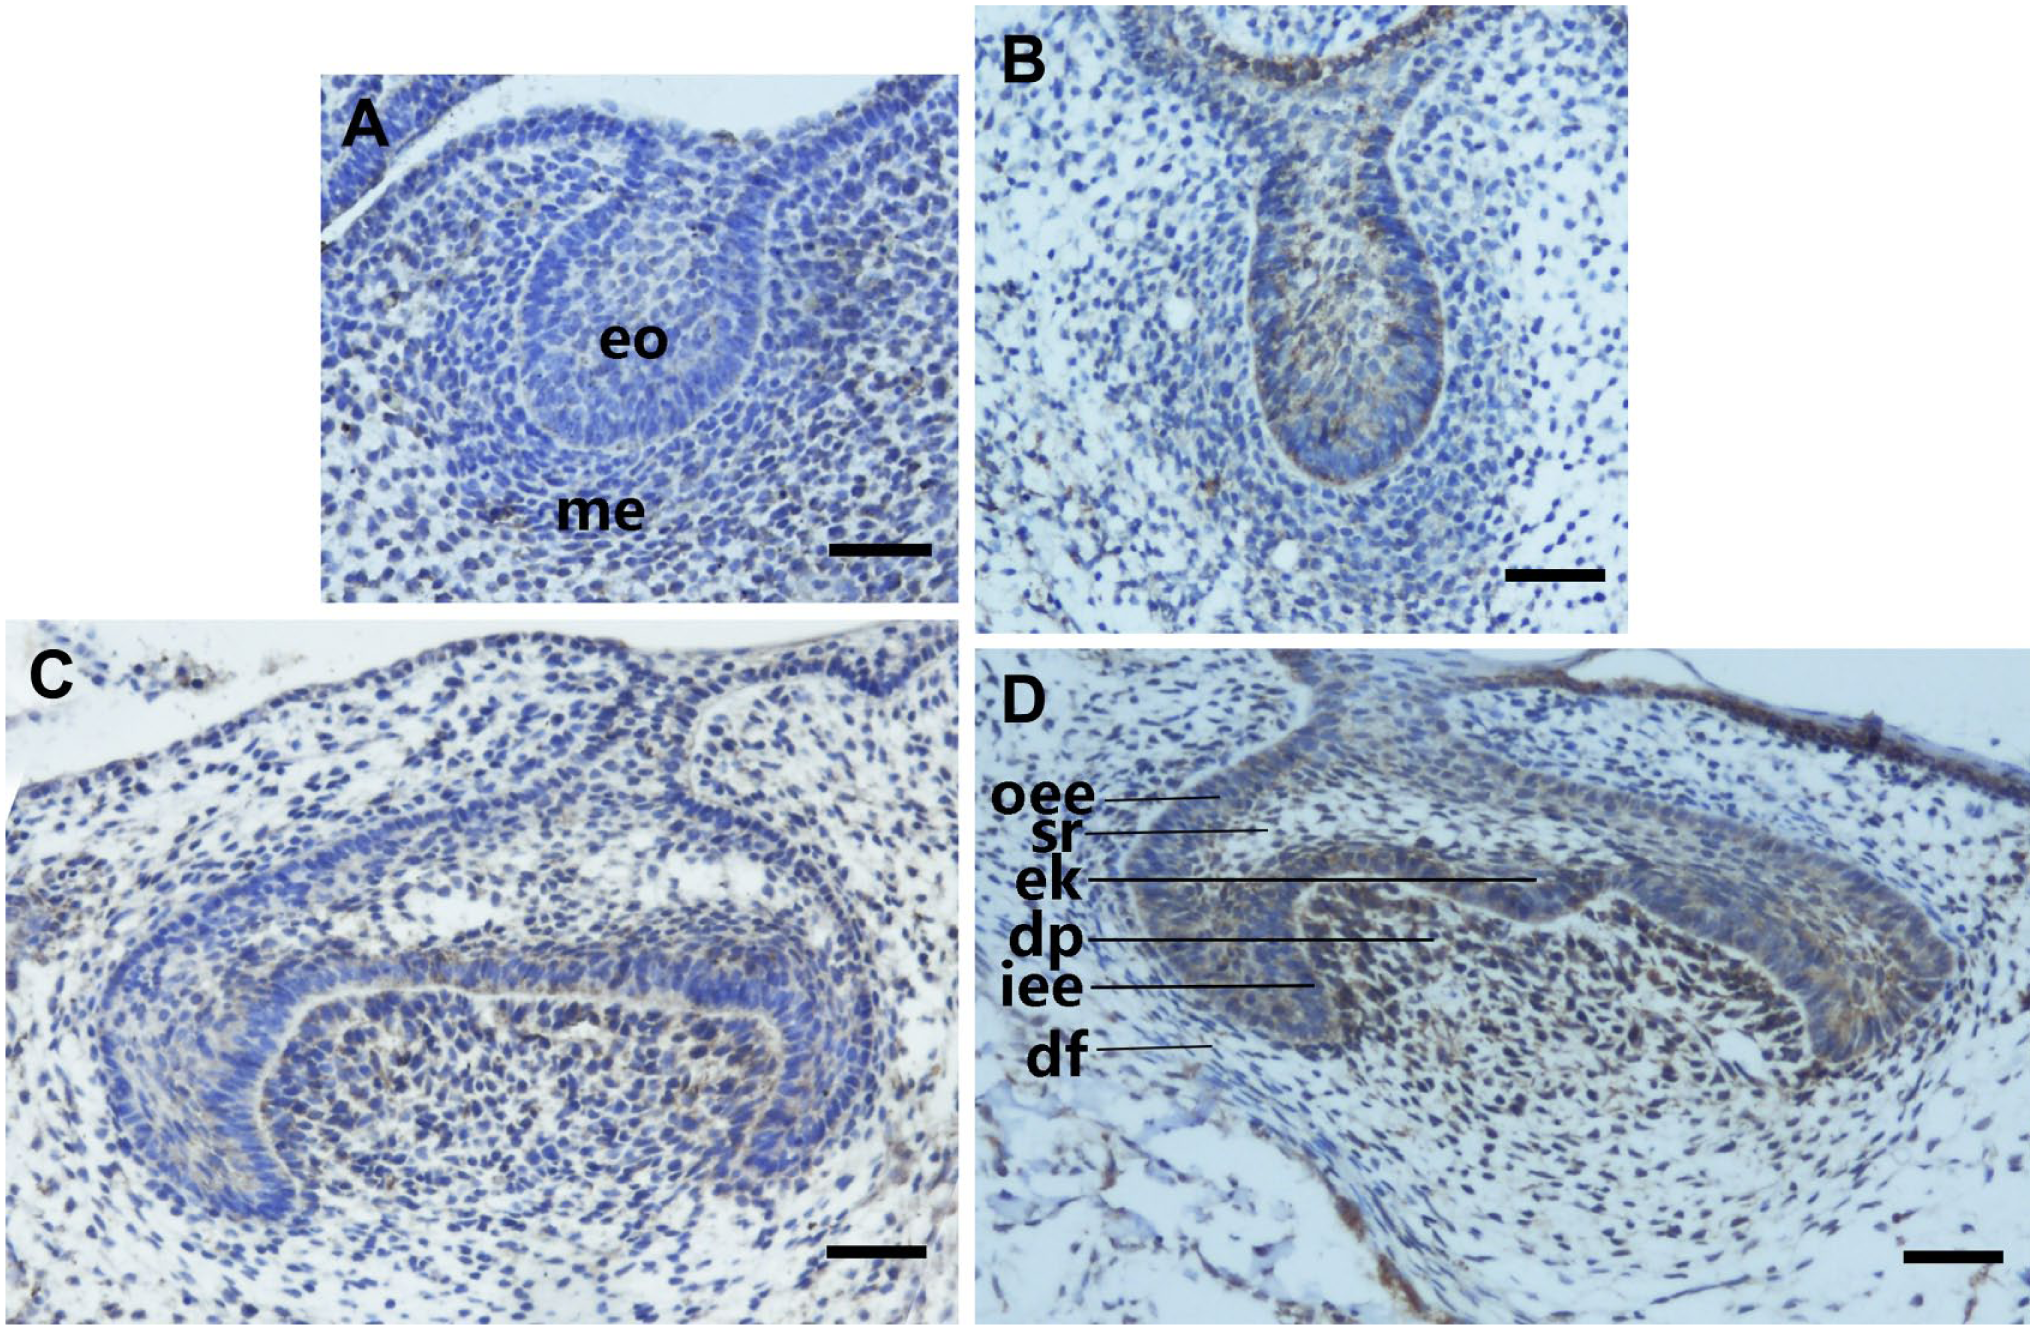
Expression and localization patterns of Fam83h during molar development in the F group and control group at E13.5 and E15.5. (A) At the bud stage (E13.5), Fam83h was not detected in the F group. (B) At the bud stage (E13.5), Fam83h expression was weakly detected in the molar epithelium of the control group. (C) At the cap stage (E15.5), the expression of Fam83h in F-group mice could be detected but was very weak over the inner enamel epithelium of the apical bud, and the pulp mesenchyme showed tiny amounts of expression patterns. (D) At the cap stage (E15.5), Fam83h was highly expressed in the outer and inner enamel epithelium, stratum intermedium, and enamel knot, as well as the dental papilla in the control group. Abbreviations: eo, enamel organ; me, mesenchyme; oee, outer enamel epithelium; sr, stellate reticulum; ek, enamel knot; dp, dental papilla; iee, inner enamel epithelium; df, dental follicle. Scale bar = 50 µm.
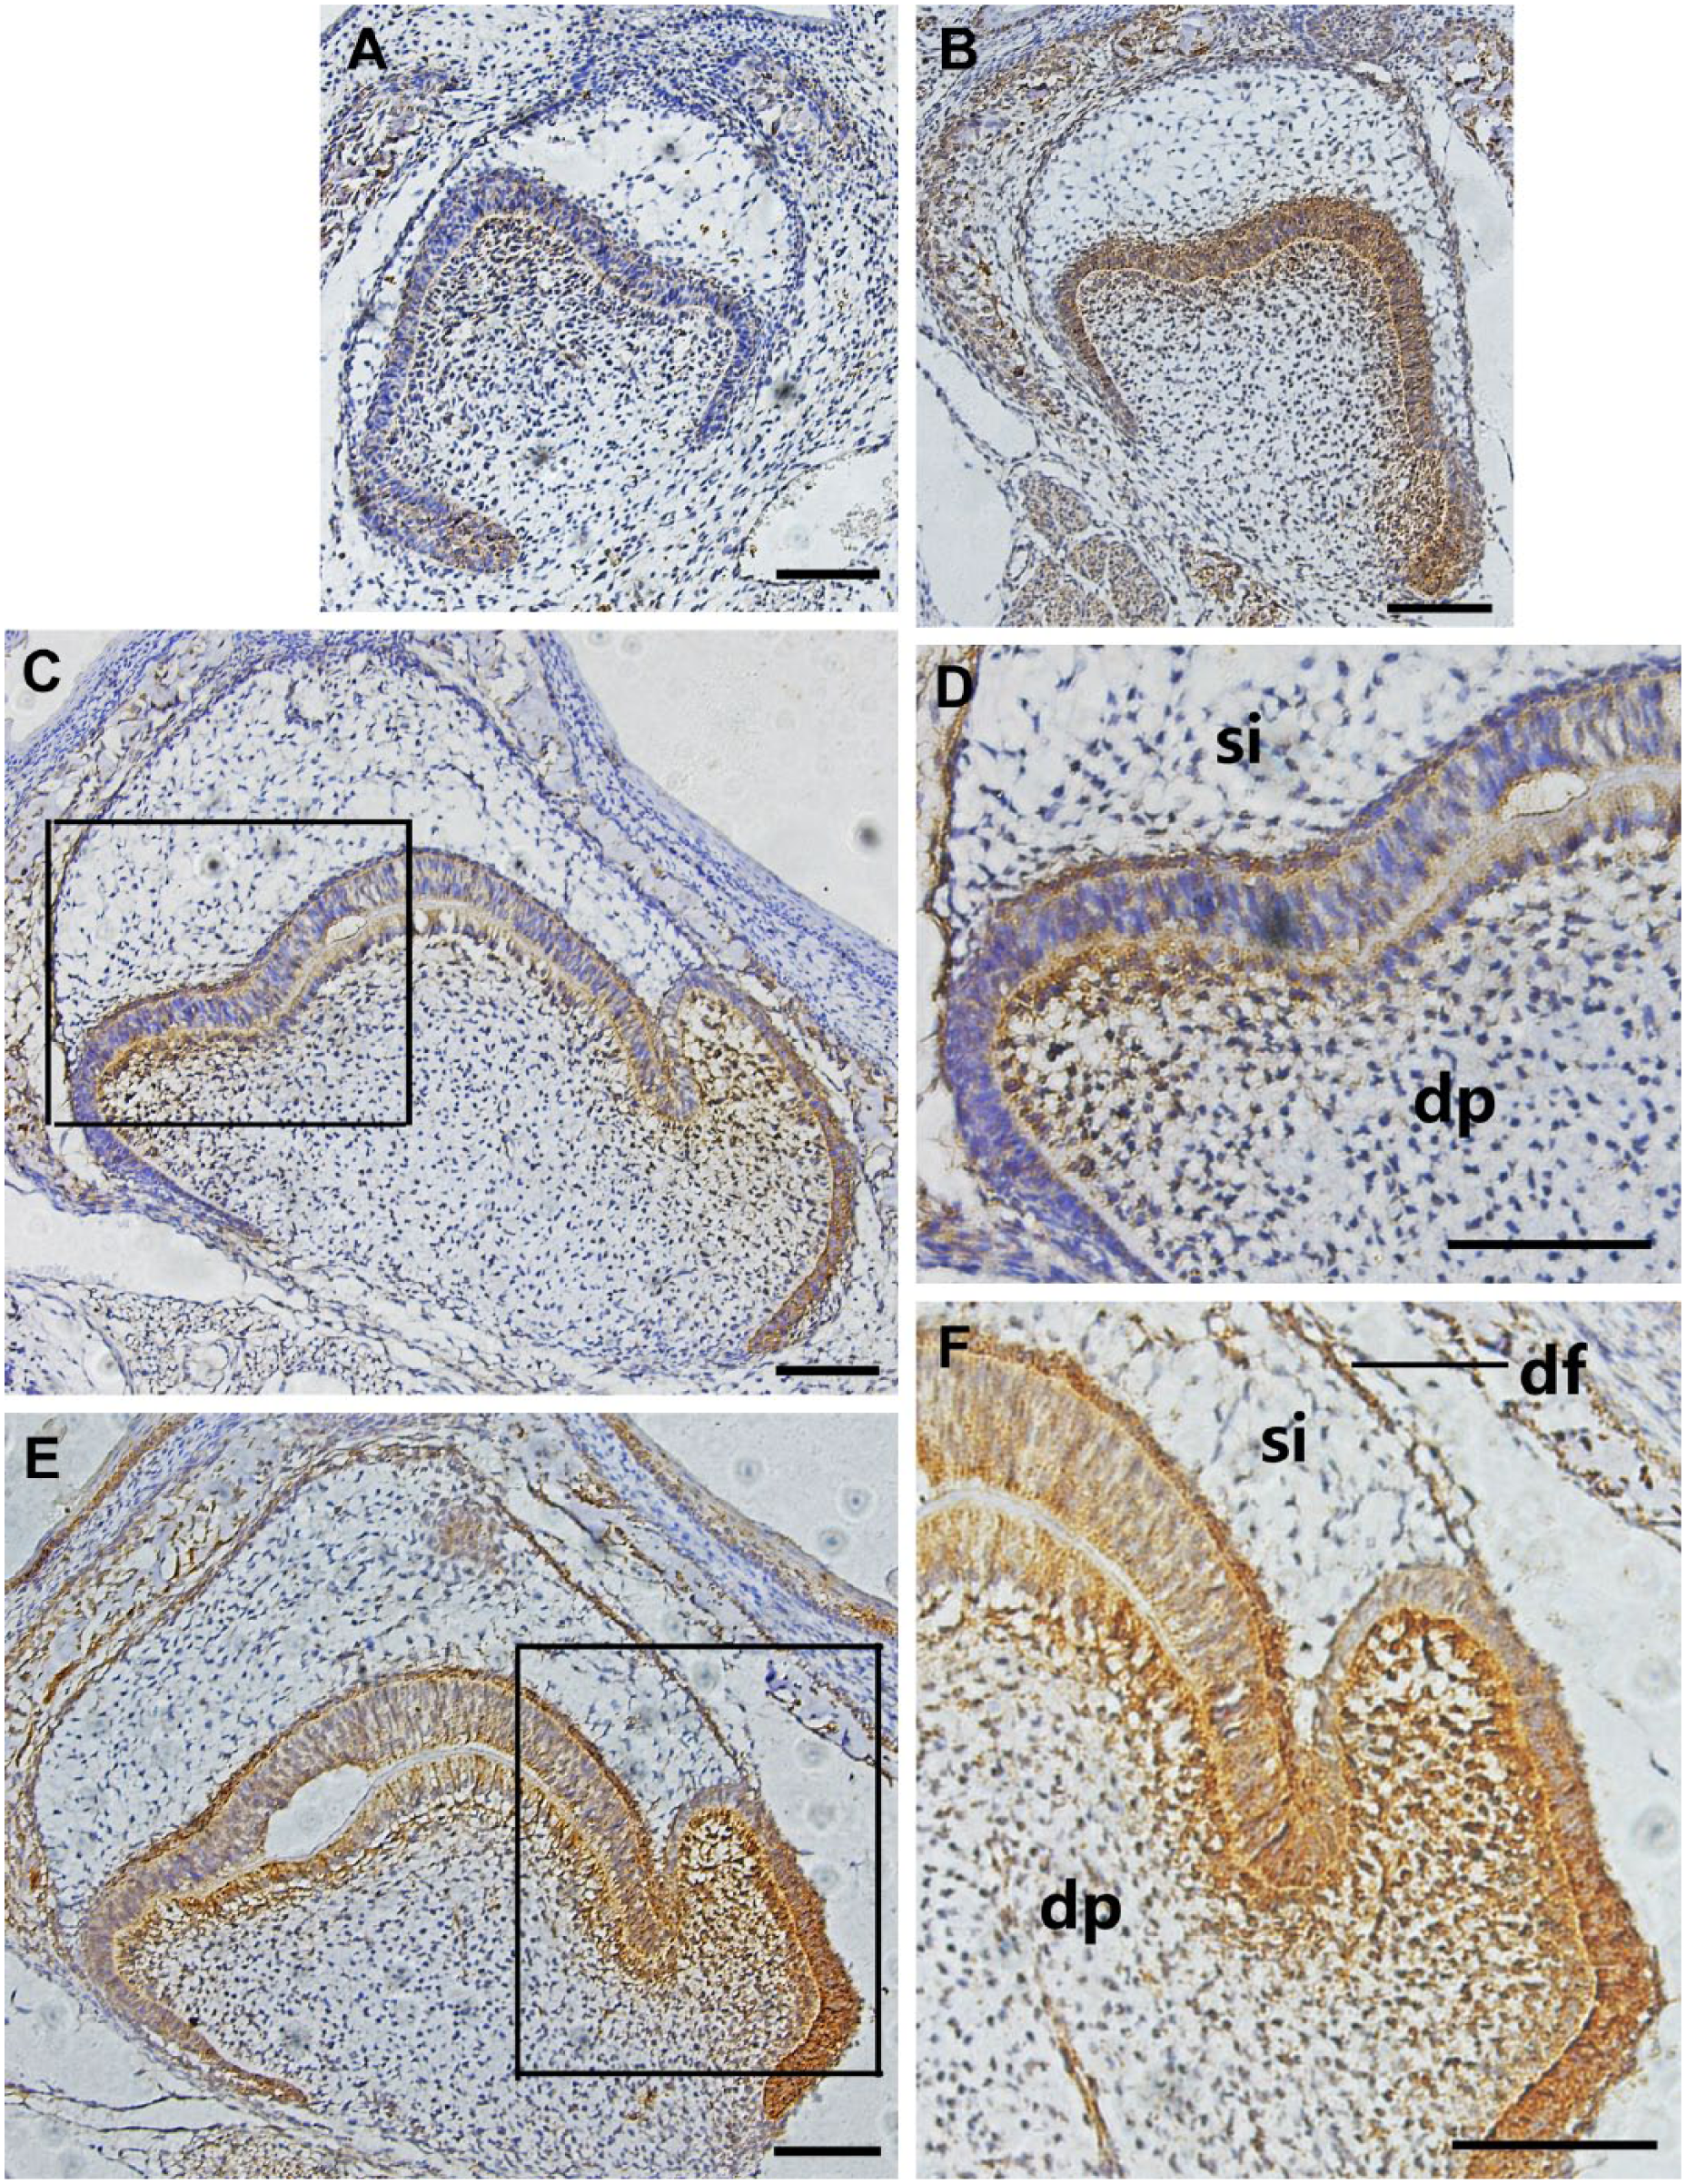
Expression and localization patterns of Fam83h during molar development in the F group and control group at E18.5 and PN3. (A) At the early bell stage (E18.5), Fam83h was localized in the inner enamel epithelium of the apical bud, with ameloblasts and odontoblasts showing slight expression in the F group. (B) At the early bell stage (E18.5), Fam83h was strongly activated in the inner enamel epithelium in the control group. (C, D) At the late bell stage (PN3), expression patterns of Fam83h were detected in the inner and outer enamel epithelium, ameloblasts, odontoblasts, and mesenchyme of the F group. (E, F) At the late bell stage (PN3), Fam83h activation was clearly evident in the control group. Abbreviations: PN3, postnatal period 3 mouse; si, stratum intermedium; df, dental follicle; dp, dental pulp. Scale bar = 100 µm.
At E18.5, Fam83h was mildly localized in the outer and inner enamel epithelium and stratum intermedium, with ameloblasts and odontoblasts showing slight expression in the F group (Fig. 3A). In contrast, Fam83h was strongly expressed in the inner enamel epithelium and differentiating dental papilla cells at E18.5 in the control group (Fig. 3B). At PN3, Fam83h expression patterns were detected in the inner and outer enamel epithelium, ameloblasts, odontoblasts, and mesenchyme of the F group (Fig. 3C and D), while Fam83h expression was clearly evident in the control group (Fig. 3E and F).
Characterization of Mouse Primary Epithelial Cells
Enamel secretion commences at the bell stage, and the enamel growth is prolific by PN3. 7 We are unable to get the ameloblast-like cell along with the enamel as it becomes mature, so we get the primary ameloblast-like cell at E13.5, E15.5, and E18.5. In this study, the ameloblast-like cell of E18.5 was selected as a representative sample. The growth of the mouse primary ameloblast-like cell was good, which was mixed with mesenchymal cells (Fig. 4A). We finally get purified epithelial cells utilizing the different tolerance to trypsin (Fig. 4B and C). All mouse primary epithelial cell cultures were tested for the expression of the K14 and AMELX at protein level by means of immunofluorescence. Immunofluorescence analysis indicated the expression of typical epithelial cell marker K14 7 and ameloblast cell marker AMELX 8 by ameloblast-like cells (Fig. 5).
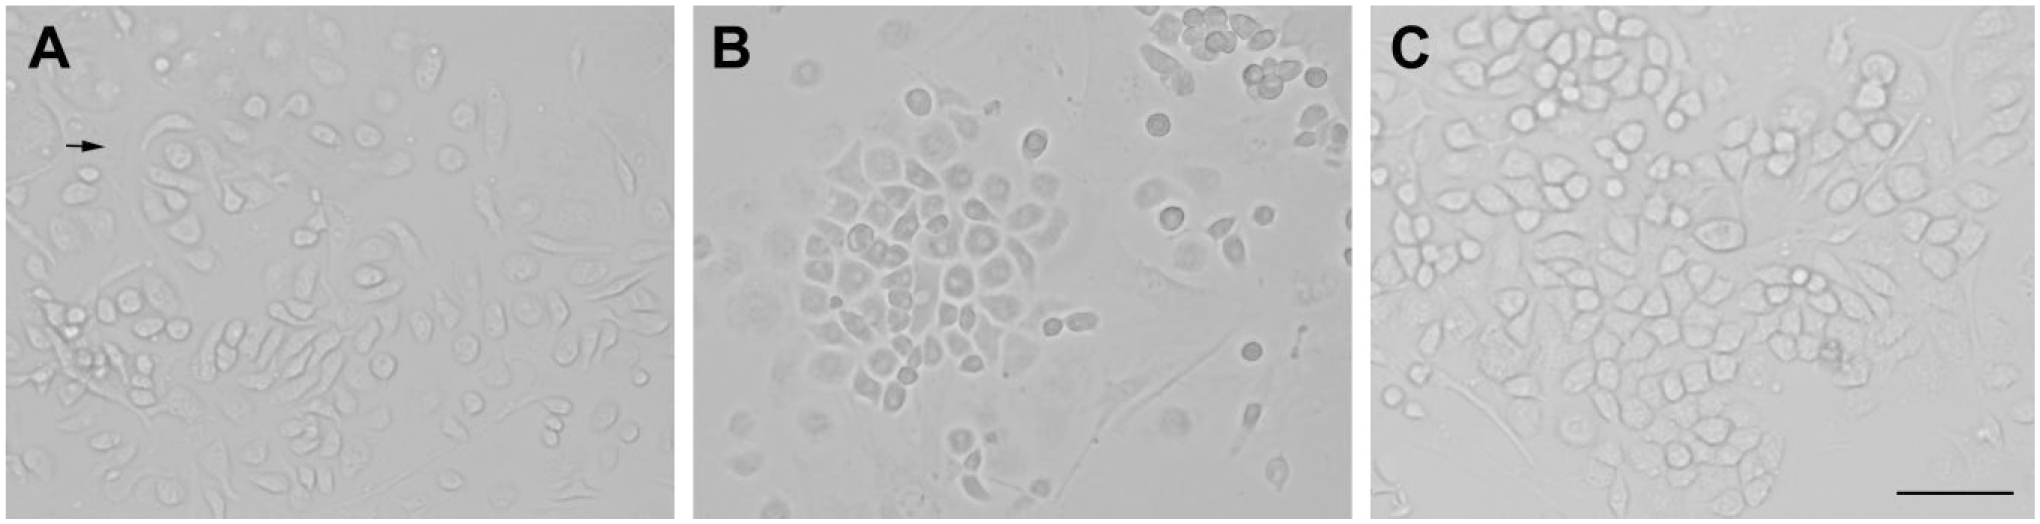
Culture and purification of mouse primary ameloblast-like cells in vitro. (A) The growth of the mouse primary ameloblast-like cells of E18.5 was good, which was mixed with a large number of fibroblast-like cells (indicated by the arrow). (B) The situation was improved after purification. (C) The cells showed the shape of paving stones with a high purity. Scale bar = 100 µm.
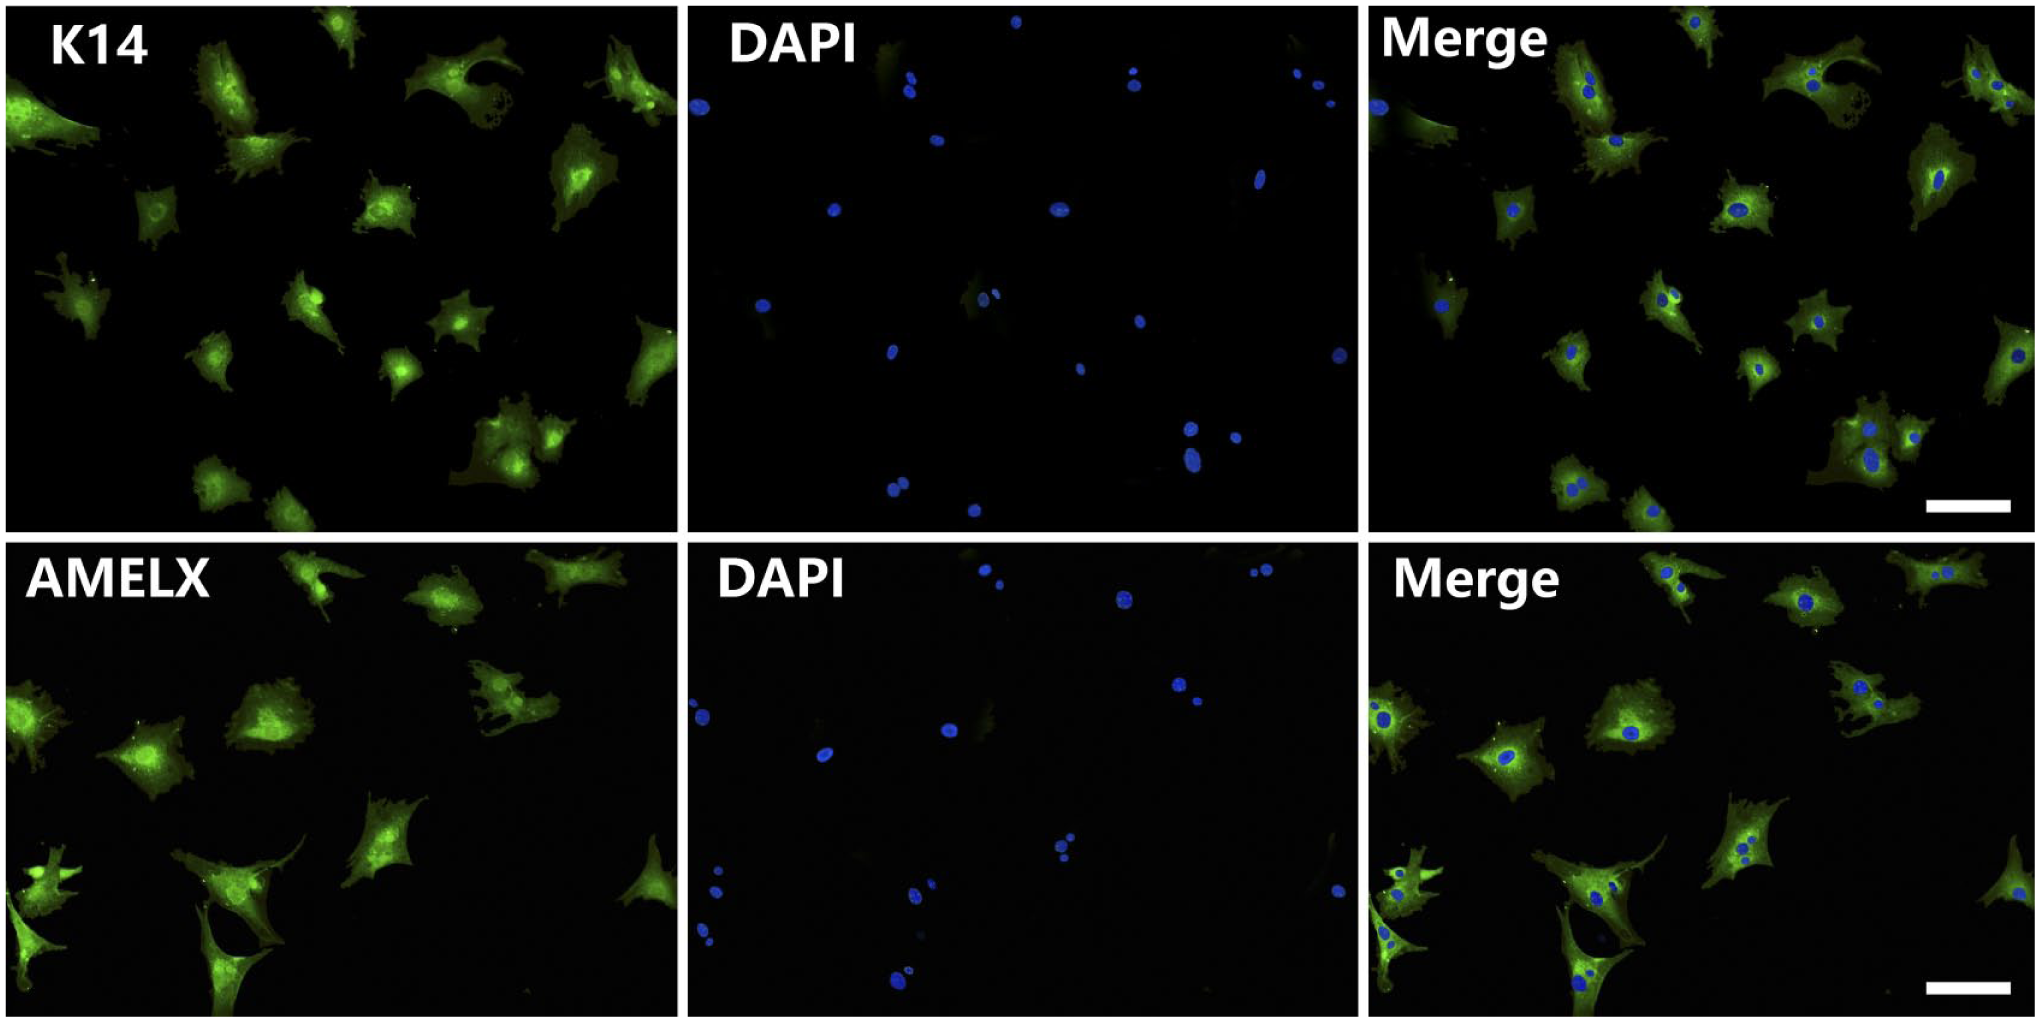
Authenticate of mouse primary ameloblast-like cells by immunofluorescence. The expression of typical epithelial cell marker K14 and ameloblast cell marker AMELX. All the cells were stained by DAPI. Merged images show that K14 and AMELX are expressed in cytoplasm. Scale bar = 100 µm. Abbreviations: DAPI, 4′,6-diamidino-2-phenylindole; K14, cytokeratin 14; AMELX, amelogenin.
Fam83h Responses to NaF in Mouse Primary Epithelial Cells
Staged mouse primary epithelial cells of F group showed a significant decrease in Fam83h mRNA and protein, as compared with the control group at the same stage (Fig. 6).
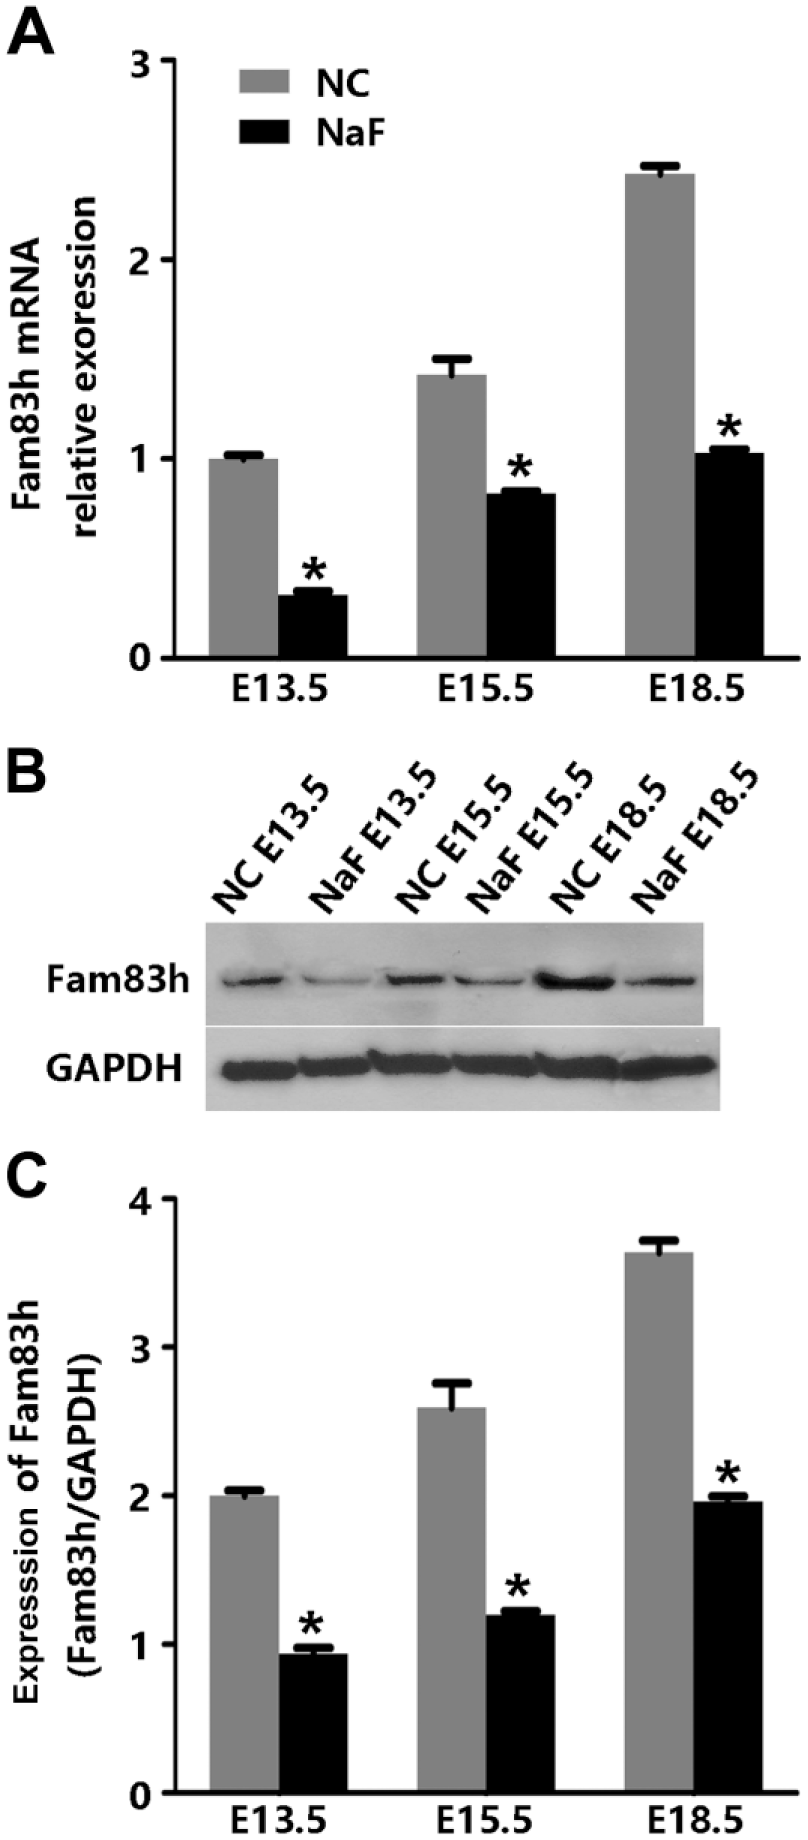
Expression of Fam83h in the mouse primary ameloblast-like cells at E13.5, E15.5, and E18.5. (A) Fam83h mRNA relative expression of staged mouse primary ameloblast-like cells of F group showed a significant decrease as compared with the same-staged control group. (B) Western-blot analyses for the amounts of Fam83h at each of the same stages. GAPDH served as a loading control. (C) The graph shows the relative intensity of each immunoreactive band measured with NIH ImageJ software. Fam83h expression in the F group is lower than that in the control group at each stage. *p<0.05 indicates statistical difference between the F group and the control group at each stage.
Discussion
The addition of 50 ppm fluoride to drinking water has been widely used in rodent models of fluorosis.9,10 Therefore, we believe that the micromolar concentration of fluoride (50 ppm) in this study is suitable for the study of fluorosis.
The lower incisors erupt into the mouth of mice at PN8, but 2 days of continual growth facilitate the detection of clinical features of fluorosis in the lower incisors and molars. The continual growth of mandibular incisors permits the effects of fluoride on new enamel formation to be monitored at PN4w, therefore, PN1.5w and PN4w mice were assessed for DF severity. Despite the obviously clinical manifestation difference between the F group and control group, exposure of developing teeth to fluoride had no effects on the eruption time and morphogenesis of incisors and molars, and the size of the teeth were not changed.
A typical feature of fluorosis and AI caused by FAM83H gene mutations is rough and poorly mineralized enamel,11,12 and both of these defects appear to result from a delay in the removal of proteins as the enamel matures.12,13 Such similarities between the disorders suggest that excess fluoride could have effects on the expression of FAM83H. Fam83h is a type of cytosolic protein that appears to be related to the trans-Golgi network and to regulate keratin cytoskeleton organization in cells.14,15 FAM83H is required for the development of normal enamel and has been proven to play a role in enamel calcification. 4 Prominently, FAM83H is not tooth-specific, 16 but defects in this broadly expressed gene cause a phenotype that is restricted only to enamel.17 –19 FAM83H has potential novel biological functions for amelogenesis, although formal proof of this would require further functional data to confirm the causality of FAM83H with respect to the two associated disease phenotypes.
High concentrations of fluoride will disturb ameloblast protein synthesis and enamel formation differently at different stages. 10 Many studies have explored the mechanisms by which fluoride affects enamel formation,20,21 but little evidence has shown the effect of fluoride on FAM83H during amelogenesis. Fortunately, our previous study observations found that Fam83h was downregulated by fluorosis induction in ameloblasts. 2
The present study investigated for the first time the progression of the spatial and temporal expression of Fam83h during mouse molar development, and determined whether Fam83h expression was affected by fluoride-related effects on enamel formation and tooth germ development at each stage. Our results revealed that the expression of Fam83h in the F group was significantly lower than that in the control group, which is consistent with our previous study. The enamel knot is generally accepted as a signaling center and is considered to regulate tooth crown morphogenesis.22,23 The expression of Fam83h protein in the enamel knot at the cap stage (Fig. 2D), as well as its distribution at the bell stage, is a reminder that Fam83h might be involved in stimulating epithelial proliferation and regulating tooth crown morphogenesis.
During the cap to bell stage transition, Fam83h is highly susceptible to fluoride-related effects; Fam83h was mildly localized in the F group (Fig. 3A). However, Fam83h was strongly expressed in the control group (Fig. 3B), suggesting that Fam83h might participate in ameloblast differentiation.
Fluoride deeply affected Fam83h expression during the whole bell stage; Fam83h expression in the F group was significantly lower than that in the control group. From the bell stage, Fam83h that was expressed in the dental papilla gradually converged to the enamel-dentinal junction, whereas it decreased in differentiated odontoblasts and dental pulp cells. This suggested that Fam83h might play a role before the terminal differentiation and secretion of ameloblasts and odontoblasts in mouse molar development.
The first morphological sign of enamel development is a narrow band of thickened epithelium that progressively takes the form of bud, cap, and bell configurations as differentiation proceeds. So, we next carried out comparative analysis of the expression of Fam83h induced by fluoride in primary epithelium cells at E13.5 (bud stage), E15.5 (cap stage), and E18.5 (bell stage). This period encompasses molar enamel development from initiation to the onset of cytodifferentiation. Our present study revealed that fluoride can downregulate Fam83h expression in mouse primary ameloblast-like cells at different developmental stages, which is consistent with immunohistochemical staining.
Overall, our findings shed new light on the association of Fam83h and fluorosis and indicated that high fluoride decreased the expression of Fam83h in morphological and cytological development. This may be one of the reasons for the occurrence of fluorosis. Further studies are needed to reveal whether FAM83H cooperates with other genes inducing such unique characteristics.
Footnotes
Competing Interests
The author(s) declared no potential conflicts of interest with respect to the research, authorship, and/or publication of this article.
Author Contributions
All authors have contributed to this article as follows: JJ and GS designed the study and drafted the manuscript; YZ, JG, ZY, and YL performed the experiment; YS revised the manuscript; and all authors have read and approved the manuscript as submitted.
Funding
The author(s) disclosed receipt of the following financial support for the research, authorship, and/or publication of this article: This work was supported by grants from the Bureau of Medical Science and Technology Projects of Henan (201702134) and the Henan Provincial Department of Education (18A320019).