
Abstract
Versican is a large chondroitin sulfate proteoglycan enriched in the extracellular matrix, and it has at least four different isoforms, termed V0, V1, V2, and V3. Although several studies have demonstrated that versican is stably expressed in various developing organs, the expression of versican isoforms during tooth development has not been elucidated yet. Therefore, the present study was to investigate the expression of versican isoforms in the developing mouse molars. The mandibular first molars from embryonic day (E) 11.5 to postnatal day (PN) 21 were used to investigate the expression of versican isoforms by immunohistochemistry, and the gene expressions of versican (Vcan) isoforms from E13.5 to PN7 were analyzed by quantitative real-time PCR. The results exhibited different expressing patterns of versican isoforms—the stellate reticulum (SR) and the dental mesenchymal cells adjacent to Hertwig’s Epithelial Root Sheath (HERS) only expressed V1 and the mature odontoblasts mainly expressed V2, while the dental papilla and the ameloblasts might both express V0/V1/V2. These results suggested that different versican isoforms may act different roles in the tooth development, and we speculated that V0/V1 might be intimately involved in the cell proliferation while V2 was associated in the cytodifferentiation.
Keywords
Introduction
The position and shape of different teeth are under strict genetic control, which determines tooth morphogenesis. This advancing process is mediated by sequential and reciprocal interactions between the neural crest-derived mesenchyme and the oral ectoderm.1,2 At the specific site where future tooth is going to erupt, oral epithelium thickens, buds, grows, and invaginates into the underlying mesenchyme to form the complex of tooth organ. Although the exact molecular mechanisms operating in epithelial-mesenchymal interactions remained unclarified, the pivotal role of extracellular matrix (ECM) molecules in this process is uncontroversial.3–5
Versican, a large interstitial proteoglycan enriched in the ECM, is composed of a central core protein and covalently attached chondroitin sulfate (CS) glycosaminoglycans (GAGs). Versican possesses an N-terminal (G1 domain) and a C-terminal (G3 domain) with two CS-attachment domains CS-α and CS-β between the two globular domains. 6 The GAG domain of the versican core protein is coded by exons 7 and 8, with exons 7 coding for the GAG-α region and exons 8 for the GAG-β region. When both the GAG-α and GAG-β are present, versican V0 is formed. When the GAG-α is spliced out, versican V1 is formed. When the GAG-β is spliced out, versican V2 is formed. When the GAG-α and GAG-β are both spliced out, versican V3 is formed. 7 The functions of different isoforms of versican have been investigated in recent years: V0/V1 have been reported to be involved in proliferation, apoptosis and migration, and V1 alone can also enhance proliferation, migration of the high-grade glioma cells, and reduce apoptosis of the fibroblasts.8,9 In contrast, V2 has exhibited opposite biological activities by inhibiting cell proliferation and enhancing angiogenesis in the glioblastoma cells.9,10
In dental tissues, the expression of versican or related large PGs is known to occur mainly in the mesenchymal tissues such as the dental pulp,11,12 dentin,13,14 cementum, 15 and periodontium. 16 But our previous study has revealed that versican can not only be synthesized by the dental mesenchyme but also by the dental epithelium. 17 The specific expression pattern of versican in the dental epithelium and mesenchyme may suggest that versican is involved in the epithelial–mesenchymal interaction. However, no information about the detailed expression of versican isoforms (including V0–V3) in the whole process of tooth development has been reported yet. Therefore, the goal of this study was to investigate the expression of different isoforms of versican in the process from tooth initiation to root completion in mouse mandibular first molars and hereby speculating their possible roles in tooth development.
Materials and Methods
Animals
Institute of Cancer Research (ICR) pregnant mice were ordered from Slaccas (Shanghai, China), and maintained under standard conditions at the Animal Center of the stomatology hospital of Tongji University. The animal-use protocol was in accord with the National Institutes of Health guidebook and was reviewed and approved by the Screening Committee for Animal Research of Tongji University. The morning when a vaginal plug appeared was designated as embryonic day 0 (E0). The fetal mice from E11.5, E13.5, E14.5, E16.5, and E18.5 and the postnatal mice from postnatal day 1 (PN1), PN5, PN7, PN14, and PN21 were used for hematoxylin-eosin (HE) and immunohistochemistry (IHC) staining, and the integrated tooth germ from E13.5 to PN7 were used for quantitative real-time PCR (qPCR) analysis.
Tissue Preparation
Following ether anesthetization, the pregnant mice were sacrificed by cervical dislocation. The mice (E11.5), the head (E13.5–E18.5), and the mandibles (PN1–PN21) of the mice were separated and fixed in 4% paraformaldehyde (PFA) in 0.1 M phosphate buffer (pH 7.4) at room temperature for 20 hr. The tissues of E11.5 to PN1 did not need the process of decalcification, while the mandibles (PN5–PN21) of the mice were decalcified in 10% EDTA for 1–2 weeks, after which they were dehydrated, embedded in paraffin. Frontal (E11.5–E18.5) and sagittal (PN1–PN21) sections (5 μm) were cut for HE and IHC staining. The first mandibular molar tooth germs from E13.5 to PN7 were dissected under stereomicroscope, and used for qPCR analysis.
Antibodies and IHC
The primary antibody we used for versican IHC was rabbit polyclonal anti-GAG-α and anti-GAG-β antibody (×100dilution; AB1032, AB1033, Millipore, Darmstadt, Germany) with reactivity to the V0, V1, and V2 versican isoforms based on the presence or absence of the GAG domains found for each isoform (V0-GAG-α and GAG-β, V1-GAG-β only, V2-GAG-α only). The secondary anti-rabbit IgG was purchased from Abcam in China (×500 dilution; ab6720, Abcam, Cambridge, UK). IHC was performed as previously described. 18 In brief, the slides were deparaffinized and rehydrated by the gradient elution using xylene and ethanol, followed by incubating in 3% H2O2 to eliminate endogenous peroxidase activity. For antigen retrieval, the slides were incubated in chondroitinase ABC (C2905; Sigma-Aldrich, St. Louis, MO) digestion (1 U/mL in 0.1 Tris-acetate, pH 7.3, containing 1 mg/ml bovine serum albumin [BSA]) for 1 hr at 37C. Subsequently, these sections were thoroughly rinsed in PBS and exposed for 30 min at room temperature to 5% BSA. After sealing with 5% BSA, the specimens were incubated with primary antibody diluted 1:100 at 4C overnight. Sections were then rinsed in PBS and incubated with biotinylated secondary antibody for 20 min at room temperature. SABC kit purchased from Boster (Wuhan, China) was used for staining process. 3,3’-diaminobenzidine (DAB) was used as a color developing agent, and then slides were counterstained with hematoxylin. Finally, slides were mounted with Permount TM Mounting Medium, and observed under a microscope (Nikon DS-Ri1-U3, Tokyo, Japan). Pictures were modified by PhotoshopCS6 (Adobe, San Jose, CA). Negative controls were incubated with normal anti-rabbit or anti-mouse IgG instead of the primary antibodies. We examined three to four different blocks for each embryonic day in order to confirm the consistency of findings.
RNA Extraction and Quantitative Real Time PCR (qPCR)
Total RNA was extracted from the integrated tooth germs (N=15) using Trizol (T9424, Sigma-Aldrich). Approximately 1 μg total RNA was transcribed and cDNA was synthesized by using the FastQuant RT Kit (with gDNase) according to the manufacturer’s protocol (KR106, Tiangen, China). qPCR was performed by using the Roche PCR system (Roche LightCycler Real-Time PCR System, Basel, Switzerland) and the SYBR green SuperReal PreMix Plus (FP205, Tiangen, China; 10 µL SuperReal PreMix Plus, 1 µL forward primer [10 mM], 1 µL reverse primer (10 mM), 1 µL cDNA and 7µL ddH2O). Glyceraldehyde-3-phosphatedehydrogenase (GAPDH) was used as the control to normalize the RNA expression levels. The primer sequences for versican V0, V1, V2, and V3 (Sango Biotech, Shanghai, China) are listed in Table 1.
Primers Sequences Used in the Quantitative RT-PCR.
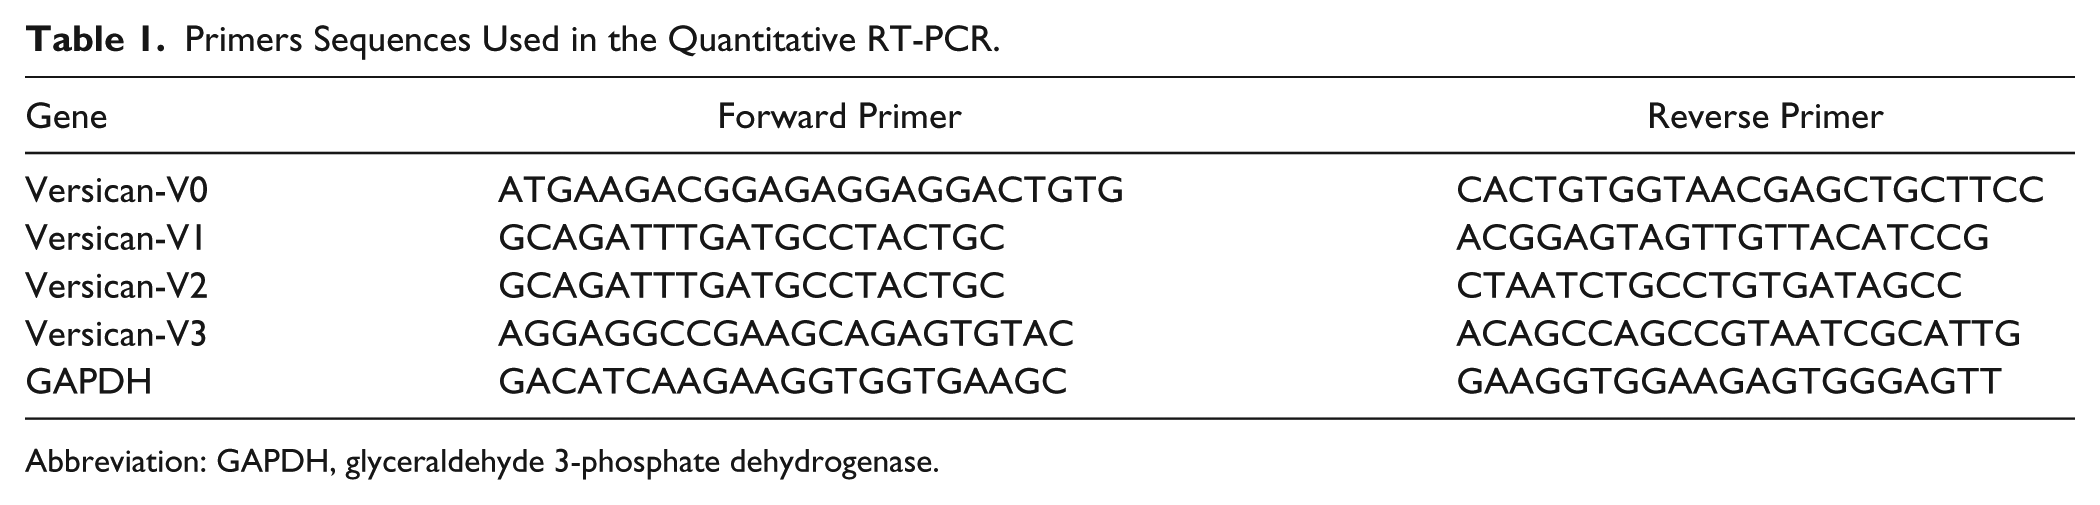
Abbreviation: GAPDH, glyceraldehyde 3-phosphate dehydrogenase.
Statistic Analysis
All experiments were performed in triplicate (three separate embryos), and statistical analysis was performed by using SPSS (IBM SPSS, Armonk, NY) version 20.0. Mean values were calculated and presented with an error bar representing ± standard deviation (SD). The one-way analysis of variance (ANOVA) test was used for statistical analysis. Statistical significance was accepted at p<0.05, and graphics software Graph Pad Prism 6.0 was used.
Results
The Distribution of Versican Isoforms in Embryonic Mouse Molars
At E11.5, the first mandible mouse tooth germ was at the initial stage (Fig. 1A). The result of IHC showed that neither GAG-α nor GAG-β staining was detected in the dental epithelium and the underlying mesenchyme (Fig. 1B and C).
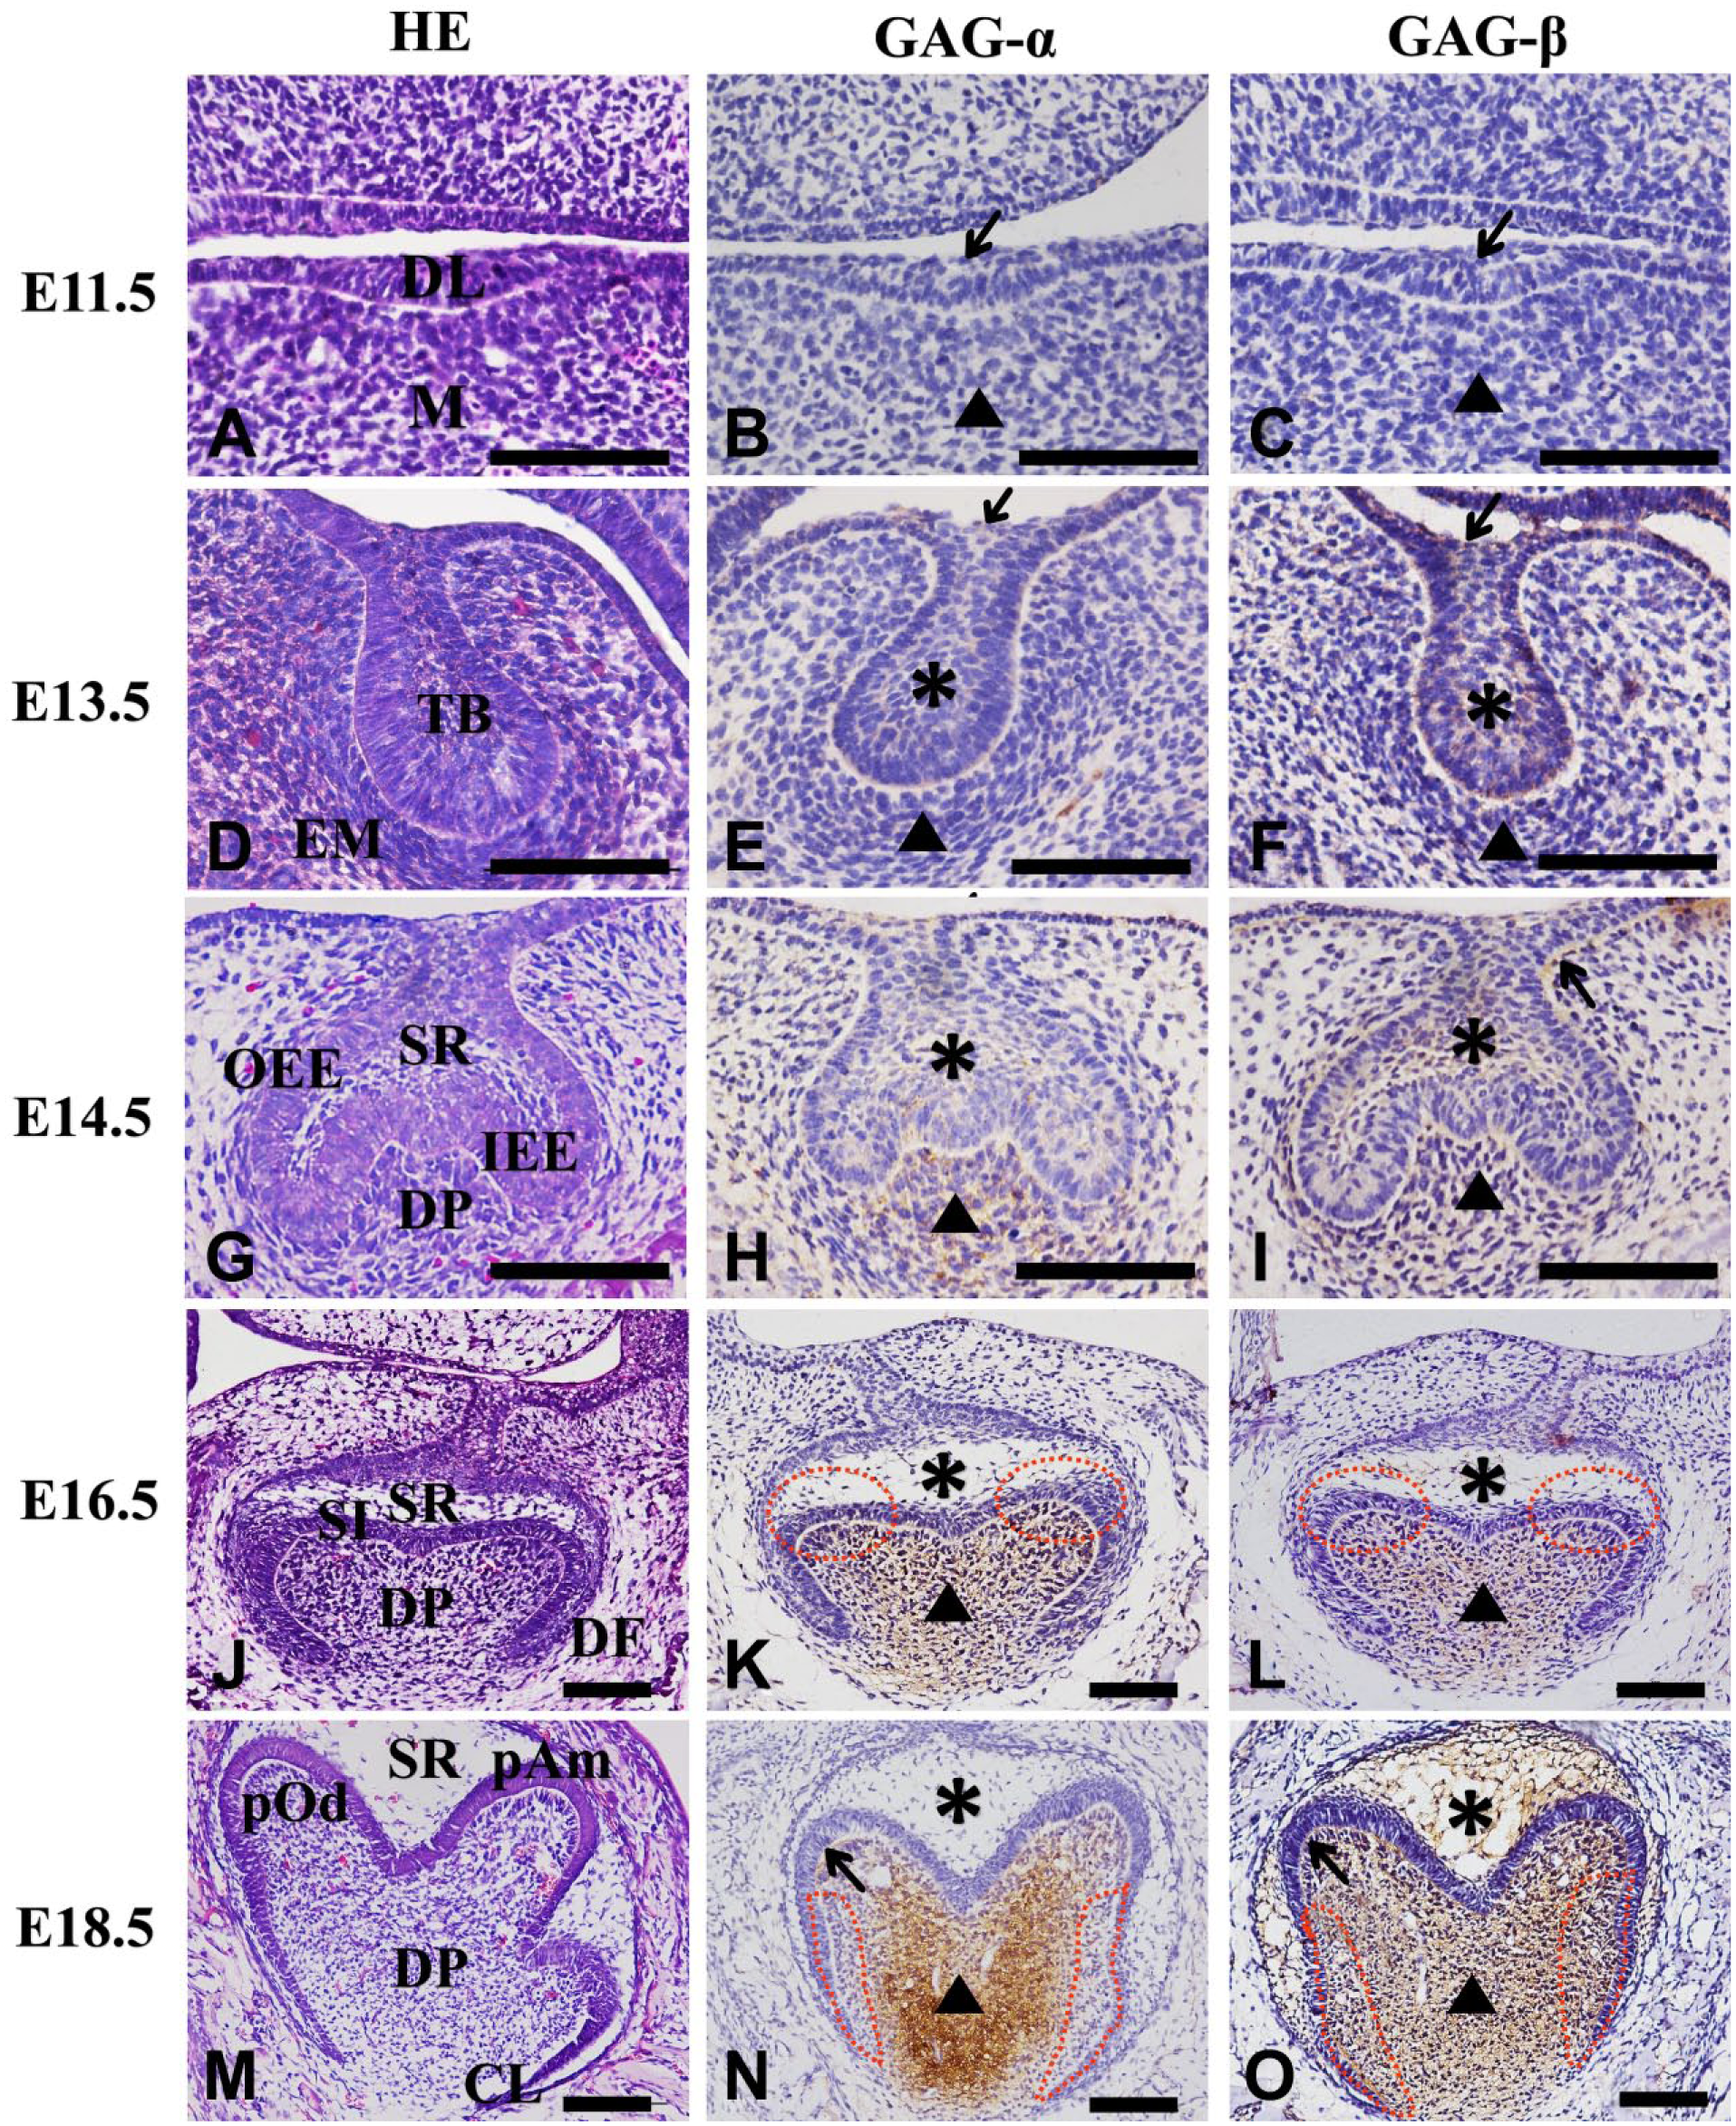
Versican Isoforms GAG-α (V0/V2) and GAG-β (V0/V1) accumulation in embryonic mouse mandibular tooth germ from E11.5 to E18.5. Brown indicates positive staining for GAG-α and GAG-β; blue, hematoxylin counterstain. Arrow (B–F) indicates dental lamina, dotted circle indicates the future cusp formation area (K, L), and mesenchymal cells adjacent to cervical loop (n, O). Arrow (N-O) indicates cuspal odontoblasts layer, arrowhead indicates dental papilla, and asterisk indicates stellate reticulum. Scale bar=100 µm. Abbreviations: DL, dental lamina; M, mesenchyme; TB, tooth bud; EM, neural crest-derived mesenchyme; OEE, outer enamel epithelial; IEE, inner enamel epithelial; SR, stellate reticulum; DP, dental papilla; DF, dental follicle; SI, stratum intermedium; CL; cervical loop; pAm, preameloblast; pOd, preodontoblast.
At E13.5, the budding of the dental epithelium was surrounded by the locally underlying condensed mesenchymal cells to form a bud-like tooth germ (Fig. 1D). In the epithelial highly proliferative tooth bud and the adjacent condensed dental mesenchyme, GAG-β staining was ubiquitous and more obvious than GAG-α staining. Unlike GAG-β, the central area of epithelial tooth bud was devoid of GAG-α staining (Fig. 1E and F). Therefore, at E13.5, V1 seemed to be expressed in the whole highly proliferative tooth bud and the dental mesenchyme while V0 might only be expressed in the epithelial cells adjacent to the basement membrane of the tooth bud.
At E14.5, the tooth germ was at the cap stage (Fig. 1G). GAG-α immunostaining was intense in the mesenchymal dental papilla and slightly positive in the inner and outer enamel epithelium (IEE/OEE), but disappeared in the central SR (Fig. 1H). Interestingly, there was evenly GAG-β staining in the SR and IEE/OEE, but obviously weaker staining in the dental papilla (Fig. 1I). From these results, we can deduce that the SR only expressed V1, V2 might be expressed in the dental papilla while the rest of the epithelium-derived enamel organ might both express V0/V1/V2 at E14.5.
At E16.5, the tooth germ was at the early bell stage, the enamel organ comprised the IEE and OEE, the SR, dental papilla and the dental follicle (Fig. 1J). The expression of GAG-α was restricted in the dental papilla but was enhanced in the future cusp formation area (the dotted circle in Fig. 1K and 1L) (Fig. 1K). However, GAG-β was evenly distributed in the dental papilla and the SR (Fig. 1L). From all these observations, we can conclude that the SR only expressed V1, the dental papilla cells where future cusp are located might express V2, while the rest of dental papilla might express both V0 and V1 at E16.5.
During the late bell stage at E18.5, the odontoblasts and the ameloblasts undergo the terminal differentiation (Fig. 1M). GAG-α was expressed in the dental papilla and the preodontoblasts at the future cusp formation area, but disappeared in the mesenchymal cells adjacent to the cervical loop (the dotted circle in Fig. 1N). In particular, the expression of GAG-α was gradually increased in the central dental papilla (Fig. 1N). Unlike GAG-α, the localization of GAG-β was evenly distributed in the SR and the dental papilla including the cells adjacent to the cervical loop (Fig. 1O). Taking these results into consideration, we can infer that the SR and the mesenchymal cells adjacent to cervical loop only expressed V1, the preodontoblasts at the future cusp formation area expressed V2 while the rest of dental papilla might express V0/V1/V2 at E18.5.
The Distribution of Versican Isoforms in Postnatal Mouse Molars From PN1 to PN21
At PN1, the odontoblasts in the cuspal area step into secretory status and begin to secrete the dentinal matrix (Fig. 2A). At this stage, the SR did not show immunoreactivity of GAG-α, this expression pattern continues throughout the crown formation stages (E16.5–PN7). Meanwhile, the strong staining of GAG-α was present in the cytoplasm of the preameloblasts and the secretory-odontoblasts (Fig. 2C). Positive staining was also detected in the pulp cells, but it was fainter than that in E18.5 and gradually increased to the central pulp (Fig. 2B). GAG-β immunostaining was seen ubiquitously in the SR, the preameloblasts and the dental pulp, weaker in the secretory-odontoblasts as compared with staining of GAG-α (Fig. 2D and E). Therefore, at PN1, the SR still only expressed V1, the secretory-odontoblasts might express V2/V0 while the preameloblasts and the dental papilla might both express V0/V1/V2.
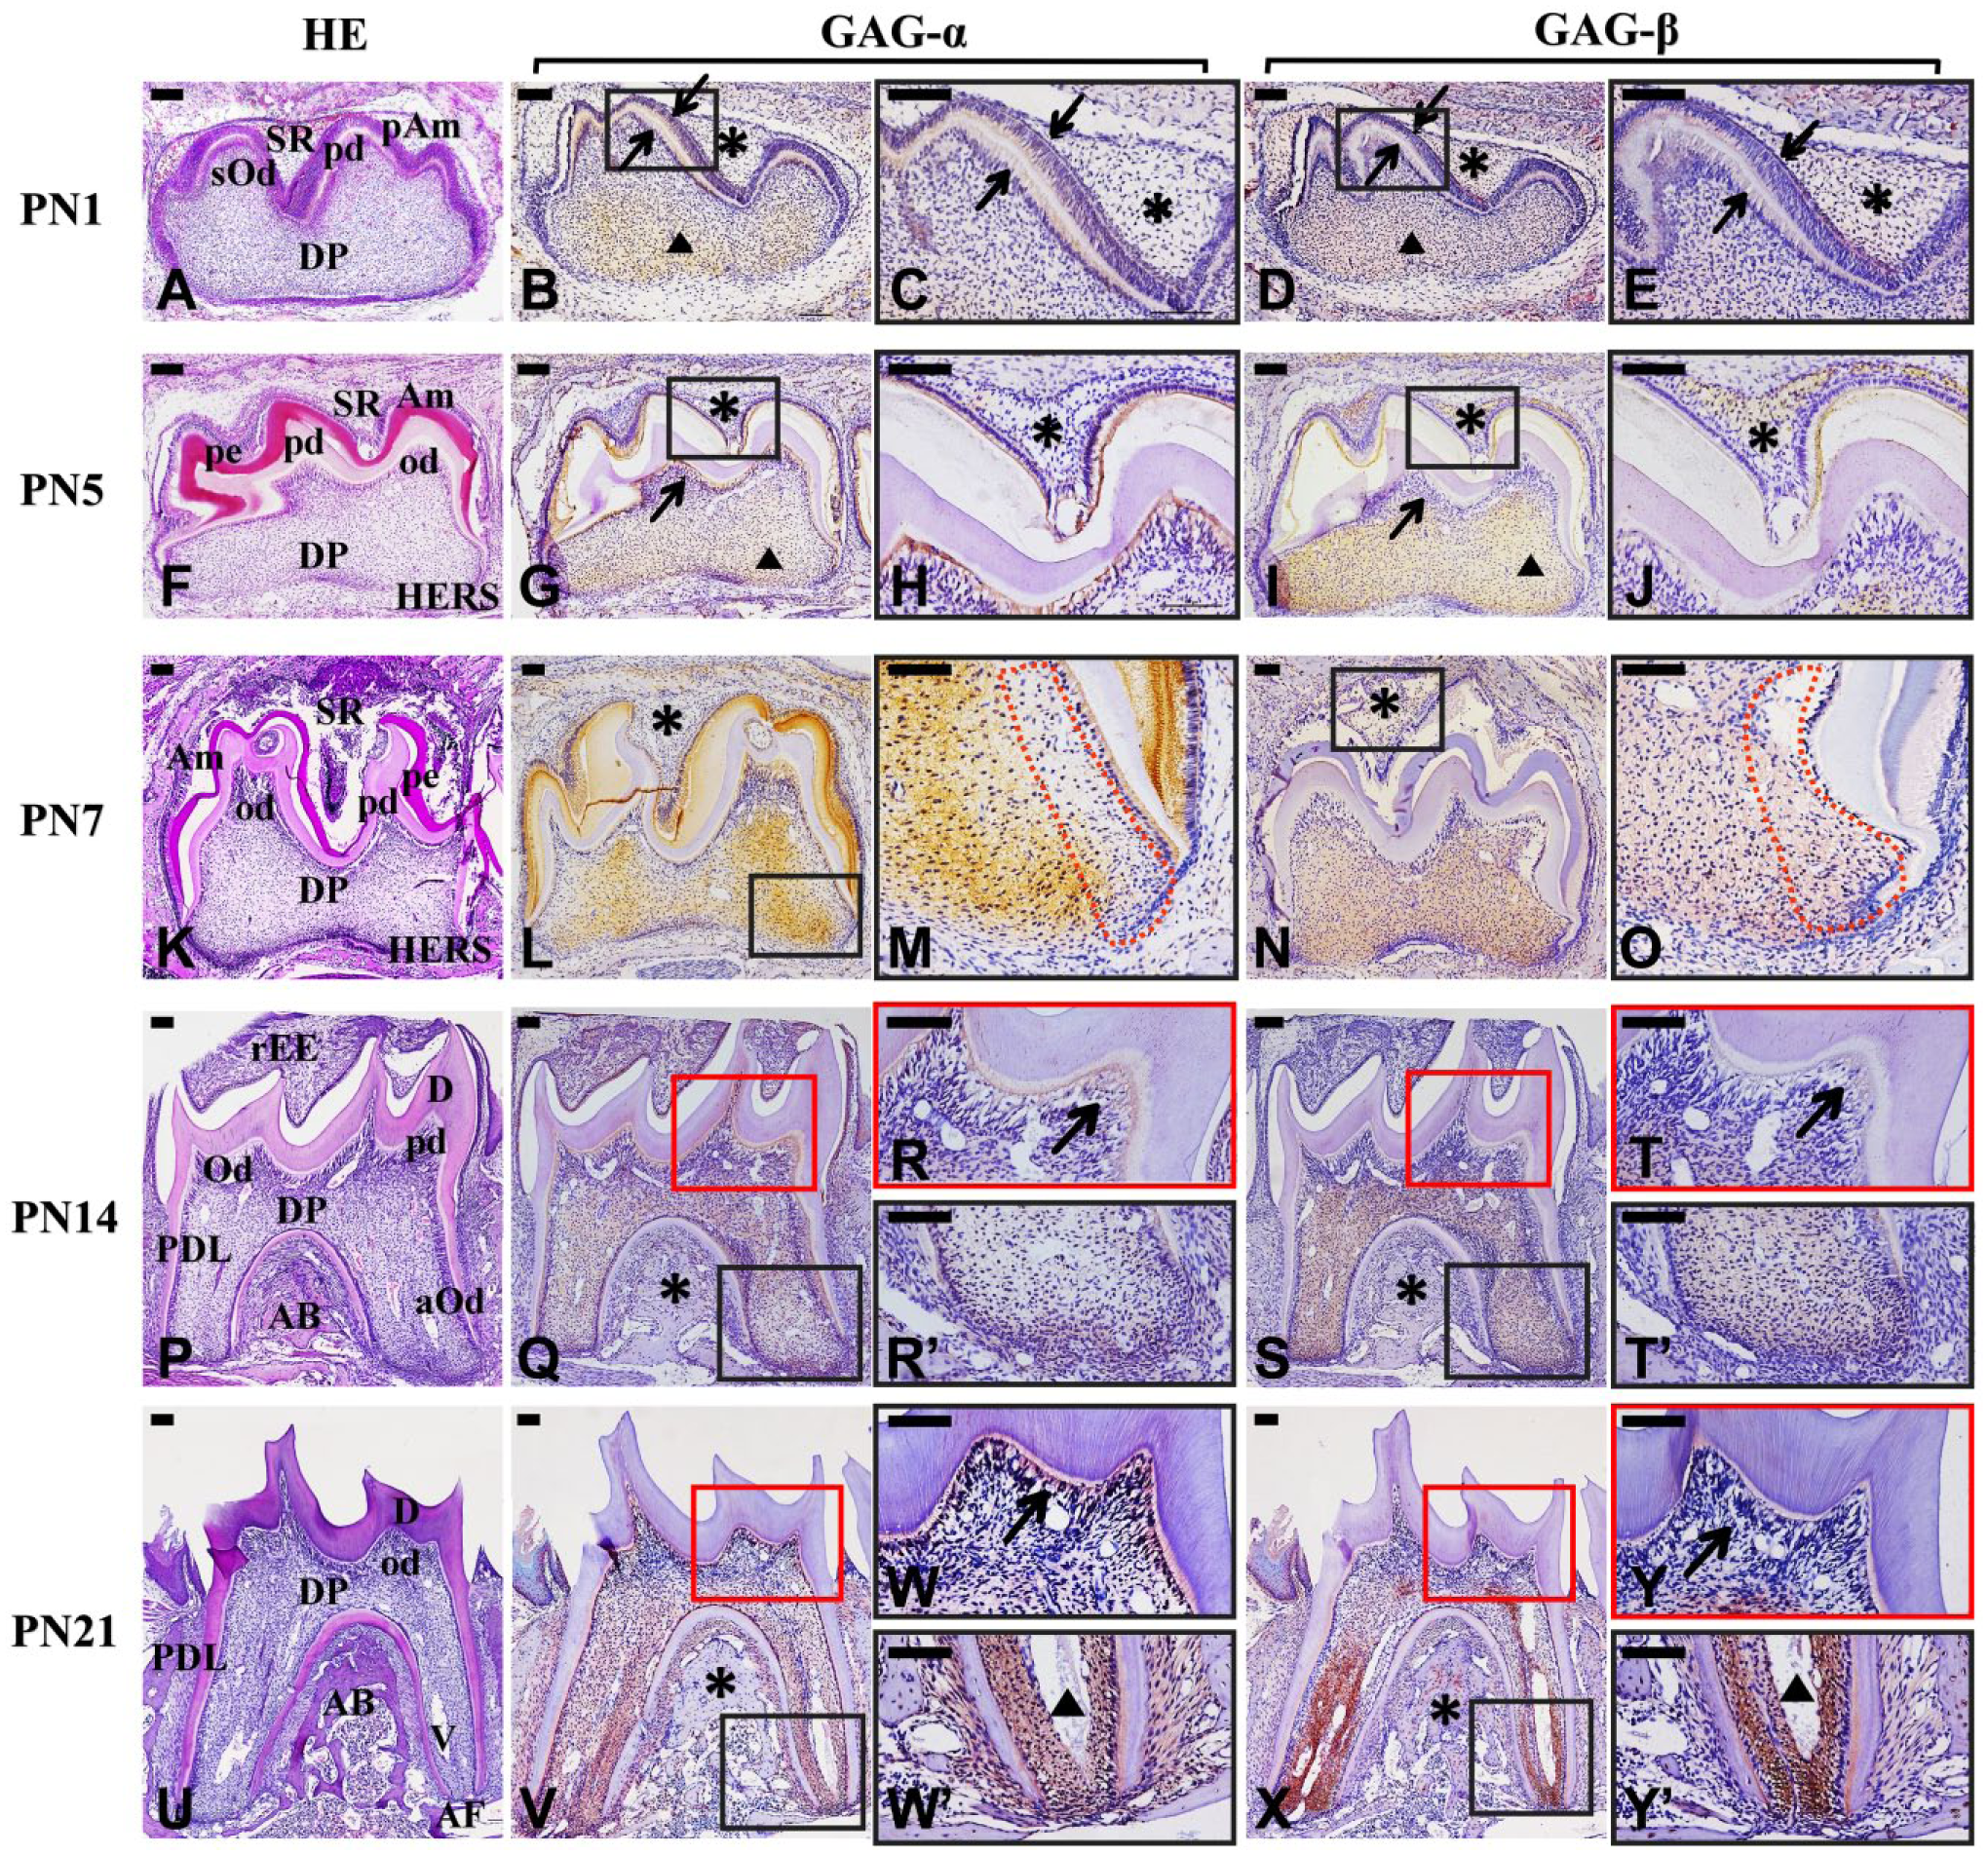
Versican Isoforms GAG-α (V0/V2) and GAG-β (V0/V1) accumulation in the postnatal mouse mandibular molars from PN1 to PN21. Brown indicates positive staining for GAG-α and GAG-β; blue, hematoxylin counterstain. The black box in C, E, H, J, M, O, R, R,’ T, T,’ W, W,’ Y, Y’ corresponds to (B), (D), (G), (I), (L), (N), (Q), (S), (V), (X). Upward and downward arrows indicate odontoblast and ameloblast, respectively, Arrowhead indicates dental papilla, asterisk indicates the stellate reticulum (B-N), and the interalveolar bone cells (Q-X). F, G, I, K, L, N, P, Q, S, U, V, X is the composite image. Scale bar=100 µm. Abbreviations: DP, dental papilla; SR, stellate reticulum; pOd, preodontoblast; Od, odontoblast; aOd, apical odontoblast; sOd, secretory-odontoblast; pAm, preameloblast; Am, ameloblast; pe, pre-enamel; pd, predentin; D, dentin; rEE, reduced enamel epithelium; HERS, Hertwig’s Epithelial Root Sheath, AB, interalveolar bone; PDL, periodontal ligament; V, vessel; AF, apical foramen.
At PN5, the epithelial cells of the IEE/OEE extend from the cervical loop to form a bi-layered epithelial structure termed Hertwig’s Epithelial Root Sheath (HERS) (Fig. 2F). Staining of GAG-α was intense in the odontoblasts and the ameloblasts but weak in the dental papilla (Fig. 2G and H). The expression of GAG-β was obviously stronger distributed in the ameloblasts, the SR and the dental papilla than that in PN1. Interestingly, the functional cuspal odontoblasts were devoid of GAG-β staining (Fig. 2I and J). Therefore, at PN5, the SR still only expressed V1, the functional cuspal odontoblasts only expressed V2 while the dental papilla and the ameloblasts might both express V0/V1/V2.
At PN7, the ameloblasts and the odontoblasts come into secretory status and secrete huge amounts of enamel and dental matrix (Fig. 2K). Pronounced GAG-α staining of the cuspal secretory-odontoblasts, ameloblasts, pre-enamel, and the dental papilla were present, while the immunoreactivity was reduced in the premature-stage odontoblasts and vanished in the cells adjacent to HERS (the dotted circle in Fig. 2M) (Fig. 2L). The expression pattern of GAG-β was similar to that of PN5 (Fig. 2N and O). At PN7, the SR and the mesenchymal cells adjacent to HERS only expressed V1, the odontoblasts only expressed V2, while the dental papilla and the ameloblasts might express V0/V1/V2.
The mouse mandibular molar erupts into the oral cavity at PN14. At this stage, the dental papilla cells inside of the HERS differentiate into the odontoblasts to produce the root dentin (Fig. 2P). GAG-α was intensely detected in the odontoblasts, ameloblasts, and the dental pulp cells, moderately exhibited in the reduced enamel epithelium, and disappeared in the interalveolar bone cells (Fig. 2Q, 2R, and 2R’). The expression of GAG-β was strong in the ameloblasts and the dental pulp cells, diminished in the interalveolar bone cells, and vanished in the odontoblasts (Fig. 2S, 2T, and 2T’). From above results, we can deduce that V1 is only expressed in the interalveolar bone cells, V2 might only be expressed in the odontoblasts and the reduced enamel epithelium, while both the ameloblasts and the dental pulp cells might express V0/V1/V2.
At PN21, the root formation proceeds into the late stage (Fig. 2U). GAG-α accumulates strongly in the odontoblast lineage cells at the cornal and apical areas, as well as the dental pulp cells at apical areas, and is moderately expressed in the periodontal membrane (PDL) and the gingival epithelial cells, while the interalveolar bone cells were still devoid of GAG-α immunoreactivity (Fig. 2V, 2W, and 2W’). Interestingly, GAG-β was especially intensely expressed in the perivascular dental pulp cells at apical areas, while the predentin, PDL, interalveolar bone cells, and the gingival epithelial cells exhibited moderate staining (Fig. 2X, 2Y, and 2Y’). Therefore, we can conclude that V1 was mainly expressed in the interalveolar bone cells and the perivascular dental pulp cells, V2 seemed to be only expressed in the functional cuspal and apical odontoblasts while the dental pulp cells, predentin, PDL, and the gingival epithelial cells might express V0/V1/V2 at PN21.
Negative controls using normal rabbit or mouse IgG did not show positive reactions in any sections examined (supplementary Fig. 1); we examined with three to four different blocks for three embryonic and postnatal days and obtained the same results.
Gene Expression of Versican Isoforms V0, V1, V2 and V3 During Mouse Molar Development
From the bud stage (E13.5) to the late bell stage (E18.5), the expression pattern of Vcan isoforms—V0, V1 and V3—were in a similar trend—they all gradually increased from E13.5 to E14.5 and decreased from E14.5 to E18.5. On the contrary, the expression of Vcan V2 gradually increased from E13.5 to E16.5 and decreased from E16.5 to E18.5, relative mRNA expression was the highest for V0, V1, and V3 at E14.5 in prenatal stages, while V2 Vcan expression was the highest at E16.5. After birth, all isoforms of Vcan expression raised from E18.5 to PN1—the expression of V2 and V3 were increased significantly (p<0.01), while the expression of V0 and V1 had no significant increase. In postnatal stage, V0 and V1 Vcan expression exhibited a similar trend—it increased insignificantly from PN1 to PN5, then increased significantly from PN5 to PN7 with the highest expression at PN7. Interestingly, V2 Vcan mRNA expression showed an opposite tendency: first, it decreased from PN1 to PN5, and then increased significantly from PN5 to PN7. The expression trend of V3 Vcan mRNA resembled that of prenatal stages: it increased from PN1 to PN5 and then decreased from PN5 to PN7 (Fig. 3A).
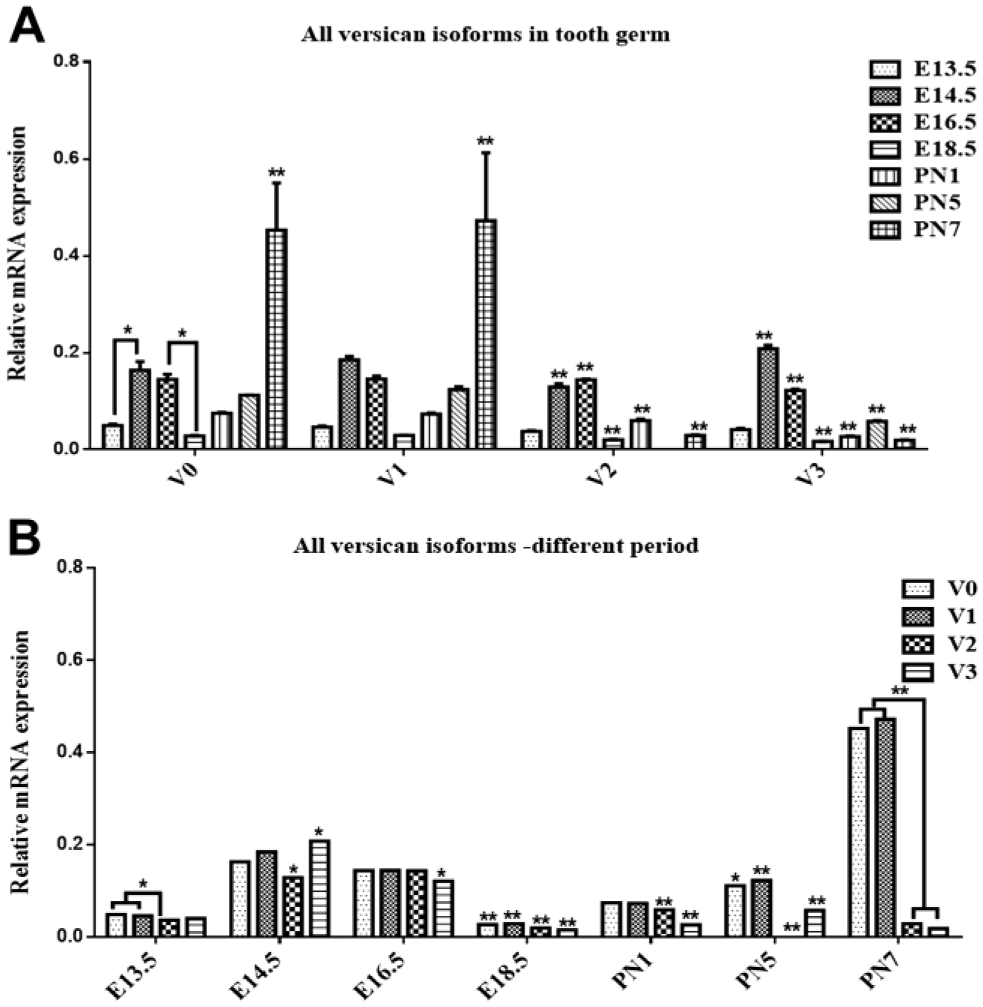
Quantitative-real time PCR for versican isoforms during mouse molar development. A: chronological changes in the relative amounts of mRNA for the four versican isoforms from E13.5 to PN7. B: the relative amounts of mRNA for the four versican isoforms at different developmental stage from E13.5 to PN7. The relative expression of mRNA for the four versican isoforms is represented as a fold increase over the GAPDH expression. Values are the mean ± SEM with a minimum n=3 for each group studied. Asterisk (*)(**) shows groups that are significantly different (p<0.05) (p<0.01) using one-way ANOVA with Tukey’s multiple comparison test. Abbreviations: GAPDH, glyceraldehyde 3-phosphate dehydrogenase; SEM, scanning electron microscope.
V0 and V1 Vcan mRNA expression was the highest throughout embryonic mouse molar development compared with other two isoforms except at the cap stage and early bell stage (E14.5 and E16.5). The expression of V1 Vcan mRNA was always higher than that of V2 Vcan from E13.5 to PN7, except at E16.5 where mRNA expression levels of V1, V2, and V3 showed no significant difference (Fig. 3B).
Discussion
The present study was performed to determine the expression and distribution of different isoforms of versican in mouse mandibular molars from the tooth initiation stage (E11.5) to the late postnatal stage (PN21), covering the whole process of tooth crown and root formation stage. Our results have revealed that the distribution of versican GAG-α and GAG-β was in a special temporal–spatial pattern, and the gene expression levels of different isoforms of Vcan also had their distinct and analogical changes among different stages, suggesting that different isoforms of versican may perform different roles in tooth development.
The earliest histologic indication of tooth development is at day 11 of gestation, which is marked by a thickening of epithelium occurring on the oral surface of the first branchial arch. 19 Neither signals of GAG-α or GAG-β were detected in the dental placode nor the underlying mesenchyme at this initial stage, and our in situ hybridization results also didn’t detect any signals of versican mRNA expression (data not shown). Therefore, those results together indicated that versican may not be directly involved in tooth initiation.
At E13.5, the dental epithelium is highly proliferative and rapidly invaginates into the underlying mesenchyme to form the epithelial tooth bud. 20 We detected stronger GAG-β immunostaining than GAG-α in the tooth bud, indicating that V0 in GAG-α may be stained in the tooth bud at Fig. 1E, while V0 and V1 together in GAG-β were stained in Fig.1F. Previous studies demonstrated that versican was involved in the cell proliferation by interacting with growth factors such as platelet-derived growth factor (PDGF) and TGF-β, and thereby regulating the expansion of the pericellular ECM that was required for the cell proliferation.21–23 An in vitro experiment has also proved that when V1 increases, the extracellular environment might become favorable for cell proliferation and survival, as is in the case of tissue development and tumor formation. 9 Unlike the distinct roles that V0 and V1 play in cell function, here, their functions follow a parallel pattern. 24 Stronger GAG-β (V0/V1) immunostaining in the highly proliferative tooth bud may highlight an important role for V0/V1 in cell migration and proliferation during the early epithelial morphology. After the bud stage, a cluster of non-dividing epithelial cells starts aggregating at the tip of the tooth cap, marking the onset of morphologic differences in tooth germs that give rise to the different types of teeth. 25 From the cap to the bell stage, tooth crown morphogenesis occurs, and reciprocity between the cells in different layers and their derivatives is necessary. 26 It has been previously demonstrated that this involves cell proliferation, differentiation, adhesion, and migration and that versican contributes to each function.6,27
In current study, V1 was detected in the SR throughout crown formation process (E14.5–PN7). This finding suggested that as a hydrophilic component,28,29 V1 increased the volume of extracellular compartment, detached the central cells, and formed the enamel organ, which is essential for nutrient exchange and protection of enamel organ’s development. 30 Moreover, versican can bind to hyaluronan and indirectly interact with hyaluronan cell surface receptor CD44 to form versican-HA-CD44 complexes which participate in regulating several cell behaviors including proliferation, adhesion, migration and invasion. 31 Hyaluronan 32 and CD4433 were also expressed in the SR, which further emphasized their interactions for enamel organ formation. We also detected similar V1 intensity in the pulp cells adjacent to cervical loop/HERS (E18.5–PN7) as in the SR. In addition to regulating the mesenchymal–epithelial interactions, those highly proliferative mesenchymal cells also contributed to the epithelial cell migration and thereby affected the tooth root development. 34 Thus, V1 perhaps also participated in regulating the proliferation of mesenchymal cell for tooth root formation. This may explain why the gene expressions of V0/V1 increased significantly at PN7. In sum, V1 has been revealed to participate in the maintaining of the shape of SR, nutritional recruitment and enamel organ enlargement, but its specific molecular role in cell proliferation requires more detailed investigation.
During the late bell stage, the cuspal cells of the dental papilla differentiate into the preodontoblasts and the IEE becomes preameloblasts, marking the beginning of the matrix deposition process of the crown formation.35,36 Following the completion of crown formation, the tooth root formation begins in the cervical region of the tooth germ at PN5, where the epithelial cells of the IEE/OEE proliferate to form a double layer of cells, known as HERS. 37 At PN21, the tooth root formation is about to be accomplished and the mesial apical foramen has already been closed. 38 In the present study, we first detected V2 (GAG-α) in the epithelial adjacent dental papilla cells at E14.5, then in the cuspal mature odontoblasts and predentin from E16.5 to PN21, but we did not detect V2 (GAG-α)’s expression in the premature odontoblasts at those stages. These results imply that V2 might play an essential role in the differentiation and functioning of odontoblasts and dentin matrix organization. These speculations are in accordance with previous studies, which reported that V2 was associated with suppression of cell proliferation and participated in the terminal stages of cytodifferentiation.9,10,39 Besides, the quantitative mRNA expression of V2 Vcan increased from E18.5 to PN1 when the preodontoblasts became functioning odontoblasts, then dropped at PN5 when HERS evolved, and increased again at PN7 when the radicular odontoblasts started to form the root dentin. These results further support the speculation that we put forward earlier.
Meanwhile, we also detected V3 mRNA expression in a relatively high level, and it reached the highest at E14.5 as compared with other three isoforms (Fig. 3B). Previous studies have reported that shorter V3 can alter cell phenotype as a way to counteract effects of the larger, GAG containing isoforms of versican, and that the V3-overexpressing cells exhibited promoting adhesion, inhibited migration, and reduced proliferation.40,41 Unfortunately, there is no specific antibody that can detect V3. Therefore, the precise distribution of V3 in the tooth morphogenesis still requires further investigation or other molecular biological techniques.
Current studies about versican isoforms mainly focus on the nervous system, lungs, and tumors; our study proved that there is a huge potential for study of versican isoforms in tooth development. In conclusion, V0, V1, and V2 (GAG-α/β) were expressed in a special temporal-spatial pattern in the development of mouse mandibular first molars. The SR and the dental mesenchymal cells adjacent to HERS only expressed V1 and the mature odontoblasts mainly expressed V2, while both dental papilla and the ameloblasts might express V0/V1/V2. Based on these results, we speculated that V2 may play a significant role in the odontoblasts differentiation and dentin matrix organization while V0/V1 may be vital to cell proliferation. Future work using mice harboring a disrupted versican gene via conditional knockout strategies and specific antibody to V0/V1/V2 will be critical to identify the role of versican in embryogenesis, health and disease.
Supplemental Material
DS10_1369_0022155419846875 – Supplemental material for Expression of Different Isoforms of Versican During the Development of Mouse Mandibular First Molars
Supplemental material, DS10_1369_0022155419846875 for Expression of Different Isoforms of Versican During the Development of Mouse Mandibular First Molars by Fangfang Xu, Wenping Cai, Weiting Chen, Lefeng Li, Xuyan Li and Beizhan Jiang in Journal of Histochemistry & Cytochemistry
Footnotes
Competing Interests
The author(s) declared no potential conflicts of interest with respect to the research, authorship, and/or publication of this article.
Author contributions
The manuscript was written through contributions of all authors. All authors approved the final version of the manuscript.
Funding
The author(s) disclosed receipt of the following financial support for the research, authorship, and/or publication of this article: This work was supported, in whole or in part, by the National Natural Science Foundation of China (No. 81600881 and No. 81600855), Shanghai Science and Technology Commission Program (18411969500) and Shanghai Municipal Commission of Health and Family Planning (No. 20164Y0129 and No.201740223).
References
Supplementary Material
Please find the following supplemental material available below.
For Open Access articles published under a Creative Commons License, all supplemental material carries the same license as the article it is associated with.
For non-Open Access articles published, all supplemental material carries a non-exclusive license, and permission requests for re-use of supplemental material or any part of supplemental material shall be sent directly to the copyright owner as specified in the copyright notice associated with the article.