
Abstract
Glutamate transport activities have been identified not only in the brain, but also in the liver, kidney, and intestine. Although glutamate transporter distributions in the central nervous system are fairly well known, there are still uncertainties with respect to the distribution of these transporters in peripheral organs. Quantitative information is mostly lacking, and few of the studies have included genetically modified animals as specificity controls. The present study provides validated qualitative and semi-quantitative data on the excitatory amino acid transporter (EAAT)1–3 subtypes in the mouse liver, kidney, and intestine. In agreement with the current view, we found high EAAT3 protein levels in the brush borders of both the distal small intestine and the renal proximal tubules. Neither EAAT1 nor EAAT2 was detected at significant levels in murine kidney or intestine. In contrast, the liver only expressed EAAT2 (but 2 C-terminal splice variants). EAAT2 was detected in the plasma membranes of perivenous hepatocytes. These cells also expressed glutamine synthetase. Conditional deletion of hepatic EAAT2 did neither lead to overt neurological disturbances nor development of fatty liver.
Introduction
Glutamate is at the crossroad between several metabolic pathways, 1 comprising energy metabolism, ammonia detoxification, and protein synthesis. In addition to this, it serves as the major excitatory neurotransmitter in the central nervous system (CNS).2,3 Because of its excitatory effect at glutamate receptors, glutamate may be toxic. To keep extracellular glutamate at physiological concentrations, transmembrane transport of glutamate from the extracellular to the intracellular compartment is necessary, and several transporter proteins with affinity for glutamate are expressed in mammals.4–6 Glutamate transport activity was identified, not only in the brain,7–10 but also in several peripheral organs long before the individual transporter proteins were identified by molecular cloning.11,12 For instance, by using radioactively labeled glutamate, glutamate accumulation could be detected in perivenous hepatocytes by means of autoradiography.13,14 Similarly, membrane vesicles prepared from the brush border of the intestine15–17 and of kidney tubules were shown to take up glutamate with high affinity.18–24
The 2 first glutamate transporters (or excitatory amino acid transporters), EAAT1 (GLAST; Slc1a3) and EAAT2 (GLT-1; Slc1a2), were cloned after the proteins had been isolated from rat brain.25–27 On the other hand, EAAT3 (EAAC1; Slc1a1) was identified by expression cloning from rabbit jejunum. 28 Two additional EAAT-type of transporters were later identified in brain 29 and retina, 30 but these will not be discussed here as they are more important as glutamate gated chloride channels than as transporters.6,31
Whereas distributions in the CNS are now to large extent known (for references, see31,32), there are only a few published studies on the distributions of glutamate transporters in the intestine, liver, and kidney. Some studies are based on cell cultures, and some have only quantified relative changes in mRNA levels. Furthermore, none of the studies based on in situ hybridization or IHC33–39 has used knockout animals to validate the labeling specificity, and none of these studies contains quantitative information. The existing studies are also based on different species. Thus, the available information is fragmented and incomplete. The aim of the present investigation has been to obtain validated qualitative and semi-quantitative data on EAAT1–3 in the liver, kidney, and intestine of C57Bl6/j mouse. The expression levels have been compared with those in the brain where they have been determined.40,41 Most of the results here presented turned out as confirmatory, but there are some exceptions.
Materials and Methods
Materials
Bis(sulfosuccinimidyl)suberate and SDS of high purity (>99% C12 alkyl sulfate) were provided by Pierce (Rockford, IL). Acrylamide, ammonium persulfate, N,N′-Methylenebisacrylamide, and TEMED (N,N,N′,N′ tetramethylethylenediamine) were from Promega (Madison, WI). Electrophoresis equipments were purchased from Hoefer Scientific Instruments (Holliston, MA). Handheld Homogenizer was from Kinematica AG (Littau, Switzerland). Molecular mass markers for SDS-PAGE and nitrocellulose sheets (0.22 µm pores; 100% nitrocellulose) were obtained from Amersham (Buckinghamshire, UK). Paraformaldehyde and glutaraldehyde EM grade were from TAAB (Reading, UK). Other reagents were purchased from Sigma-Aldrich (St. Louis, MO).
Animals
The EAAT3 (B6N(Cg)-Slc1a1tm1b(KOMP)Wfsi/J; Stock No. 024411, Jackson Laboratory, Bar Harbor, ME; RRID:IMSR_JAX:024411) or EAAT2 (GLT-1; slc1a2 42 ) knockout mice included in the study were generated by heterozygote breeding scheme. The liver-specific EAAT2 knockouts were made by crossing EAAT2-flox mice (B6.Cg-slc1a2tm1.1Ncd/J; Stock no: 026619, Jackson Laboratory 43 ; RRID:IMSR_JAX:026619) with Albumin-Cre driver (B6.Cg-Tg(Alb.Cre)21Mgn/J; Stock no: 003574, Jackson Laboratory; RRID:IMSR_JAX:003574). Ai14 reporter mice (B6.Cg-Gt(ROSA)26Sortm14(CAG-tdtTomato)Hze/J; Stock no: 007914, Jackson Laboratory; RRID:IMSR_JAX:007914) were used to examine the specificity of Cre driver. All mice were housed at the animal facility at the Governmental Institute of Public Health (Oslo, Norway). The mice experimentations were performed according to the European Communities Council Directive of November 24, 1986 (86/609/EEC) and the National Institutes of Health (NIH) Guide for the Care and Use of Laboratory Animals (NIH publication no. 80–23, revised 1996). Formal approval to carry out the experiments described was obtained from the Animal Subjects Review Board of the Norwegian Governmental Institute of Public Health (Oslo, Norway). Consideration and care were taken to avoid mice suffering and to minimize the number of mice used.
RNA Isolation, cDNA Synthesis, and TaqMan Assays
Pieces of tissues (5–15 mg) were collected and immediately protected in RNAlater (Ambion, Waltham, MA), before homogenization and RNA extraction using RNeasy (Qiagen, Hilden, Germany). The RNA concentration was quantified by using NanoDrop UV spectrometry (NanoDrop Technologies, Wilmington, DE). Two µg of RNA were converted into cDNA by using High Capacity cDNA archive kit. Expression of EAAT1 (GLAST; slc1a3), EAAT2 (GLT-1; slc1a2), and EAAT3 (EAAC1; slc1a1) were measured using TaqMan probes (Mm00600697_m1; Mm00441457_m1; Mm00436590_m1; Thermo Fisher Scientific; Waltham, MA). GAPDH (Mm03302249_g1) was used as a control gene.
Antibodies
Affinity purified antipeptide antibodies to rat glutamate transporters (EAAT2 26 ; EAAT3 44 ) were from the same batches as described previously. Because antibody batches may differ from each other, 45 we identify antibody batches by the unique identification number (“Ab#”) they are given by our electronic laboratory information system (software provided by Science Linker AS; Oslo, Norway): The two EAAT1 (GLAST) antibodies, Ab#141 (RRID:AB_2714074; rabbit 68488 46 ) and Ab#314 (RRID:AB_2314561; rabbit 8D0161 47 ), were both directed to the C-terminal residues 522–541 of rat EAAT1 (PYQLIAQDNEPEKPVADSET-amide). The N-terminal EAAT2 (GLT-1) antibody Ab#360 (RRID:AB_2714081; rabbit 26970) was directed to rat EAAT2 residues 12–26 (KQVEVRMHDSHLSSE-amide: 48 ), and the C-terminal splice variant specific EAAT2 antibodies 49 Ab#355 to the a-variant (RRID:AB_2714094; rabbit 1B0707) and Ab#357 to the b-variant (RRID:AB_2714095; rabbit 1B0707) were directed, respectively, to residues 563–573(SVEEEPWKREK-free acid) and 550–557 (KVPFPFLD-amide). The EAAT3 antibodies used were both to the C-terminus: Ab#340 (RRID:AB_2714057; sheep 4131; rat EAAT3 residues 510–524: VDKSDTISFTQTSQF-free acid 50 ) and Ab#371 (RRID:AB_2714048; rabbit 1B0683; rat EAAT3 residues 491–523: CLDNEDSDTKKSYVNGGFSVDKSDTISFTQTSQF-free acid 51 ). Anti-beta-Tubulin (cat. no. T4026) and rabbit anti-glutamine synthetase (cat. no G2781) were from Sigma (St. Louis, MO). Mouse monoclonal anti-glutamine synthetase (cat. no MAB302) was from Chemicon (Temecula, CA). Fluorescein-labeled Lotus tetra-gonolobus lectin (cat. no. FL-1321) and fluorescein-labeled Dolichos biflorus agglutinin lectin (cat. no. FL-1031-2) were from Vector Labs (Burlingame, CA). Tamm Horsfall glycoprotein (cat. no. BT-590) was from Biomedical Technologies (Stoughton, MA). Secondary antibodies Alexa Fluor donkey anti-rabbit 488 and donkey anti-sheep 555 were from Thermo Fisher Scientific.
Tissue Preparation, Electrophoresis, and Immunoblotting
After being sacrificed by cervical dislocation, the tissues were freshly collected and then kept at −80C until use. For the intestine, it was first rinsed into ice-cold 0.1 M sodium phosphate buffer with pH 7.4 (NaPi) containing 1 mM PMSF and 5 mM EDTA to remove the food debris, and then was divided into segments (about 2–4 cm).
Freshly frozen tissue was first homogenized in 10 volumes of ice-cold water containing 5 mM EDTA and 1 mM PMSF and was subjected to centrifugation (39,000 × g, 20 min, 4C). The membrane fraction (pellet) was collected, resuspended in 1% (w/v) SDS in 10 mM NaPi and briefly sonicated before centrifugation (1000 × g, 10 min, 15C). The total protein concentration was determined by Lowry assay. 52 The samples were then subjected to SDS polyacrylamide gel electrophoresis and immunoblotted as described. 49 Briefly, the blots were first rinsed in PBS (10 mM NaPi pH 7.4 and 135 mM NaCl) and then blocked (1 hr) with 0.05% (w/v) casein in PBS before incubating with primary antibodies (at concentrations as stated) in BSA (30 mg/ml) in PBST (PBS with 1 ml/liter Tween 20 and 0.5 mg/ml NaN3) overnight, room temperature. Next, the membranes were rinsed (4 × 10 min) with PBST before incubation (1 hr) in secondary antibody solution (1:10,000–1:20,000), then rinsed several times with PBST and then PBS to remove residual Tween 20 before scanning. The blots were examined for immunofluorescence using an infrared scanner (Licor Odyssey system, LI-COR Biotechnology-UK Ltd; Cambridge, UK). Densitometric data were extracted from the images by means of the gel analyzer tool included in our electronic laboratory information system (software provided by Science Linker AS; Oslo, Norway).
Oil Red O Staining
The staining was performed as described previously. 53 Briefly, fresh frozen livers were collected from adult mice. Sections (6 µm thick) were cut using a Leica cryostate (CM3050S, Germany) and allowed to air-dry on microscope slides. The sections were subsequently incubated (5 min, room temperature) with Oil red O working solution, 53 rinsed in running tap water (15 min), and mounted with water-soluble mounting medium. The stained sections were imaged within 2 days.
IHC
Mice were perfused as described previously. 54 Briefly, they were deeply anesthetized by intraperitoneal injection with ZRF cocktail (at least 0.1 ml per 10 g body weight). ZRF is a mixture of Zolazepam (3.3 mg/ml; CAS 31352-82-6), Tiletamine (3.3 mg/ml; CAS 14176-49-9), Xylazine (0.5 mg/ml; CAS 7361-61-7), and Fentanyl (2.6 μg/ml; CAS 437-38-7). After cessation of all reflexes, the mice were perfused transcardially first with 0.1 M NaPi to wash out blood and then immediately afterward with 4% formaldehyde in 0.1 M NaPi with or without 0.05% glutaraldehyde for 5 min. The relevant tissues were collected and immersed in fixative for about 2–3 hr at room temperature. Fixed intestine was cut into pieces and embedded in 13% gelatin before cryo-preservation and microtome sectioning (Microtome HM450; Thermo Fisher Scientific). Tissues from wild-type and knockout littermate pairs were processed in parallel to minimize the potential differences caused by some factors (e.g., fixation, animal age, or rearing conditions). Immunofluorescent labeling was done as previously described. 55 Briefly, the sections were rinsed (3 × 5 min) in TBST (TBS with 0.5% Triton X-100), treated with 1 M ethanolamine in 0.1 M NaPi pH 7.4 (30 min), washed in TBST, and blocked (1 hr) in TBST containing 10% newborn calf serum (NCS) and 3% BSA followed by incubation (overnight, room temperature) with primary antibodies diluted in 3% NCS and 1% BSA in TBST. Then, sections were washed with TBST before incubation (1 hr, room temperature) with secondary antibodies (1:1000). The sections were washed again with TBST, then mounted with ProLong Gold antiFade mountant with 4′,6-diamidino-2-phenylindole (DAPI; cat. no. P36935; Thermo Fisher Scientific) and examined using a Zeiss Axioplan 2 microscope equipped with a Zeiss LSM 510 meta confocal scanner head (Zeiss; Jena, Germany).
Nissl Staining
Vibratome sections were mounted onto SuperFrost Plus slides (Thermo Fisher Scientific), air-dried, and incubated (3 min) in Walter’s cresyl violet solution on a heating plate. Excess staining solution was removed, the stain was differentiated in tap water (3 min), and the sections were dehydrated in graded ethanol, cleared in xylene, and mounted with Permount (Electron Microscopy Sciences; Hatfield, PA).
Results
Expression Profiles of EAAT1–3 in Mice
TaqMan real-time PCR was used to estimate the relative mRNA expression levels of EAAT1–3 in mouse liver, kidney, and intestine. EAAT1 mRNA was expressed at very low levels in all the three organ systems compared with the brain, the cerebellum in particular (Fig. 1A). The levels of EAAT2 mRNA in the liver were about 10% of those in the forebrain (Fig. 1B), while the levels of EAAT3 in the ileum and kidney were higher than those in the brain (Fig. 1C). Thus, there was a high degree of selectivity: EAAT1 was not significantly expressed in liver, kidney, or intestine, while EAAT2 was present in the liver, but not in the kidney or intestine, and EAAT3 was present in the kidney and intestine, but not in the liver.
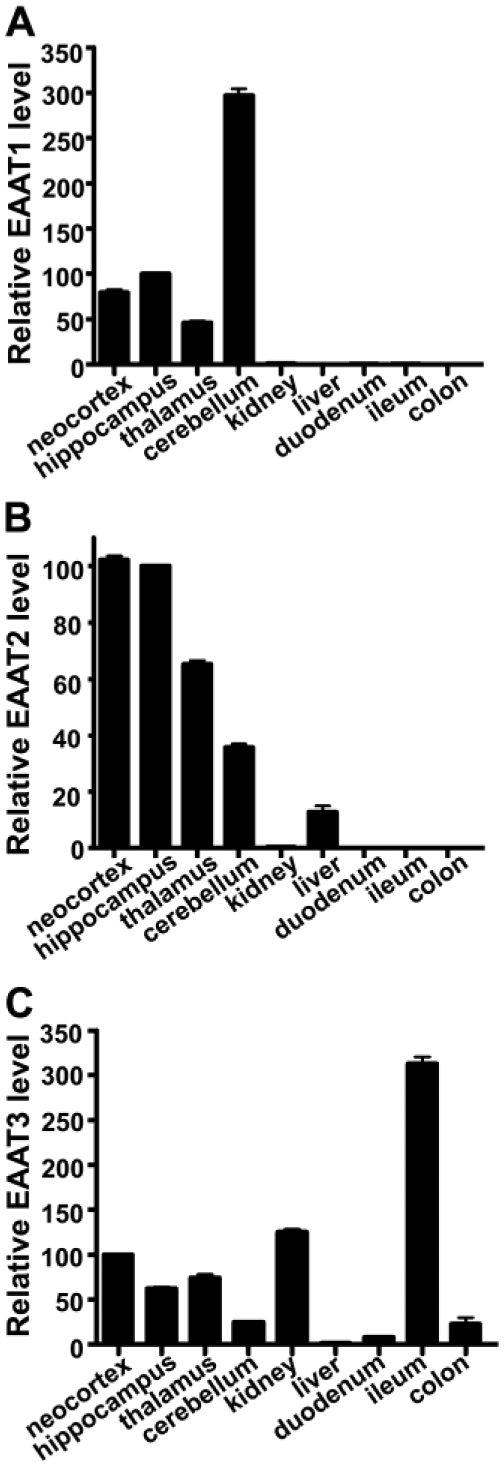
mRNA expression profiles of 3 high-affinity glutamate transporters (EAAT1–3) in brain, liver, kidney, and intestine. The mRNA levels in mouse tissues (12 weeks of age) were measured using TaqMan probes and expressed relative to the levels in neocortex. Abbreviation: EAAT, excitatory amino acid transporter.
Localization of EAAT3 Protein in the Intestine
As the above real-time PCR indicated high levels of EAAT3 in the intestine, we examined the intestine by immunoblotting. The EAAT3 labeling intensities increased from barely noticeable in the initial segments to a strong signal toward the end of the small intestine (Fig. 2). No labeling was detected in the cecum, but there was some labeling in the large intestine, which also increased toward the more distal part. Tissue from EAAT3 knockout mice (littermates) was processed in parallel and showed no labeling, attesting to the specificity of the antibodies. Two different size bands were seen in both kidney and intestine. We do not know the reason for this, but expect differences are due to protein glycosylation considering that the amino acid sequence of mouse EAAT3 is 89.9% identical to that of human EAAT3 with a protein molecular mass of about 56 kDa.56,57 It has two putative N-glycosylation sites, 44 and treatment with endoglycosidase led to a shift in electrophoretic mobility toward the predicted size of the protein moiety after treatment of endoglycosidase. 58
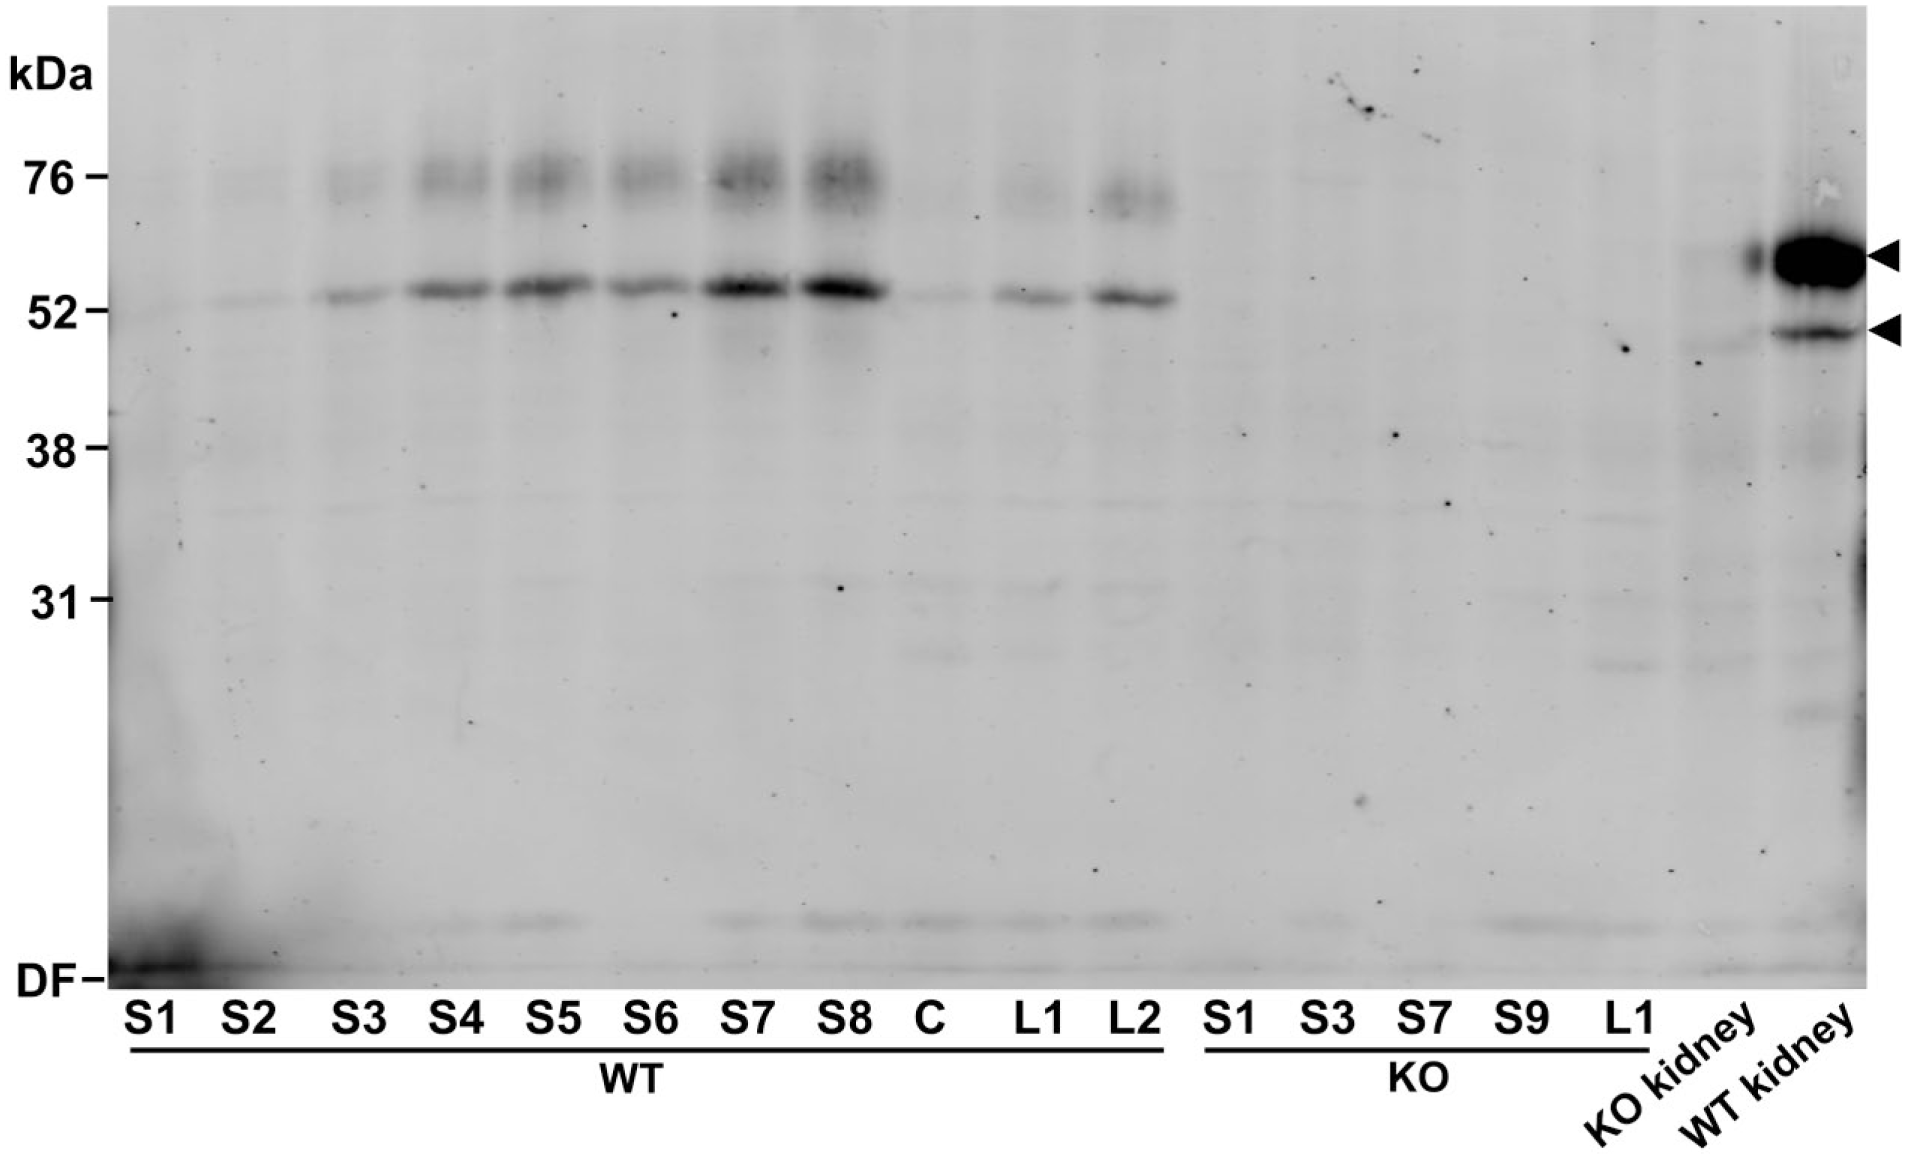
Immunoblot showed EAAT3 protein expression along the intestine. The intestines from WT and EAAT3 KO mice were cut into segments. S1–S9 represent different segments of small intestine while L1–L2 represent large intestine segments. S1 was about 2 cm (including most of duodenum), and the remaining segments (S2–S9 and L1–L2) were about 3–4 cm each. The total amount of loaded protein was 10 μg per lane. The blot was developed with C-terminal EAAT3 antibodies (Ab#340; 1.0 μg/ml). Tissue from WT and EAAT3 KO mice were from littermates processed in parallel. No EAAT3 signal was detected in EAAT3 KO samples of intestine and kidney. Abbreviations: C, cecum; EAAT, excitatory amino acid transporter; WT, wild-type; KO, knockout; DF, dye front.
We also examined tissue sections (labeled with antibodies to EAAT3 and to β-tubulin) by confocal microscopy (Fig. 3). In agreement with the immunoblots, there was hardly any immunofluorescence labeling of EAAT3 in initial segments of the small intestine (duodenum and jejunum; Fig. 3A and C), but intense EAAT3 immunoreactivity in the ileum along the apical (brush border) membrane (Fig. 3E). Higher magnification confirmed that EAAT3 was localized at the brush border membrane of enterocytes facing lumen (Fig. 3I). Moreover, weak labeling was also found in the cytoplasm of enterocytes in the colon (Fig. 3K), possibly representing a pool of EAAT3 protein that can be mobilized when needed. Weak EAAT3 labeling of enteric neurons was observed in both wild-type (Fig. 3G) and knockout (Fig. 3H), indicating weak cross-reactivity of the anti-EAAT3 antibody with some neuronal protein that was not EAAT3.
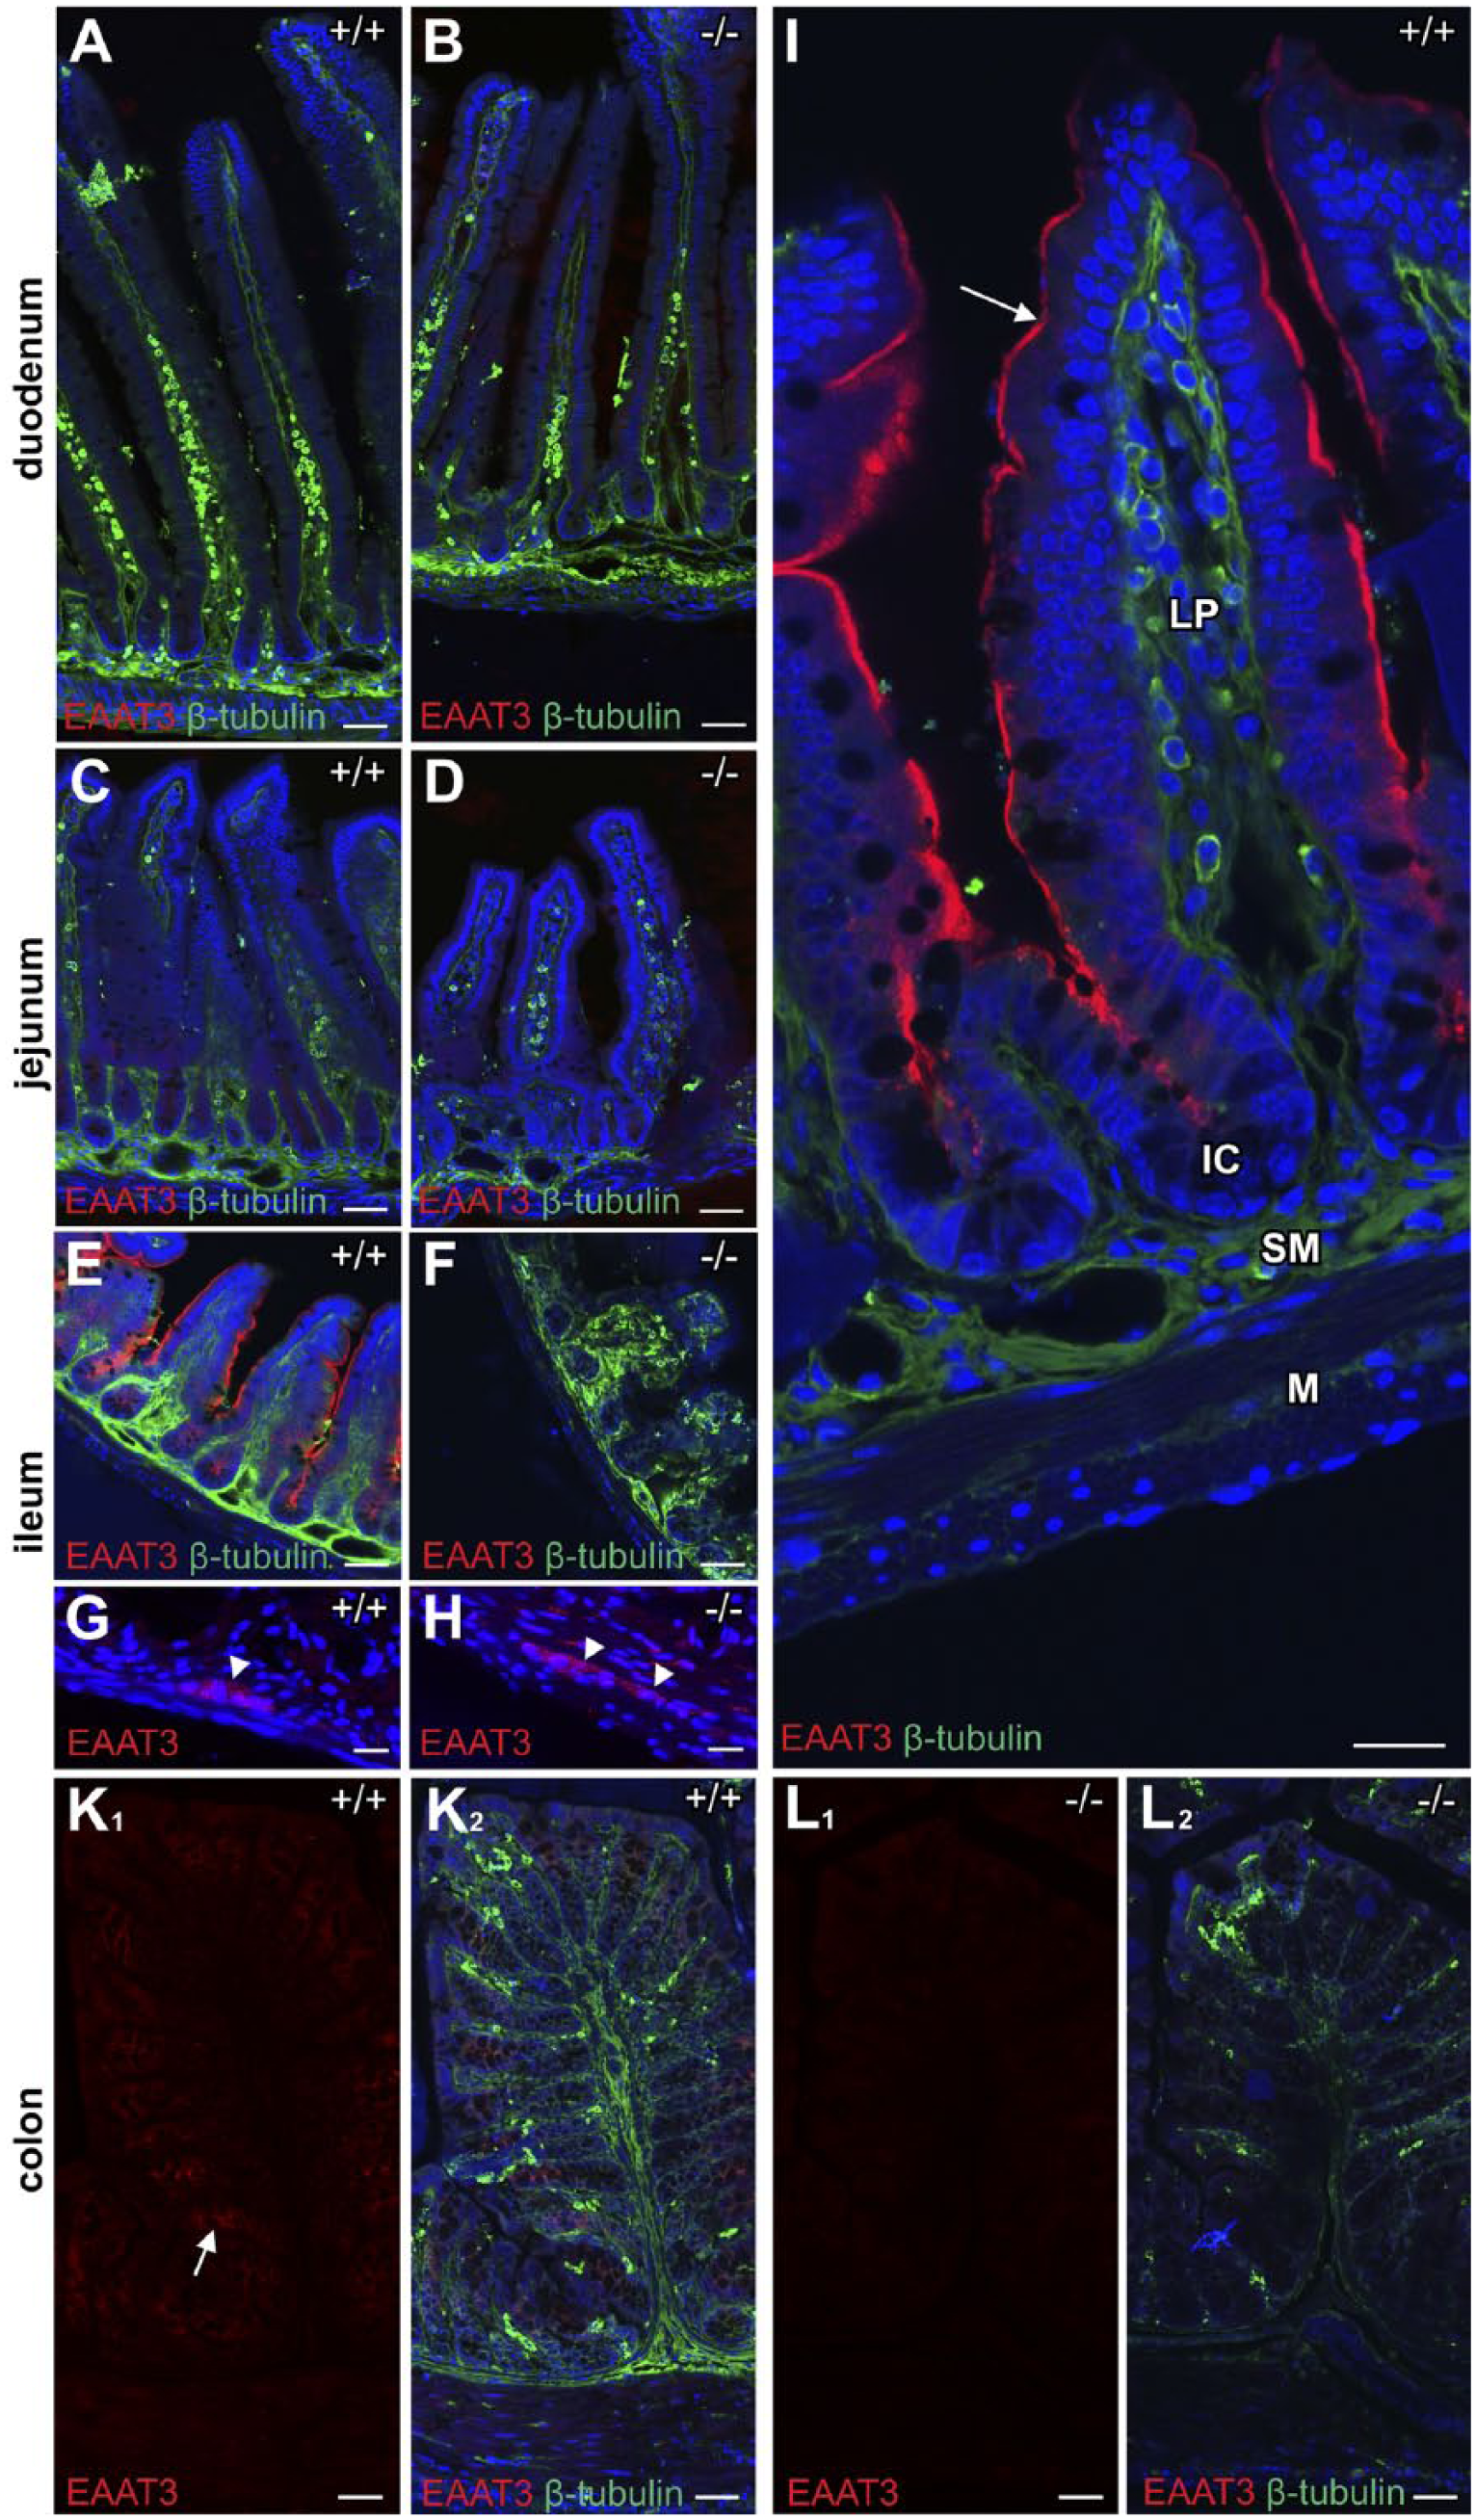
EAAT3 localization in the murine small and large intestine. Panel A–F: The sections from different small intestinal segments of EAAT3 wildtype (+/+) and knockout (–/–) mice were double-labeled with rabbit anti-EAAT3 antibody (Ab#371; red, 1μg/ml) and monoclonal anti-β-tubulin (green, 1:500) before mounting in DAPI-containing medium to visualize the nuclei (blue). Little or no labeling was found in duodenum (A) and jejunum (C) while intense labeling was seen in ileum (E). Immunoreactivity (arrowheads) was detected in enteric neurons, but this was weak and seen both in tissue from wild-type (G) and EAAT3 knockout (H) mice. Higher magnification image showing EAAT3 localized at the brush border membrane of the enteric epithelium (I; arrow). There was some EAAC1 in the mouse colon (K and L), but the labeling was considerably weaker than in the ileum and appeared to be mostly intracellular (indicated by arrow). Knockout tissues (B, D, F, H, and L) were developed in parallel as specificity controls. Scale bars = 50 μm in A–F and KL; 20 μm in G–I. Abbreviations: EAAT, excitatory amino acid transporter; DAPI, 4′,6-diamidino-2-phenylindole; LP, lamina propria; IC, intestinal crypt; SM, submucosa; M, tunica muscularis.
Localization of EAAT1–3 in the Kidney
Because high levels of EAAT3 mRNA (Fig. 1C) and protein (Fig. 2) were detected in the kidney, we labeled kidney sections from wild-type and EAAT3 knockout mice with two EAAT3 antibodies in combination with markers for different parts of the nephron. The EAAT3 labeling was confined to the renal cortex (Fig. 4A), and co-localized with markers for proximal tubules (Fig. 4B). EAAT3 was not detected in other nephron segments. Specifically, it was neither detected in collecting ducts (Fig. 4C) nor in the thick ascending limb of Henle’s loop (Fig. 4E). Higher magnification images further showed that EAAT3 was localized at the brush border membrane of proximal tubules in the renal cortex (Fig. 4G). Neither EAAT1 nor EAAT2 was detected in the kidney or in the urothelium covering the renal pelvis.
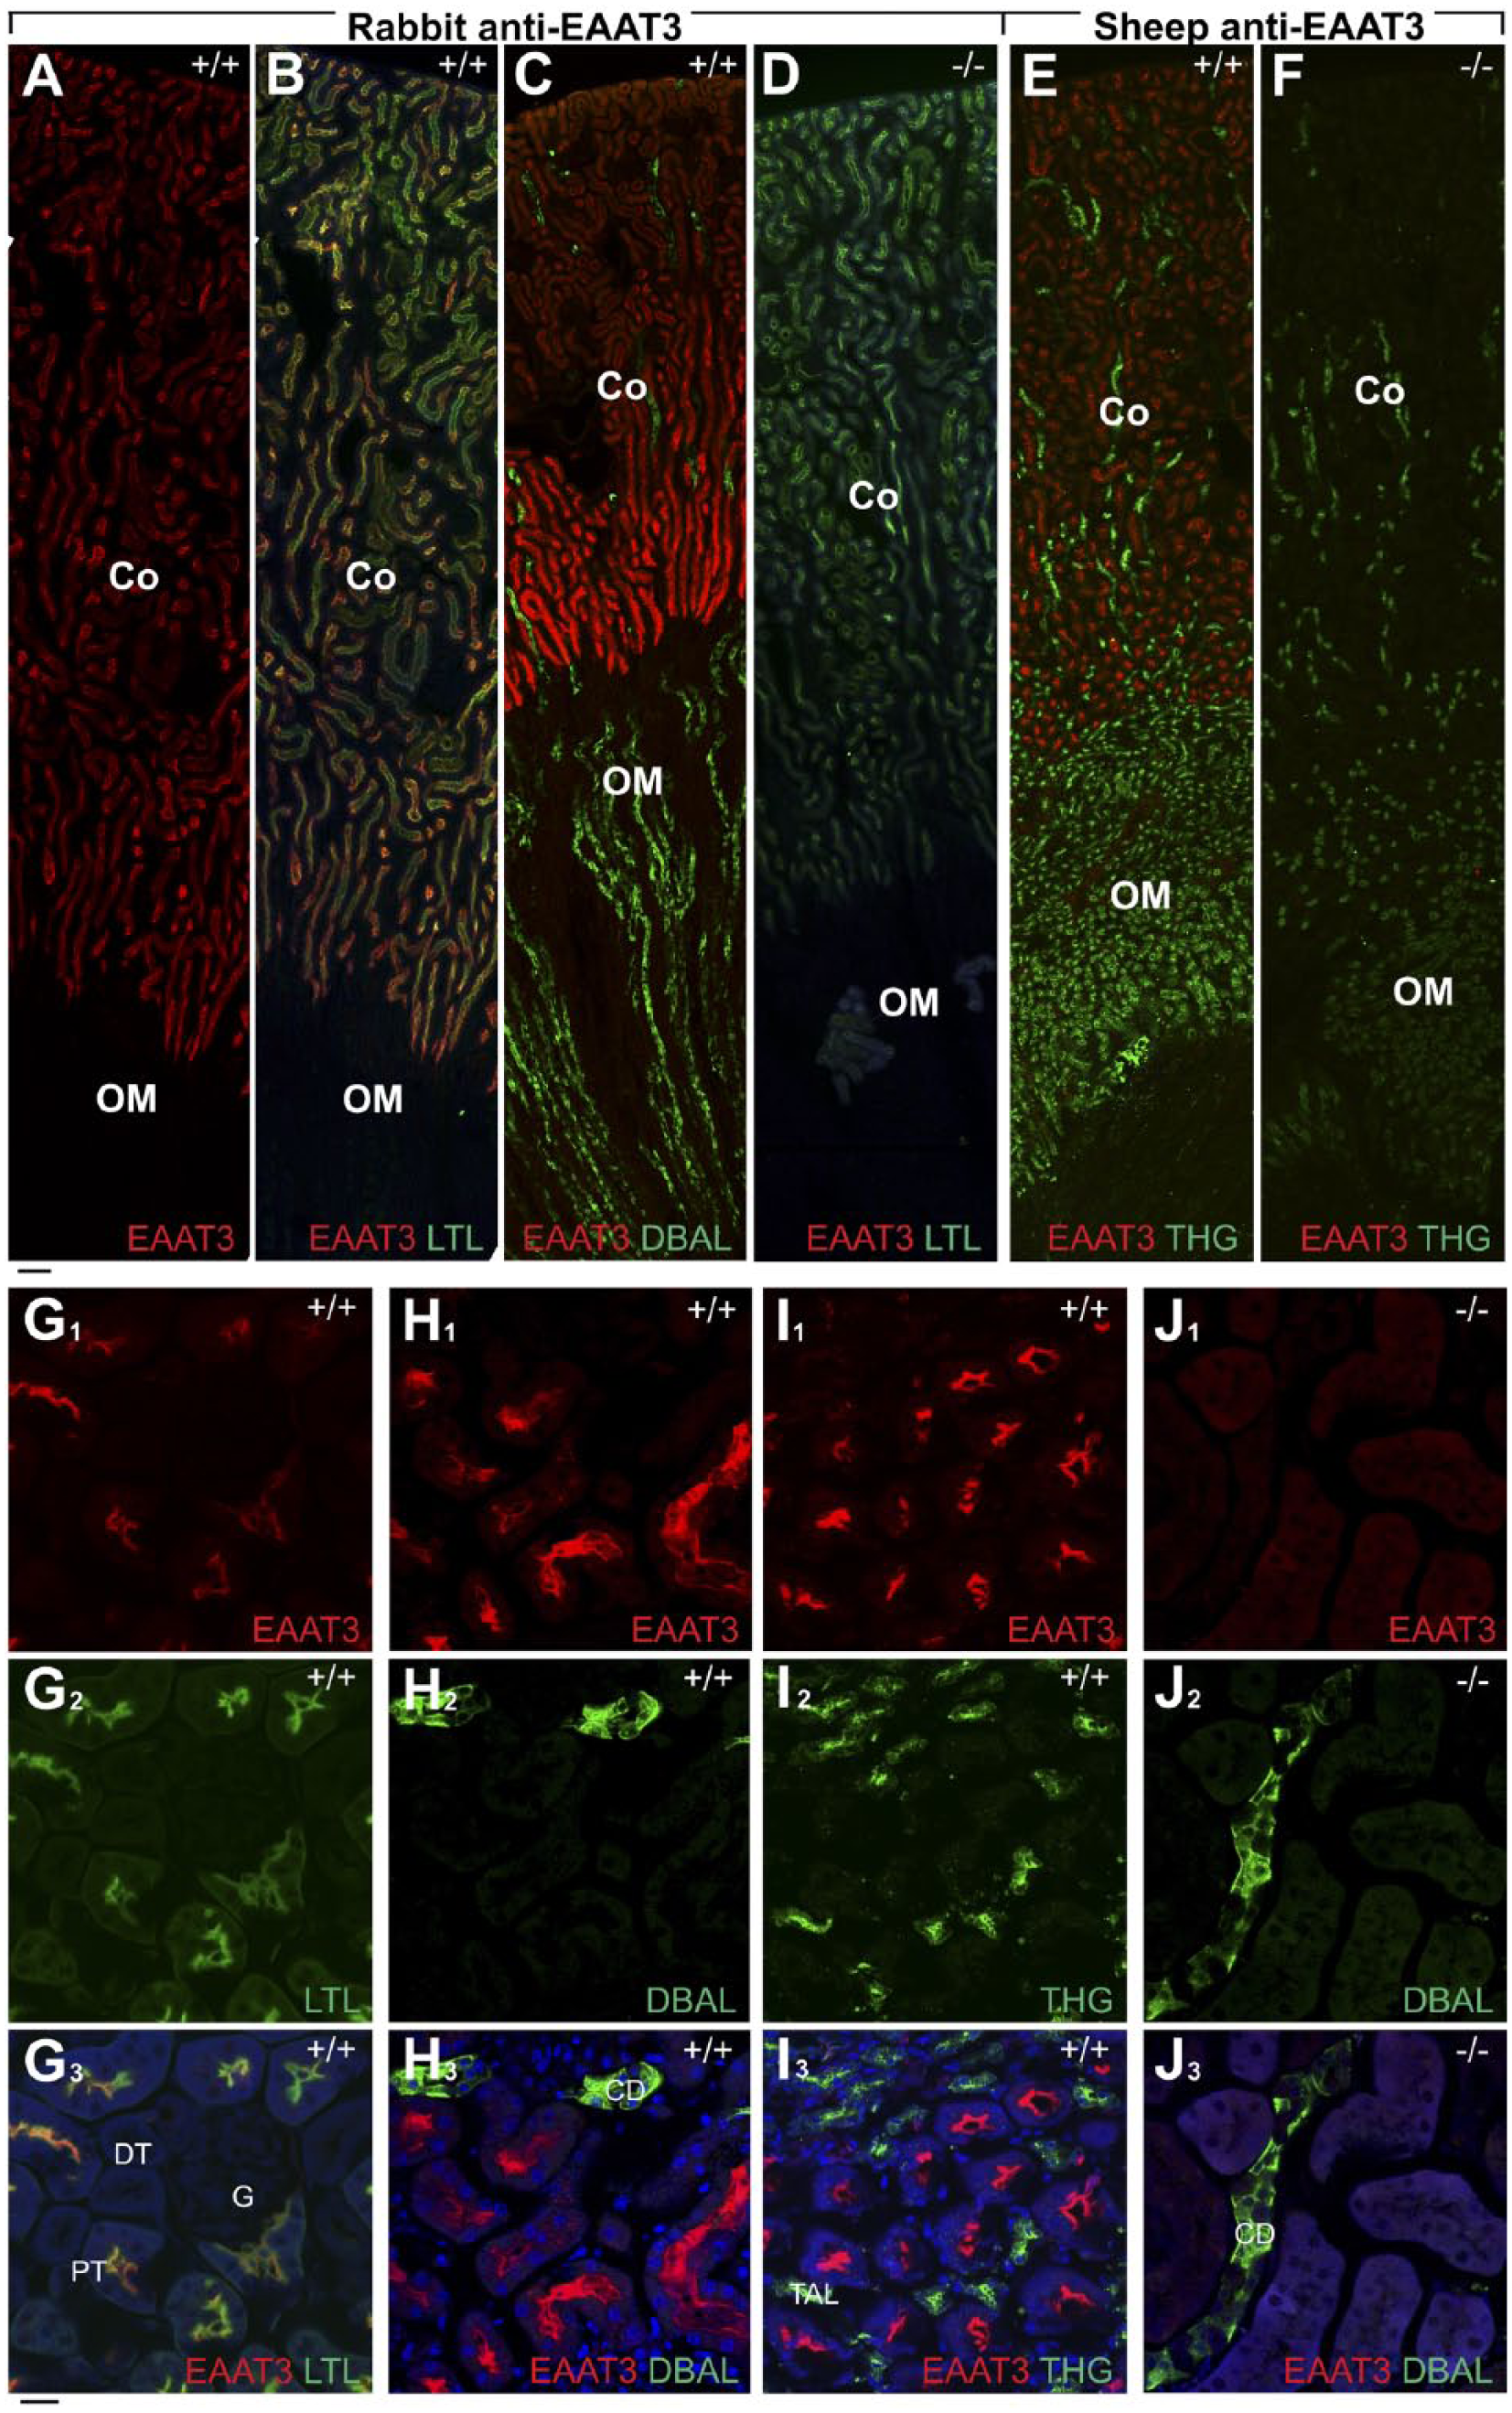
EAAT3 was detected in the brush boarder of proximal tubules in mouse kidneys. Panel A–B: The section was labeled with rabbit anti-EAAC1 antibody (Ab#371; red, 1μg/ml) and fluorescein-conjugated LTL (green, 1:150, a marker for proximal tubules). The EAAT3 knockout (–/–) kidney was used as a control for antibody specificity (D and F). Panel C: EAAT3 is not present in collecting ducts. The section was double-labeled with anti-EAAT3 antibody Ab#371 (red, 3μg/ml) and fluorescein-conjugated DBAL (green, 1:150, a marker for collecting ducts). Panel E: EAAT3 is not expressed in thick ascending limb of Henle’s loop. The section was double-labeled with sheep anti-EAAT3 antibody (Ab#340; red, 3μg/ml) and fluorescein-conjugated THG (green, 1:500, a marker for thick ascending limb of Henle’s loop). Panel G–J: Higher magnification images showing that EAAT3 was localized at the brush border membrane of proximal tubule in the renal cortex. Scale bar = 100 μm in A–F, 20 μm in G–J. Abbreviations: EAAT, excitatory amino acid transporter; LTL, Lotus Tetragonolobus lectin; DBAL, Dolichos Biflorus Agglutinin Lectin; THG, Tamm Horsfall glycoprotein; Co, cortex; OM, outer medulla; G, glomerulus; DT, distal tubule; PT, proximal tubule; CD, collecting duct; TAL, thick ascending limb of Henle’s loop.
EAAT2 Protein Is Expressed at the Plasma Membrane of Pericentral Hepatocytes
Consistent with the mRNA data (Fig. 1B), we found that the EAAT2 protein was expressed in mouse liver. This labeling was confined to a 1- to 3-cell layer of hepatocytes surrounding the central vein (Fig. 5A and C). Furthermore, antibodies to the extreme C-termini revealed that both the EAAT2a (Fig. 5E) and the EAAT2b (Fig. 5G) splice variants were present in perivenous hepatocytes. The Ab#355 to a-variant gave a stronger signal than the Ab#357 antibodies to the b-variant. The images were acquired at the same camera/microscope settings to be comparable.
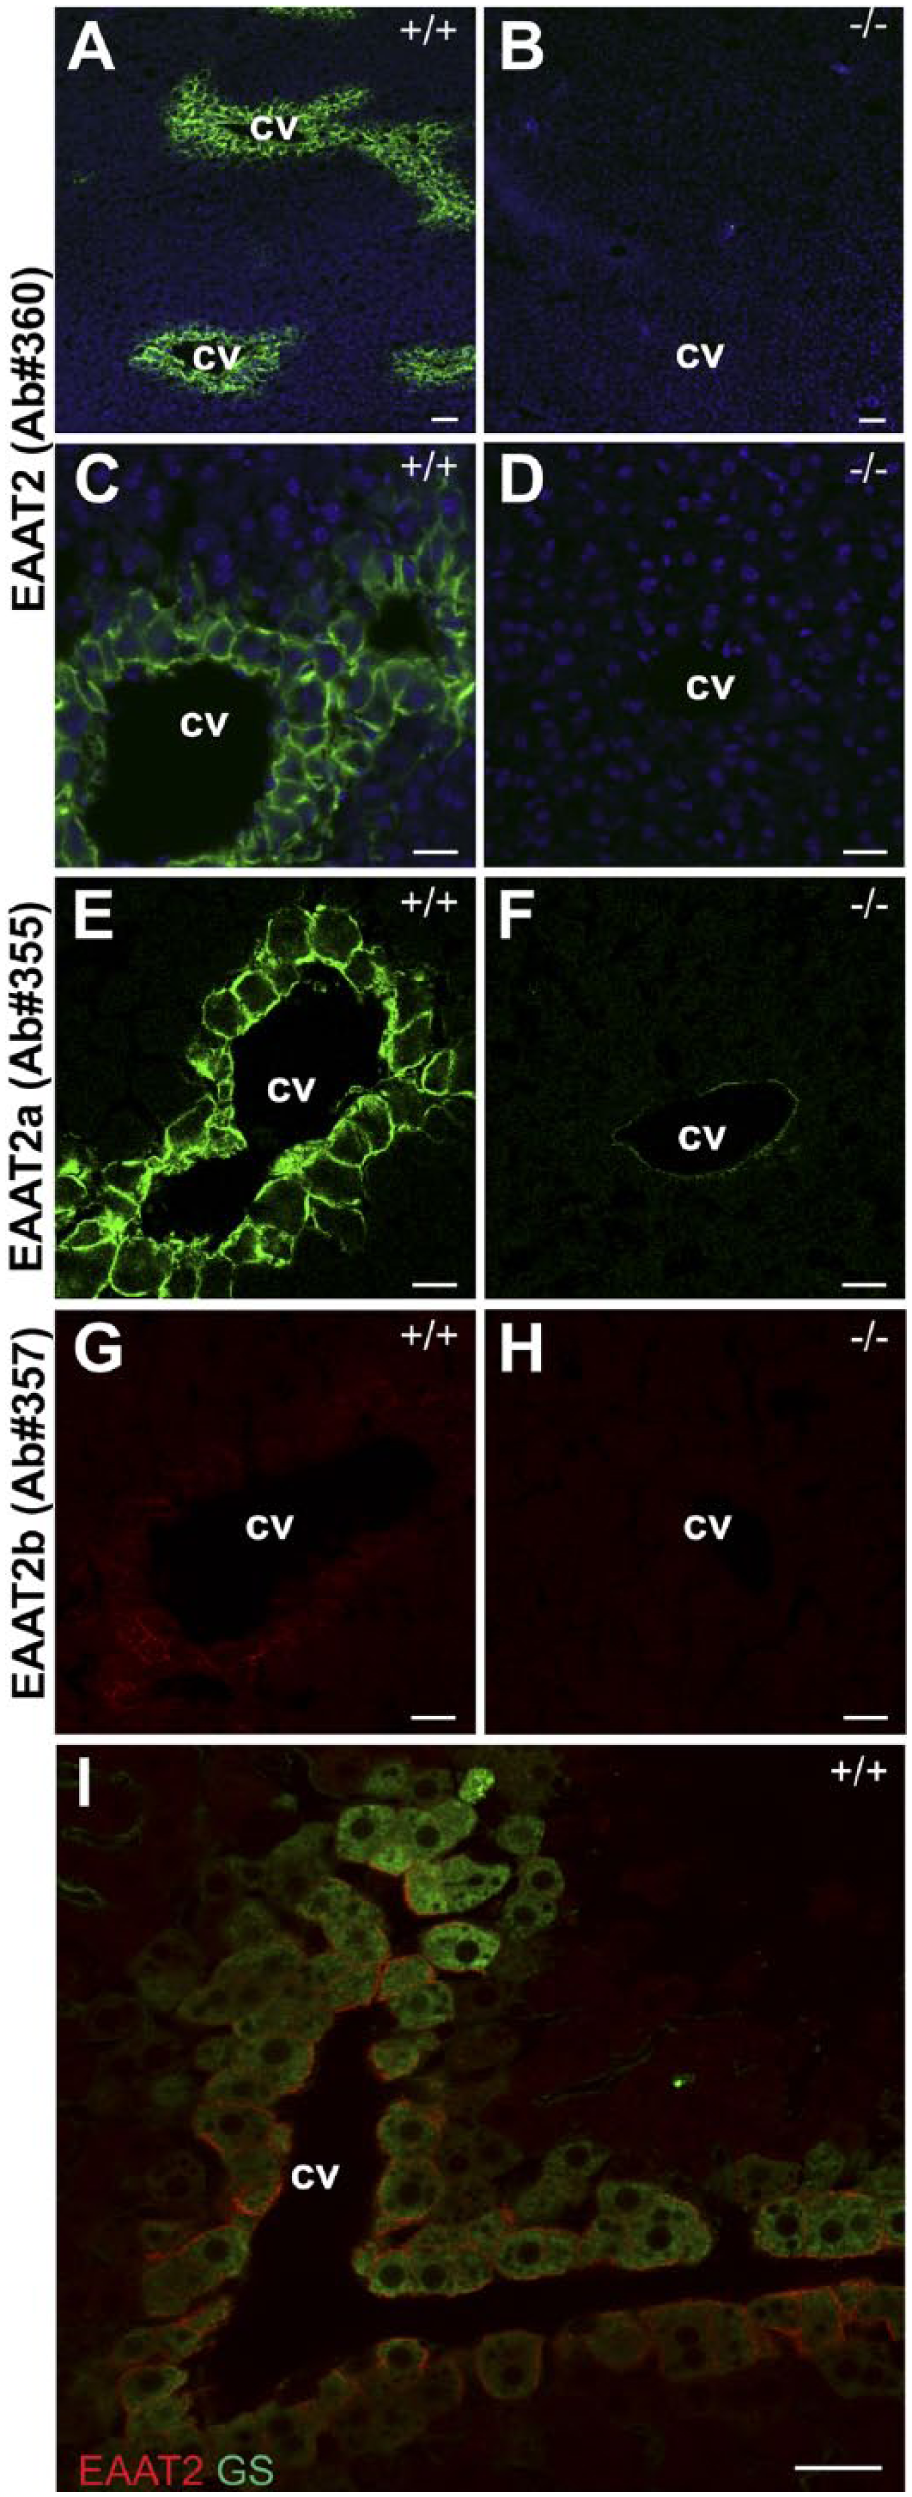
EAAT2 is expressed at the plasma membrane of pericentral hepatocytes. Panels A–I: Labeling of liver sections from wild-type (+/+) and liver-specific EAAT2 knockout (–/–) mice (as indicated) using antibodies to the N-terminal residues 12–26 (Panels A–D, green; Ab#360, 0.03 µg/ml) and DAPI mounting media (blue). Note that two isoforms EAAT2a (E and F, green; Ab#355; 0.03 µg/ml) and EAAT2b (G and H, red; Ab#357, 0.5 µg/ml) are both present in the cell membrane of hepatocytes surrounding cv in the wild-type. Panel I: These hepatocytes labeled by EAAT2 (red; Ab#360, 0.1 µg/ml) are also positive for glutamine synthetase (green, 1:1000). Scale bars = 100 µm in A and B, 40 µm in C–I. Abbreviations: EAAT, excitatory amino acid transporter; GS, glutamine synthetase; DAPI, 4′,6-diamidino-2-phenylindole; cv, central veins.
Double-labeling with antibodies against glutamine synthetase suggested that EAAT2 was localized in the plasma membrane of glutamine-synthetase-positive hepatocytes (Fig. 5I). By immunoblotting, we compared the EAAT2 protein levels of the liver with that of the brain, and concluded that the concentration of EAAT2 in the brain is about 300 times higher than that in the liver (Fig. 6E).
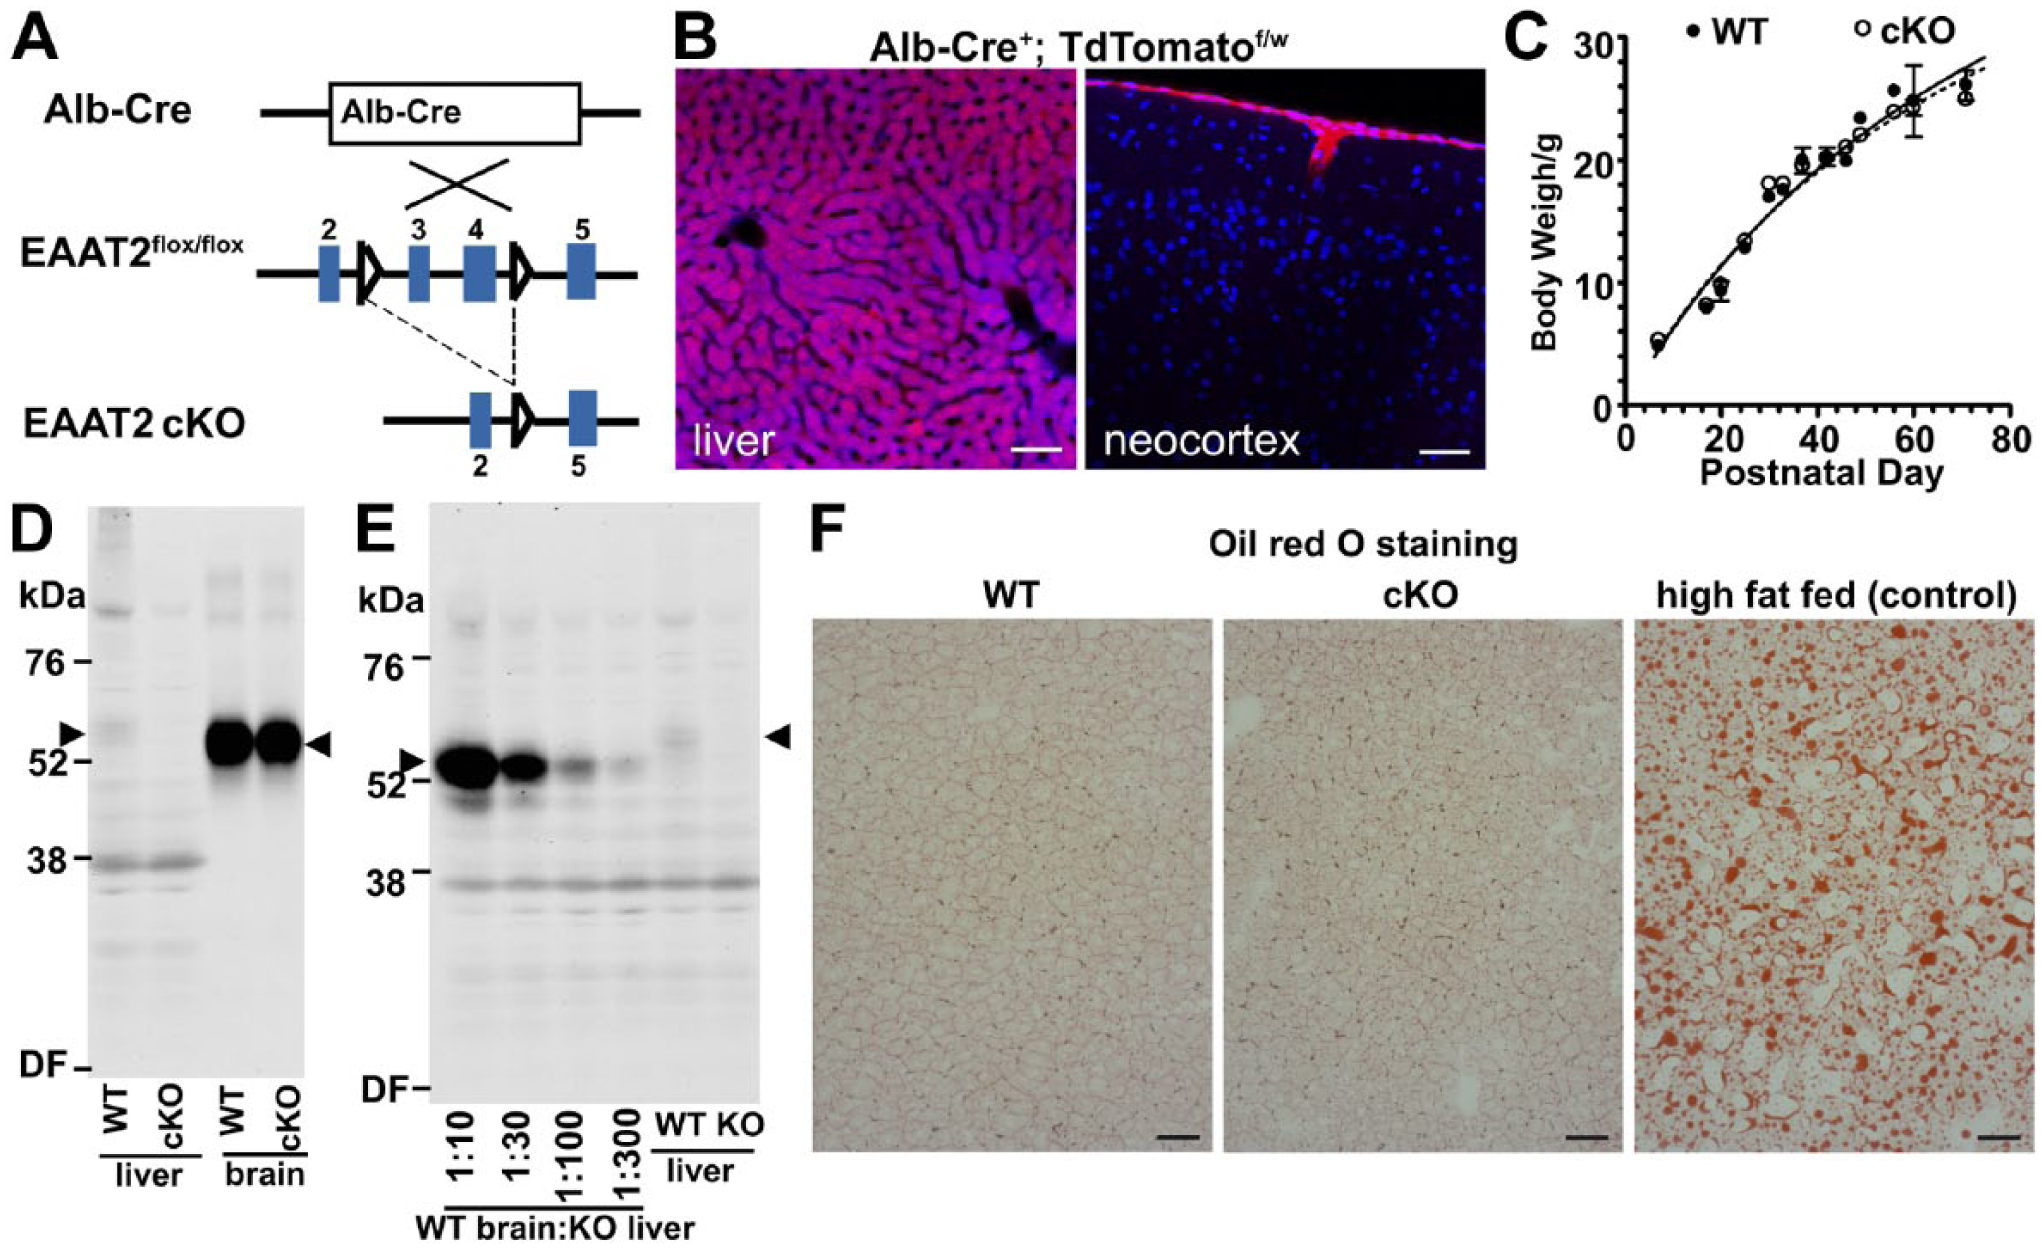
Characterization of EAAT2 liver-specific KO mice. Panel A: Schematic illustration of the generation of EAAT2 liver-specific cKO. Panel B: Characterization of Cre-expression under the albumin promoter. To visualize the Cre-expression, Alb-Cre mice was crossed with Ai14 reporter. Hepatocytes in the liver and leptomeninges in the brain turned to be red. The images were acquired from a 45-day-old mouse. Panel C: Mice lacking EAAT2 in the liver have similar body weight as their WT littermates. Panel D: Immunoblot showing the absence of EAAT2 protein in the liver of the cKO (Ab#360, 0.1 µg/ml). Total protein loaded from liver and brain was 60 and 3 µg, respectively. Panel E: Immunoblot suggesting that liver EAAT2 protein was about 300 times lower than that of brain (Ab#360, 0.1 µg/ml). Total protein loaded was 60 µg. Panel F: The liver EAAT2 KOs (70 days old) had normal hepatic lipid accumulation. The liver collected from high-fat fed mice was used as a control for the Oil red O staining. Scale bars = 50 μm in A–B, 100 μm in C–F. Abbreviations: EAAT, excitatory amino acid transporter; cKO, conditional knockout; WT, wild-type; DF, dye frontva; KO, knockout.
Deletion of EAAT2 in the Mouse Liver Seemed to Be Without Much Consequence
To investigate the physiological role of EAAT2 in the liver, we crossed EAAT2-flox mice 43 with Alb-Cre driver to generate liver-specific knockouts (Fig. 6A). To validate the specificity of Cre-expression, we also crossed Alb-Cre with Ai14 reporter, and confirmed that the Cre-expression was highly selective for the liver although not completely specific as Cre was also expressed in the leptomeninges (but not in the brain tissue itself; Fig. 6B). Cre-expression in the leptomeninges is unlikely to matter in our case because EAAT2 is not expressed in the leptomeninges. 46 Immunoblot (Fig. 6D) confirmed the success in making EAAT2 liver-specific knockouts, as EAAT2 protein was both absent from the liver from the Alb-Cre X Flox-EAAT2 conditional knockouts and still present in the brain. In contrast with the CNS-specific EAAT2 knockouts that had reduced body weights and early postnatal lethality, 43 mice lacking liver EAAT2 did not show any increased mortality and had similar body weights to their wild-type littermates (Fig. 6C). No neurodegeneration was observed by Nissl staining in EAAT2 liver-specific knockouts (data not shown). Moreover, as deletion of the glutamine synthetase in mouse hepatocytes has been reported to cause mild fat accumulation in the liver, 59 we tested by Oil red O staining if deletion of EAAT2 in the liver would have a similar effect. However, young adult liver EAAT2 knockouts had normal liver morphology, and there was no evidence for increased fat content (Fig. 6F). Furthermore, deletion of EAAT2 did not appear to influence glutamine synthetase expression (average ±SEM: 100 ± 11%, n=3, p=0.36).
Discussion
Validated information on protein localization is important because interpretation of results obtained by other methods (e.g., electrophysiological and pharmacological observations) depends on information on where ion channels, receptors, enzymes, or transporters are located.45,51,60 Rigorous testing of the specificity of antibody binding in tissue sections, however, is difficult without genetically modified animals as controls. 51 In the present study, we provide the first immunohistochemical data on glutamate transporter distributions in the kidney, liver, and intestine that have been validated by processing tissue from wild-type mice and knockout mice in parallel. We have previously studied pancreas 43 and the heart. 61 Results from the present and the previous studies underscore the importance of using knockout animals as controls to avoid misinterpretation of results because of antibody cross-reactivity (see also 45 ).
Intestinal Glutamate Transporters
Glutamate transport activities were shown to be present in the intestine decades ago,16,17,62 and as EAAT3 was originally identified by expression cloning from the rabbit small intestine, 28 it has been clear that EAAT3 is an intestinal transporter. In the present study, we confirm studies35,36 showing the presence of high levels of EAAT3 mRNA and protein in the intestine, predominantly in the ileum and distal colon. As shown here and by others,36,63 the EAAT3 protein is highly concentrated in the brush border of enterocytes where it is ideally located for nutrient absorption.
We could not confirm reports33,64 of EAAT3 expression in cells belonging to the enteric nervous system. The sparse labeling observed in these cells was very weak and appeared with similar intensities in the knockout mice, suggesting that it was due to a non-EAAT3 cross-reacting molecular structure.
Intestinal cell lines have been shown to express EAAT1 and EAAT2 in addition to EAAT3. 65 Iwanaga and coworkers 36 noted labeling in tissue sections with antibodies to both EAAT1 and EAAT2, but could not detect the mRNA, and as they did not have access to knockout mice, they were unable to resolve the conundrum. They concluded, however, that EAAT3 is the predominant transporter. We have not made systematic attempts to localize EAAT1 and EAAT2 because of the very low mRNA levels. This means that we do not have data allowing us to rule out a widespread low-level expression or high expression in small subpopulations of cells in the intestine. However, in this context, it is worth recalling that glutamate transporters are fairly slow transporters requiring tens of milliseconds to complete a single transport cycle (for quantitative considerations, see3,45). This implies that a huge number of transporters are required to absorb the amino acids released by digestion of a normal meal. Consequently, only high-level expression is physiologically relevant for intestinal absorption of common amino acids such as glutamate.
In conclusion, the data presented here support the notions that EAAT3 is the major glutamate transporter involved in absorption of glutamate and aspartate from the food, and also that the gradient of EAAT3 expression along the small intestine suggests that the distal parts of the small intestine perform most of the glutamate and aspartate uptake. This is in agreement with the prevailing view.35,63,66–70 Interestingly, EAAT3 may be upregulated when the diet is protein rich.66,67
Hepatic Glutamate Transporters
Perivenous hepatocytes have been shown to have capacity to take up glutamate from the circulation.13,14 The responsible transporter has been suggested to be EAAT2.37,39,67 We here confirm this cellular localization of EAAT2 in the liver and add that the hepatocytes express 2 C-terminal variants of EAAT2: the a-variant 26 and the b-variant. 71 Presence of the b-variant in the liver is not surprising as this is where it was first identified. 71 However, despite comparable affinities of the 2 splice variant specific antibodies, 49 the antibody to the a-variant gave by far the strongest labeling. This suggests that the a-variant is expressed at higher levels than the b-variant similar to the situation in the brain. 49
The baseline levels of glutamate in plasma are about 50 µM, 72 and may rise 7–8 times after a meal.73,74 This rise occurs even though most of the enteric glutamate is used as an important oxidative substrate for the intestinal mucosal cells,70,75 and indicates that glutamate transporters in peripheral organs are unable to control the glutamate levels in the portal blood. In this context, it is worth noting that hepatocyte EAAT2 may be upregulated, at least in growing lambs 67 and during liver cholestasis in both rats and humans. 39 However, intravenous injections of labeled glutamate showed that the three major sequestrating organs are skeletal muscle, liver, and gut. 76 To our knowledge, the exact glutamate transporter subtypes expressed in skeletal muscle have not been unequivocally identified. We investigated heart muscle and found both EAAT1 and EAAT3, but not EAAT2. 61
The co-expression of EAAT2 and glutamine synthetase in perivenous hepatocytes raises the question of whether the blood-borne glutamate can contribute to ammonia detoxification by being a substrate for glutamine synthesis. There is no doubt that glutamine synthetase is important, but glutamine synthetase is expressed in many organs including skeletal muscle 77 and deletion of hepatic glutamine synthetase alone results only in mild hyperammonemia. 59 The question here is what role hepatic EAAT2 plays as the expression of glutamine synthetase is reported to be orders of magnitude higher than that of EAAT2, 78 and the transport catalyzed by EAAT2 is slow. 79 This suggests that EAAT2 will be unable to provide glutamate fast enough to make use of the capacity of glutamine synthetase. Furthermore, it is also apparent that these cells can produce endogenous glutamate. For instance, glutamate can be synthesized from the oxidation of ornithine by ornithine aminotransferase. 80 Also glutamate is formed from α-ketoglutarate that originates from the tricarboxylic acid cycle and which receives its amino group through transamination from other amino acids being catabolized. 81 Based on this, it seems legitimate to conclude that the glutamine synthetase in hepatocytes is there to primarily satisfy other needs than amination of accumulated glutamate.
Renal Glutamate Transporters
That EAAT3 is physiologically important is evident from the observation that both mice 82 and humans 38 without functional EAAT3 transporters lose dicarboxylic amino acids in the urine. In agreement with previous studies,28,37,83 we detect high levels of both EAAT3 mRNA and protein. We confirm the notion that EAAT3 targeted to the apical (brush boarder) membranes of proximal tubules in mouse, reported by others in both the human kidney 38 and rat kidney.34,41 However, we could not confirm the reported EAAT3 immunoreactivity in the thick ascending limbs of loops of Henle and the distal tubules 34 nor in the collecting ducts. Based on isolation of mRNA, it has been proposed that EAAT3 is expressed in podocytes, 84 but as we could not detect EAAT3 protein glomeruli, we are also unable to confirm that. Thus, our data suggest that EAAT3 is selectively expressed in proximal tubules.
We further looked for EAAT1 and EAAT2 labeling. As EAAT1 labeling has been reported 37 in the macula densa of distal convoluted tubules and in the urothelium, we specifically looked for EAAT1 immunoreactivity in these places, but we did not detect any (data not shown). As the Ab#141 is the exact same EAAT1 antibody batch that Berger and Hediger 37 used, we suspect that the difference may be due to the tissue preparation. However, if EAAT1 is present in these cells, then the levels must be low, and there is as yet to our knowledge no physiological data suggesting that a few EAAT1 molecules here would be important. Thus, we decided not to pursue this question further.
Footnotes
Acknowledgements
We are grateful to the staff at the animal facility at The Norwegian Governmental Institute of Public Health for assisting with animal husbandry.
Competing Interests
The author(s) declared no potential conflicts of interest with respect to the research, authorship, and/or publication of this article.
Author Contributions
All authors have contributed to this article as follows: YZ and NCD designed the research; QXH, SO-H, SH, and YZ performed the acquisition for the work (histological staining, immunocytochemistry, immunoblots, and real-time PCR); BH quantified amino acids; QXH, NCD, and YZ wrote the manuscript. All authors approved the final manuscript.
Funding
The author(s) disclosed receipt of the following financial support for the research, authorship, and/or publication of this article: This work was supported by the Norwegian Research Council (FRIBIO grant 240844), Novo Nordisk Fonden (grant NNF14OC0010959), and the University of Oslo (Unifor, Forskerlinjen and SERTA).